Phase Angle: A Possible Biomarker to Quantify Inflammation in Subjects with Obesity and 25(OH)D Deficiency

 ,
,  ,
, 

Abstract
:
1. Introduction
2. Materials and Methods
2.1. Design and Setting
2.2. Population Study
- Hypocaloric diet in the last three months (39 subjects);
- Clinical conditions that could influence fluid balance, including liver or renal failure, cancer, and acute or chronic inflammatory diseases, based on a complete medical examination and laboratory investigations (14 subjects);
- Altered levels of serum creatinine, serum calcium, or albumin (9 subjects);
- Presence of type 2 diabetes mellitus (T2DM) (defined by criteria of the American Diabetes Association as follows: Basal plasma glucose level ≥126 mg/dL on two occasions, or glycated haemoglobin (HbA1c) ≥6.5% (≥48 mmol/moL) on two occasions, or both at the same time. Participants on antidiabetic medication, were considered to have T2DM (36 subjects);
- Uncontrolled thyroid or parathyroid disease (42 subjects);
- Current therapy with calcium, vitamin D supplementation, or osteoporosis therapies, anti-inflammatory drugs, statin, and other hypolipidemic agents (56 subjects);
- Alcohol abuse according to the Diagnostic and Statistical Manual of Mental Disorders (DSM)-V diagnostic criteria (6 subjects);
- Patients with implanted pacemakers or defibrillators because of the theoretical possibility of interference with the device activity due to the field of current induced by the impedance measurements (21 subjects);
- Underweight patients with BMI <18.5 kg/m2 (29 females and 8 males). The flow chart of study subjects is shown in Figure 1.
2.3. Power Justification
2.4. Lifestyle Habits
2.5. Anthropometric Measurements
2.6. Bioelectrical Impedance Analysis
2.7. Assay Methods
2.8. Statistical Analysis
3. Results
Correlation Analysis
4. Discussion
Supplementary Materials
Author Contributions
Funding
Acknowledgments
Conflicts of Interest
Abbreviations
| NF-κB | Nuclear Factor kappa light chain enhancer of activated B cells |
| BIA | Bioelectrical Impedance Analysis |
| PhA | Phase Angle |
| BMI | Body Mass Index |
| PTH | Parathyroid Hormone |
| T2DM | Type 2 Diabetes |
| HbA1c | Glycated Haemoglobin |
| DSM | Diagnostic and Statistical Manual of Mental Disorders |
| WHO | World Health Organization |
| kHz | Kilohertz |
| ESPEN | European Society of Parental and Enteral Nutrition |
| R | Resistance |
| Xc | Reactance |
| CVs | Coefficients of Variation |
| CLIA | Chemiluminescence Immunoassay |
| SD | Standard Deviation |
| FM | Fat Mass |
| OR | Proportional Odds Ratio |
| IC | Interval Confidence |
| ROC | Receiver Operator Characteristic |
| AUC | Area Under the Curve |
| FFM | Free Fat Mass |
| TBW | Total Body Water |
| ECW | Extra-cellular Water |
| ICW | Intra-cellular Water |
| RCTs | Randomized Controlled Trials |
| TNF-α | Tumor Necrosis Factor alfa |
| IL | Interleukin |
| CRP | C-Reactive Protein |
References
- Webb, A.R.; Holick, M.F. The role of sunlight in the cutaneous production of vitamin D3. Annu. Rev. Nutr. 1988, 8, 375–399. [Google Scholar] [CrossRef] [PubMed]
- Hollis, B.W. Circulating 25-hydroxyvitamin D levels indicative of vitamin D sufficiency: Implications for establishing a new effective dietary intake recommendation for vitamin D. J. Nutr. 2005, 135, 317–322. [Google Scholar] [CrossRef] [PubMed]
- Migliaccio, S.; di Nisio, A.; Mele, C.; Scappaticcio, L.; Savastano, S.; Colao, A. Obesity and hypovitaminosis D: Causality or casualty? Int. J. Obes. Suppl. 2019, 1. [Google Scholar] [CrossRef]
- Lotfi-Dizaji, L.; Mahboob, S.; Aliashrafi, S.; Vaghef-Mehrabany, E.; Ebrahimi-Mameghani, M.; Morovati, A. Effect of vitamin D supplementation along with weight loss diet on meta-inflammation and fat mass in obese subjects with vitamin D deficiency: A double-blind placebo-controlled randomized clinical trial. Clin. Endocrinol. 2019, 90, 94–101. [Google Scholar] [CrossRef] [PubMed]
- Pereira-Santos, M.; Costa, P.R.; Assis, A.M.; Santos, C.A.; Santos, D.B. Obesity and vitamin D deficiency: A systematic review and meta-analysis. Obes. Rev. 2015, 16, 341–349. [Google Scholar] [CrossRef] [PubMed]
- Savastano, S.; Barrea, L.; Savanelli, M.C.; Nappi, F.; Di Somma, C.; Orio, F.; Colao, A. Low vitamin D status and obesity: Role of nutritionist. Rev. Endocr. Metab. Disord. 2017, 18, 215–225. [Google Scholar] [CrossRef] [PubMed]
- Luigi Barrea, B.A.; Polese, B.; de Conno, B.; Muscogiuri, G.; Colao, A.; Savastano, S. Nutritionist and obesity: Brief overview on efficacy, safety, and drug interactions of the main weight-loss dietary supplements. Int. J. Obes. Suppl. 2019, 1. [Google Scholar] [CrossRef]
- Muscogiuri, G. Vitamin D: Past, present and future perspectives in the prevention of chronic diseases. Eur. J. Clin. Nutr. 2018, 72, 1221–1225. [Google Scholar] [CrossRef]
- Barouki, R.; Gluckman, P.D.; Grandjean, P.; Hanson, M.; Heindel, J.J. Developmental origins of non-communicable disease: Implications for research and public health. Environ. Health 2012, 11, 42. [Google Scholar] [CrossRef]
- Muscogiuri, G.; Barrea, L.; Altieri, B.; Di Somma, C.; Bhattoa, H.; Laudisio, D.; Duval, G.T.; Pugliese, G.; Annweiler, C.; Orio, F.; et al. Calcium and vitamin D supplementation. Myths and realities with regard to cardiovascular risk. Curr. Vasc. Pharmacol. 2019. [Google Scholar] [CrossRef]
- Muscogiuri, G.; Barrea, L.; Scannapieco, M.; Di Somma, C.; Scacchi, M.; Aimaretti, G.; Savastano, S.; Colao, A.; Marzullo, P. The lullaby of the sun: The role of vitamin D in sleep disturbance. Sleep Med. 2019, 54, 262–265. [Google Scholar] [CrossRef]
- Muscogiuri, G.; Barrea, L.; Annunziata, G.; Di Somma, C.; Laudisio, D.; Colao, A.; Savastano, S. Obesity and sleep disturbance: The chicken or the egg? Crit. Rev. Food Sci. Nutr. 2018, 59, 1–8. [Google Scholar] [CrossRef]
- Di Somma, C.; Scarano, E.; Barrea, L.; Zhukouskaya, V.V.; Savastano, S.; Mele, C.; Scacchi, M.; Aimaretti, G.; Colao, A.; Marzullo, P. Vitamin D and Neurological Diseases: An Endocrine View. Int. J. Mol. Sci. 2017, 18. [Google Scholar] [CrossRef]
- Fletcher, J.; Cooper, S.C.; Ghosh, S.; Hewison, M. The Role of Vitamin D in Inflammatory Bowel Disease: Mechanism to Management. Nutrients 2019, 11. [Google Scholar] [CrossRef]
- Barrea, L.; Nappi, F.; Di Somma, C.; Savanelli, M.C.; Falco, A.; Balato, A.; Balato, N.; Savastano, S. Environmental Risk Factors in Psoriasis: The Point of View of the Nutritionist. Int. J. Environ. Res. Public Health 2016, 13. [Google Scholar] [CrossRef]
- Barrea, L.; Savanelli, M.C.; Di Somma, C.; Napolitano, M.; Megna, M.; Colao, A.; Savastano, S. Vitamin D and its role in psoriasis: An overview of the dermatologist and nutritionist. Rev. Endocr. Metab. Disord. 2017, 18, 195–205. [Google Scholar] [CrossRef] [Green Version]
- McCormick, B.; Stone, I.; Corporate Analytical, T. Economic costs of obesity and the case for government intervention. Obes. Rev. 2007, 8 (Suppl. 1), 161–164. [Google Scholar] [CrossRef]
- Gregor, M.F.; Hotamisligil, G.S. Inflammatory mechanisms in obesity. Annu. Rev. Immunol. 2011, 29, 415–445. [Google Scholar] [CrossRef]
- Li, C.; Xu, M.M.; Wang, K.; Adler, A.J.; Vella, A.T.; Zhou, B. Macrophage polarization and meta-inflammation. Transl. Res. 2018, 191, 29–44. [Google Scholar] [CrossRef]
- Xu, H. Obesity and metabolic inflammation. Drug Discov. Today Dis. Mech. 2013, 10. [Google Scholar] [CrossRef]
- Wallach, D.; Kang, T.B.; Kovalenko, A. Concepts of tissue injury and cell death in inflammation: A historical perspective. Nat. Rev. Immunol. 2014, 14, 51–59. [Google Scholar] [CrossRef]
- Abbas, M.A. Physiological functions of Vitamin D in adipose tissue. J. Steroid Biochem. Mol. Biol. 2017, 165, 369–381. [Google Scholar] [CrossRef]
- Barrea, L.; Savastano, S.; Di Somma, C.; Savanelli, M.C.; Nappi, F.; Albanese, L.; Orio, F.; Colao, A. Low serum vitamin D-status, air pollution and obesity: A dangerous liaison. Rev. Endocr. Metab. Disord. 2017, 18, 207–214. [Google Scholar] [CrossRef]
- Sun, J.; Kong, J.; Duan, Y.; Szeto, F.L.; Liao, A.; Madara, J.L.; Li, Y.C. Increased NF-kappaB activity in fibroblasts lacking the vitamin D receptor. Am. J. Physiol. Endocrinol. Metab. 2006, 291, E315–E322. [Google Scholar] [CrossRef]
- Barbosa-Silva, M.C.; Barros, A.J. Bioelectrical impedance analysis in clinical practice: A new perspective on its use beyond body composition equations. Curr. Opin. Clin. Nutr. Metab. Care 2005, 8, 311–317. [Google Scholar] [CrossRef]
- Norman, K.; Stobaus, N.; Pirlich, M.; Bosy-Westphal, A. Bioelectrical phase angle and impedance vector analysis—Clinical relevance and applicability of impedance parameters. Clin. Nutr. 2012, 31, 854–861. [Google Scholar] [CrossRef]
- Stobaus, N.; Pirlich, M.; Valentini, L.; Schulzke, J.D.; Norman, K. Determinants of bioelectrical phase angle in disease. Br. J. Nutr. 2012, 107, 1217–1220. [Google Scholar] [CrossRef]
- Norman, K.; Stobaus, N.; Zocher, D.; Bosy-Westphal, A.; Szramek, A.; Scheufele, R.; Smoliner, C.; Pirlich, M. Cutoff percentiles of bioelectrical phase angle predict functionality, quality of life, and mortality in patients with cancer. Am. J. Clin. Nutr. 2010, 92, 612–619. [Google Scholar] [CrossRef] [Green Version]
- De Luis, D.A.; Aller, R.; Romero, E.; Duenas, A.; Perez Castrillon, J.L. Relation of phase angle tertiles with blood adipocytokines levels, insulin resistance and cardiovascular risk factors in obese women patients. Eur. Rev. Med. Pharmacol. Sci. 2010, 14, 521–526. [Google Scholar]
- Raskind, S.M. Suicide by burning: Emotional needs of the suicidal adolescent on the burn unit. Issues Compr. Pediatr. Nurs. 1986, 9, 369–382. [Google Scholar]
- Gonzalez, M.C.; Barbosa-Silva, T.G.; Bielemann, R.M.; Gallagher, D.; Heymsfield, S.B. Phase angle and its determinants in healthy subjects: Influence of body composition. Am. J. Clin. Nutr. 2016, 103, 712–716. [Google Scholar] [CrossRef]
- Kyle, U.G.; Bosaeus, I.; De Lorenzo, A.D.; Deurenberg, P.; Elia, M.; Manuel Gomez, J.; Lilienthal Heitmann, B.; Kent-Smith, L.; Melchior, J.C.; Pirlich, M.; et al. Bioelectrical impedance analysis-part II: Utilization in clinical practice. Clin. Nutr. 2004, 23, 1430–1453. [Google Scholar] [CrossRef]
- Lukaski, H.C.; Kyle, U.G.; Kondrup, J. Assessment of adult malnutrition and prognosis with bioelectrical impedance analysis: Phase angle and impedance ratio. Curr. Opin. Clin. Nutr. Metab. Care 2017, 20, 330–339. [Google Scholar] [CrossRef]
- Barrea, L.; Tarantino, G.; Somma, C.D.; Muscogiuri, G.; Macchia, P.E.; Falco, A.; Colao, A.; Savastano, S. Adherence to the Mediterranean Diet and Circulating Levels of Sirtuin 4 in Obese Patients: A Novel Association. Oxid. Med. Cell Longev. 2017, 2017, 6101254. [Google Scholar] [CrossRef]
- Barrea, L.; Muscogiuri, G.; Annunziata, G.; Laudisio, D.; de Alteriis, G.; Tenore, G.C.; Colao, A.; Savastano, S. A New Light on Vitamin D in Obesity: A Novel Association with Trimethylamine-N-Oxide (TMAO). Nutrients 2019, 11. [Google Scholar] [CrossRef]
- Barrea, L.; Annunziata, G.; Muscogiuri, G.; Laudisio, D.; Di Somma, C.; Maisto, M.; Tenore, G.C.; Colao, A.; Savastano, S. Trimethylamine N-oxide, Mediterranean diet, and nutrition in healthy, normal-weight adults: Also a matter of sex? Nutrition 2019, 62, 7–17. [Google Scholar] [CrossRef]
- Barrea, L.; Annunziata, G.; Muscogiuri, G.; Di Somma, C.; Laudisio, D.; Maisto, M.; de Alteriis, G.; Tenore, G.C.; Colao, A.; Savastano, S. Trimethylamine-N-oxide (TMAO) as Novel Potential Biomarker of Early Predictors of Metabolic Syndrome. Nutrients 2018, 10. [Google Scholar] [CrossRef]
- Barrea, L.; Muscogiuri, G.; Di Somma, C.; Tramontano, G.; De Luca, V.; Illario, M.; Colao, A.; Savastano, S. Association between Mediterranean diet and hand grip strength in older adult women. Clin. Nutr. 2019, 38, 721–729. [Google Scholar] [CrossRef]
- Barrea, L.; Muscogiuri, G.; Di Somma, C.; Annunziata, G.; Megna, M.; Falco, A.; Balato, A.; Colao, A.; Savastano, S. Coffee consumption, metabolic syndrome and clinical severity of psoriasis: Good or bad stuff? Arch. Toxicol. 2018, 92, 1831–1845. [Google Scholar] [CrossRef]
- Savanelli, M.C.; Barrea, L.; Macchia, P.E.; Savastano, S.; Falco, A.; Renzullo, A.; Scarano, E.; Nettore, I.C.; Colao, A.; Di Somma, C. Preliminary results demonstrating the impact of Mediterranean diet on bone health. J. Transl. Med. 2017, 15, 81. [Google Scholar] [CrossRef]
- Barrea, L.; Di Somma, C.; Macchia, P.E.; Falco, A.; Savanelli, M.C.; Orio, F.; Colao, A.; Savastano, S. Influence of nutrition on somatotropic axis: Milk consumption in adult individuals with moderate-severe obesity. Clin. Nutr. 2017, 36, 293–301. [Google Scholar] [CrossRef]
- Waist Circumference and Waist-Hip Ratio Report of a WHO Expert Consultation GENEVA, 8–11 DECEMBER 2008. Available online: http://apps.who.int/iris/bitstream/10665/44583/1/9789241501491_eng.pdf (accessed on 31 May 2019).
- Yanovski, S.Z.; Hubbard, V.S.; Heymsfield, S.B.; Lukaski, H.C. Bioelectrical impedance analysis in body composition measurement: National Institutes of Health Technology Assessment Conference Statement. Am. J. Clin. Nutr. 1996, 64, 524S–532S. [Google Scholar] [CrossRef]
- Barrea, L.; Fabbrocini, G.; Annunziata, G.; Muscogiuri, G.; Donnarumma, M.; Marasca, C.; Colao, A.; Savastano, S. Role of Nutrition and Adherence to the Mediterranean Diet in the Multidisciplinary Approach of Hidradenitis Suppurativa: Evaluation of Nutritional Status and Its Association with Severity of Disease. Nutrients 2018, 11. [Google Scholar] [CrossRef]
- Barrea, L.; Altieri, B.; Muscogiuri, G.; Laudisio, D.; Annunziata, G.; Colao, A.; Faggiano, A.; Savastano, S. Impact of Nutritional Status on Gastroenteropancreatic Neuroendocrine Tumors (GEP-NET) Aggressiveness. Nutrients 2018, 10. [Google Scholar] [CrossRef]
- Barrea, L.; Macchia, P.E.; Di Somma, C.; Napolitano, M.; Balato, A.; Falco, A.; Savanelli, M.C.; Balato, N.; Colao, A.; Savastano, S. Bioelectrical phase angle and psoriasis: A novel association with psoriasis severity, quality of life and metabolic syndrome. J. Transl. Med. 2016, 14, 130. [Google Scholar] [CrossRef]
- Barrea, L.; Muscogiuri, G.; Macchia, P.E.; Di Somma, C.; Falco, A.; Savanelli, M.C.; Colao, A.; Savastano, S. Mediterranean Diet and Phase Angle in a Sample of Adult Population: Results of a Pilot Study. Nutrients 2017, 9. [Google Scholar] [CrossRef]
- Kushner, R.F. Bioelectrical impedance analysis: A review of principles and applications. J. Am. Coll. Nutr. 1992, 11, 199–209. [Google Scholar]
- Savanelli, M.C.; Scarano, E.; Muscogiuri, G.; Barrea, L.; Vuolo, L.; Rubino, M.; Savastano, S.; Colao, A.; Di Somma, C. Cardiovascular risk in adult hypopituitaric patients with growth hormone deficiency: Is there a role for vitamin D? Endocrine 2016, 52, 111–119. [Google Scholar] [CrossRef]
- Holick, M.F.; Binkley, N.C.; Bischoff-Ferrari, H.A.; Gordon, C.M.; Hanley, D.A.; Heaney, R.P.; Murad, M.H.; Weaver, C.M.; Endocrine, S. Evaluation, treatment, and prevention of vitamin D deficiency: An Endocrine Society clinical practice guideline. J. Clin. Endocrinol. Metab. 2011, 96, 1911–1930. [Google Scholar] [CrossRef]
- Karlsson, T.; Andersson, L.; Hussain, A.; Bosaeus, M.; Jansson, N.; Osmancevic, A.; Hulthen, L.; Holmang, A.; Larsson, I. Lower vitamin D status in obese compared with normal-weight women despite higher vitamin D intake in early pregnancy. Clin. Nutr. 2015, 34, 892–898. [Google Scholar] [CrossRef]
- Bellone, S.; Esposito, S.; Giglione, E.; Genoni, G.; Fiorito, C.; Petri, A.; Bona, G.; Prodam, F. Vitamin D levels in a paediatric population of normal weight and obese subjects. J. Endocrinol. Invest. 2014, 37, 805–809. [Google Scholar] [CrossRef]
- Golzarand, M.; Hollis, B.W.; Mirmiran, P.; Wagner, C.L.; Shab-Bidar, S. Vitamin D supplementation and body fat mass: A systematic review and meta-analysis. Eur. J. Clin. Nutr. 2018, 72, 1345–1357. [Google Scholar] [CrossRef]
- Ding, C.; Gao, D.; Wilding, J.; Trayhurn, P.; Bing, C. Vitamin D signaling in adipose tissue. Br. J. Nutr. 2012, 108, 1915–1923. [Google Scholar] [CrossRef]
- Petersen, K.S.; Smith, C. Ageing-Associated Oxidative Stress and Inflammation Are Alleviated by Products from Grapes. Oxid. Med. Cell Longev. 2016, 2016, 6236309. [Google Scholar] [CrossRef]
- Cooke, A.A.; Connaughton, R.M.; Lyons, C.L.; McMorrow, A.M.; Roche, H.M. Fatty acids and chronic low grade inflammation associated with obesity and the metabolic syndrome. Eur. J. Pharmacol. 2016, 785, 207–214. [Google Scholar] [CrossRef]
- Li, B.; Baylink, D.J.; Deb, C.; Zannetti, C.; Rajaallah, F.; Xing, W.; Walter, M.H.; Lau, K.H.; Qin, X. 1,25-Dihydroxyvitamin D3 suppresses TLR8 expression and TLR8-mediated inflammatory responses in monocytes in vitro and experimental autoimmune encephalomyelitis in vivo. PLoS ONE 2013, 8, e58808. [Google Scholar] [CrossRef]
- Amer, M.; Qayyum, R. Relation between serum 25-hydroxyvitamin D and C-reactive protein in asymptomatic adults (from the continuous National Health and Nutrition Examination Survey 2001 to 2006). Am. J. Cardiol. 2012, 109, 226–230. [Google Scholar] [CrossRef]
- Genton, L.; Herrmann, F.R.; Sporri, A.; Graf, C.E. Association of mortality and phase angle measured by different bioelectrical impedance analysis (BIA) devices. Clin. Nutr. 2018, 37, 1066–1069. [Google Scholar] [CrossRef]
- Kyle, U.G.; Earthman, C.P.; Pichard, C.; Coss-Bu, J.A. Body composition during growth in children: Limitations and perspectives of bioelectrical impedance analysis. Eur. J. Clin. Nutr. 2015, 69, 1298–1305. [Google Scholar] [CrossRef]
- Grundmann, O.; Yoon, S.L.; Williams, J.J. The value of bioelectrical impedance analysis and phase angle in the evaluation of malnutrition and quality of life in cancer patients—A comprehensive review. Eur. J. Clin. Nutr. 2015, 69, 1290–1297. [Google Scholar] [CrossRef]
- Garlini, L.M.; Alves, F.D.; Ceretta, L.B.; Perry, I.S.; Souza, G.C.; Clausell, N.O. Phase angle and mortality: A systematic review. Eur. J. Clin. Nutr. 2019, 73, 495–508. [Google Scholar] [CrossRef]
- Selberg, O.; Selberg, D. Norms and correlates of bioimpedance phase angle in healthy human subjects, hospitalized patients, and patients with liver cirrhosis. Eur. J. Appl. Physiol. 2002, 86, 509–516. [Google Scholar] [CrossRef] [Green Version]
- Gupta, D.; Lis, C.G.; Dahlk, S.L.; Vashi, P.G.; Grutsch, J.F.; Lammersfeld, C.A. Bioelectrical impedance phase angle as a prognostic indicator in advanced pancreatic cancer. Br. J. Nutr. 2004, 92, 957–962. [Google Scholar] [CrossRef] [Green Version]
- Tomeleri, C.M.; Cavaglieri, C.R.; de Souza, M.F.; Cavalcante, E.F.; Antunes, M.; Nabbuco, H.C.G.; Venturini, D.; Barbosa, D.S.; Silva, A.M.; Cyrino, E.S. Phase angle is related with inflammatory and oxidative stress biomarkers in older women. Exp. Gerontol. 2018, 102, 12–18. [Google Scholar] [CrossRef]
- Carvalho, V.A.; Ferreira do Prado Moreira, P.; Perigo Nascimento, N.A.; Bertolini, A.A.; Aragao, L.; Cendoroglo, M.S. The influence of 25-hydroxyvitamin D and High-Density Lipoprotein Cholesterol on BIA Resistance results and aging on BIA Reactance results in elderly people. Clin. Nutr. ESPEN 2018, 27, 92–95. [Google Scholar] [CrossRef]
- Karefylakis, C.; Sarnblad, S.; Ariander, A.; Ehlersson, G.; Rask, E.; Rask, P. Effect of Vitamin D supplementation on body composition and cardiorespiratory fitness in overweight men—A randomized controlled trial. Endocrine 2018, 61, 388–397. [Google Scholar] [CrossRef]
- Kyle, U.G.; Soundar, E.P.; Genton, L.; Pichard, C. Can phase angle determined by bioelectrical impedance analysis assess nutritional risk? A comparison between healthy and hospitalized subjects. Clin. Nutr. 2012, 31, 875–881. [Google Scholar] [CrossRef]


| Parameters | Mean ± SD or Number (%) n = 455 |
|---|---|
| Gender | |
| Males | 219 (48.1%) |
| Females | 236 (51.9%) |
| Smoking | |
| Yes | 146 (32.0%) |
| No | 310 (68.0%) |
| Physical Activity | |
| Yes | 118 (25.9%) |
| No | 338 (74.1%) |
| Age (years) | 37 ± 11 |
| Weight (kg) | 97± 25 |
| Height (m) | 1.69 ± 0.09 |
| BMI (kg/m2) | 34 ± 8 |
| Normal weight | 79, 17.4% |
| Over weight | 89, 19.6% |
| Grade I obesity | 86, 18.9% |
| Grade II obesity | 91, 20.0% |
| Grade III obesity | 110, 24.2% |
| 25(OH)D levels (ng/mL) | 17 ± 7.5 |
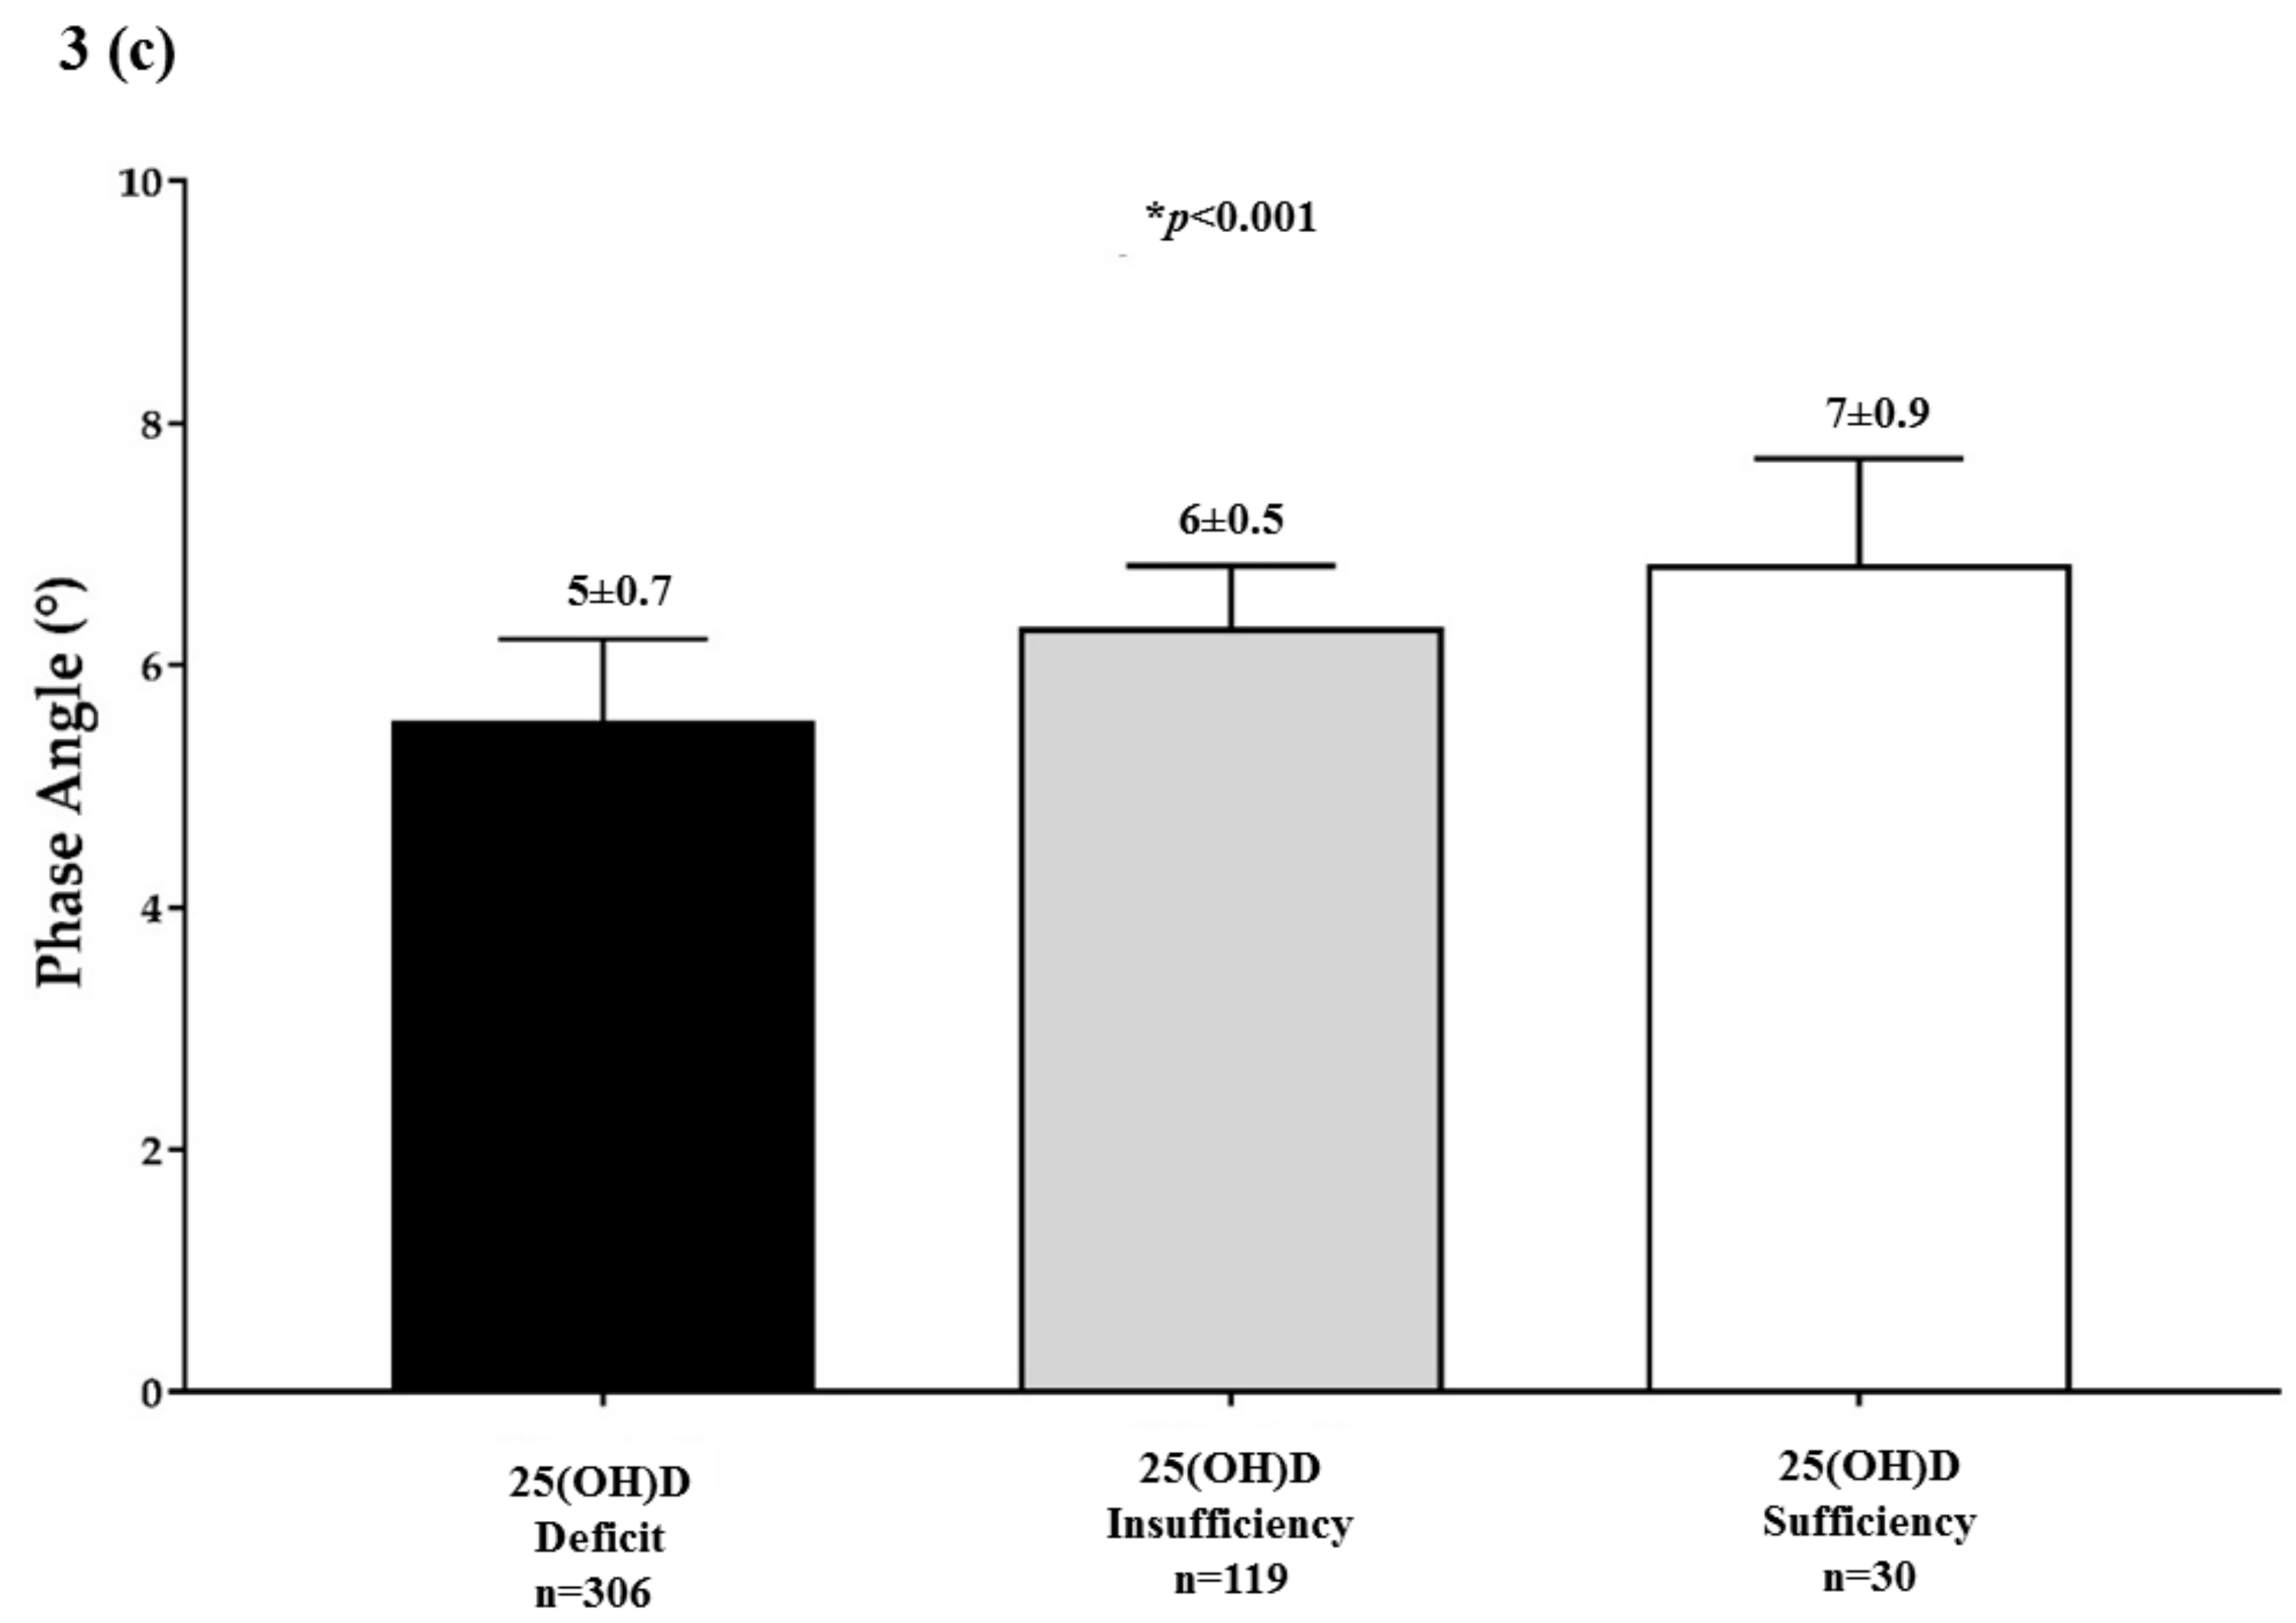
| Deficiency | 306, 67.3% |
| Insufficiency | 119, 26.2% |
| Normal | 30, 6.6% |
| Parameters | Mean ± SD n = 455 |
|---|---|
| R (Ω) | 475.6 ± 89.5 |
| Xc (Ω) | 48.1 ± 9.9 |
| PhA (°) | 5.8 ± 0.8 |
| FM (kg) | 36.6 ± 21.8 |
| FM (%) | 34.8 ± 14.4 |
| FFM (kg) | 60.9 ± 10.5 |
| FFM (%) | 65.2 ± 14.4 |
| TBW (Lt) | 45.3 ± 8.2 |
| ECW (Lt) | 21.2 ± 4.0 |
| ICW (Lt) | 24.1 ± 5.0 |
| Parameters | 25(OH)D Levels (ng/mL) | |
|---|---|---|
| r | p-Value | |
| Age (years) | −0.08 | 0.08 |
| BMI (kg/m2) | −0.61 | <0.001 ** |
| R (Ω) | −0.18 | <0.001 ** |
| Xc (Ω) | 0.34 | <0.001 ** |
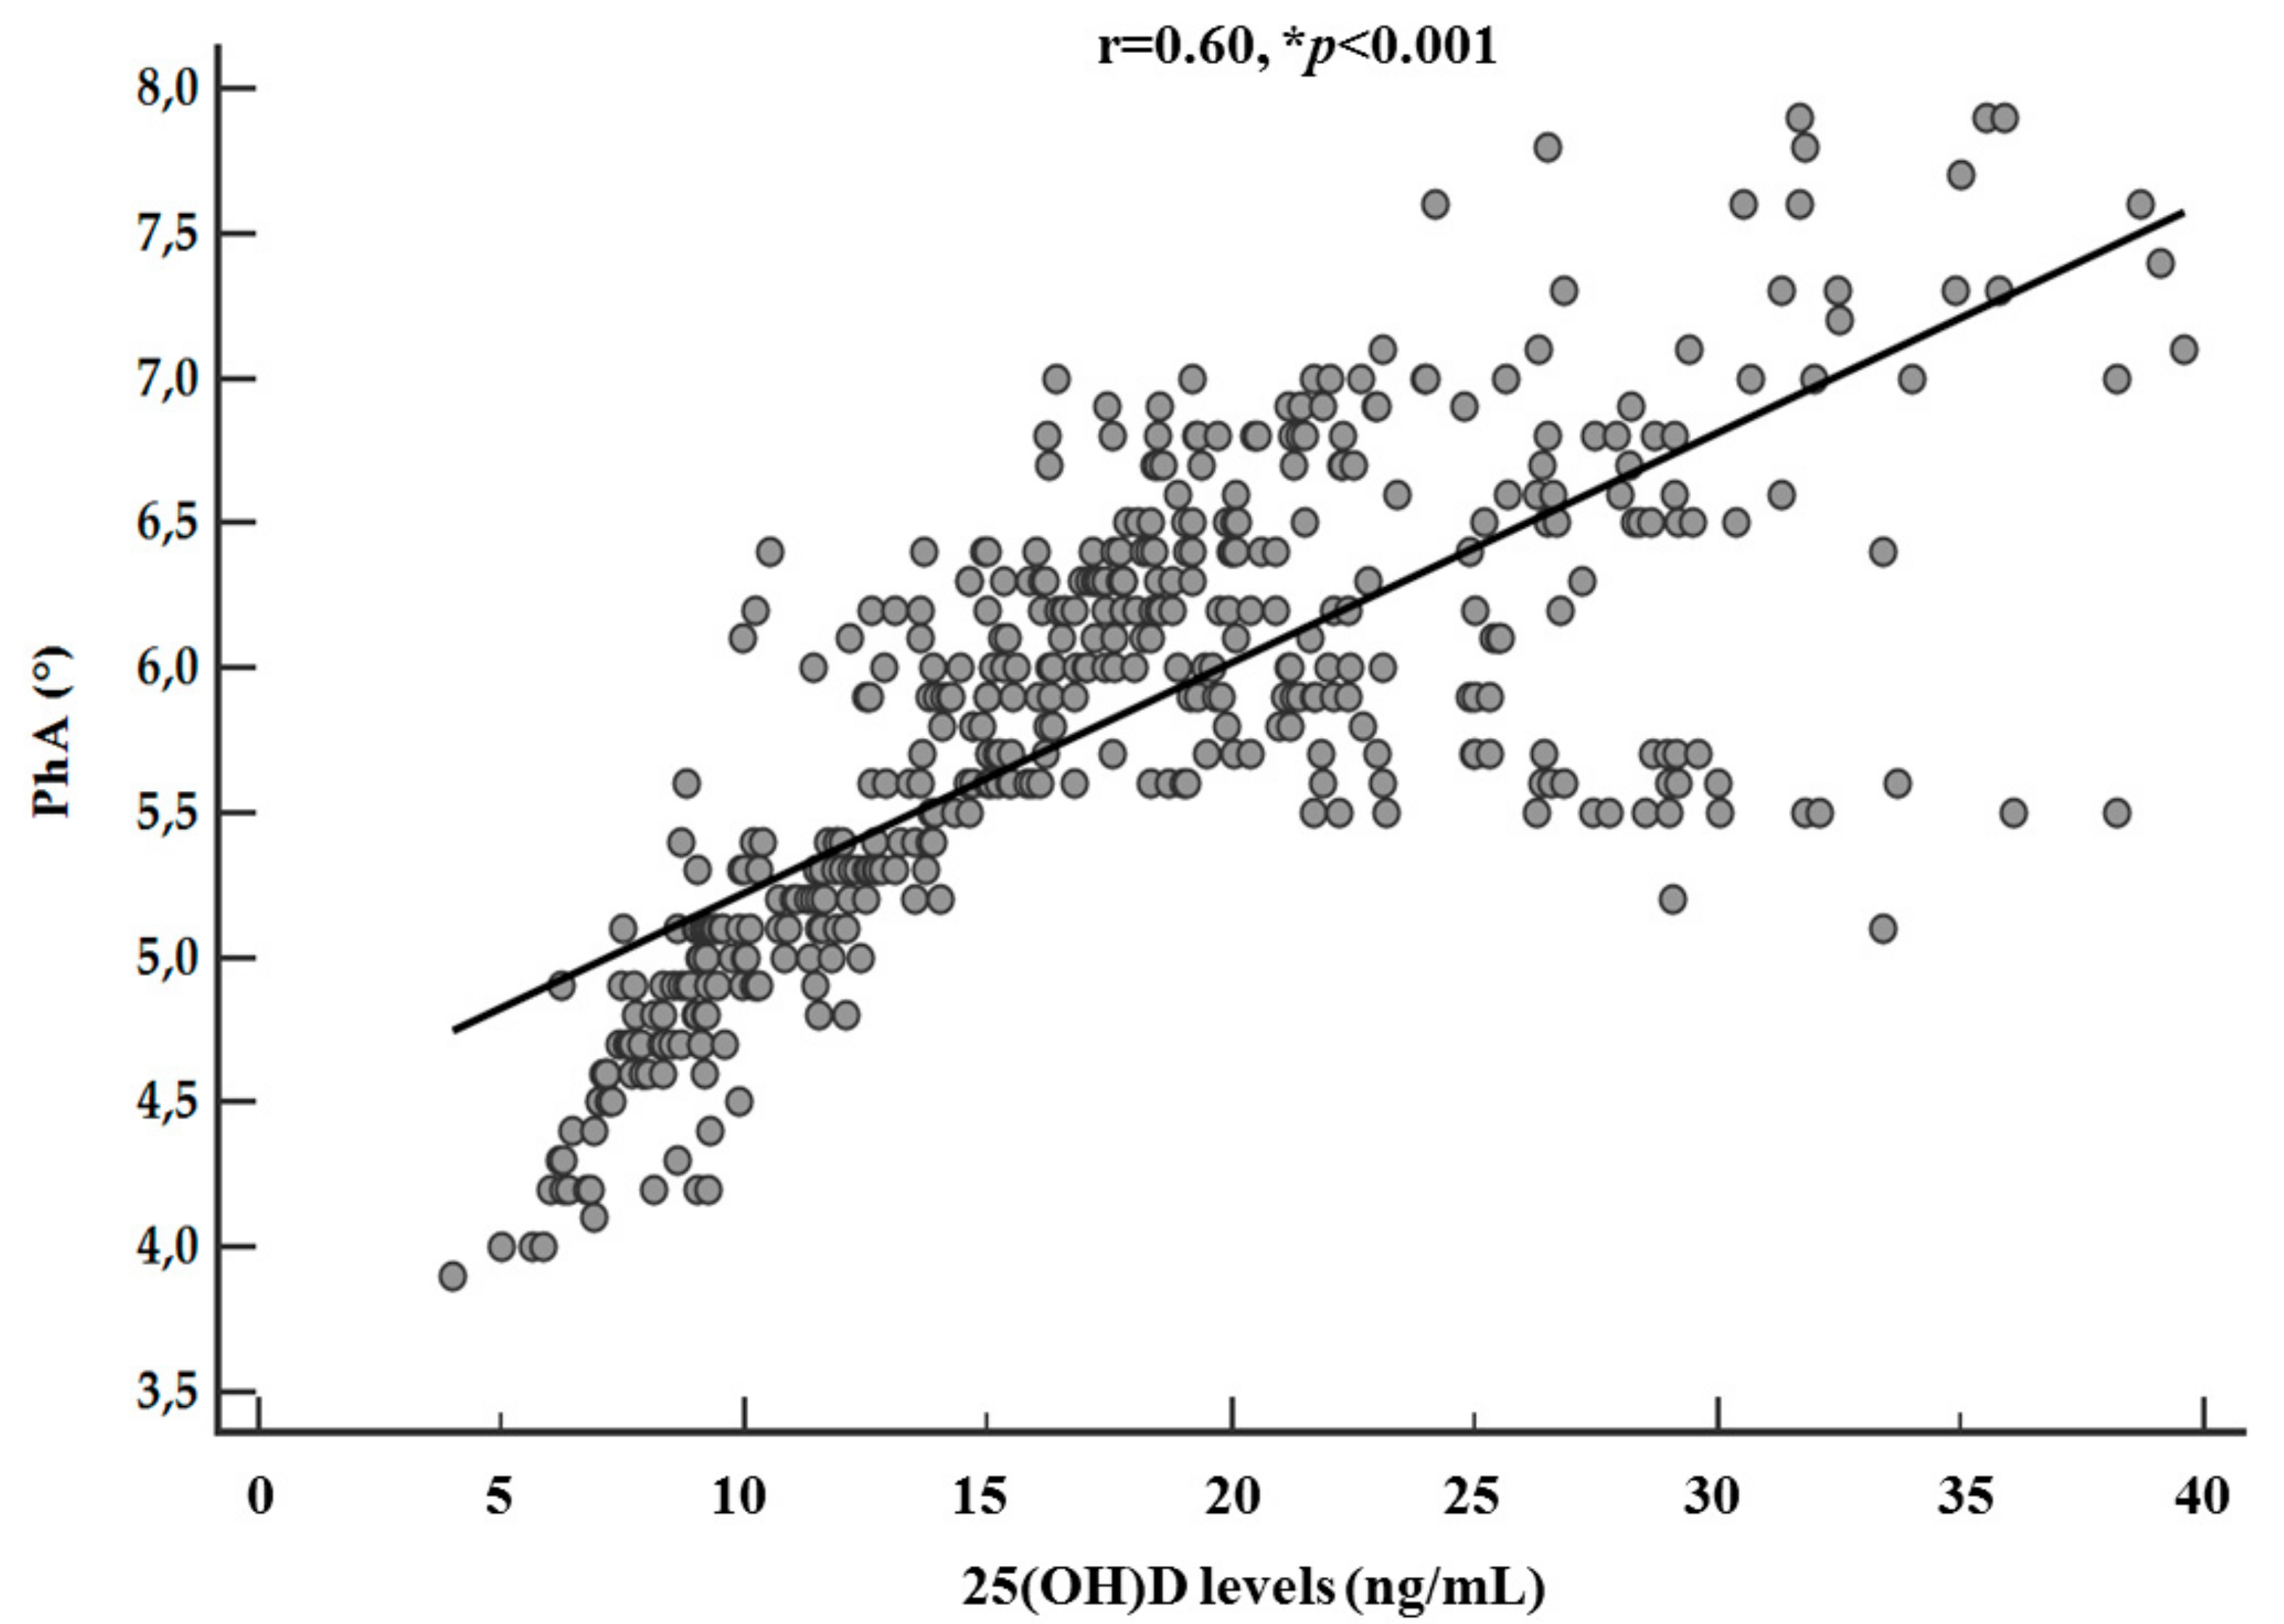
| PhA (°) | 0.74 | <0.001 ** |
| FM (kg) | −0.62 | <0.001 ** |
| FM (%) | −0.61 | <0.001 ** |
| FFM (kg) | −0.02 | 0.69 |
| FFM (%) | 0.61 | <0.001 ** |
| TBW (Lt) | −0.06 | 0.19 |
| ECW (Lt) | −0.39 | <0.001 ** |
| ICW (Lt) | 0.21 | <0.001 ** |
| Parameters | PhA (°) | FM (kg) | ||||||
|---|---|---|---|---|---|---|---|---|
| OR | p-Value | 95% IC | R2 | OR | p-Value | 95% IC | R2 | |
| BMI | ||||||||
| Normal weight | 1.5 | 0.01 ** | 1.1–2.1 | 0.02 | 0.7 | <0.001 ** | 0.7–0.8 | 0.43 |
| Overweight | 8.9 | <0.001 ** | 5.5–14.7 | 0.24 | 0.9 | <0.001 ** | 0.9–1.0 | 0.17 |
| Grade I obesity | 1.1 | 0.01 ** | 0.9–1.5 | 0.002 | 1.0 | 0.04 ** | 1.0–1.0 | 0.01 |
| Grade II obesity | 0.5 | <0.001 ** | 0.4–0.7 | 0.05 | 1.0 | <0.001 ** | 1.0–1.0 | 0.03 |
| Grade III obesity | 0.3 | <0.001 ** | 0.2–0.4 | 0.15 | 1.3 | <0.001 ** | 0.2–1.3 | 0.54 |
| 25(OH)D levels | ||||||||
| Deficit | 0.2 | <0.001 ** | 0.1–0.2 | 0.26 | 1.1 | <0.001 ** | 1.1–1.1 | 0.29 |
| Insufficiency | 3.2 | <0.001 ** | 2.3–4.5 | 0.13 | 0.9 | <0.001 ** | 0.9–1.0 | 0.19 |
| Sufficiency | 8.0 | <0.001 ** | 4.1–15.6 | 0.11 | 0.9 | <0.001 ** | 0.9–1.0 | 0.07 |
| Parameters | Multiple Regression Analysis | |||
|---|---|---|---|---|
| Model 1 | R2 | β | t | p Value |
| BMI | 0.54 | −0.54 | −14.3 | <0.001 ** |
| Sex | 0.63 | −0.32 | −9.0 | <0.001 ** |
| Age | 0.64 | −0.11 | −2.9 | 0.004 ** |
| Parameters | Multiple Regression Analysis | |||
|---|---|---|---|---|
| Model 2 | R2 | β | t | p Value |
| PhA (°) | 0.55 | 0.74 | 23.6 | <0.001 ** |
| Variables excluded: R, Xc, FM, FFM, ECW, ICW | ||||
© 2019 by the authors. Licensee MDPI, Basel, Switzerland. This article is an open access article distributed under the terms and conditions of the Creative Commons Attribution (CC BY) license (http://creativecommons.org/licenses/by/4.0/).
Share and Cite
Barrea, L.; Muscogiuri, G.; Laudisio, D.; Di Somma, C.; Salzano, C.; Pugliese, G.; de Alteriis, G.; Colao, A.; Savastano, S. Phase Angle: A Possible Biomarker to Quantify Inflammation in Subjects with Obesity and 25(OH)D Deficiency. Nutrients 2019, 11, 1747. https://0-doi-org.brum.beds.ac.uk/10.3390/nu11081747
Barrea L, Muscogiuri G, Laudisio D, Di Somma C, Salzano C, Pugliese G, de Alteriis G, Colao A, Savastano S. Phase Angle: A Possible Biomarker to Quantify Inflammation in Subjects with Obesity and 25(OH)D Deficiency. Nutrients. 2019; 11(8):1747. https://0-doi-org.brum.beds.ac.uk/10.3390/nu11081747
Chicago/Turabian StyleBarrea, Luigi, Giovanna Muscogiuri, Daniela Laudisio, Carolina Di Somma, Ciro Salzano, Gabriella Pugliese, Giulia de Alteriis, Annamaria Colao, and Silvia Savastano. 2019. "Phase Angle: A Possible Biomarker to Quantify Inflammation in Subjects with Obesity and 25(OH)D Deficiency" Nutrients 11, no. 8: 1747. https://0-doi-org.brum.beds.ac.uk/10.3390/nu11081747