Vitamins D and E Stimulate the PI3K-AKT Signalling Pathway in Insulin-Resistant SK-N-SH Neuronal Cells

 , , , , , and
Abstract
: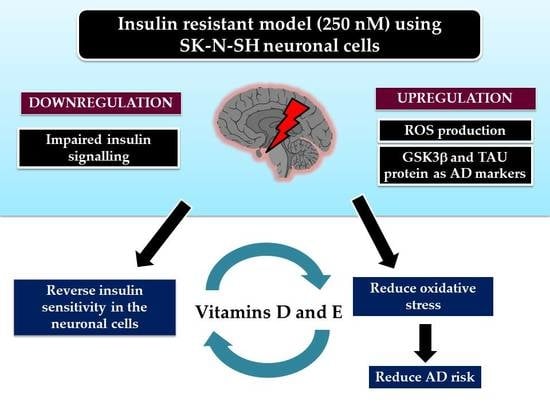
1. Introduction
2. Materials and Methods
2.1. Materials
2.2. MTT Assay
2.3. Cell Culture and Induction of Insulin Resistance
2.4. Preparation and Treatment of Vitamins D and E in the Insulin Resistance Model
2.5. Quantification of Insulin Signalling and AD Markers by qRT-PCR
2.6. Phosphorylation of AKT Assay
2.7. Glucose Uptake Assay
2.8. ROS Measurement Assay
2.9. Statistical Analysis
3. Results
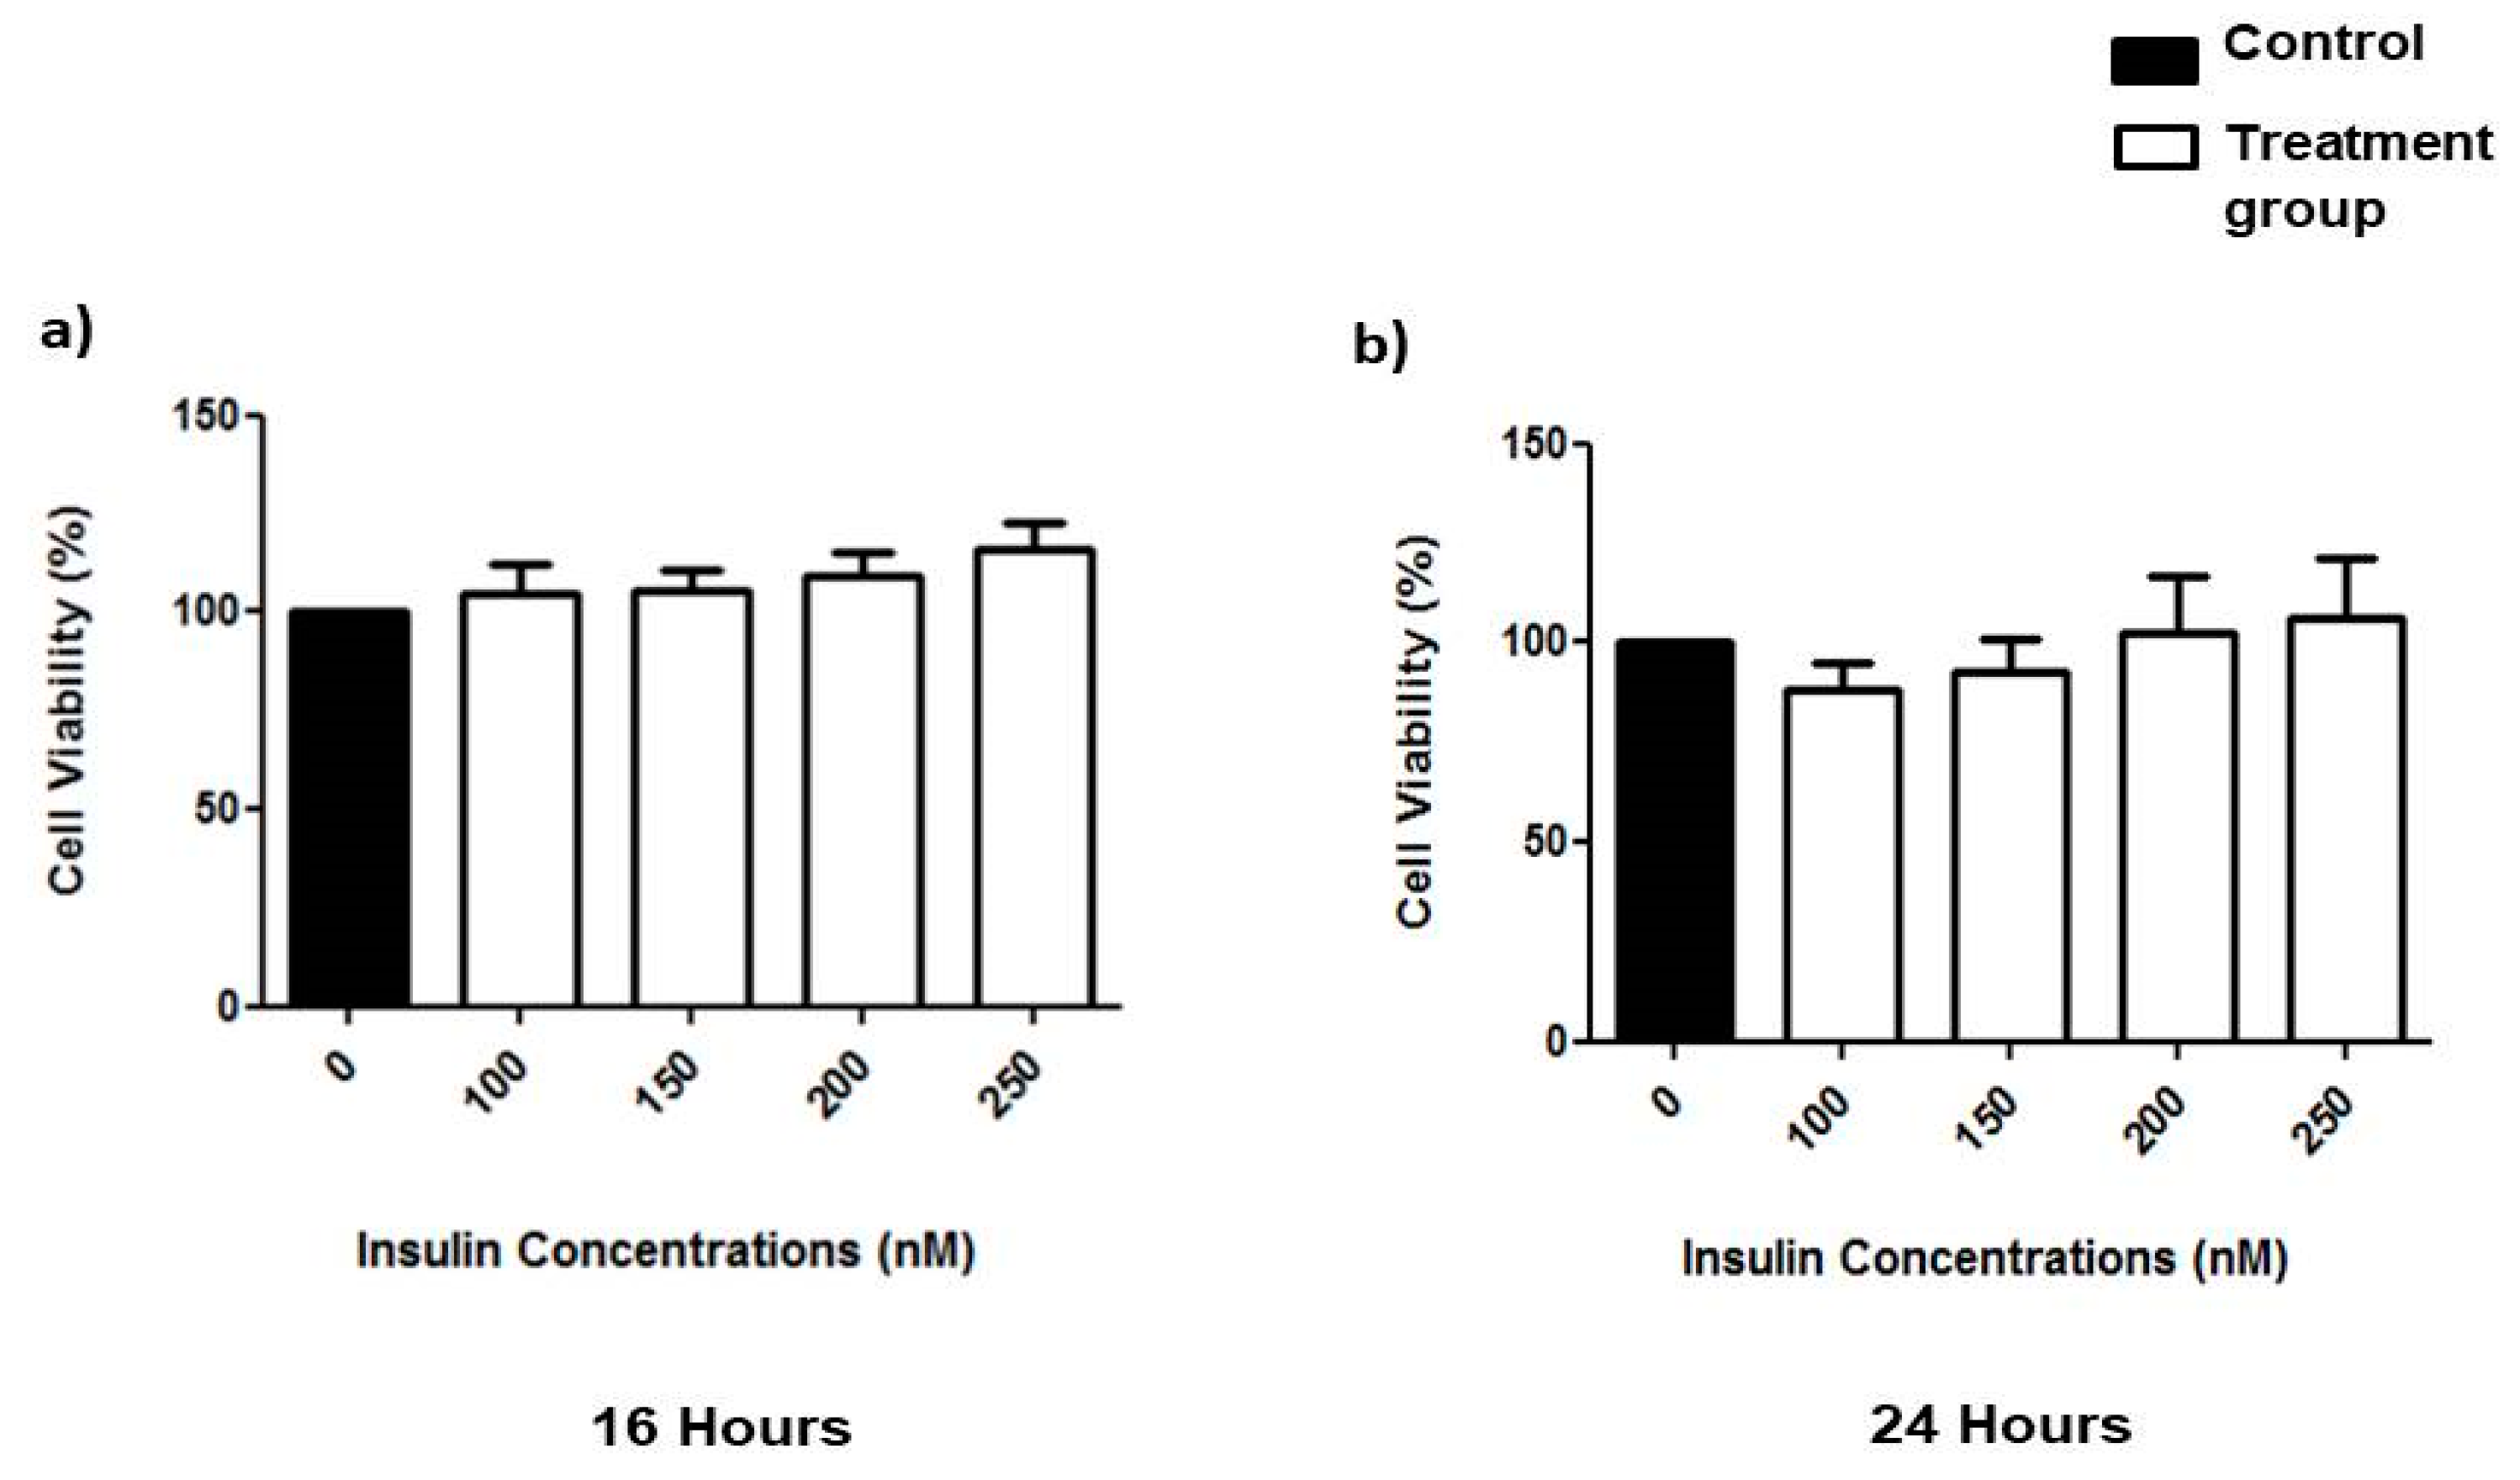
3.1. Effects of Prolonged Insulin Induction on Cell Viability
3.2. Establishment of Insulin Resistance Model in SK-N-SH Cell Line
3.2.1. Analysis of Expression of Insulin Signalling Markers
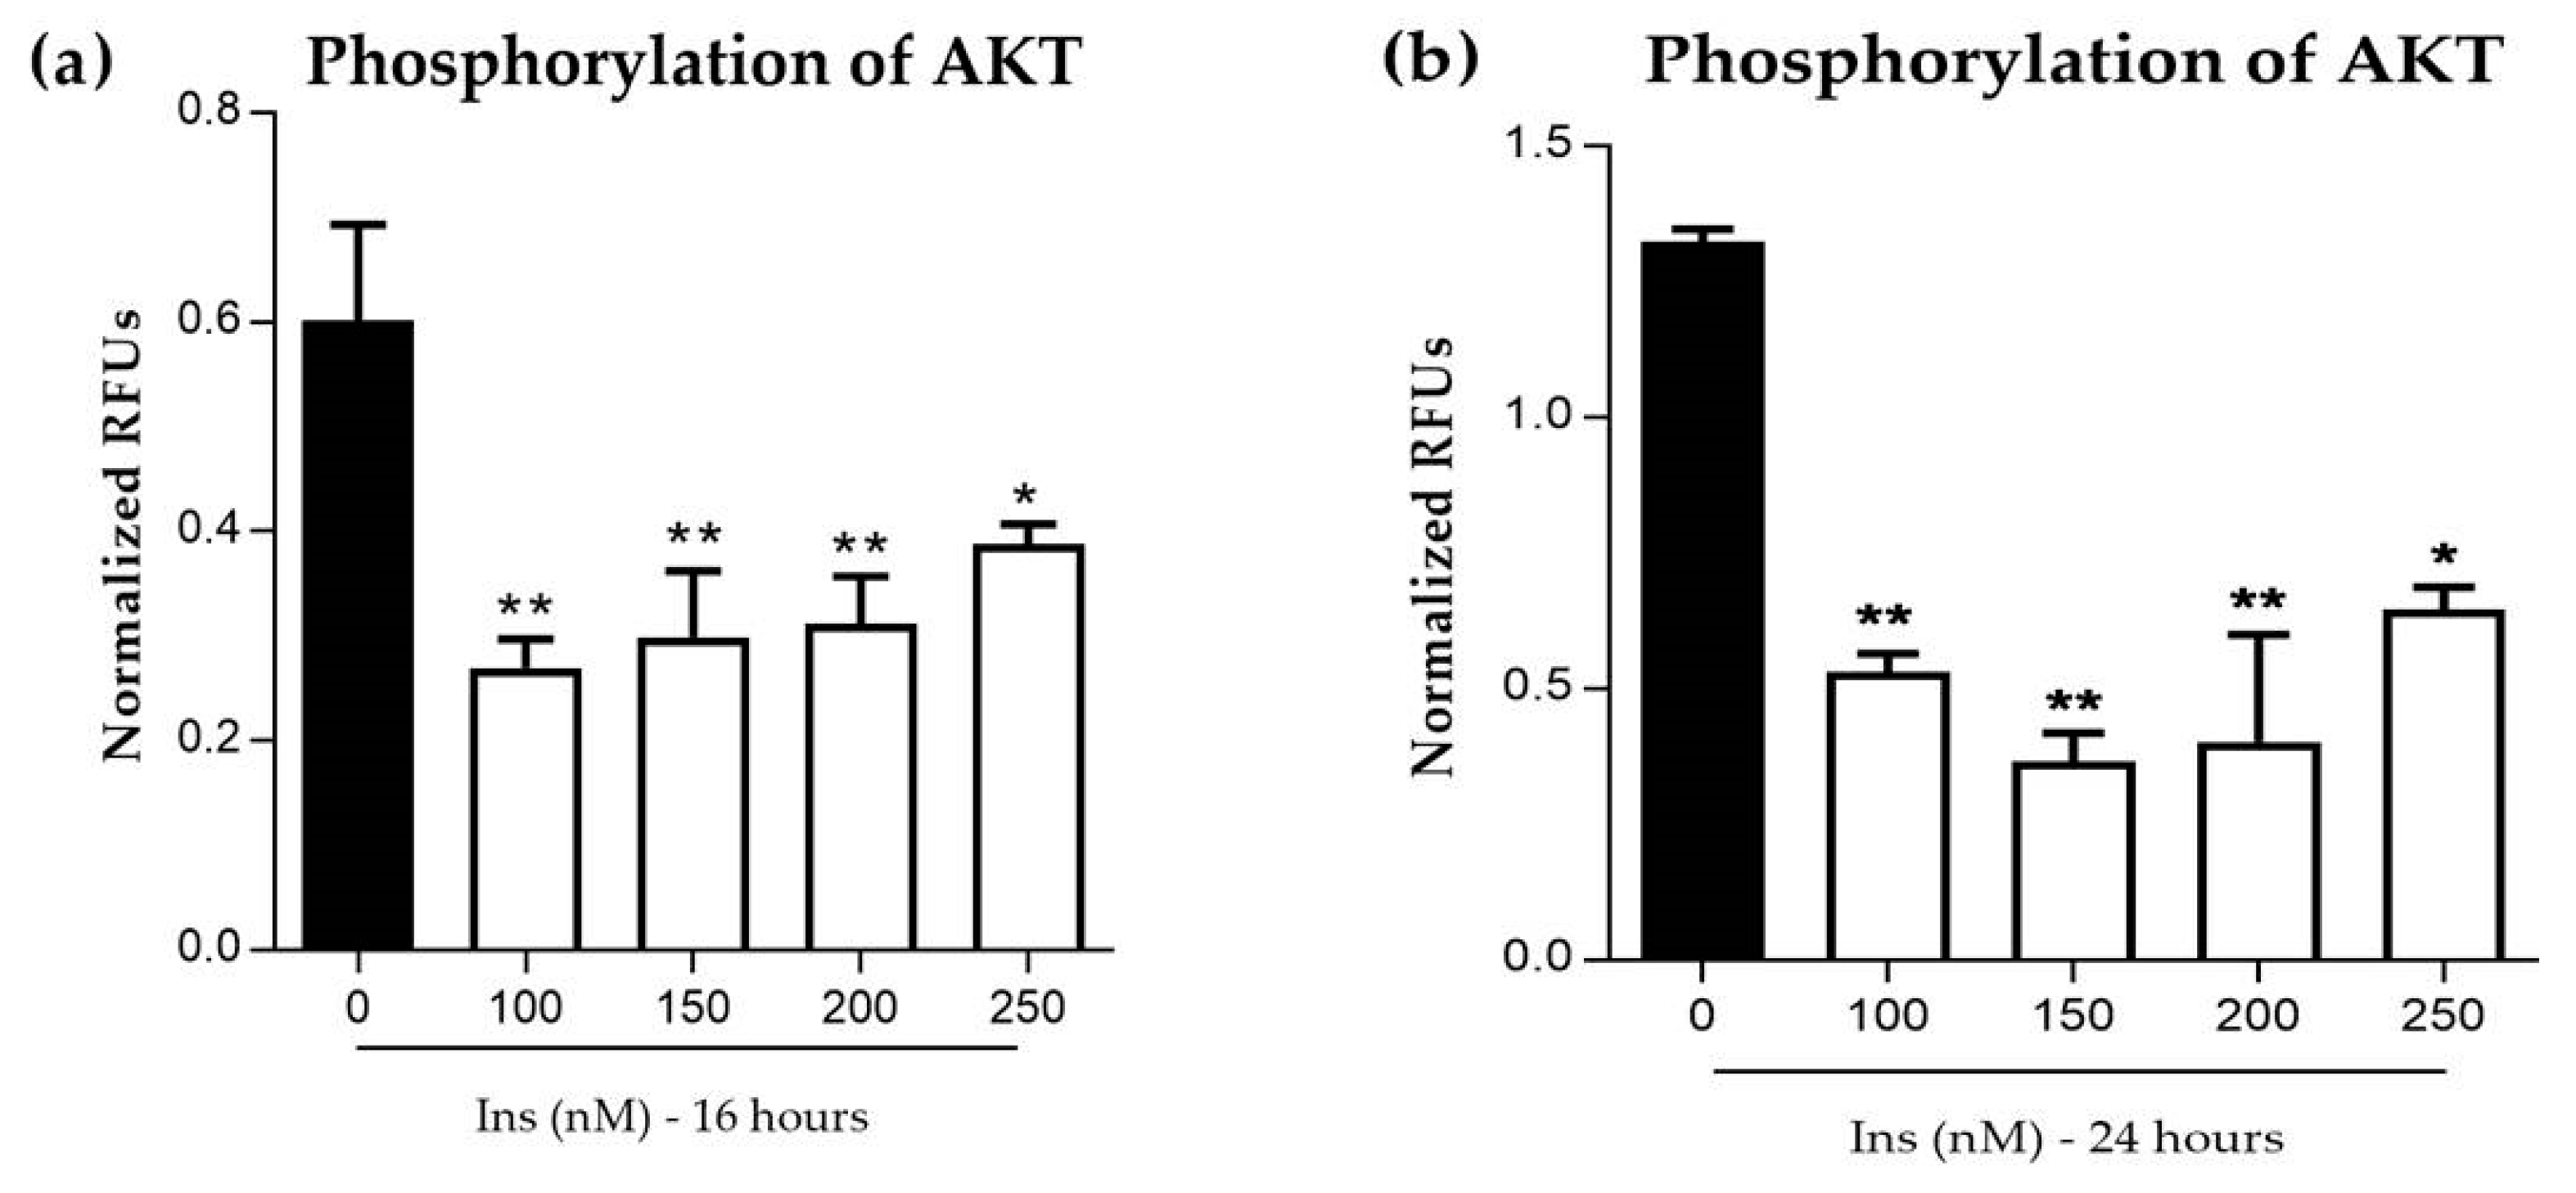
3.2.2. Phosphorylation of AKT in Insulin-Resistant Cells
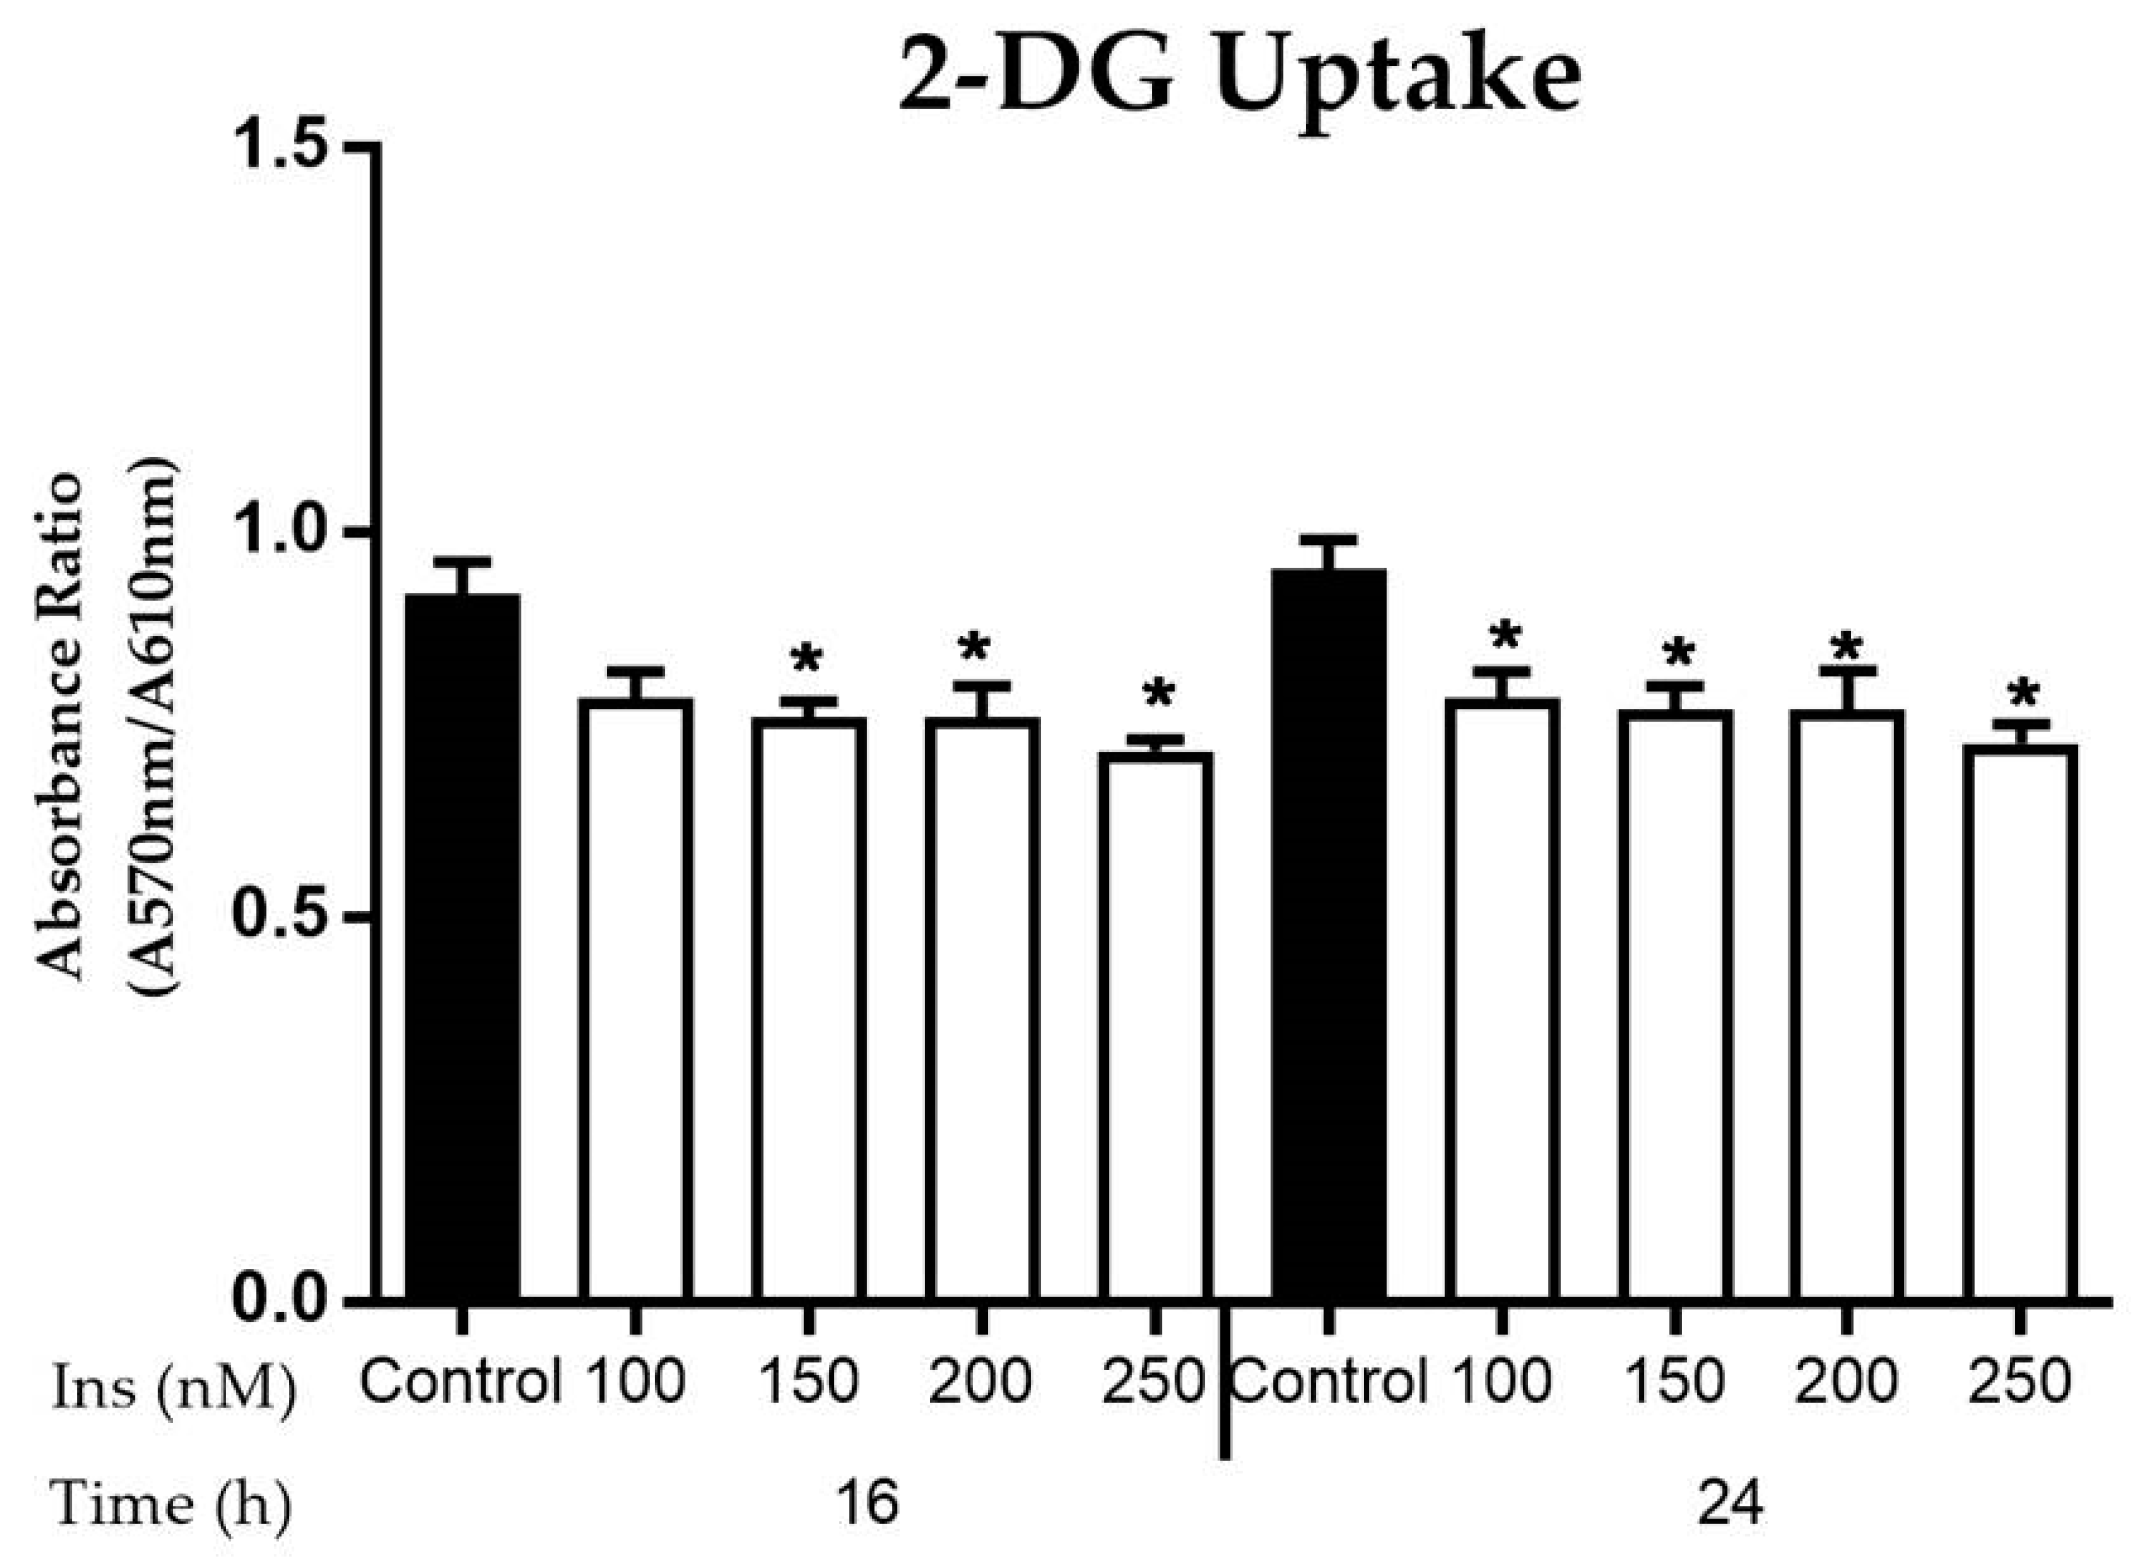
3.2.3. Glucose Uptake in Insulin-Resistant Cells
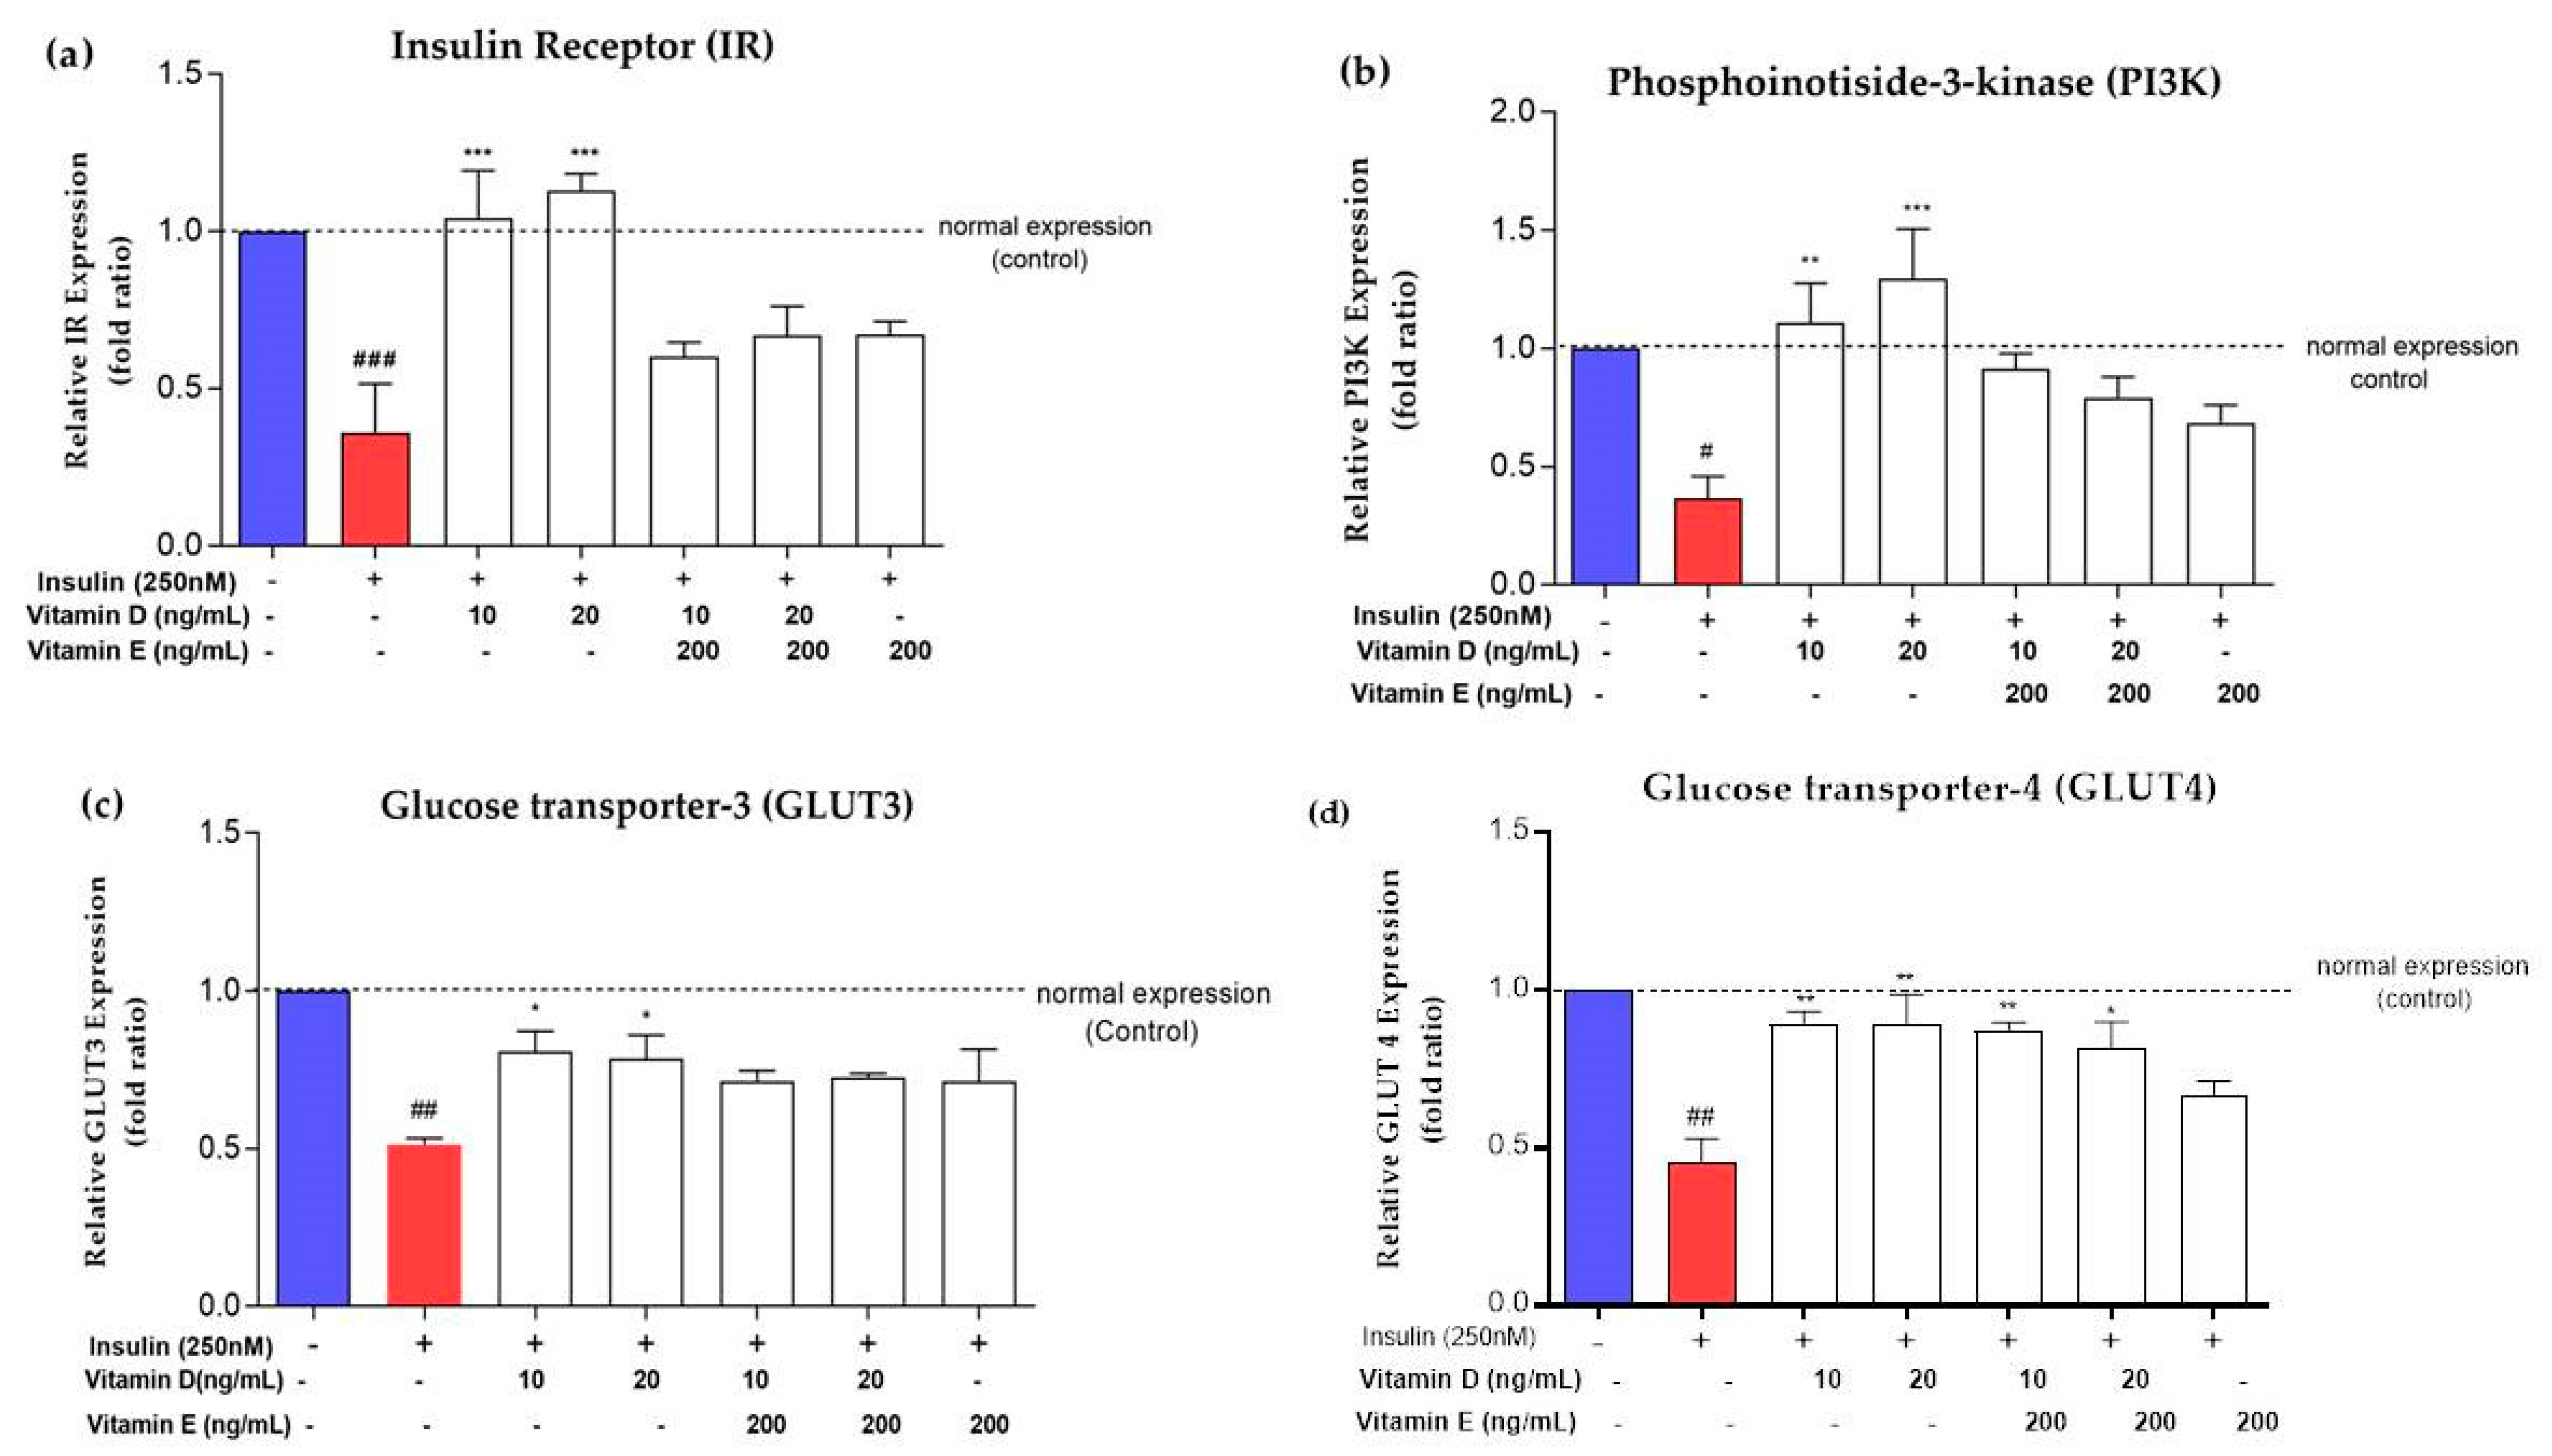
3.3. Expression of Insulin Signalling Markers upon Treatment with Vitamins D and E
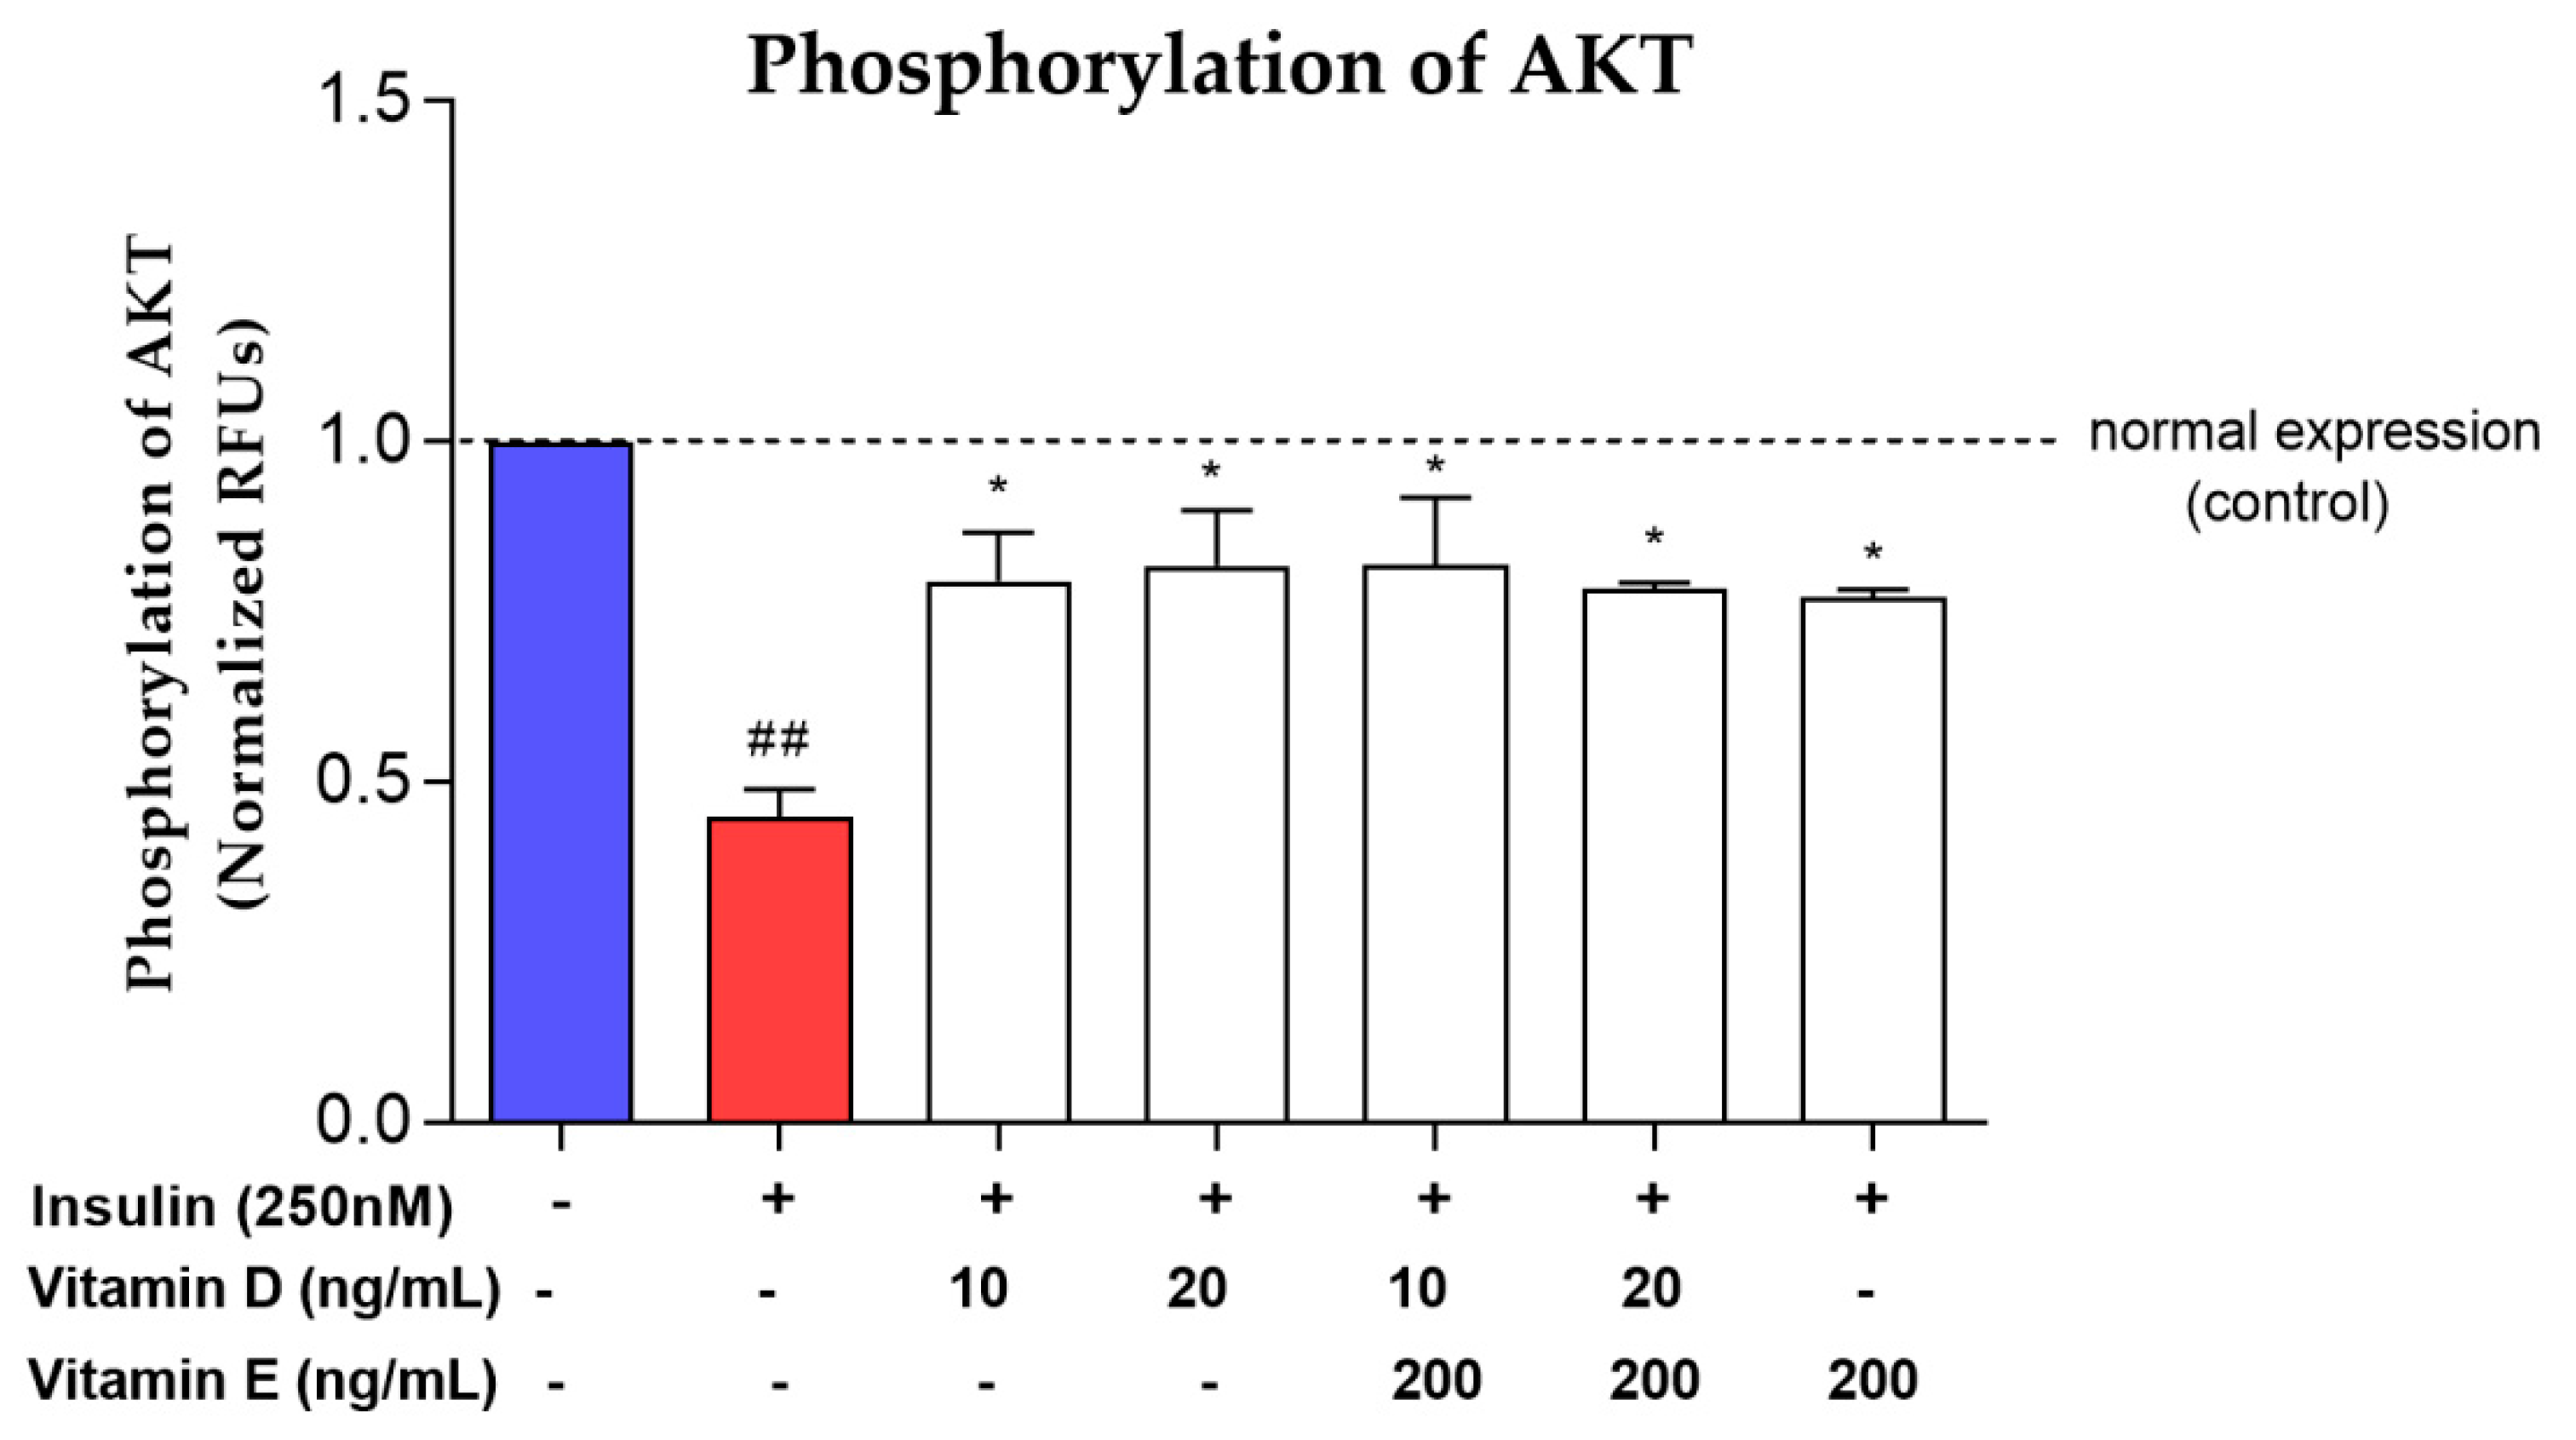
3.4. Phosphorylation of AKT
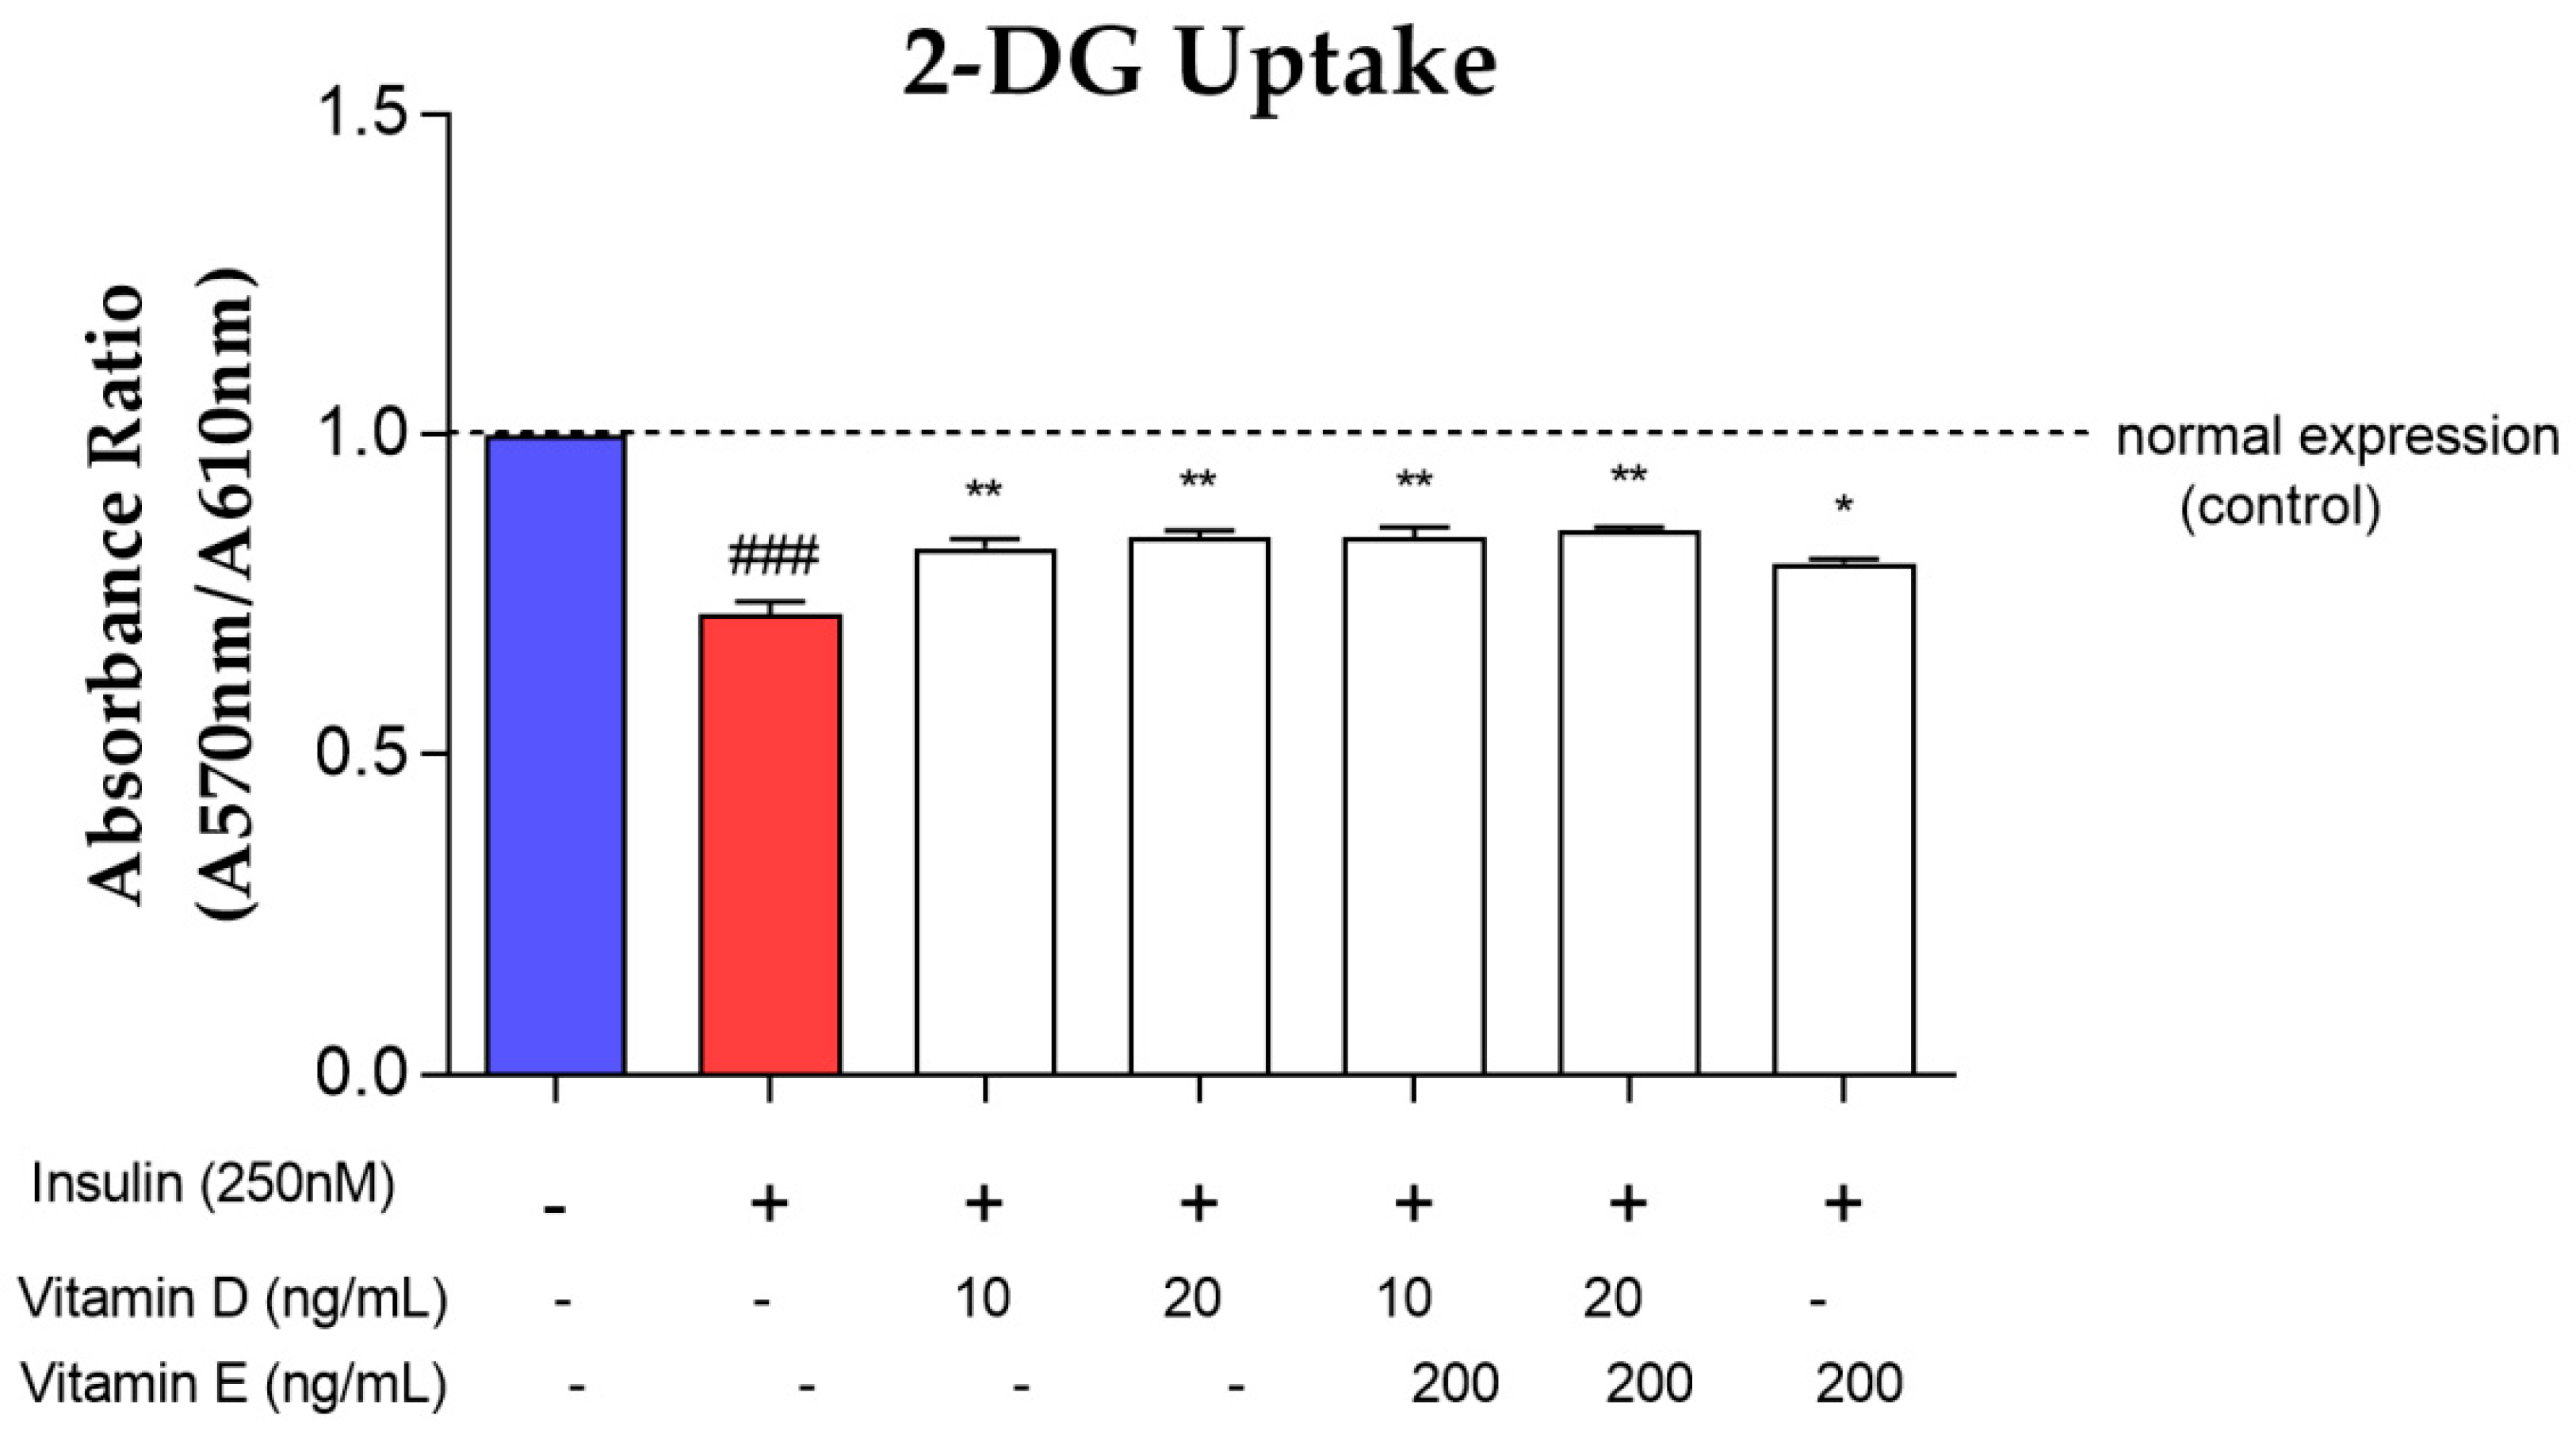
3.5. Glucose Uptake Assay
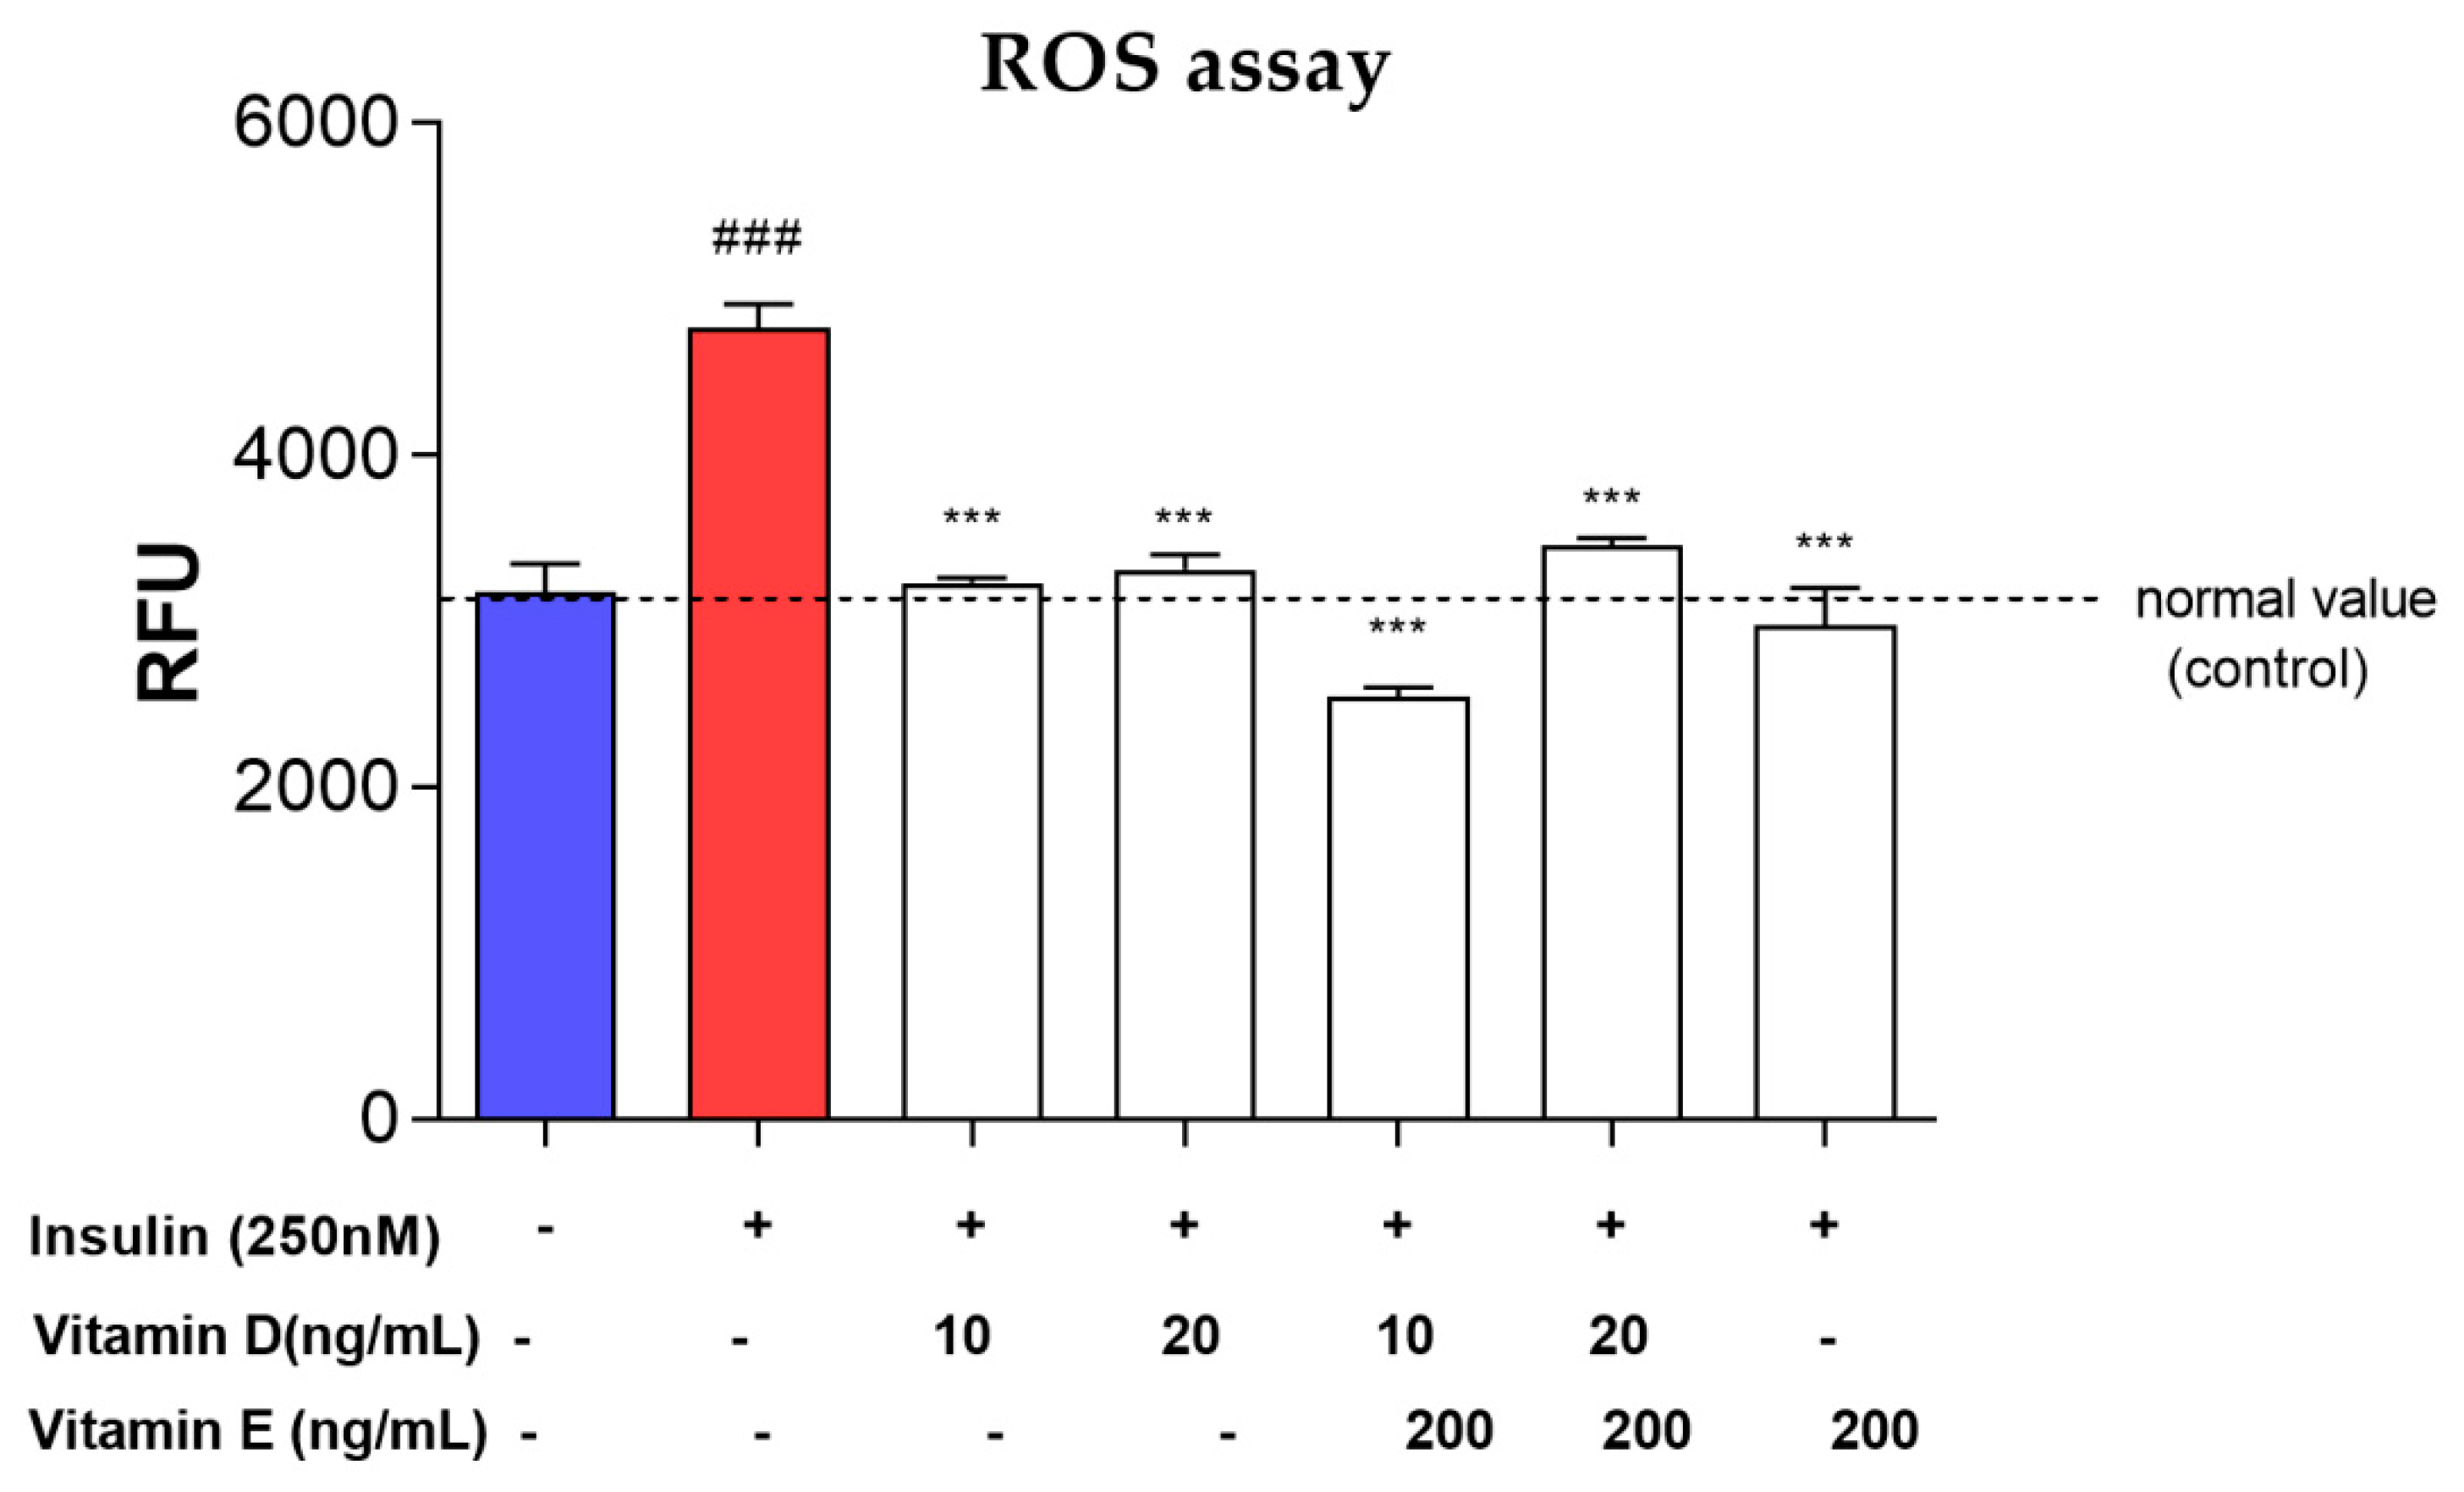
3.6. ROS Assay
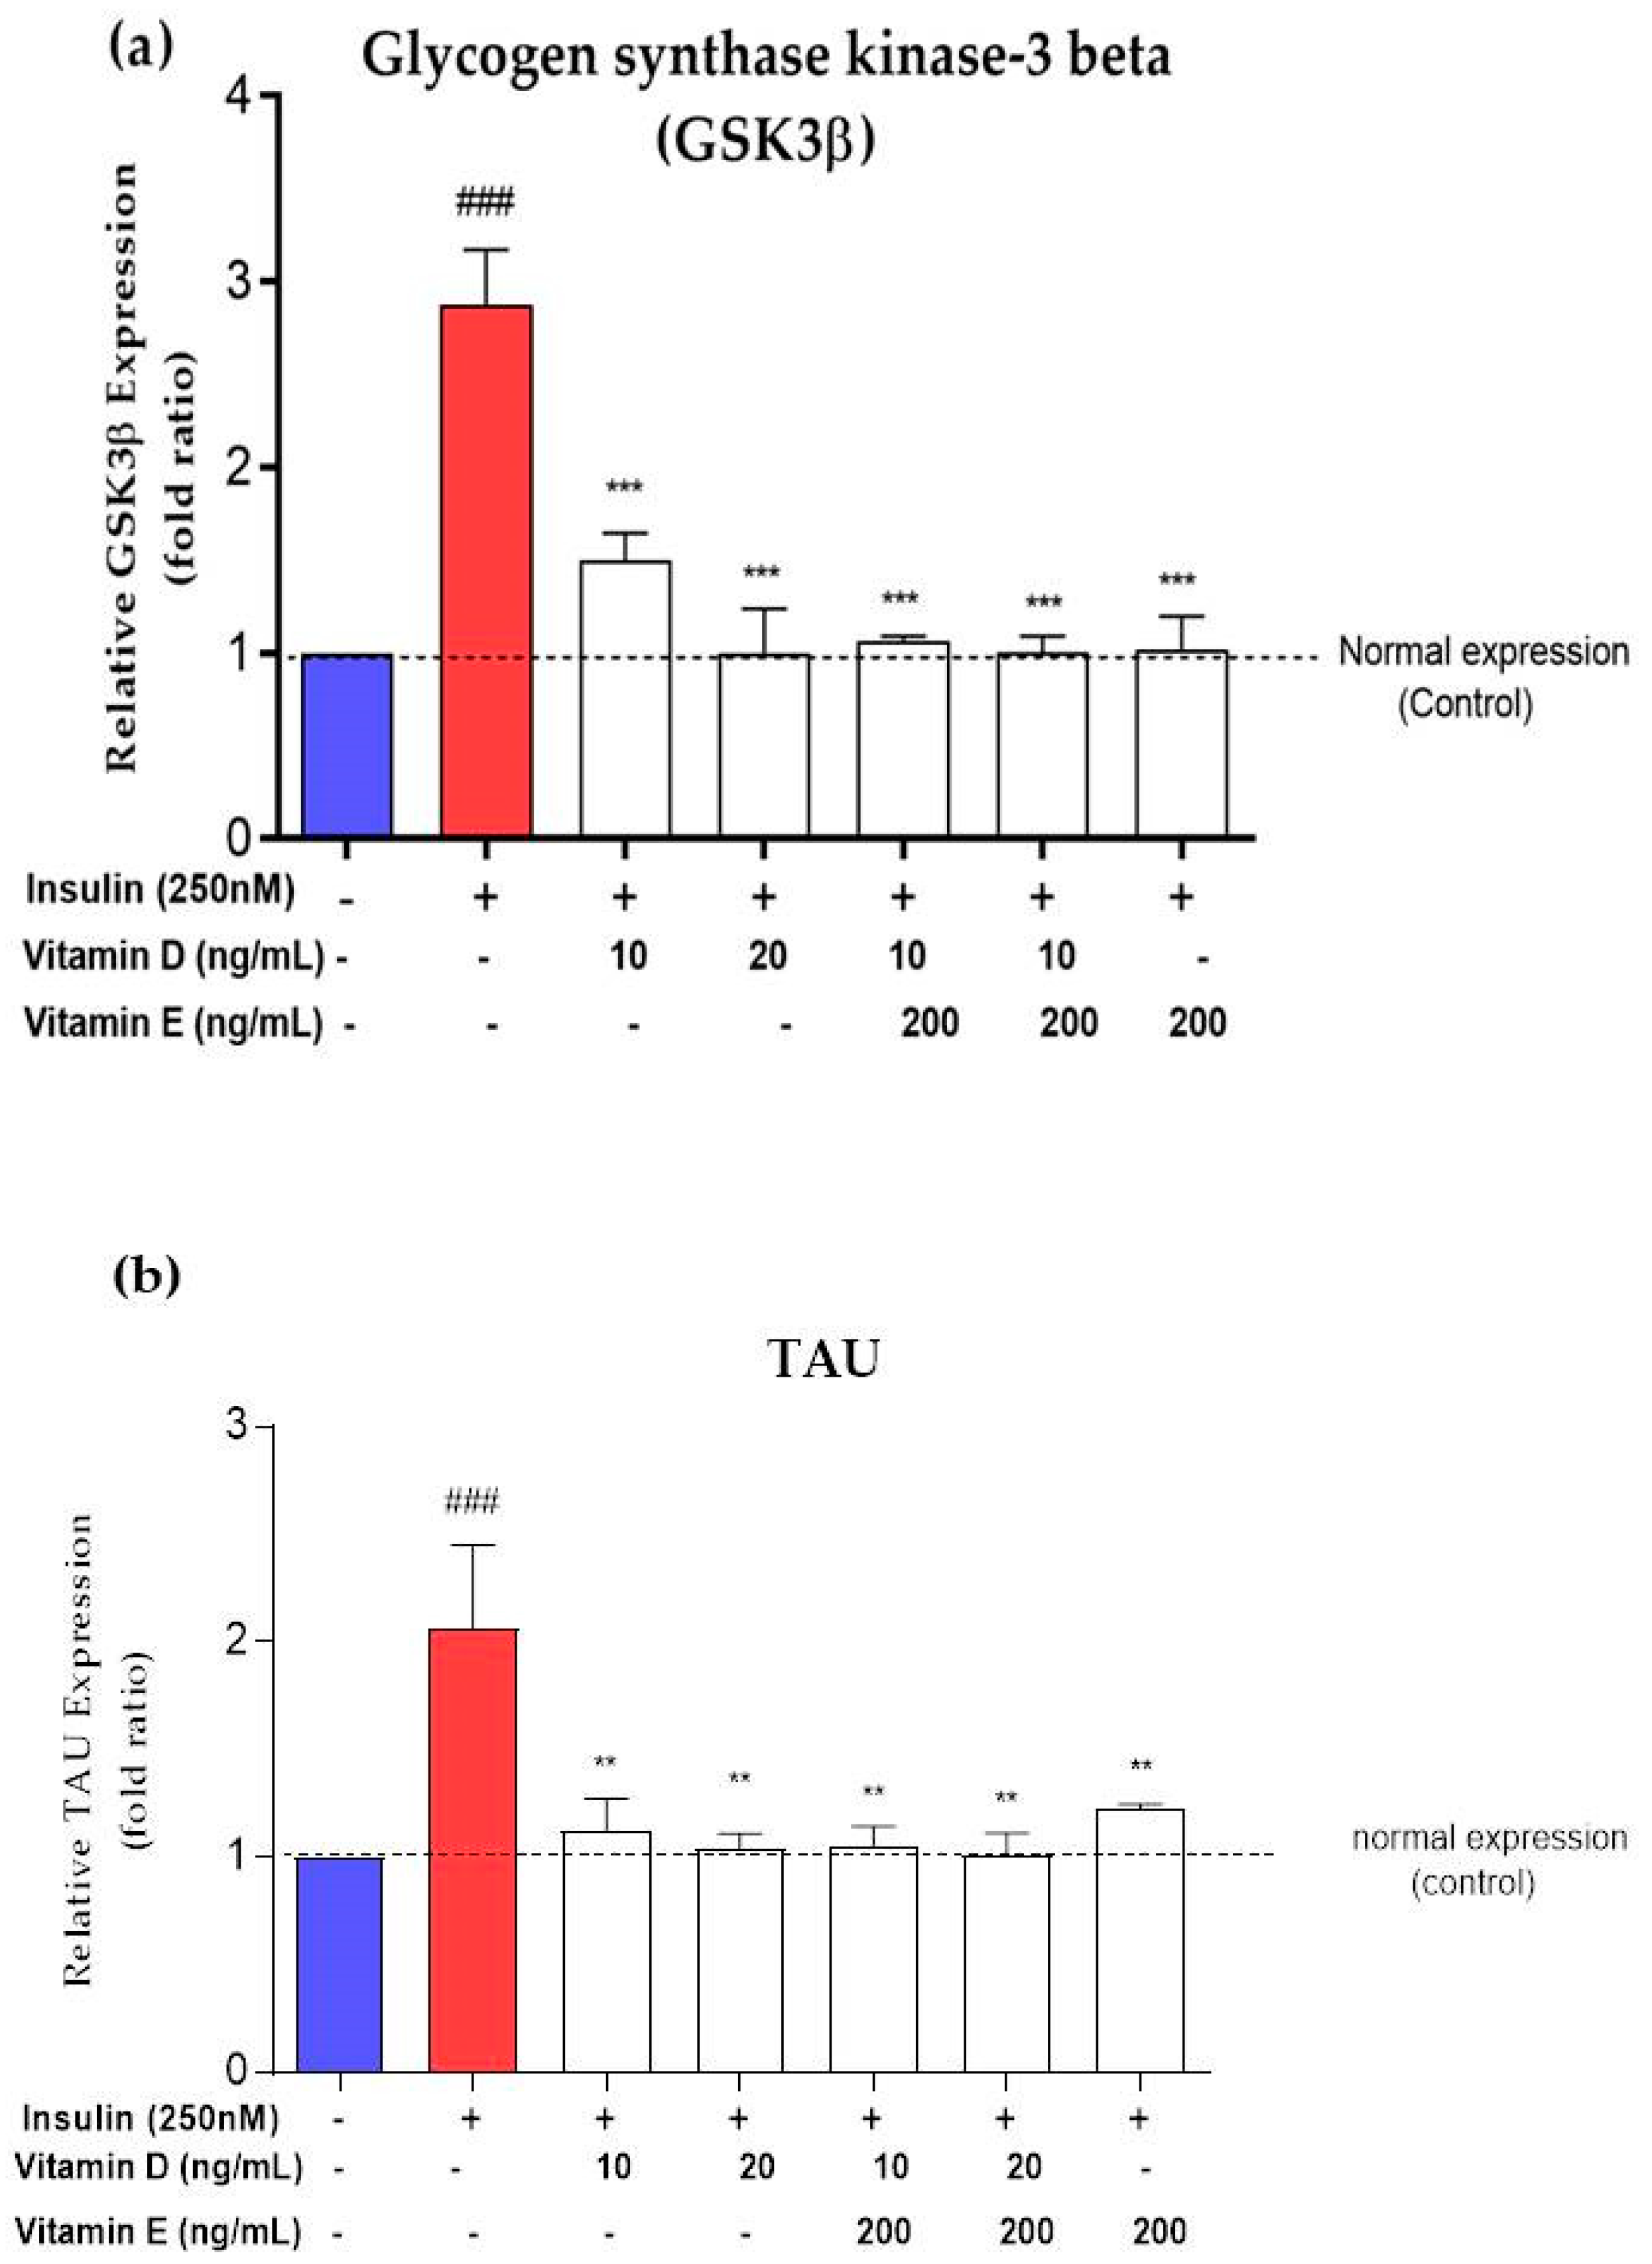
3.7. Gene Expression of AD Markers
4. Discussions
5. Conclusions
Author Contributions
Funding
Conflicts of Interest
References
- Ott, A.; Stolk, R.P.; Hofman, A.; van Harskamp, F.; Grobbee, D.E.; Breteler, M.M. Association of Diabetes Mellitus and Dementia: The Rotterdam Study. Diabetologia 1996, 39, 1392–1397. [Google Scholar] [CrossRef]
- De la Monte, S.M.; Wands, J.R. Alzheimer’s Disease Is Type 3 Diabetes—Evidence Reviewed. J. Diabetes Sci. Technol. 2008, 2, 1101–1113. [Google Scholar] [CrossRef] [PubMed]
- De la Monte, S.M. Brain Insulin Resistance and Deficiency as Therapeutic Targets in Alzheimer’s Disease. Curr. Alzheimer Res. 2012, 9, 35–66. [Google Scholar] [CrossRef] [PubMed]
- Stanley, M.; Macauley, S.L.; Holtzman, D.M. Changes in Insulin and Insulin Signaling in Alzheimer’s Disease: Cause or Consequence? J. Exp. Med. 2016, 213, 1375–1385. [Google Scholar] [CrossRef]
- Talbot, K.; Wang, H.-Y.; Kazi, H.; Han, L.-Y.; Bakshi, K.P.; Stucky, A.; Fuino, R.L.; Kawaguchi, K.R.; Samoyedny, A.J.; Wilson, R.S.; et al. Demonstrated Brain Insulin Resistance in Alzheimer’s Disease Patients Is Associated with IGF-1 Resistance, IRS-1 Dysregulation, and Cognitive Decline. J. Clin. Investig. 2012, 122, 1316–1338. [Google Scholar] [CrossRef] [PubMed]
- De la Monte, S.M. Type 3 Diabetes Is Sporadic Alzheimer’s Disease: Mini-Review. Eur. Neuropsychopharmacol. 2014, 24, 1954–1960. [Google Scholar] [CrossRef] [PubMed]
- Kaneto, H.; Nakatani, Y.; Kawamori, D.; Miyatsuka, T.; Matsuoka, T.; Matsuhisa, M.; Yamasaki, Y. Role of Oxidative Stress, Endoplasmic Reticulum Stress, and c-Jun N-Terminal Kinase in Pancreatic β-Cell Dysfunction and Insulin Resistance. Int. J. Biochem. Cell Biol. 2006, 38, 782–793. [Google Scholar] [CrossRef]
- Kahn, B.B.; Flier, J.S. Obesity and Insulin Resistance. J. Clin. Investig. 2000, 106, 473–481. [Google Scholar] [CrossRef]
- Forouhi, N.G.; Luan, J.; Cooper, A.; Boucher, B.J.; Wareham, N.J. Baseline Serum 25-Hydroxy Vitamin d Is Predictive of Future Glycemic Status and Insulin Resistance: The Medical Research Council Ely Prospective Study 1990–2000. Diabetes 2008, 57, 2619–2625. [Google Scholar] [CrossRef]
- Cigolini, M.; Iagulli, M.P.; Miconi, V.; Galiotto, M.; Lombardi, S.; Targher, G. Serum 25-Hydroxyvitamin D3 Concentrations and Prevalence of Cardiovascular Disease Among Type 2 Diabetic Patients. Diabetes Care 2006, 29, 722–724. [Google Scholar] [CrossRef] [Green Version]
- Mitri, J.; Pittas, A.G. Vitamin D and Diabetes. Endocrinol. Metab. Clin. N. Am. 2014, 43, 205–232. [Google Scholar] [CrossRef] [PubMed]
- Wenclewska, S.; Szymczak-Pajor, I.; Drzewoski, J.; Bunk, M.; Śliwińska, A. Vitamin D Supplementation Reduces Both Oxidative DNA Damage and Insulin Resistance in the Elderly with Metabolic Disorders. Int. J. Mol. Sci. 2019, 20, 2891. [Google Scholar] [CrossRef] [PubMed]
- Altieri, B.; Muscogiuri, G.; Barrea, L.; Mathieu, C.; Vallone, C.V.; Mascitelli, L.; Bizzaro, G.; Altieri, V.M.; Tirabassi, G.; Balercia, G.; et al. Does Vitamin D Play a Role in Autoimmune Endocrine Disorders? A Proof of Concept. Rev. Endocr. Metab. Disord. 2017, 18, 335–346. [Google Scholar] [CrossRef] [PubMed]
- Chiu, K.C.; Chu, A.; Go, V.L.W.; Saad, M.F. Hypovitaminosis D is Associated with Insulin Resistance and β Cell Dysfunction. Am. J. Clin. Nutr. 2004, 79, 820–825. [Google Scholar] [CrossRef] [PubMed]
- Calle, C.; Maestro, B.; García-Arencibia, M. Genomic Actions of 1,25-Dihydroxyvitamin D3 on Insulin Receptor Gene Expression, Insulin Receptor Number and Insulin Activity in the Kidney, Liver and Adipose Tissue of Streptozotocin-Induced Diabetic Rats. BMC Mol. Biol. 2008, 9, 65. [Google Scholar] [CrossRef] [PubMed]
- Musa, I.; Khaza’ai, H.; Abdul Mutalib, M.S.; Yusuf, F.; Sanusi, J.; Chang, S.K. Effects of Oil Palm Tocotrienol Rich Fraction on the Viability and Morphology of Astrocytes Injured with Glutamate. Food Biosci. 2017, 20, 168–177. [Google Scholar] [CrossRef]
- Sen, C.K.; Khanna, S.; Roy, S. Tocotrienols: Vitamin E beyond Tocopherols. Life Sci. 2006, 78, 2088–2098. [Google Scholar] [CrossRef]
- Houstis, N.; Rosen, E.D.; Lander, E.S. Reactive Oxygen Species Have a Causal Role in Multiple Forms of Insulin Resistance. Nature 2006, 440, 944–948. [Google Scholar] [CrossRef]
- Scott, J.A.; King, G.L. Oxidative Stress and Antioxidant Treatment in Diabetes. Ann. N. Y. Acad. Sci. 2004, 1031, 204–213. [Google Scholar] [CrossRef]
- Suksomboon, N.; Poolsup, N.; Sinprasert, S. Effects of Vitamin E Supplementation on Glycaemic Control in Type 2 Diabetes: Systematic Review of Randomized Controlled Trials. J. Clin. Pharm. Ther. 2011, 36, 53–63. [Google Scholar] [CrossRef]
- Manning, P.J.; Sutherland, W.H.F.; Walker, R.J.; Williams, S.M.; De Jong, S.A.; Ryalls, A.R.; Berry, E.A. Effect of High-Dose Vitamin E on Insulin Resistance and Associated Parameters in Overweight Subjects. Diabetes Care 2004, 27, 2166–2171. [Google Scholar] [CrossRef] [Green Version]
- Selvaraju, T.R.; Khaza’ai, H.; Vidyadaran, S.; Abd Mutalib, M.S.; Vasudevan, R. The Neuroprotective Effects of Tocotrienol Rich Fraction and Alpha Tocopherol against Glutamate Injury in Astrocytes. Bosn. J. Basic Med. Sci. 2014, 14, 195–204. [Google Scholar] [CrossRef] [PubMed]
- Zainal, Z.; Abdul Rahim, A.; Khaza’ai, H.; Chang, S.K. Effects of palm oil tocotrienol-rich fraction (TRF) and carotenes in ovalbumin (ova)-challenged asthmatic Brown Norway rats. Int. J. Mol. Sci. 2019, 20, 1764. [Google Scholar] [CrossRef] [PubMed]
- Goncalves, A.; Roi, S.; Nowicki, M.; Dhaussy, A.; Huertas, A.; Amiot, M.J.; Reboul, E. Fat-soluble vitamin intestinal absorption: Absorption sites in the intestine and interactions for absorption. Food Chem. 2015, 172, 155–160. [Google Scholar] [CrossRef] [PubMed]
- Brant, A.M.; Jess, T.J.; Milligan, G.; Brown, C.M.; Gould, G.W. Immunological Analysis of Glucose Transporters Expressed in Different Regions of the Rat Brain and Central Nervous System. Biochem. Biophys. Res. Commun. 1993, 192, 1297–1302. [Google Scholar] [CrossRef] [PubMed]
- Choeiri, C.; Staines, W.; Messier, C. Immunohistochemical Localization and Quantification of Glucose Transporters in the Mouse Brain. Neuroscience 2002, 111, 19–34. [Google Scholar] [CrossRef]
- El Messari, S.; Aït-Ikhlef, A.; Ambroise, D.H.; Penicaud, L.; Arluison, M. Expression of Insulin-Responsive Glucose Transporter GLUT4 MRNA in the Rat Brain and Spinal Cord: An In Situ Hybridization Study. J. Chem. Neuroanat. 2002, 24, 225–242. [Google Scholar] [CrossRef]
- Mayer, C.M.; Belsham, D.D. Central Insulin Signaling Is Attenuated by Long-Term Insulin Exposure via Insulin Receptor Substrate-1 Serine Phosphorylation, Proteasomal Degradation, and Lysosomal Insulin Receptor Degradation. Endocrinology 2010, 151, 75–84. [Google Scholar] [CrossRef]
- Riss, T.L.; Moravec, R.A.; Niles, A.L.; Duellman, S.; Benink, H.A.; Worzella, T.J.; Minor, L. Cell Viability Assays; Eli Lilly & Company and the National Center for Advancing Translational Sciences: Bethesda, MD, USA, 2004. [Google Scholar]
- Benomar, Y.; Naour, N.; Aubourg, A.; Bailleux, V.; Gertler, A.; Djiane, J.; Guerre-Millo, M.; Taouis, M. Insulin and Leptin Induce Glut4 Plasma Membrane Translocation and Glucose Uptake in a Human Neuronal Cell Line by a Phosphatidylinositol 3-Kinase- Dependent Mechanism. Endocrinology 2006, 147, 2550–2556. [Google Scholar] [CrossRef] [Green Version]
- Manna, P.; Jain, S.K. Vitamin D Up-Regulates Glucose Transporter 4 (GLUT4) Translocation and Glucose Utilization Mediated by Cystathionine-γ-Lyase (CSE) Activation and H2S Formation in 3T3L1 Adipocytes. J. Biol. Chem. 2012, 287, 42324–42332. [Google Scholar] [CrossRef]
- Gelling, R.W.; Morton, G.J.; Morrison, C.D.; Niswender, K.D.; Myers, M.G.; Rhodes, C.J.; Schwartz, M.W. Insulin Action in the Brain Contributes to Glucose Lowering during Insulin Treatment of Diabetes. Cell Metab. 2006, 3, 67–73. [Google Scholar] [CrossRef] [PubMed]
- Kumar, N.; Dey, C.S. Development of Insulin Resistance and Reversal by Thiazolidinediones in C2C12 Skeletal Muscle Cells. Biochem. Pharmacol. 2003, 65, 249–257. [Google Scholar] [CrossRef]
- Sinha, M.K.; Taylor, L.G.; Pories, W.J.; Flickinger, E.G.; Meelheim, D.; Atkinson, S.; Sehgal, N.S.; Caro, J.F. Long-Term Effect of Insulin on Glucose Transport and Insulin Binding in Cultured Adipocytes from Normal and Obese Humans with and without Non-Insulin-Dependent Diabetes. J. Clin. Investig. 1987, 80, 1073–1081. [Google Scholar] [CrossRef] [PubMed]
- Dineley, K.; Jahrling, J.; Denner, L. Insulin Resistance in Alzheimer’ s Disease. Neurobiol. Dis. 2015, 72, 92–103. [Google Scholar] [CrossRef] [PubMed]
- Nampoothiri, M.; Reddy, N.D.; John, J.; Kumar, N.; Kutty Nampurath, G.; Rao Chamallamudi, M. Insulin Blocks Glutamate-Induced Neurotoxicity in Differentiated SH-SY5Y Neuronal Cells. Behav. Neurol. 2014, 2014, 674164. [Google Scholar] [CrossRef]
- Catalano, K.J.; Maddux, B.A.; Szary, J.; Youngren, J.F.; Goldfine, I.D.; Schaufele, F. Insulin Resistance Induced by Hyperinsulinemia Coincides with a Persistent Alteration at the Insulin Receptor Tyrosine Kinase Domain. PLoS ONE 2014, 9, e108693. [Google Scholar] [CrossRef]
- Pandini, G.; Pace, V.; Copani, A.; Squatrito, S.; Milardi, D.; Vigneri, R. Insulin has multiple antiamyloidogenic effects on human neuronal cells. Neuroendocrinology 2013, 154, 375–387. [Google Scholar] [CrossRef]
- Tang, D.; Chen, Q.-B.; Xin, X.-L.; Aisa, H.-A. Anti-Diabetic Effect of Three New Norditerpenoid Alkaloids in Vitro and Potential Mechanism via PI3K/Akt Signaling Pathway. Biomed. Pharmacother. 2017, 87, 145–152. [Google Scholar] [CrossRef]
- Chen, G.; Raman, P.; Bhonagiri, P.; Strawbridge, A.B.; Pattar, G.R.; Elmendorf, J.S. Protective Effect of Phosphatidylinositol 4,5-Bisphosphate against Cortical Filamentous Actin Loss and Insulin Resistance Induced by Sustained Exposure of 3T3-L1 Adipocytes to Insulin. J. Biol. Chem. 2004, 279, 39705–39709. [Google Scholar] [CrossRef] [Green Version]
- Garvey, W.T.; Olefsky, J.M.; Marshall, S. Insulin Induces Progressive Insulin Resistance in Cultured Rat Adipocytes. Sequential Effects at Receptor and Multiple Postreceptor Sites. Diabetes 1986, 35, 258–267. [Google Scholar] [CrossRef]
- Gupta, A.; Bisht, B.; Dey, C.S. Peripheral Insulin-Sensitizer Drug Metformin Ameliorates Neuronal Insulin Resistance and Alzheimer’s-like Changes. Neuropharmacology 2011, 60, 910–920. [Google Scholar] [CrossRef] [PubMed]
- Leguisamo, N.M.; Lehnen, A.M.; Machado, U.F.; Okamoto, M.M.; Markoski, M.M.; Pinto, G.H.; Schaan, B.D. GLUT4 Content Decreases along with Insulin Resistance and High Levels of Inflammatory Markers in Rats with Metabolic Syndrome. Cardiovasc. Diabetol. 2012, 11, 100. [Google Scholar] [CrossRef] [PubMed]
- Carvalho, E.; Kotani, K.; Peroni, O.D.; Kahn, B.B. Adipose-Specific Overexpression of GLUT4 Reverses Insulin Resistance and Diabetes in Mice Lacking GLUT4 Selectively in Muscle. Am. J. Physiol. Endocrinol. Metab. 2005, 289, E551–E561. [Google Scholar] [CrossRef] [PubMed]
- Uemura, E.; Greenlee, H.W. Insulin Regulates Neuronal Glucose Uptake by Promoting Translocation of Glucose Transporter GLUT3. Exp. Neurol. 2006, 198, 48–53. [Google Scholar] [CrossRef] [PubMed]
- Meierhans, R.; Béchir, M.; Ludwig, S.; Sommerfeld, J.; Brandi, G.; Haberthür, C.; Stocker, R.; Stover, J.F. Brain Metabolism Is Significantly Impaired at Blood Glucose below 6 MM and Brain Glucose below 1 MM in Patients with Severe Traumatic Brain Injury. Crit. Care 2010, 14, R13. [Google Scholar] [CrossRef]
- Kumar, T.P.; Paul, J.; Antony, S.; Paulose, C.S. Expression of Cholinergic, Insulin, Vitamin D Receptors and GLUT 3 in the Brainstem of Streptozotocin Induced Diabetic Rats: Effect of Treatment with Vitamin D3. Neurochem. Res. 2011, 36, 2116–2126. [Google Scholar] [CrossRef]
- Sung, C.-C.; Liao, M.-T.; Lu, K.-C.; Wu, C.-C. Role of Vitamin D in Insulin Resistance. J. Biomed. Biotechnol. 2012, 2012. [Google Scholar] [CrossRef]
- Ibi, M.; Sawada, H.; Nakanishi, M.; Kume, T.; Katsuki, H.; Kaneko, S.; Shimohama, S.; Akaike, A. Protective Effects of 1 Alpha,25-(OH)(2)D(3) against the Neurotoxicity of Glutamate and Reactive Oxygen Species in Mesencephalic Culture. Neuropharmacology 2001, 40, 761–771. [Google Scholar] [CrossRef]
- Tamilselvan, B.; Seshadri, K.G.; Venkatraman, G. Role of Vitamin D on the Expression of Glucose Transporters in L6 Myotubes. Ind. J. Endocrinol. Metab. 2013, 17 (Suppl. 1), S326–S328. [Google Scholar] [CrossRef]
- Leung, P.S. The Potential Protective Action of Vitamin D in Hepatic Insulin Resistance and Pancreatic Islet Dysfunction in Type 2 Diabetes Mellitus. Nutrients 2016, 8, 147. [Google Scholar] [CrossRef]
- Benetti, E.; Mastrocola, R.; Chiazza, F.; Nigro, D.; D’Antona, G.; Bordano, V.; Fantozzi, R.; Aragno, M.; Collino, M.; Minetto, M.A. Effects of Vitamin D on Insulin Resistance and Myosteatosis in Diet-Induced Obese Mice. PLoS ONE 2018, 13, e0189707. [Google Scholar] [CrossRef] [PubMed]
- Bartoccini, E.; Marini, F.; Damaskopoulou, E.; Lazzarini, R.; Cataldi, S.; Cascianelli, G.; Gil Garcia, M.; Albi, E. Nuclear Lipid Microdomains Regulate Nuclear Vitamin D3 Uptake and Influence Embryonic Hippocampal Cell Differentiation. Mol. Biol. Cell 2011, 22, 3022–3031. [Google Scholar] [CrossRef] [PubMed]
- Sisley, S.R.; Arble, D.M.; Chambers, A.P.; Gutierrez-Aguilar, R.; He, Y.; Xu, Y.; Gardner, D.; Moore, D.D.; Seeley, R.J.; Sandoval, D.A. Hypothalamic Vitamin D Improves Glucose Homeostasis and Reduces Weight. Diabetes 2016, 65, 2732–2741. [Google Scholar] [CrossRef] [PubMed] [Green Version]
- Balabanova, S.; Ritcher, H.P.; Antoniadis, G.; Homoki, J.; Kremmer, N.; Hanle, J.; Teller, W.M. 25-hydroxyvitamin D, 24, 25-dihydroxyvitamin D and 1,25-dihydroxyvitamin D in human cerebrospinal fluid. Klin. Wochenschr. 1984, 62, 1086–1090. [Google Scholar] [CrossRef]
- Langub, M.C.; Herman, J.P.; Malluche, H.H.; Koszewski, N.J. Evidence of functional vitamin D receptor in rat hippocampus. Neuroscience 2001, 104, 49–56. [Google Scholar] [CrossRef]
- Corremans, R.; Vervaet, B.A.; D’Haese, P.C.; Neven, E.; Verhulst, A. Metformin: A Candidate Drug for Renal Diseases. Int. J. Mol. Sci. 2018, 20, 42. [Google Scholar] [CrossRef]
- Zhang, X.; Zanello, L.P. Vitamin D Receptor-Dependent 1 Alpha,25(OH)2 Vitamin D3-Induced Anti-Apoptotic PI3K/AKT Signaling in Osteoblasts. J. Bone Miner. Res. 2008, 23, 1238–1248. [Google Scholar] [CrossRef]
- Wang, Q.; He, Y.; Shen, Y.; Zhang, Q.; Chen, D.; Zuo, C.; Qin, J.; Wang, H.; Wang, J.; Yu, Y. Vitamin D Inhibits COX-2 Expression and Inflammatory Response by Targeting Thioesterase Superfamily Member 4. J. Biol. Chem. 2014, 289, 11681–11694. [Google Scholar] [CrossRef] [Green Version]
- Iqbal, K.; Liu, F.; Gong, C.-X.; Alonso, A.D.C.; Grundke-Iqbal, I. Mechanisms of Tau-Induced Neurodegeneration. Acta Neuropathol. 2009, 118, 53–69. [Google Scholar] [CrossRef]
- Arneth, B.; Arneth, R.; Shams, M. Metabolomics of Type 1 and Type 2 Diabetes. Int. J. Mol. Sci. 2019, 20, 2467. [Google Scholar] [CrossRef]
- Hooper, C.; Killick, R.; Lovestone, S. The GSK3 Hypothesis of Alzheimer’s Disease. J. Neurochem. 2008, 104, 1433–1439. [Google Scholar] [CrossRef] [PubMed]
- Bouayed, J.; Bohn, T. Exogenous Antioxidants-Double-Edged Swords in Cellular Redox State: Health Beneficial Effects at Physiologic Doses versus Deleterious Effects at High Doses. Oxid. Med. Cell. Longev. 2010, 3, 228–237. [Google Scholar] [CrossRef] [PubMed]
- Fu, J.-Y.; Che, H.-L.; Tan, D.M.-Y.; Teng, K.-T. Bioavailability of Tocotrienols: Evidence in Human Studies. Nutr. Metab. 2014, 11, 5. [Google Scholar] [CrossRef] [PubMed]
- Rains, J.L.; Jain, S.K. Oxidative Stress, Insulin Signaling, and Diabetes. Free Radic. Biol. Med. 2011, 50, 567–575. [Google Scholar] [CrossRef] [PubMed]
- Moorthi, R.V.; Bobby, Z.; Selvaraj, N.; Sridhar, M.G. Vitamin E Protects the Insulin Sensitivity and Redox Balance in Rat L6 Muscle Cells Exposed to Oxidative Stress. Clin. Chim. Acta 2006, 367, 132–136. [Google Scholar] [CrossRef] [PubMed]
- Ingold, K.U.; Webb, A.C.; Witter, D.; Burton, G.W.; Metcalfe, T.A.; Muller, D.P. Vitamin E Remains the Major Lipid-Soluble, Chain-Breaking Antioxidant in Human Plasma Even in Individuals Suffering Severe Vitamin E Deficiency. Arch. Biochem. Biophys. 1987, 259, 224–225. [Google Scholar] [CrossRef]
- Sangeetha, K.N.; Shilpa, K.; Jyothi Kumari, P.; Lakshmi, B.S. Reversal of Dexamethasone Induced Insulin Resistance in 3T3L1 Adipocytes by 3β-Taraxerol of Mangifera Indica. Phytomedicine 2013, 20, 213–220. [Google Scholar] [CrossRef]


| Gene of Interest | Forward Primers | Reverse Primers |
|---|---|---|
| IR | CAACATTCGAGGAGGCAACAATC | CTCGAATCAGACGTAACTTCCGG |
| PI3K | TGGATGCTCTACAGGGCTTT | GTCTGGGTTCTCCCAATTCA |
| GLUT3 | TCCCCTCCGCTGCTCACTATTT | ATCTCCATGACGCCGTCCTTTC |
| GLUT4 | CCCTCAGAAGGTGATTGAACAG | AGAGATGATACCAATGAGGAAGG |
| GSK3β | CTAACACCACTGGAAGCTTGTGC | GATGGTAGCCAGAGGTGGATTAC |
| TAU | ACCTCCAAGTGTGGCTCATTAG | GGACGTGGGTGATATTGTCCAG |
| GAPDH | CAACTACATGGTTTACATGTTC | GCCAGTGGACTCCACGAC |
© 2019 by the authors. Licensee MDPI, Basel, Switzerland. This article is an open access article distributed under the terms and conditions of the Creative Commons Attribution (CC BY) license (http://creativecommons.org/licenses/by/4.0/).
Share and Cite
Zaulkffali, A.S.; Md Razip, N.N.; Syed Alwi, S.S.; Abd Jalil, A.; Abd Mutalib, M.S.; Gopalsamy, B.; Chang, S.K.; Zainal, Z.; Ibrahim, N.N.; Zakaria, Z.A.; et al. Vitamins D and E Stimulate the PI3K-AKT Signalling Pathway in Insulin-Resistant SK-N-SH Neuronal Cells. Nutrients 2019, 11, 2525. https://0-doi-org.brum.beds.ac.uk/10.3390/nu11102525
Zaulkffali AS, Md Razip NN, Syed Alwi SS, Abd Jalil A, Abd Mutalib MS, Gopalsamy B, Chang SK, Zainal Z, Ibrahim NN, Zakaria ZA, et al. Vitamins D and E Stimulate the PI3K-AKT Signalling Pathway in Insulin-Resistant SK-N-SH Neuronal Cells. Nutrients. 2019; 11(10):2525. https://0-doi-org.brum.beds.ac.uk/10.3390/nu11102525
Chicago/Turabian StyleZaulkffali, Amirah Salwani, Nurliyana Najwa Md Razip, Sharifah Sakinah Syed Alwi, Afifah Abd Jalil, Mohd Sokhini Abd Mutalib, Banulata Gopalsamy, Sui Kiat Chang, Zaida Zainal, Nafissa Nadia Ibrahim, Zainul Amiruddin Zakaria, and et al. 2019. "Vitamins D and E Stimulate the PI3K-AKT Signalling Pathway in Insulin-Resistant SK-N-SH Neuronal Cells" Nutrients 11, no. 10: 2525. https://0-doi-org.brum.beds.ac.uk/10.3390/nu11102525