Enteral Nutrition in Pediatric Patients Undergoing Hematopoietic SCT Promotes the Recovery of Gut Microbiome Homeostasis

 , , , , ,
  and
and 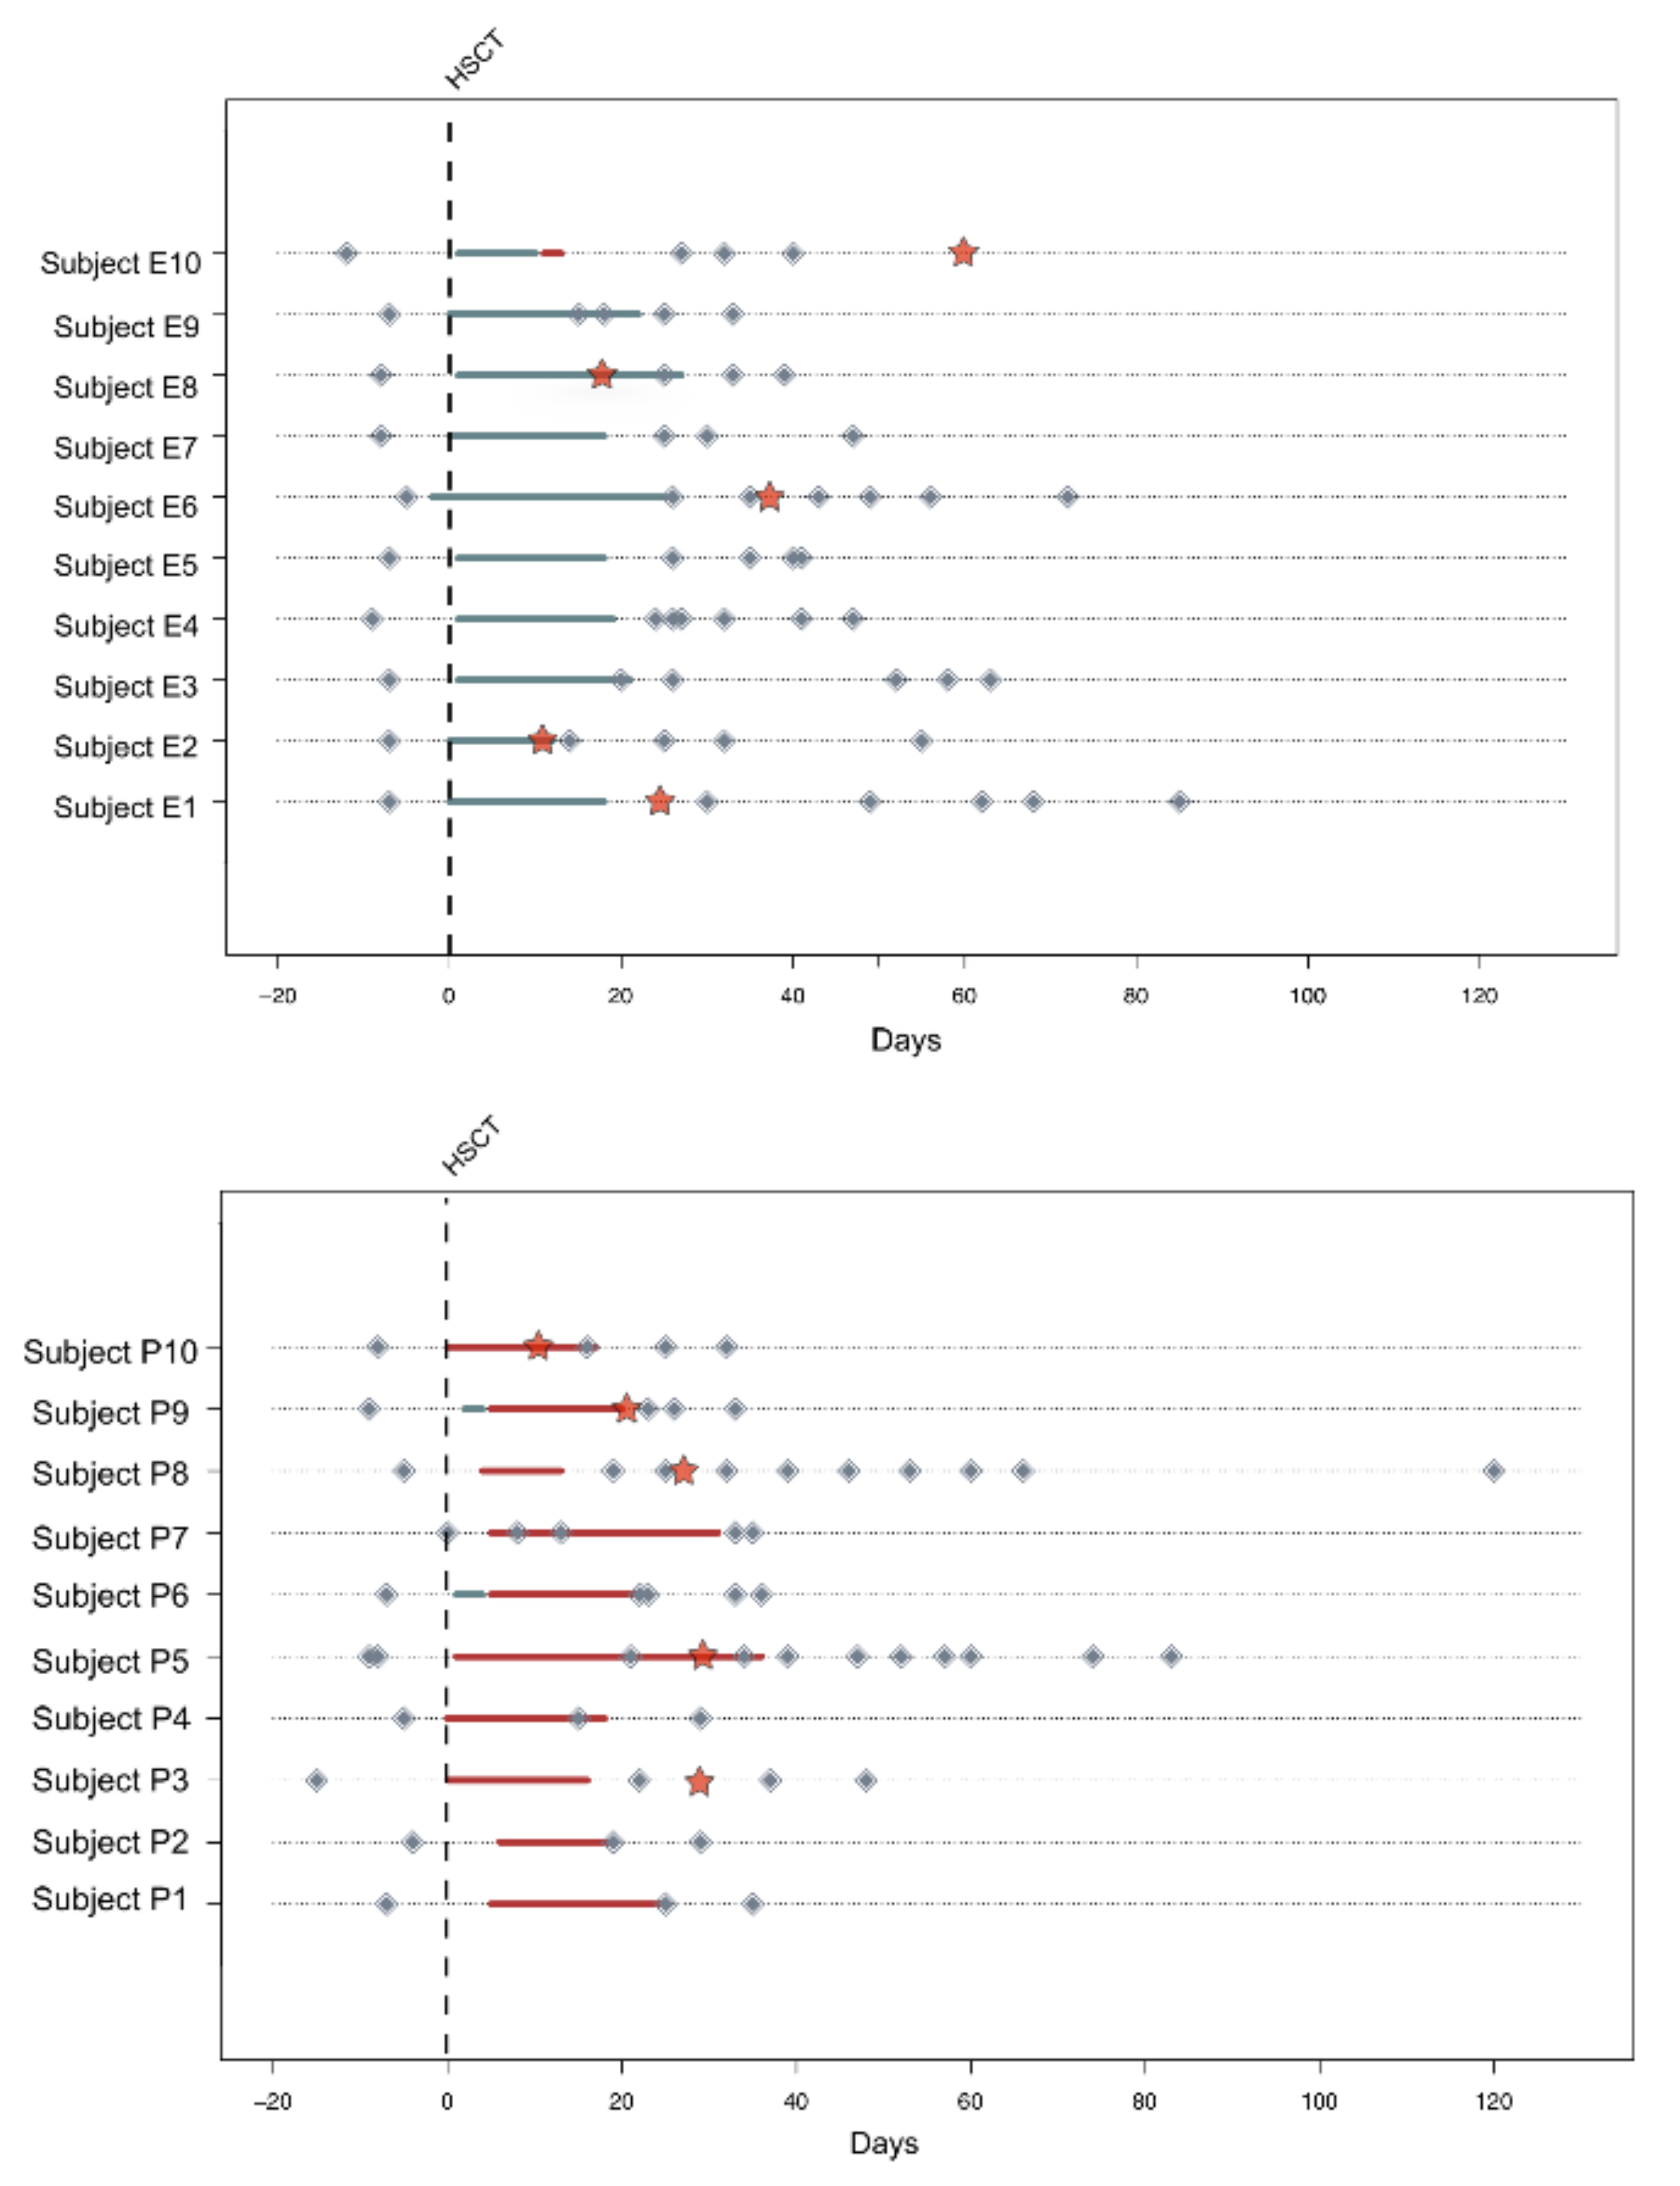
Abstract
:1. Introduction
2. Materials and Methods
2.1. Subject Enrollment and Sample Collection
2.2. Microbial DNA Extraction
2.3. 16S rRNA Gene Amplification and Sequencing
2.4. Gas Chromatography-Mass Spectrometry Determination of Short-Chain Fatty Acids in Fecal Samples
2.5. Bioinformatics and Statistical Analysis
3. Results
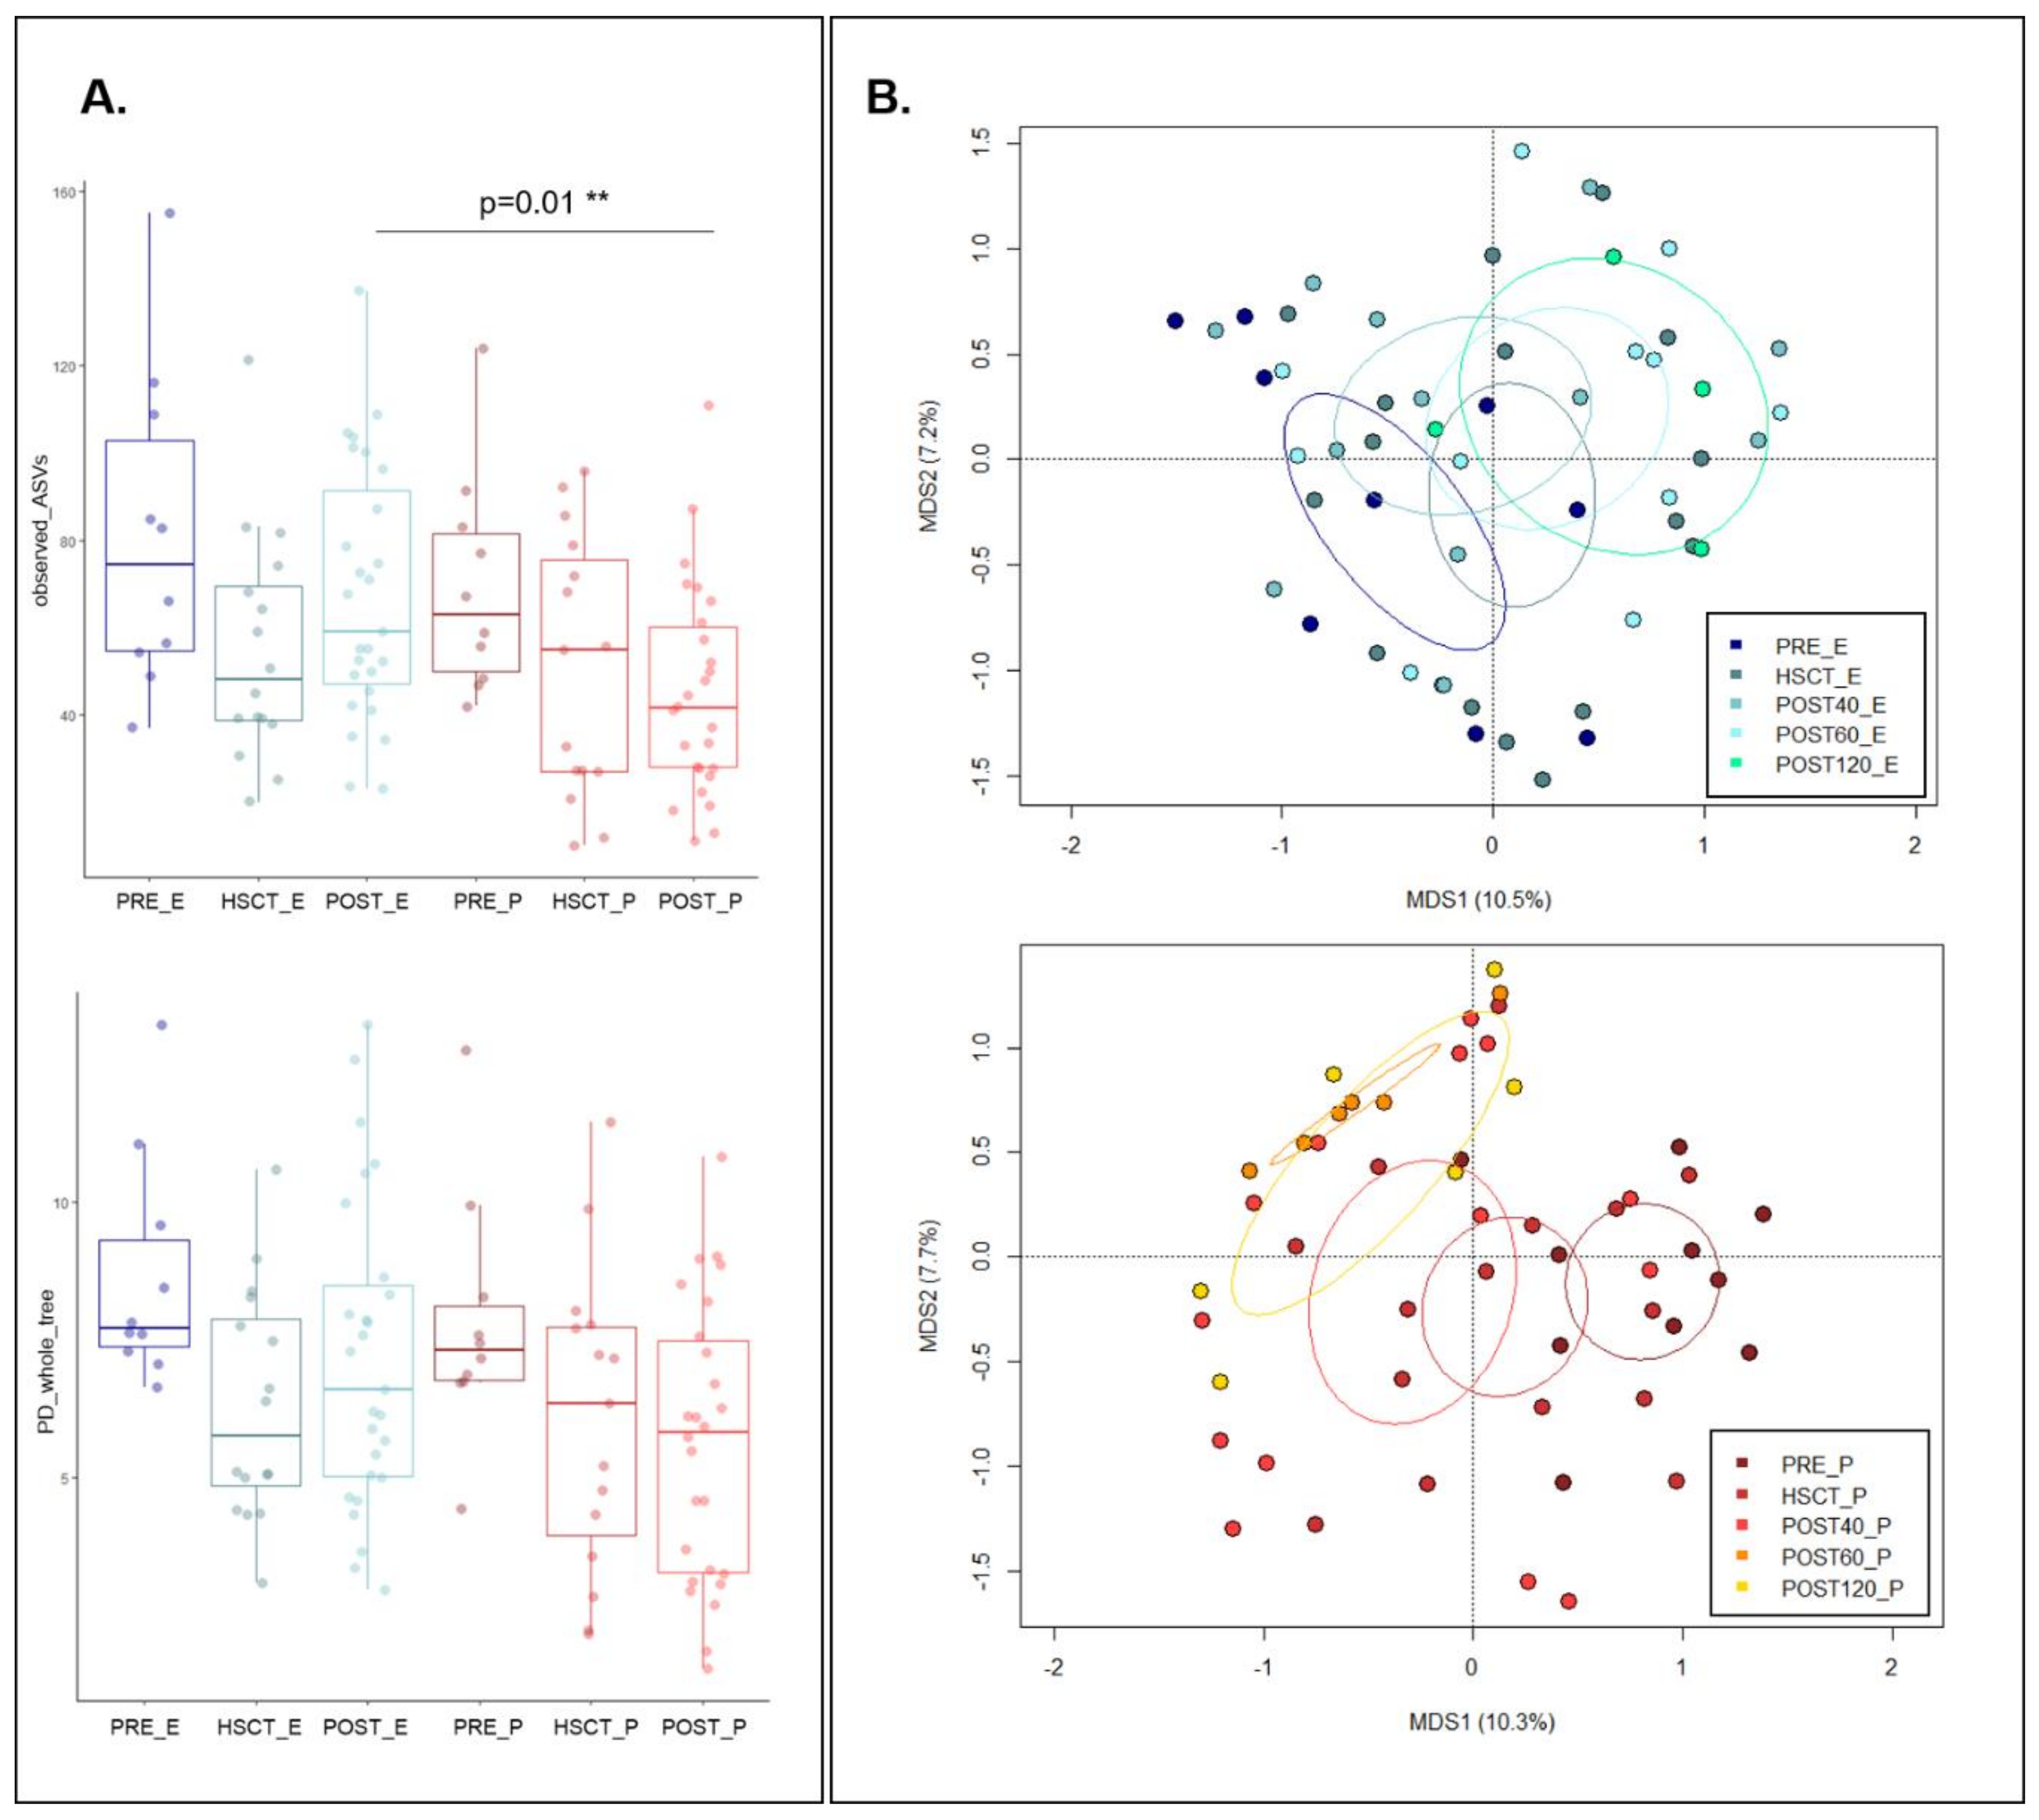
3.1. Variation in the Overall Bacterial Biodiversity in HSCT Patients during Enteral and Parenteral Feeding
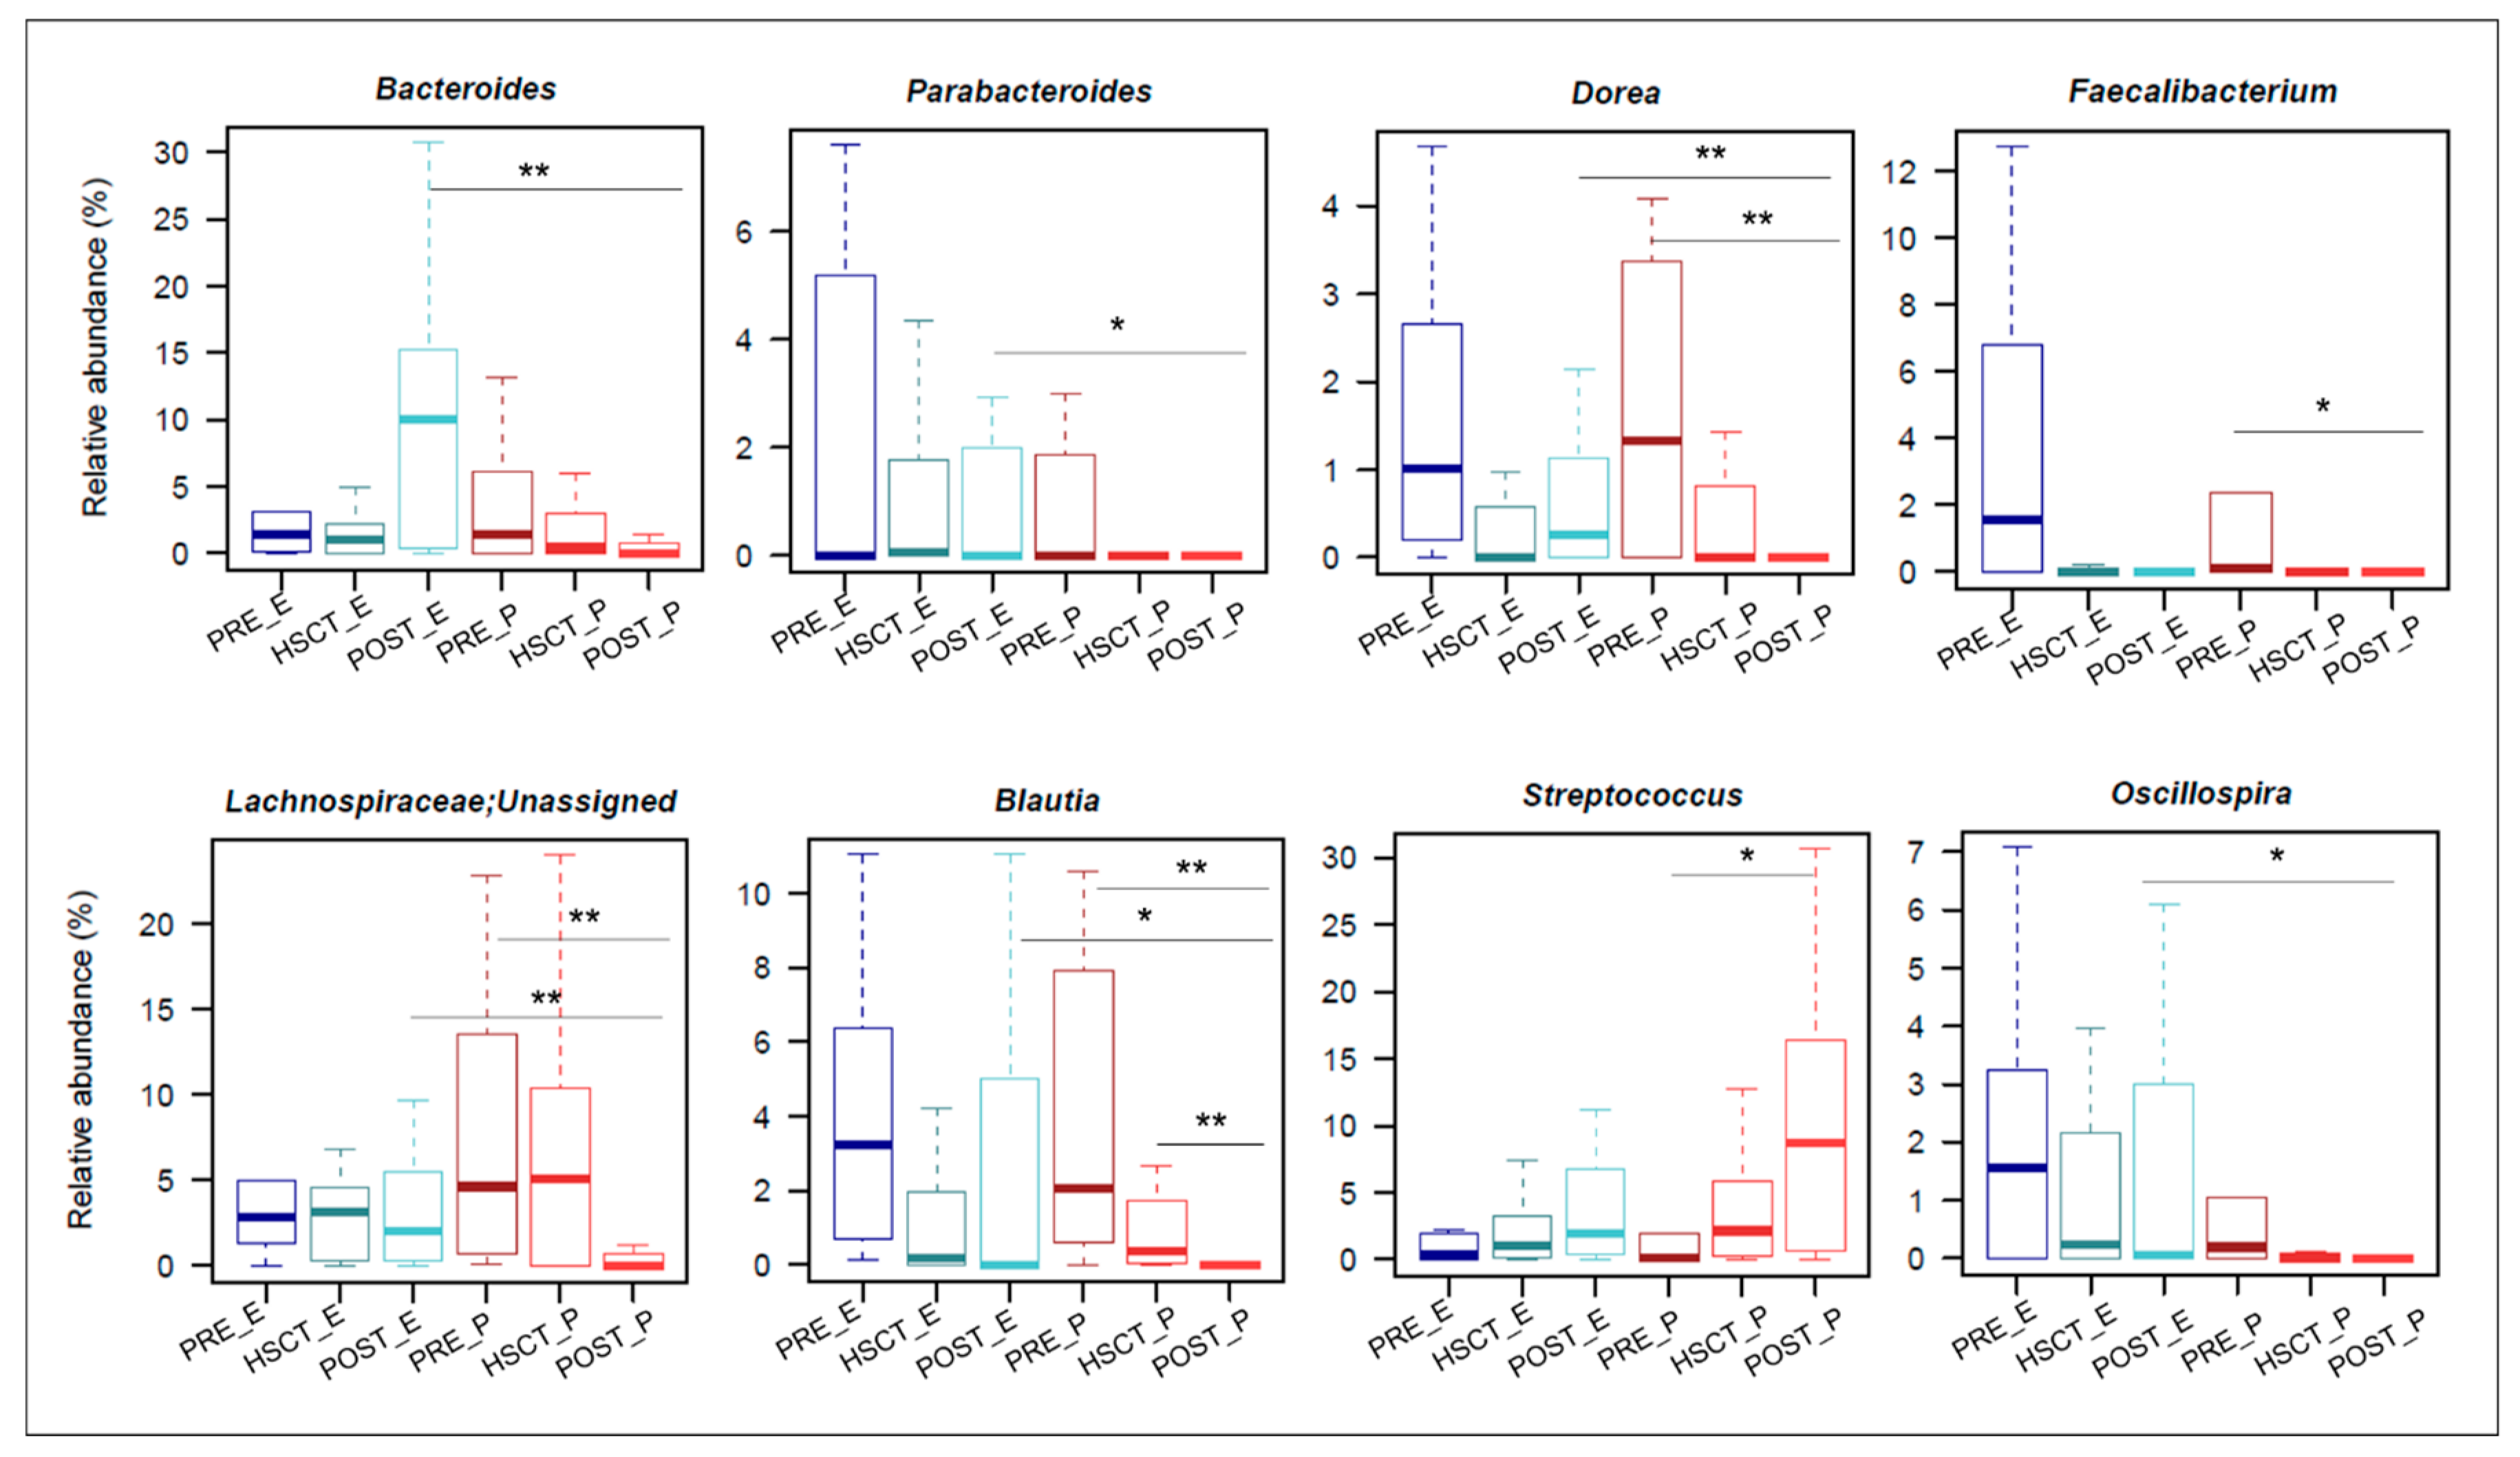
3.2. Gut Microbiota Composition in Enteral and Parenteral Nutritional Regimen during the HSCT Recovery
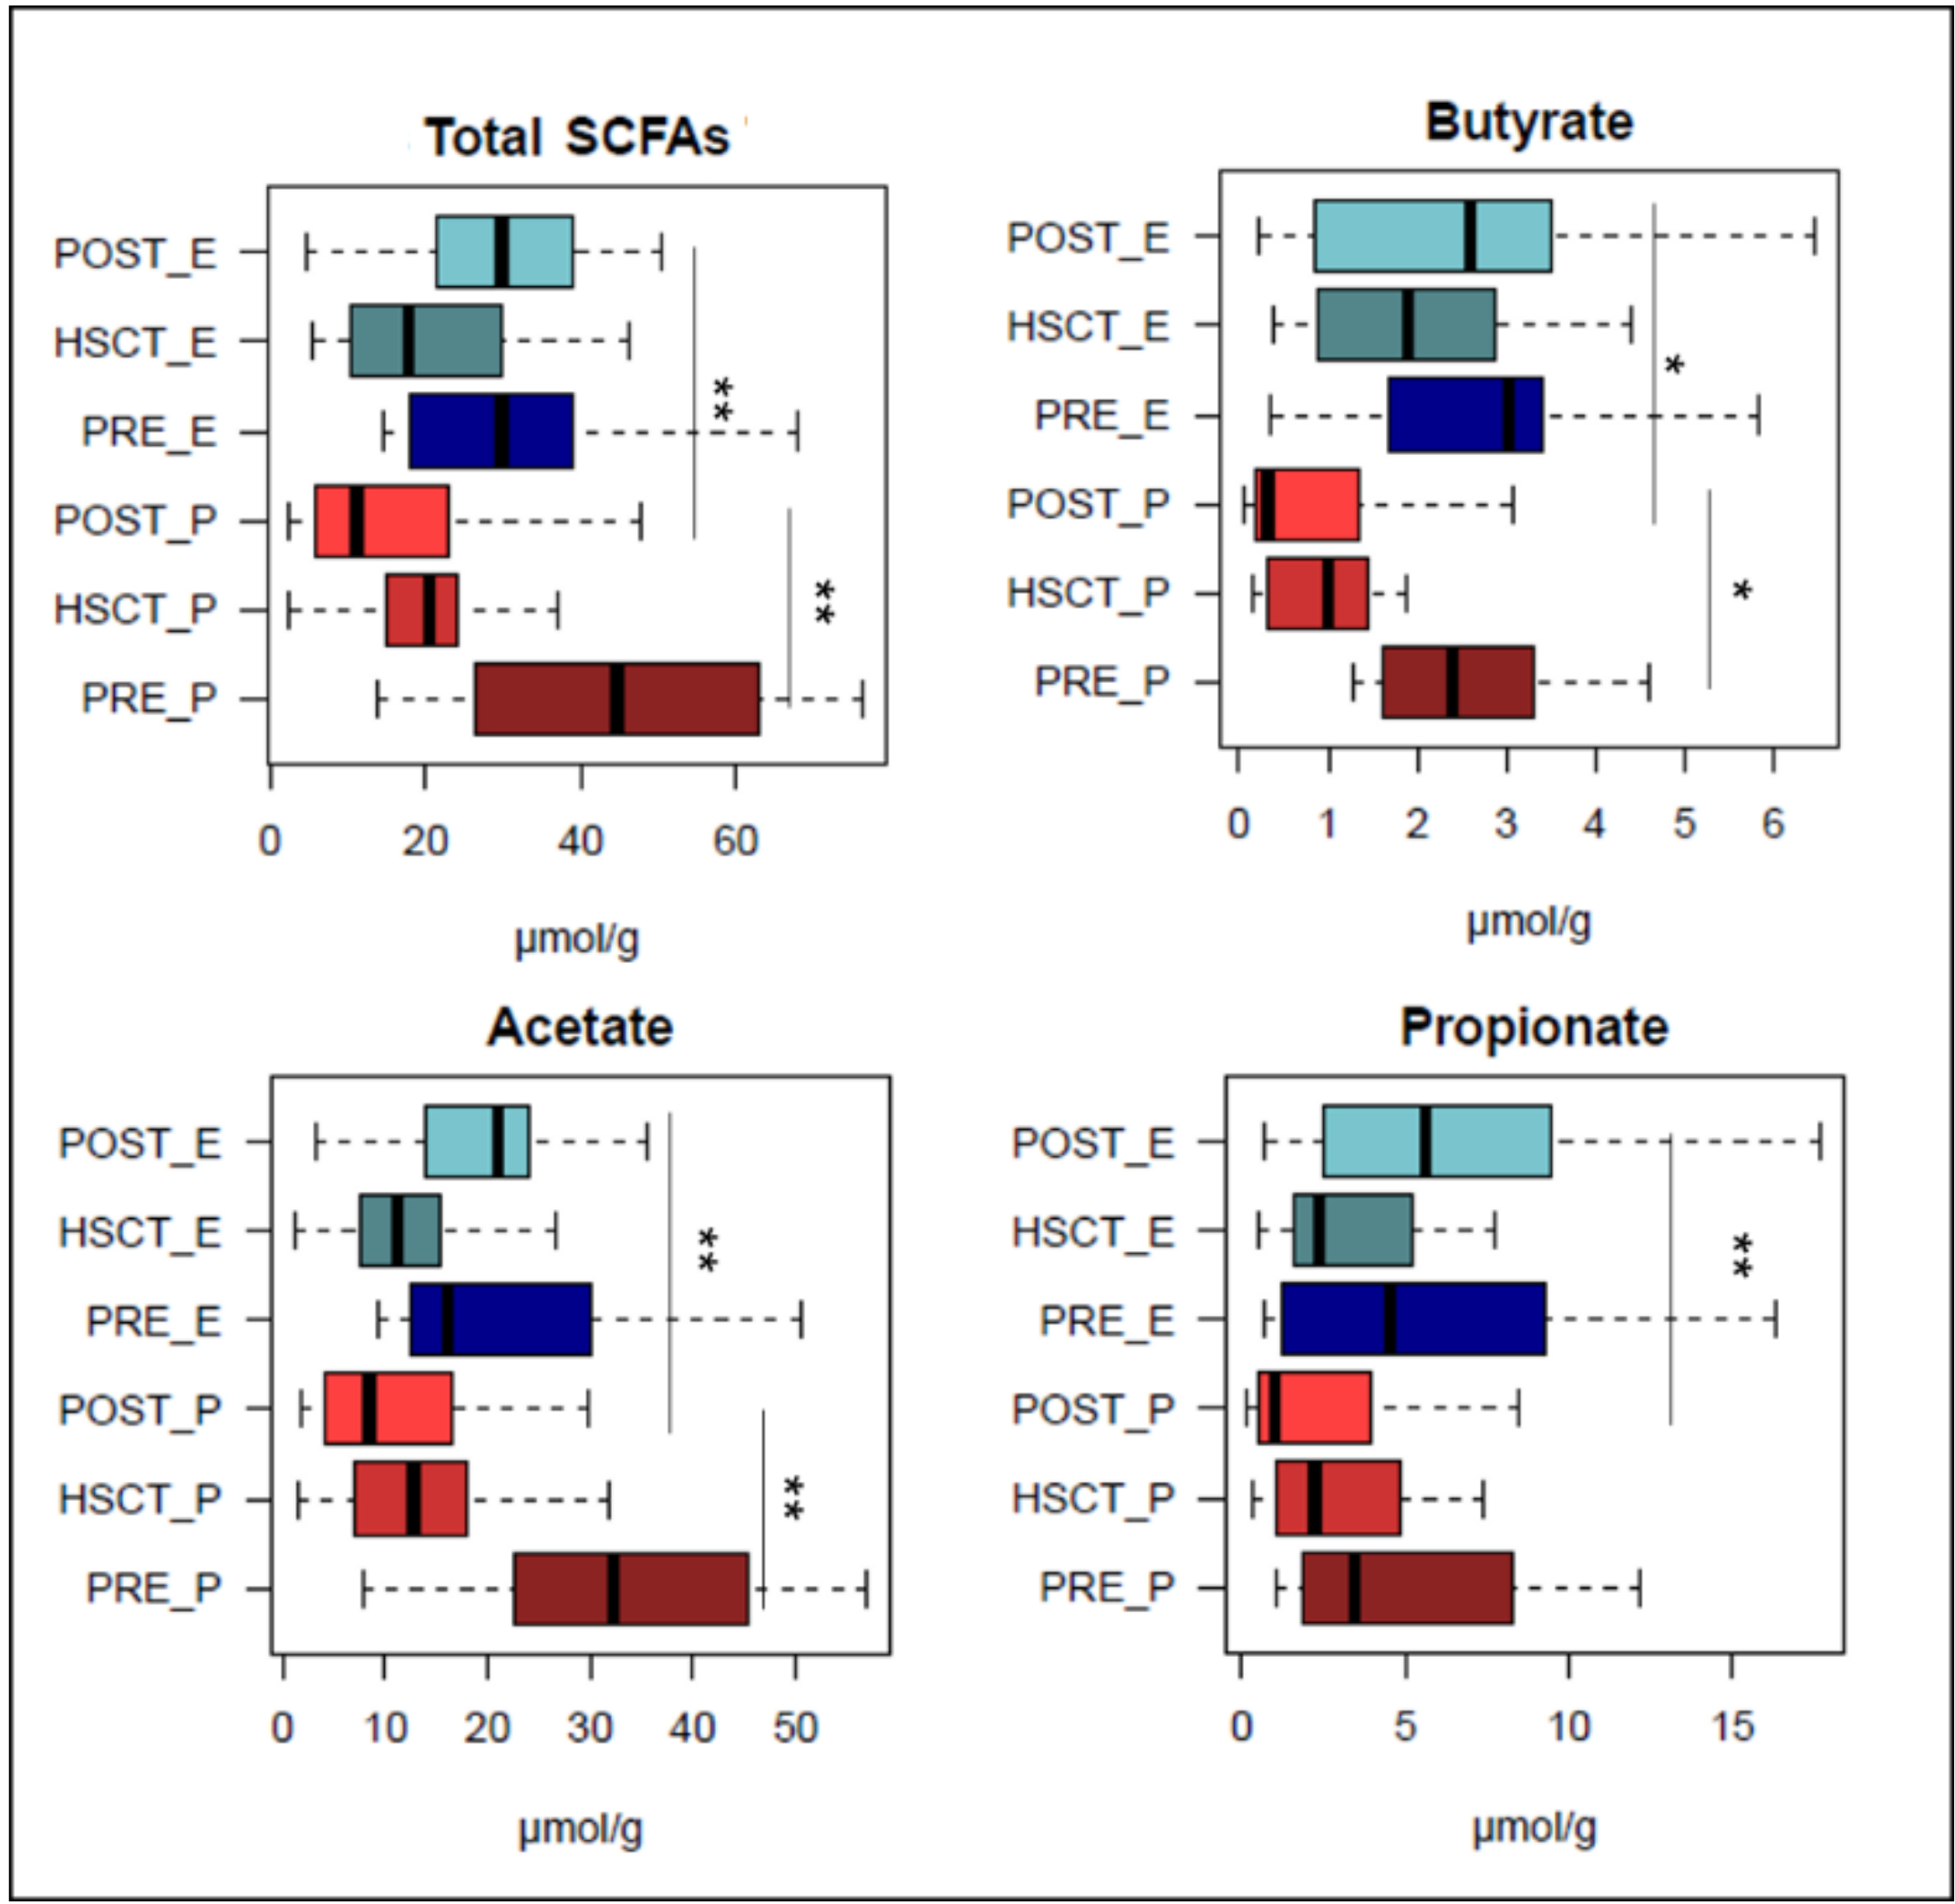
3.3. Short-Chain Fatty Acid Production in EN and PN Patients Undergoing HSCT
4. Discussion
Supplementary Materials
Author Contributions
Funding
Acknowledgments
Conflicts of Interest
References
- Jenq, R.R.; van den Brink, M.R.M. Allogeneic haematopoietic stem cell transplantation: Individualized stem cell and immune therapy of cancer. Nat. Rev. Cancer 2010, 10, 213–221. [Google Scholar] [CrossRef] [PubMed]
- Shono, Y.; van den Brink, M.R.M. Gut microbiota injury in allogeneic haematopoietic stem cell transplantation. Nat. Rev. Cancer 2018, 18, 283–295. [Google Scholar] [CrossRef] [PubMed]
- Zeiser, R.; Blazar, B.R. Acute graft-versus-host disease—Biologic process, prevention, and therapy. N. Engl. J. Med. 2017, 377, 2167–2179. [Google Scholar] [CrossRef] [PubMed]
- Biagi, E.; Zama, D.; Nastasi, C.; Consolandi, C.; Fiori, J.; Rampelli, S.; Turroni, S.; Centanni, M.; Severgnini, M.; Peano, C.; et al. Gut microbiota trajectory in pediatric patients undergoing hematopoietic SCT. Bone Marrow Transpl. 2015, 50, 992–998. [Google Scholar] [CrossRef] [Green Version]
- Biagi, E.; Zama, D.; Rampelli, S.; Turroni, S.; Brigidi, P.; Consolandi, C.; Severgnini, M.; Picotti, E.; Gasperini, P.; Merli, P.; et al. Early gut microbiota signature of aGvHD in children given allogeneic hematopoietic cell transplantation for hematological disorders. BMC Med. Genom. 2019, 12, 49. [Google Scholar] [CrossRef]
- Zama, D.; Biagi, E.; Masetti, R.; Gasperini, P.; Prete, A.; Candela, M.; Brigidi, P.; Pession, A. Gut microbiota and hematopoietic stem cell transplantation: Where do we stand? Bone Marrow Transpl. 2017, 52, 7–14. [Google Scholar] [CrossRef] [Green Version]
- Taur, Y.; Jenq, R.R.; Perales, M.A.; Littmann, E.R.; Morjaria, S.; Ling, L.; No, D.; Gobourne, A.; Viale, A.; Dahi, P.B.; et al. The effects of intestinal tract bacterial diversity on mortality following allogeneic hematopoietic stem cell transplantation. Blood 2014, 124, 1174–1182. [Google Scholar] [CrossRef]
- Hill, G.R.; Ferrara, J.L. The primacy of the gastrointestinal tract as a target organ of acute graft-versus-host disease: Rationale for the use of cytokine shields in allogeneic bone marrow transplantation. Blood 2000, 95, 2754–2759. [Google Scholar] [CrossRef]
- Koyama, M.; Mukhopadhyay, P.; Schuster, I.S.; Henden, A.S.; Hülsdünker, J.; Varelias, A.; Vetizou, M.; Kuns, R.D.; Robb, R.J.; Zhang, P.; et al. MHC Class II Antigen Presentation by the Intestinal Epithelium Initiates Graft-versus-Host Disease and Is Influenced by the Microbiota. Immunity 2019, 51, 885–898. [Google Scholar] [CrossRef]
- Bäckhed, F.; Ley, R.E.; Sonnenburg, J.L.; Peterson, D.A.; Gordon, J.I. Host-Bacterial mutualism in the human intestine. Science 2005, 307, 1915–1920. [Google Scholar]
- Rooks, M.G.; Garrett, W.S. Gut microbiota, metabolites and host immunity. Nat. Rev. Immunol. 2016, 16, 341–352. [Google Scholar] [CrossRef] [PubMed]
- Tremaroli, V.; Bäckhed, F. Functional interactions between the gut microbiota and host metabolism. Nature 2012, 489, 242–249. [Google Scholar] [CrossRef] [PubMed]
- Turroni, S.; Brigidi, P.; Cavalli, A.; Candela, M. Microbiota-Host transgenomic metabolism, bioactive molecules from the inside. J. Med. Chem. 2018, 61, 47–61. [Google Scholar] [CrossRef] [PubMed]
- Mathewson, N.D.; Jenq, R.; Mathew, A.V.; Koenigsknecht, M.; Hanash, A.; Toubai, T.; Oravecz-Wilson, K.; Wu, S.R.; Sun, Y.; Rossi, C.; et al. Gut microbiome-derived metabolites modulate intestinal epithelial cell damage and mitigate graft-versus-host disease. Nat. Immunol. 2016, 17, 505–513. [Google Scholar] [CrossRef]
- Petersson, J.; Schreiber, O.; Hansson, G.C.; Gendler, S.J.; Velcich, A.; Lundberg, J.O.; Roos, S.; Holm, L.; Phillipson, M. Importance and regulation of the colonic mucus barrier in a mouse model of colitis. Am. J. Physiol. Gastrointest. Liver Physiol. 2011, 300, G327–G333. [Google Scholar] [CrossRef] [Green Version]
- Fuji, S.; Einsele, H.; Savani, B.N.; Kapp, M. Systematic nutritional support in allogeneic hematopoietic stem cell transplant recipients. Biol. Blood Marrow Transpl. 2015, 21, 1707–1713. [Google Scholar] [CrossRef] [Green Version]
- Walrath, M.; Bacon, C.; Foley, S.; Fung, H.C. Gastrointestinal side effects and adequacy of enteral intake in hematopoietic stem cell transplant patients. Nutr. Clin. Pract. 2015, 30, 305–310. [Google Scholar] [CrossRef]
- Evans, J.C.; Hirani, S.P.; Needle, J.J. Nutritional and post-transplantation outcomes of enteral versus parenteral nutrition in pediatric hematopoietic stem cell transplantation: A systematic review of randomized and nonrandomized studies. Biol. Blood Marrow Transpl. 2019, 25, e252–e259. [Google Scholar] [CrossRef]
- Guièze, R.; Lemal, R.; Cabrespine, A.; Hermet, E.; Tournilhac, O.; Combal, C.; Bay, J.O.; Bouteloup, C. Enteral versus parenteral nutritional support in allogeneic haematopoietic stem-cell transplantation. Clin. Nutr. 2014, 33, 533–538. [Google Scholar] [CrossRef]
- Yilmaz, G.; Koksal, I.; Aydin, K.; Caylan, R.; Sucu, N.; Aksoy, F. Risk factors of catheterrelated bloodstream infections in parenteral nutrition catheterization. J. Parenter. Enter. Nutr. 2007, 31, 284–287. [Google Scholar] [CrossRef]
- Lough, M.; Watkins, R.; Campbell, M.; Carr, K.; Burnett, A.; Shenkin, A. Parenteral nutrition in bone marrow transplantation. Clin. Nutr. 1990, 9, 97–101. [Google Scholar] [CrossRef]
- Buchman, A.L.; Moukarzel, A.A.; Bhuta, S.; Belle, M.; Ament, M.E.; Eckhert, C.D.; Hollander, D.; Gornbein, J.; Kopple, J.D.; Vijayaroghavan, S.R. Parenteral nutrition is associated with intestinal morphologic and functional changes in humans. J. Parenter. Enter. Nutr. 1995, 19, 453–460. [Google Scholar] [CrossRef] [PubMed]
- Wang, J.; Tian, F.; Wang, P.; Zheng, H.; Zhang, Y.; Tian, H.; Zhang, L.; Gao, X.; Wang, X. Gut Microbiota as a Modulator of Paneth Cells During Parenteral Nutrition in Mice. JPEN J. Parenter. Enter. Nutr. 2018, 42, 1280–1287. [Google Scholar] [CrossRef] [PubMed]
- Dahlgren, A.F.; Pan, A.; Lam, V.; Gouthro, K.C.; Simpson, P.M.; Salzman, N.H.; Nghiem-Rao, T.H. Longitudinal changes in the gut microbiome of infants on total parenteral nutrition. Pediatric Res. 2019, 86, 107–114. [Google Scholar] [CrossRef] [PubMed]
- Yu, Z.; Morrison, M. Improved extraction of PCR-quality community DNA from digesta and fecal samples. Biotechniques 2004, 36, 808–812. [Google Scholar] [CrossRef] [PubMed]
- Klindworth, A.; Pruesse, E.; Schweer, T.; Peplies, J.; Quast, C.; Horn, M.; Glöckner, F.O. Evaluation of general 16S ribosomal RNA gene PCR primers for classical and next-generation sequencing-based diversity studies. Nucleic Acids Res. 2013, 41, e1. [Google Scholar] [CrossRef]
- Schnorr, S.L.; Candela, M.; Rampelli, S.; Centanni, M.; Consolandi, C.; Basaglia, G.; Turroni, S.; Biagi, E.; Peano, C.; Severgnini, M.; et al. Gut microbiome of the Hadza hunter-gatherers. Nat. Commun. 2014, 5, 3654. [Google Scholar] [CrossRef]
- Fiori, J.; Turroni, S.; Candela, M.; Brigidi, P.; Gotti, R. Simultaneous HS-SPME GC-MS determination of short chain fatty acids, trimethylamine and trimethylamine N-oxide for gut microbiota metabolic profile. Talanta 2018, 189, 573–578. [Google Scholar] [CrossRef]
- Masella, A.P.; Bartram, A.K.; Truszkowski, J.M.; Brown, D.G.; Neufeld, J.D. PANDAseq: Paired-end assembler for illumina sequences. BMC Bioinform. 2012, 13, 31. [Google Scholar] [CrossRef] [Green Version]
- Bolyen, E.; Rideout, J.R.; Dillon, M.R.; Bokulich, N.A.; Abnet, C.; Al-Ghalith, G.A.; Alexander, H.; Alm, E.J.; Arumugam, M.; Asnicar, F.; et al. QIIME 2: Reproducible, interactive, scalable, and extensible microbiome data science. PeerJ 2018. [Google Scholar] [CrossRef]
- Callahan, B.J.; McMurdie, P.J.; Rosen, M.J.; Han, A.W.; Johnson, A.J.; Holmes, S.P. DADA2: High-resolution sample inference from Illumina amplicon data. Nat. Methods 2016, 13, 581–583. [Google Scholar] [CrossRef] [PubMed] [Green Version]
- Callahan, B.J.; McMurdie, P.J.; Holmes, S.P. Exact sequence variants should replace operational taxonomic units in marker-gene data analysis. ISME J. 2017, 11, 2639–2643. [Google Scholar] [CrossRef] [PubMed] [Green Version]
- Rognes, T.; Flouri, T.; Nichols, B.; Quince, C.; Mahé, F. VSEARCH: A versatile open source tool for metagenomics. PeerJ 2016, 4, e2584. [Google Scholar] [CrossRef] [PubMed]
- The R Project for Statistical Computing. Available online: https://www.r-project.org/ (accessed on 26 April 2019).
- Ordination Methods, Diversity Analysis and Other Functions for Community and Vegetation Ecologists. Available online: http://www.cran.r-project.org/package=vegan/ (accessed on 24 April 2019).
- Culhane, A.C.; Thioulouse, J.; Perrière, G.; Higgins, D.G. MADE4: An R package for multivariate analysis of gene expression data. Bioinformatics 2005, 21, 2789–2790. [Google Scholar] [CrossRef] [PubMed] [Green Version]
- Arends, J.; Bachmann, P.; Baracos, V.; Barthelemy, N.; Bertz, H.; Bozzetti, F.; Fearon, K.; Hütterer, E.; Isenring, E.; Kaasa, S.; et al. ESPEN guidelines on nutrition in cancer patients. Clin. Nutr. 2017, 36, 11–48. [Google Scholar] [CrossRef] [PubMed] [Green Version]
- Seguy, D.; Duhamel, A.; Rejeb, M.B.; Gomez, E.; Buhl, N.D.; Bruno, B.; Cortot, A. Yakoub-Agha, I. Better outcome of patients undergoing enteral tube feeding after myeloablative conditioning for allogeneic stem cell transplantation. Transplantation 2012, 94, 287–294. [Google Scholar] [CrossRef] [PubMed]
- Azarnoush, S.; Bruno, B.; Beghin, L.; Guimber, D.; Nelken, B.; Yakoub-Agha, I.; Seguy, D. Enteral nutrition: A first option for nutritional support of children following allo-SCT? Bone Marrow Transpl. 2012, 47, 1191–1195. [Google Scholar] [CrossRef] [Green Version]
- Noor, F.; Kaysen, A.; Wilmes, P.; Schneider, J.G. The gut microbiota and hematopoietic stem cell transplantation: Challenges and potentials. J. Innate Immun. 2019, 11, 405–415. [Google Scholar] [CrossRef]
- Wilmanski, T.; Rappaport, N.; Earls, J.C.; Magis, A.T.; Manor, O.; Lovejoy, J.; Omenn, G.S.; Hood, L.; Gibbons, S.M.; Price, N.D. Blood metabolome predicts gut microbiome α-diversity in humans. Nat. Biotechnol. 2019, 37, 1217–1228. [Google Scholar] [CrossRef]
- Reikvam, H.; Grønningsæter, I.S.; Mosevoll, K.A.; Lindås, R.; Hatfield, K.; Bruserud, O. Patients with Treatment-Requiring Chronic Graft versus Host Disease after Allogeneic Stem Cell Transplantation Have Altered Metabolic Profiles due to the Disease and Immunosuppressive Therapy: Potential Implication for Biomarkers. Front. Immunol. 2017, 8, 1979. [Google Scholar] [CrossRef] [Green Version]
- Andersen, S.; Staudacher, H.; Weber, N.; Kennedy, G.; Varelias, A.; Banks, M.; Bauer, J. Pilot study investigating the effect of enteral and parenteral nutrition on the gastrointestinal microbiome post-allogeneic transplantation. Br. J. Haematol. 2019. [Google Scholar] [CrossRef] [PubMed]
- Macy, J.M.; Ljungdahl, L.G.; Gottschalk, G. Pathway of succinate and propionate formation in Bacteroides fragilis. J. Bacteriol. 1978, 134, 84–91. [Google Scholar] [PubMed]
- Macy, J.M.; Probst, I. The biology of gastrointestinal Bacteroides. Annu. Rev. Microbiol. 1979, 33, 561–594. [Google Scholar] [CrossRef] [PubMed]
- Reichardt, N.; Duncan, S.H.; Young, P.; Belenguer, A.; McWilliam Leitch, C.; Scott, K.P.; Flint, H.J.; Louis, P. Phylogenetic distribution of three pathways for propionate production within the human gut microbiota. ISME J. 2014, 8, 1323–1335. [Google Scholar] [CrossRef] [Green Version]
- Lordan, C.; Thapa, D.; Ross, R.P.; Cotter, P.D. Potential for enriching next-generation health-promoting gut bacteria through prebiotics and other dietary components. Gut Microbes 2019, 22, 1–20. [Google Scholar] [CrossRef] [Green Version]
- Morrison, D.J.; Preston, T. Formation of short chain fatty acids by the gut microbiota and their impact on human metabolism. Gut Microbes 2016, 7, 189–200. [Google Scholar] [CrossRef] [Green Version]
- Anand, S.; Kaur, H.; Mande, S.S. Comparative in silico analysis of butyrate production pathways in gut commensals and pathogens. Front. Microbiol. 2016, 7, 1945. [Google Scholar] [CrossRef] [Green Version]
- Tvedt, T.H.A.; Skaarud, K.J.; Tjønnfjord, G.E.; Gedde-Dahl, T.; Iversen, P.O.; Bruserud, Ø. The systemic metabolic profile early after allogeneic stem cell transplantation: Effects of adequate energy support administered through enteral feeding tube. Biol. Blood Marrow Transpl. 2019. [Google Scholar] [CrossRef]
- Jenq, R.R.; Taur, Y.; Devlin, S.M.; Ponce, D.M.; Goldberg, J.D.; Ahr, K.F.; Littmann, E.R.; Ling, L.; Gobourne, A.C.; Miller, L.C.; et al. Intestinal Blautia is associated with reduced death from Graft-versus-Host Disease. Biol. Blood Marrow Transpl. 2015, 21, 1373–1383. [Google Scholar] [CrossRef] [Green Version]
- Skaarud, K.J.; Veierød, M.B.; Lergenmuller, S.; Bye, A.; Iversen, P.O.; Tjønnfjord, G.E. Body weight, body composition and survival after 1 year: Follow-up of a nutritional intervention trial in allo-HSCT recipients. Bone Marrow Transpl. 2019. [Google Scholar] [CrossRef]
- Skaarud, K.J.; Hjermstad, M.J.; Bye, A.; Veierød, M.B.; Gudmundstuen, A.M.; Lundin, K.E.A.; Distante, S.; Brinch, L.; Tjønnfjord, G.E.; Iversen, P.O. Effects of individualized nutrition after allogeneic hematopoietic stem cell transplantation following myeloablative conditioning; a randomized controlled trial. Clin. Nutr. ESPEN 2018, 28, 59–66. [Google Scholar] [CrossRef] [PubMed] [Green Version]


© 2019 by the authors. Licensee MDPI, Basel, Switzerland. This article is an open access article distributed under the terms and conditions of the Creative Commons Attribution (CC BY) license (http://creativecommons.org/licenses/by/4.0/).
Share and Cite
D’Amico, F.; Biagi, E.; Rampelli, S.; Fiori, J.; Zama, D.; Soverini, M.; Barone, M.; Leardini, D.; Muratore, E.; Prete, A.; et al. Enteral Nutrition in Pediatric Patients Undergoing Hematopoietic SCT Promotes the Recovery of Gut Microbiome Homeostasis. Nutrients 2019, 11, 2958. https://0-doi-org.brum.beds.ac.uk/10.3390/nu11122958
D’Amico F, Biagi E, Rampelli S, Fiori J, Zama D, Soverini M, Barone M, Leardini D, Muratore E, Prete A, et al. Enteral Nutrition in Pediatric Patients Undergoing Hematopoietic SCT Promotes the Recovery of Gut Microbiome Homeostasis. Nutrients. 2019; 11(12):2958. https://0-doi-org.brum.beds.ac.uk/10.3390/nu11122958
Chicago/Turabian StyleD’Amico, Federica, Elena Biagi, Simone Rampelli, Jessica Fiori, Daniele Zama, Matteo Soverini, Monica Barone, Davide Leardini, Edoardo Muratore, Arcangelo Prete, and et al. 2019. "Enteral Nutrition in Pediatric Patients Undergoing Hematopoietic SCT Promotes the Recovery of Gut Microbiome Homeostasis" Nutrients 11, no. 12: 2958. https://0-doi-org.brum.beds.ac.uk/10.3390/nu11122958