Article

Time and Age Trends in Free Sugar Intake from Food Groups among Children and Adolescents between 1985 and 2016

1
Institute of Nutritional and Food Sciences-Nutritional Epidemiology, University of Bonn, Donald Study Dortmund, Heinstück 11, 44225 Dortmund, Germany
2
Institute of General Practice and Family Medicine, Faculty of Medicine, Ruhr-University Bochum, Universitätsstraße 150, 44801 Bochum, Germany
3
Institute of Nutrition, Consumption and Health, Faculty of Natural Sciences, Paderborn University, Warburger Straße 100, 33098 Paderborn, Germany
*
Author to whom correspondence should be addressed.
Submission received: 27 November 2019 / Revised: 16 December 2019 / Accepted: 17 December 2019 / Published: 20 December 2019
(This article belongs to the Section Nutritional Epidemiology)

Abstract

:
Trend analyses suggest that free sugar (FS) intake—while still exceeding 10%E—has decreased among German children and adolescents since 2005, yet that intakes may shift from sugars naturally occurring in foods to added sugars as children age. Thus, we analysed time and age trends in FS intake (%E) from food groups among 3–18 year-olds (1985–2016) using 10,761 3-day dietary records from 1312 DONALD participants (660 boys, 652 girls) by use of polynomial mixed-effects regression models. Among girls, FS from sugar & sweets decreased from 1985 to 2016 (linear trend p < 0.0001), but not among boys (p > 0.05). In the total sample, FS intake from juices increased until 2000 and decreased since 2005 (linear, quadratic trend p < 0.0001). FS from sugar sweetened beverages (SSB) decreased non-linearly from 1985 to 2016 (girls: linear, quadratic, cubic trend p < 0.0001; boys: linear, quadratic, cubic trend p < 0.02). Younger children consumed more FS from juices than older ones, who had a higher FS intake from SSB. FS intake from sugar & sweets increased until early adolescence and decreased afterwards. Since sugar & sweets represent the main source of FS intake and the source with the least pronounced decline in intake, public health measures should focus on these products.

1. Introduction

A high dietary sugar intake is thought to contribute to the development of several diseases such as dental caries [1], overweight and obesity [2,3,4,5], cardiovascular diseases [6,7,8] or metabolic syndrome [9]. With the recent shift towards food-based recommendations, evidence has emerged regarding the relevance of specific food source of sugar for health outcomes [10,11,12,13,14,15,16]. In particular, a high intake of sugars from liquid sources may be detrimental for health: Due to a lack of satiety [17] and incomplete compensation of liquid calories [10], a high sugar intake from SSB promotes weight gain and the development of overweight [3,12,13,18] or diabetes [11,15]. Since pure juices can have sugar and energy contents similar to SSB [16], intakes of juices are also of public health relevance.
Within the term “free sugar” [15] the World Health Organization (WHO) considers “all monosaccharides and disaccharides added to foods by the manufacturer, cook or consumer, plus sugars naturally present in honey, syrups and fruit juices” [19]. In addition, the UK Scientific Advisory Committee on Nutrition (SCAN) has recently recommended extending the term of FS to fruits and vegetables purees and pastes and similar products in which the cell structure was destroyed during processing [20,21]. International and national organizations recommend limitting FS intake to a maximum of 10% of energy intake (%E) [20,21,22,23]. However, this recommendation as well as some possible health consequences of high sugar intake are controversially discussed, in particular by the food industry [24,25].
As the sweet preference is higher in childhood and adolescence than in adulthood [26,27,28], these ages are particularly vulnerable to the health consequences of high sugar intakes. In fact, recent publications indicated a high intake of FS among European children and adolescents, exceeding the 10%E limit to a larger extent than among adults [29,30,31]. Such a high sugar intake may be of particular relevance, as adolescence is suggested to be a “critical period” for the development of various diseases in later life [32,33,34,35] and dietary patterns have been shown to track into adulthood [36].
However, dietary habits may change with time and with increasing age, as the sweet preference is already decreasing from childhood to adolescence [26,27,28]. Recent trend analyses among German children and adolescents from the DONALD (Dortmund Nutritional and Anthropometric Longitudinally Designed) study cohort showed a decline in free sugar intake (in %E, model adjusted among others for overweight status) since 1985, most notably since 2010 [30]. Age trends in total, added and free sugar intake suggest a shift from those sugars naturally occurring in fruits, milk, and juices to those added to foods and beverages, e.g., sweets and sweetened beverages from 3 to 18 years of age [30]. However, as daily FS intake still exceeded 10%E over the complete study course and age range [30], initiatives to further reduce FS intake among children and adolescents are needed.
For the development of tailored public health measures for FS reduction, data on FS food sources preferred by children and adolescents are crucial. Therefore, we analysed time and age trends in food group sources of FS from three decades (1985–2016) among children and adolescents aged 3–18 years, using data from 3-day weighed dietary records from the DONALD study.

2. Materials and Methods

2.1. Study Sample

The DONALD study is an ongoing, open cohort study conducted in Dortmund, Germany, which started to collect information on diet, growth, development and metabolism of healthy children and adolescents in 1985. Since then, 35–40 infants are newly recruited every year. Eligible are healthy German infants (i.e., infants free of diseases affecting growth and/or dietary intake), whose parents are willing to participate in a long-term study and of whom at least one has sufficient knowledge of the German language. The participants are first examined at the age of 3 months and return for three more visits in the first year, two in the second year and thereafter annually until young adulthood. In the first study years, approximately 300 participants >2 years old were also recruited. Yearly examinations include 3-day weighed dietary records, anthropometric measurements, collection of 24-h urine samples (starting at age 3–4 years), interviews on lifestyle and medical examinations. Parental examinations (anthropometric measurements, lifestyle interviews) take place every four years. Further details on the study have been described elsewhere [37,38]. The study was approved by the Ethics Committee of the University of Bonn according to the guidelines of the Declaration of Helsinki, and all examinations are performed with parental and later on, children’s written consent.
At the start of the dataset compilation for the current investigation (October 2017) 17,107 records were available from the DONALD database. Incomplete records (<3 days, n = 176) were excluded as well as records from <3 years old (n = 5618) or >18 years old (n = 421) participants and records carried out after December 2016 (n = 131). For the present evaluation, we hence analysed 10,761 complete dietary records from 1312 DONALD study participants (660 boys, 652 girls). Per participant, between one (n = 153, 11.7%) and sixteen (n = 184, 14.0%) dietary records [median (Q1; Q3): 8 (3; 13)] were available.

2.2. Nutrition Assessment

Dietary intake in the DONALD study is assessed using 3-day weighed dietary records. All foods and beverages consumed by the child, as well as leftovers, are weighed and recorded over three consecutive days by the parents or by the older participants themselves, with the use of electronic food scales (±1 g). The participants choose the day of the beginning of dietary recording within a given period of time. When exact weighing is not possible, household measures (e.g., spoons, cups) are allowed for semi-quantitative recording. Information on recipes (ingredients and preparation) and on the types and brands of food items consumed is also requested. Medication and dietary supplement use are also recorded but were excluded from this analysis. A trained dietitian checks the dietary records for accuracy and completeness. Subsequently, energy and nutrition intakes are calculated using our continuously updated in-house nutrient database LEBTAB [39]. The composition of staple foods is based on the German food composition tables BLS 3.02. Energy and nutrient contents of commercial food products, i.e., processed foods and ready-to-eat-meals are estimated by recipe simulation using labelled ingredients and nutrient contents. FS was defined according to the definition by SACN [20,21], including added sugars plus sugars from fruit juices, vegetable juices, juice spritzers and smoothies. Energy, nutrient and food group intakes were calculated as individual means of three days of recording.

2.3. Definitions of Outcome Variables

FS intake from the following food groups were examined as outcome variables: sugar & sweets, dairy products, juices, sugar sweetened beverages [SSB], sweet bread & cakes, ready to eat breakfast cereals [RTC], others. The intake of FS from fruits & vegetables was very low (<2% of FS intake, Figure 1), so we decided not to carry out any trend analyses for this outcome. Definitions of the eight food groups are shown in Table 1. Sugar intakes were calculated as the percentage of total daily energy intake (%E) to enable comparison of sugar intake between different age groups and energy intake levels.

2.4. Assessment of Potential Confounding Factors

For this analysis, the following characteristics were considered as potentially confounding factors: sex (boy/girl), overweight status (yes/no), number of weekdays per 3-day record (1/2/3), maternal overweight (yes/no), high maternal educational status (yes/no), maternal employment (yes/no). Height and weight are measured by nurses according to standard procedures with the participants dressed in underwear only and barefoot. From the age of 2 years onwards, standing height is measured to the nearest 0.1 cm using a digital stadiometer (Harpenden, Crymych, UK). Body weight is measured to the nearest 100 g using an electronic scale (Seca 753E; Seca Weighing and Measuring System). Body mass index (BMI [kg/m2]) was calculated as the body weight (kg) divided by the square of the body height (m). Overweight was defined according to International Obesity Task Force’s (IOTF) BMI cutoff values for children and adolescents [40,41]. Maternal body weight and height are measured with the same equipment as for the participants. Maternal overweight was defined as a BMI ≥ 25 kg/m2. High maternal educational status (≥12 years of schooling) and maternal employment are inquired with a standardized questionnaire. For missing values, the respective median of the total sample was used (n = 38 for maternal overweight, n = 5 for maternal educational status).

2.5. Statistical Analysis
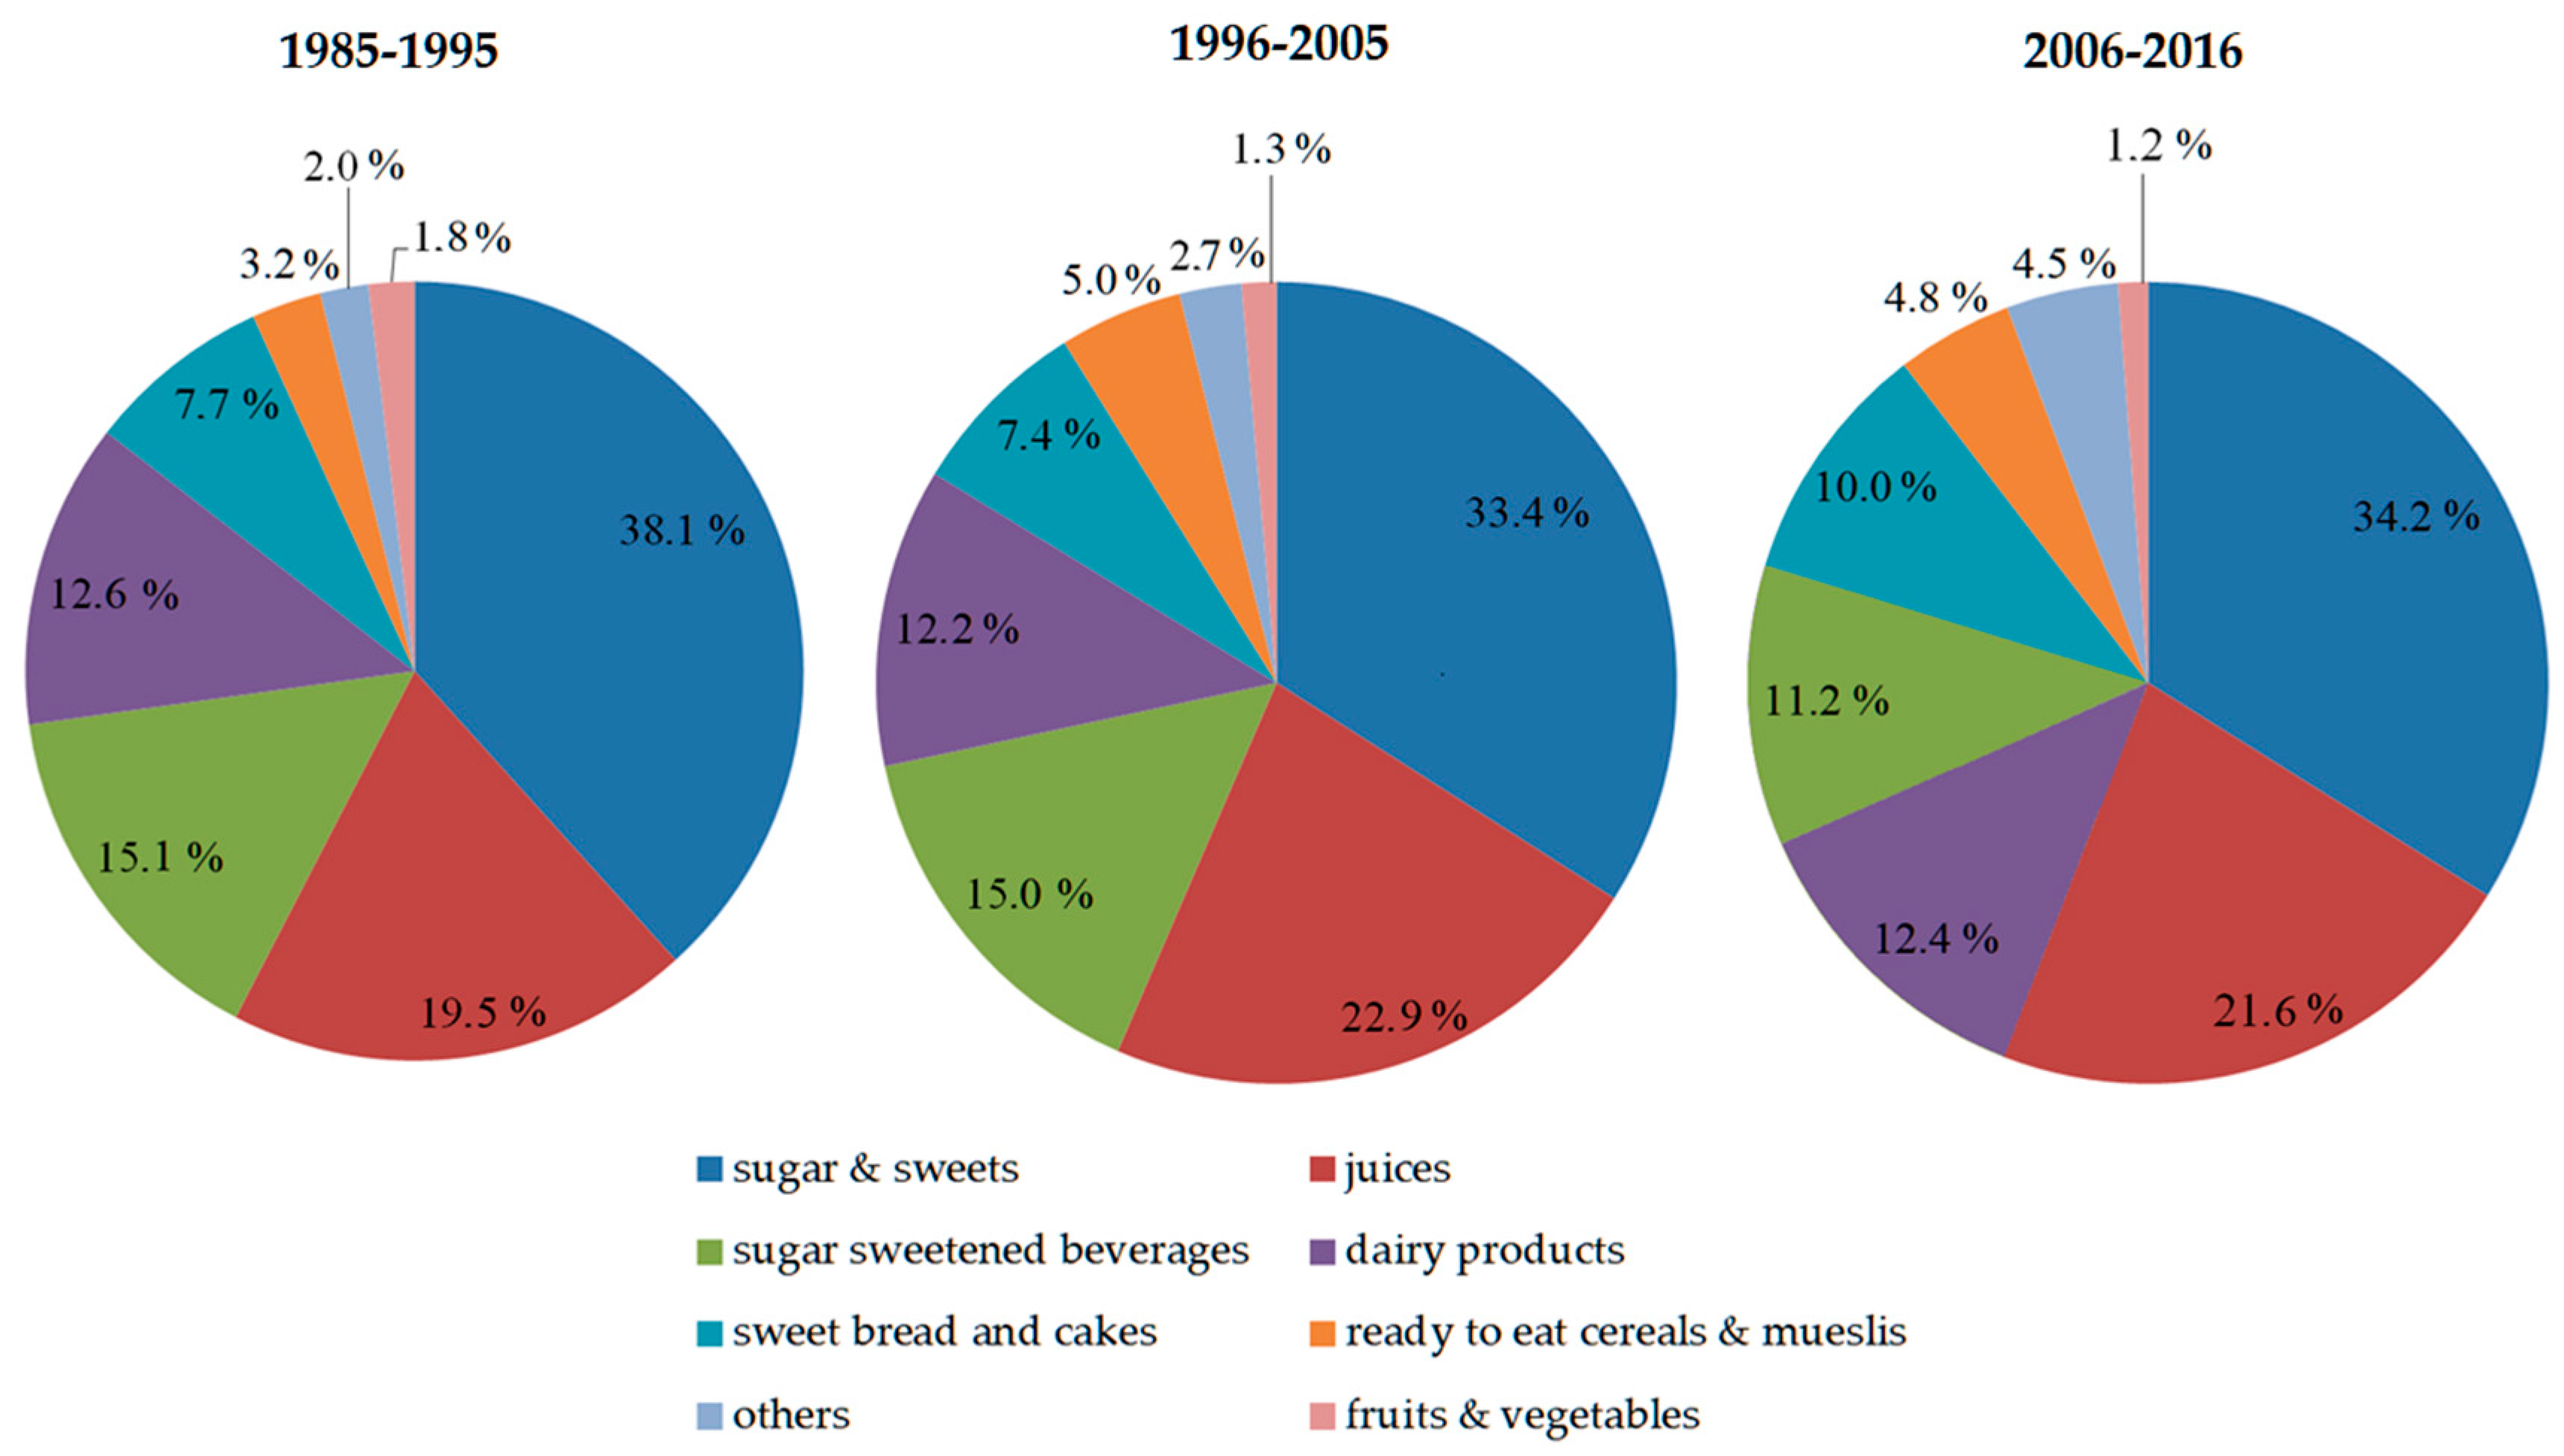
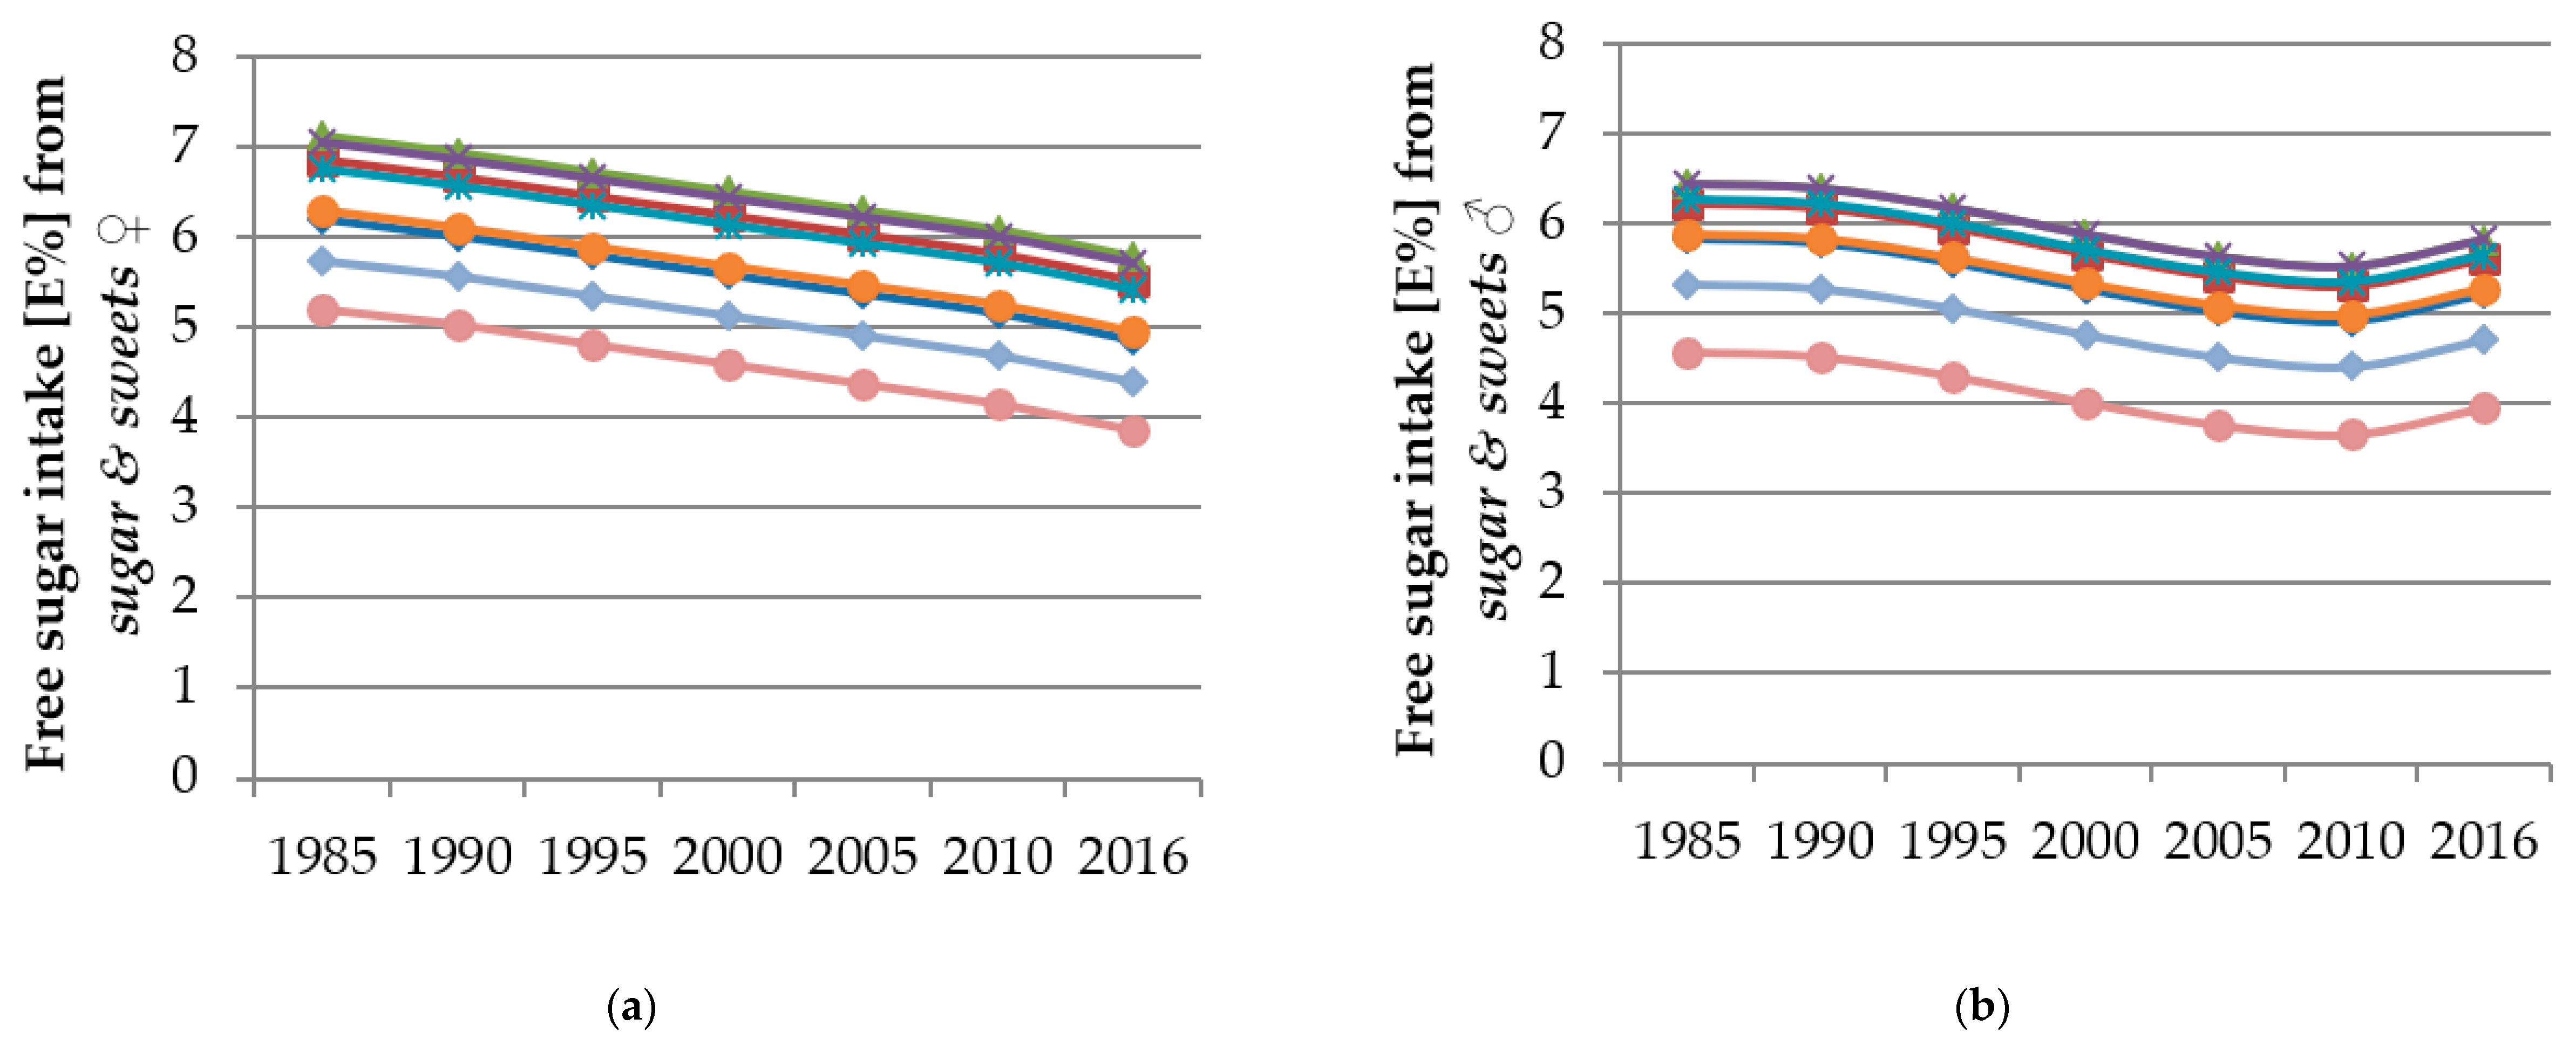
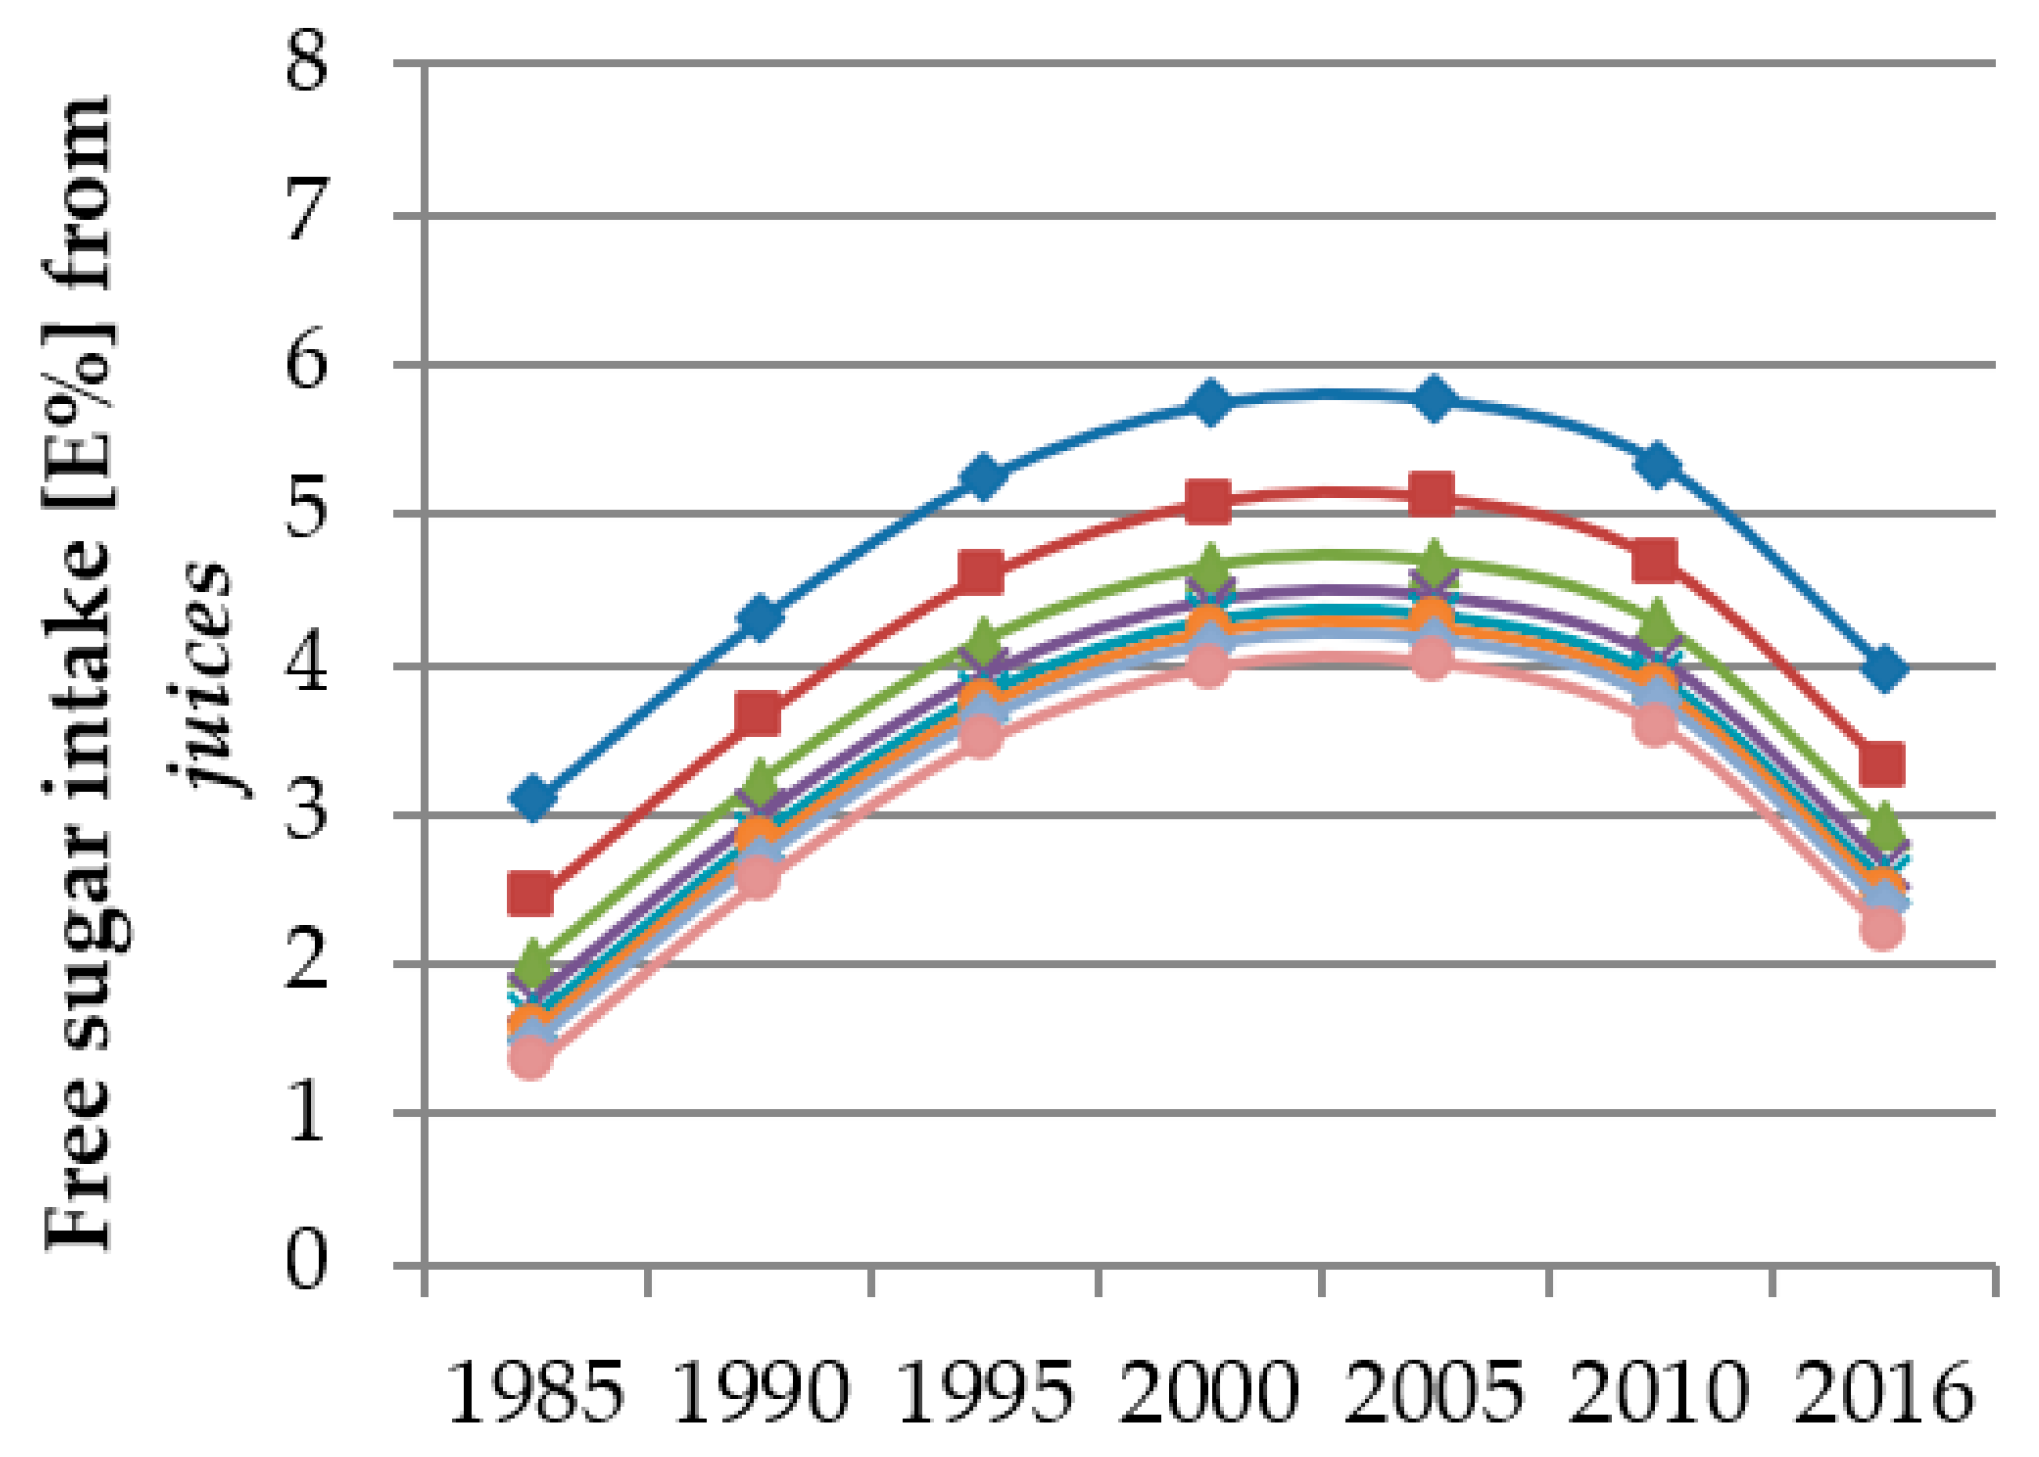
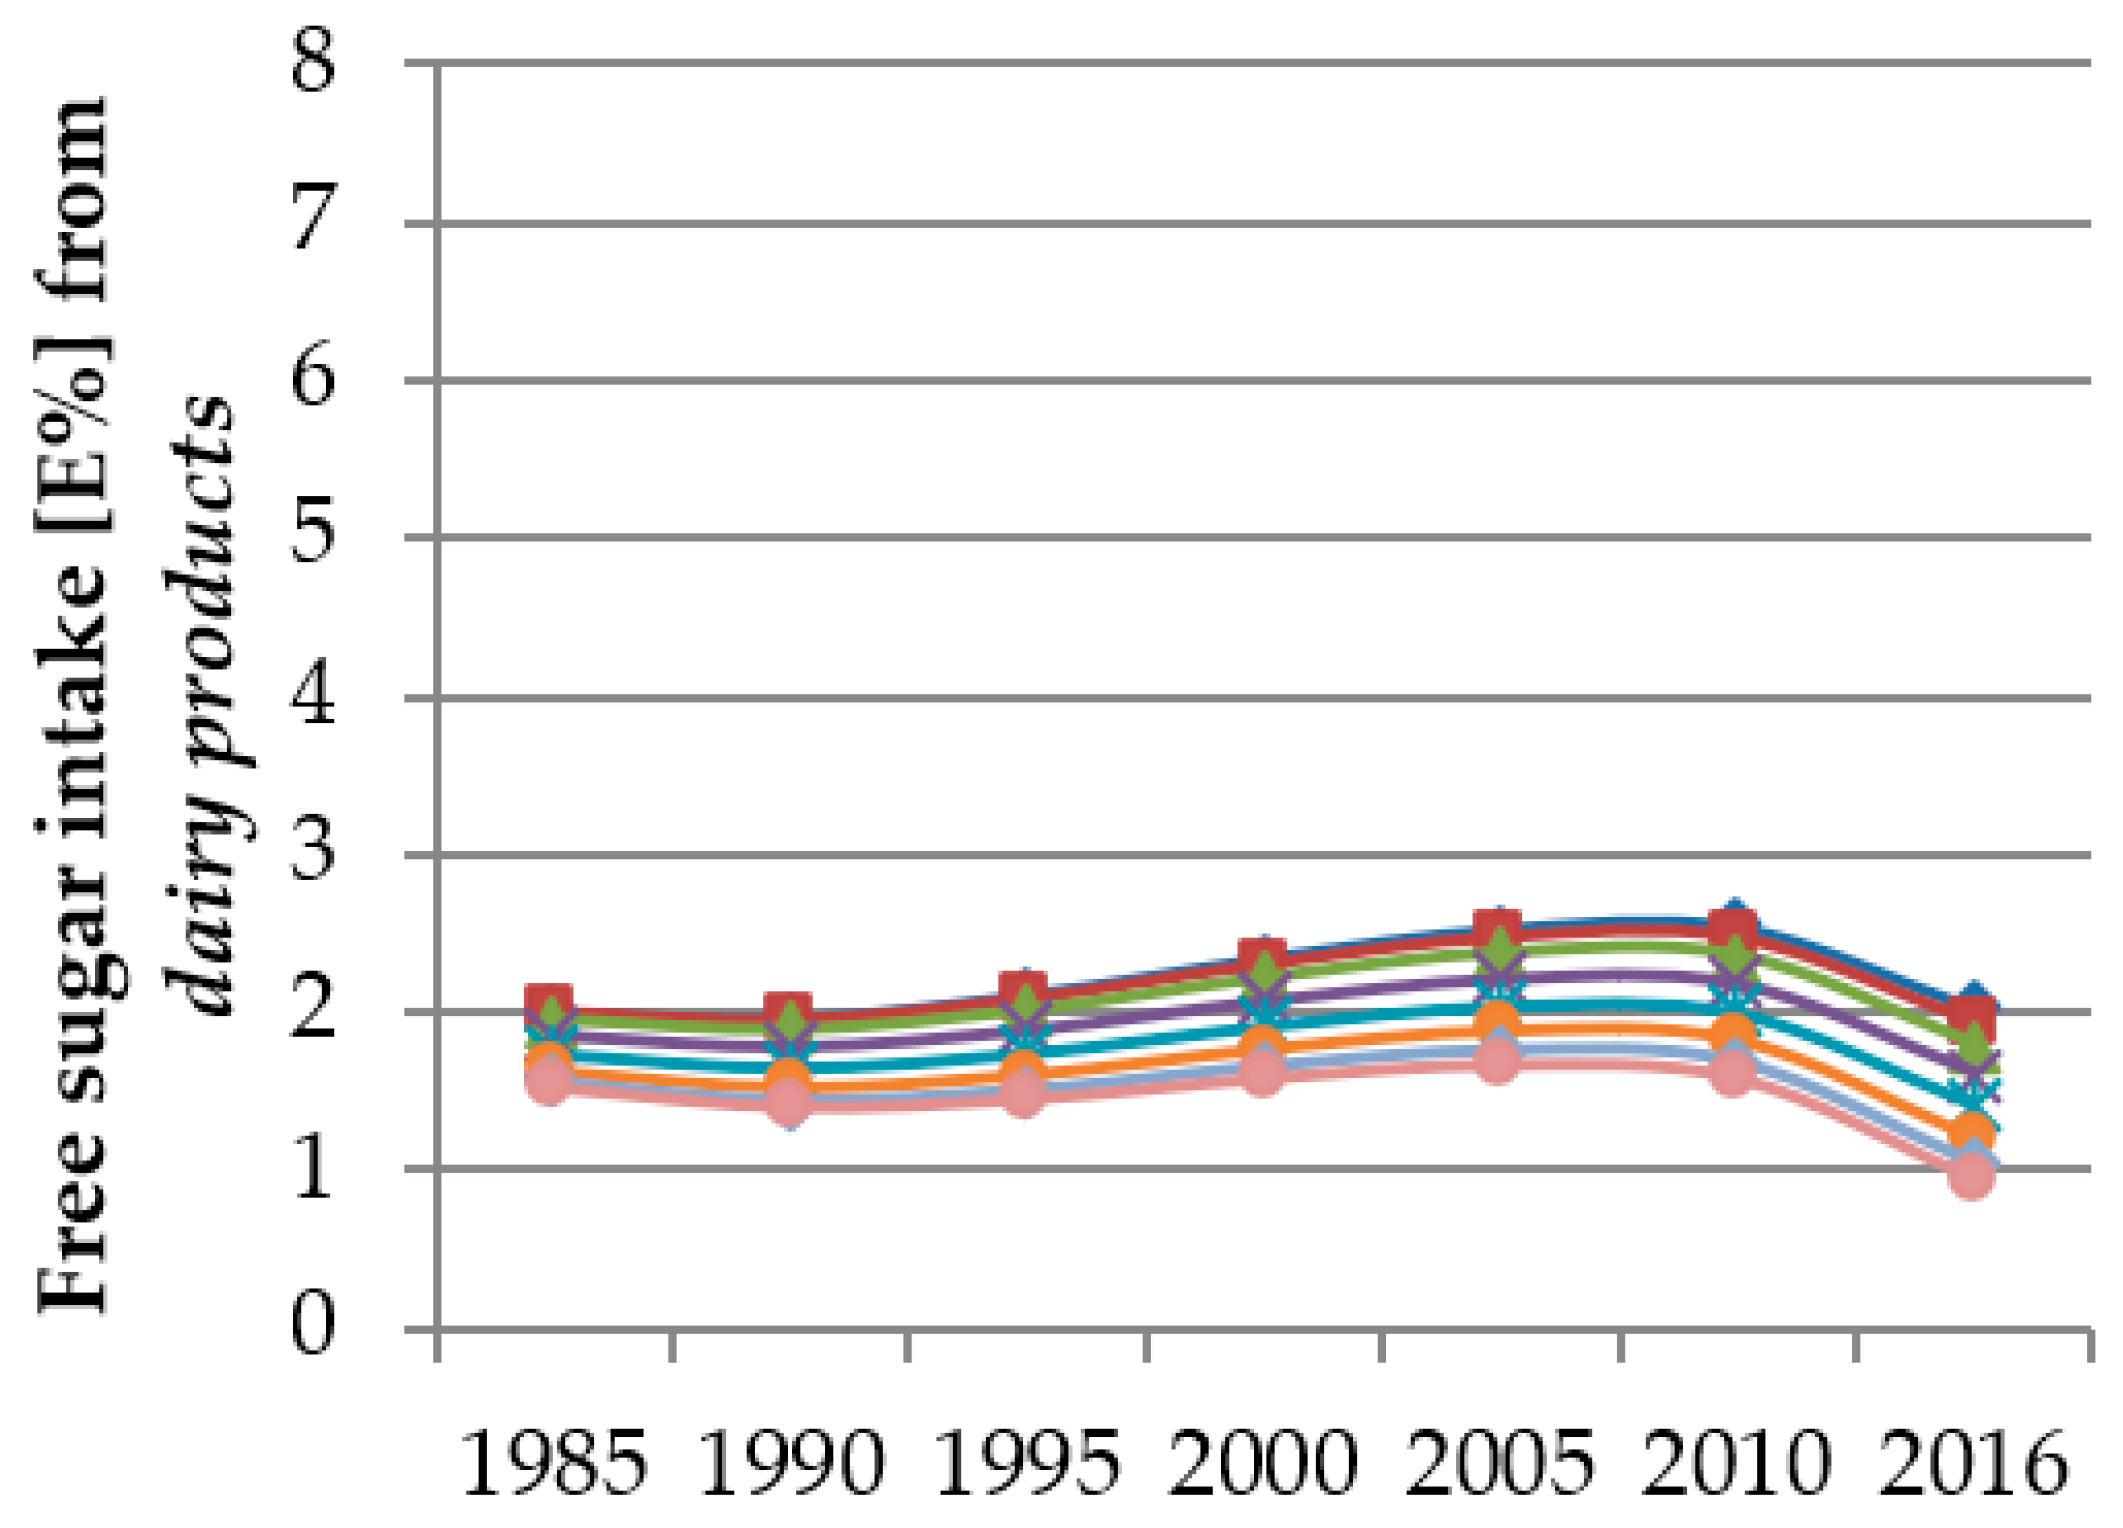
The statistical analyses of the present evaluation were performed using SAS® procedures (version 9.4; Cary, NC, USA). The significance level was set at p < 0.05. Characteristics in the tables are presented as medians with their interquartile range or frequencies and percentages. For the presentation of dietary descriptive data in tables, participants were stratified according to time periods (1985–1995, 1996–2005 and 2006–2016) and (age groups: >2.5–<5.5, ≥5.5–<10.5, ≥10.5–<13.5 and ≥13.5–<18.5 years, respectively).
Time and age trends in FS (%E) were analysed using polynomial mixed-effects regression models including both fixed and random effects (PROC MIXED in SAS®). In cases of significant interactions between the time or age and sex (sex × age, sex × time), stratified analyses were performed. Time and age—continuously in years—were the principle fixed effects of the models. The first included record in this evaluation was considered the baseline time, i.e., time = 0. Therefore, time ranged between 0 and 31 years. Quadratic and cubic terms for age (age2, age3) and time (time2, time3) as well as a combination of the linear time and age variable (age × time) were considered as additional explanatory variables if they improved the fit statistics [Akaike information criterion (AIC)] by more than two points or significantly predicted the respective outcome [42]. A linear trend reflects a constant increase or decrease in the respective outcome variable over the years or with age. Quadratic and cubic trends indicate that the magnitude of the trend changes over time or with age. A repeated statement was considered in order to account for the lack of independence between repeated measures from the same person. Random effects were considered to allow variation between individuals and families with respect to the initial level (intercept) as well as linear, quadratic and cubic age trends of the respective outcome. The AIC was also used to select the covariance structure that best describes the variances and covariances of the initial level, the linear and quadratic trend among persons, and the covariance structure that best describes the correlated nature of the repeated measurements. Covariables that were considered in the final models either (1) modified regression coefficients in the basic models by ≥10% (2), had a significant and independent association with the outcome variable, or (3) led to an improvement of the AIC by more than two points [43].
The single effect estimates of polynomial models cannot be interpreted, i.e., if the analyses render significant results for a combination of linear, quadratic, and cubic trends, the single beta values do not reflect the true time and age trends. Hence, figures were designed to illustrate the predicted trends. These figures show the predicted FS intake from the individual food groups resulting from the polynomial mixed-effects regression models over the course of the study period for different age groups (3/4 years, 5/6 years, 7/8 years, 9/10 years, 11/12 years, 13/14 years, 15/16 years and 17/18 years). Thus, the course of the curves illustrates the time trend and the vertical differences between the curves for different ages indicate the age trend.
Records were considered as under-reported when the total energy intake (TEI) was inadequate in relation to the estimated basal metabolic rate (BMR) (according to age- and sex-specific equations of Schofield [44]), using pediatric cutoffs [45]. This procedure resulted in 835 (7.8%) records with under-reporting. Under-reported records were not excluded from the analyses, as this procedure only identifies under-reported energy intake, but no selective under-reporting of food groups [46] or sugar intake [47]. In addition, participants with high energy requirements (e.g., due to high physical activity levels), who may have under-reported, could not be identified [48]. Instead, sensitivity analyses excluding records, which were identified as under-reported, were done.
To check whether differences in total daily energy intakes arising from differences in age, sex or physical activity level of the participants as well as changes in total daily energy intake over time may have confounded the results, additional sensitivity analyses were performed, additionally accounting for total daily energy intake (kcal).

3. Results

3.1. Sample Characteristics

Overall 10,761 3-day weighed dietary records from 1312 DONALD study participants were analysed. Approximately half of the participants were female. Participants’ overweight status and maternal characteristics reflect the high socioeconomic status (SES) of DONALD participants (Table 2). Only 12.3% of the participants were overweight at the time of measurement.
For the total study sample, mean FS intake was 17.1 ± 6.6%E. Percentages of FS intake from food groups of the total sample are illustrated in Figure 1, stratified by three time periods (1985–1995, 1996–2005 and 2006–2016). Sugar & sweets constitute the largest proportion of FS intake in all time periods (38.1%, 33.4% and 34.2%, respectively), followed by juices (19.5%, 22.9% and 21.6%, respectively). While in the years 1985–1995 and 1996–2005 SSB (15.1% and 15.0%, respectively) they were the third largest source of FS, in 2006–2016, dairy products were the third largest source of FS (12.4%). Dietary characteristics stratified by time periods are shown in Table 3 and stratified by age groups are shown in Table 4.

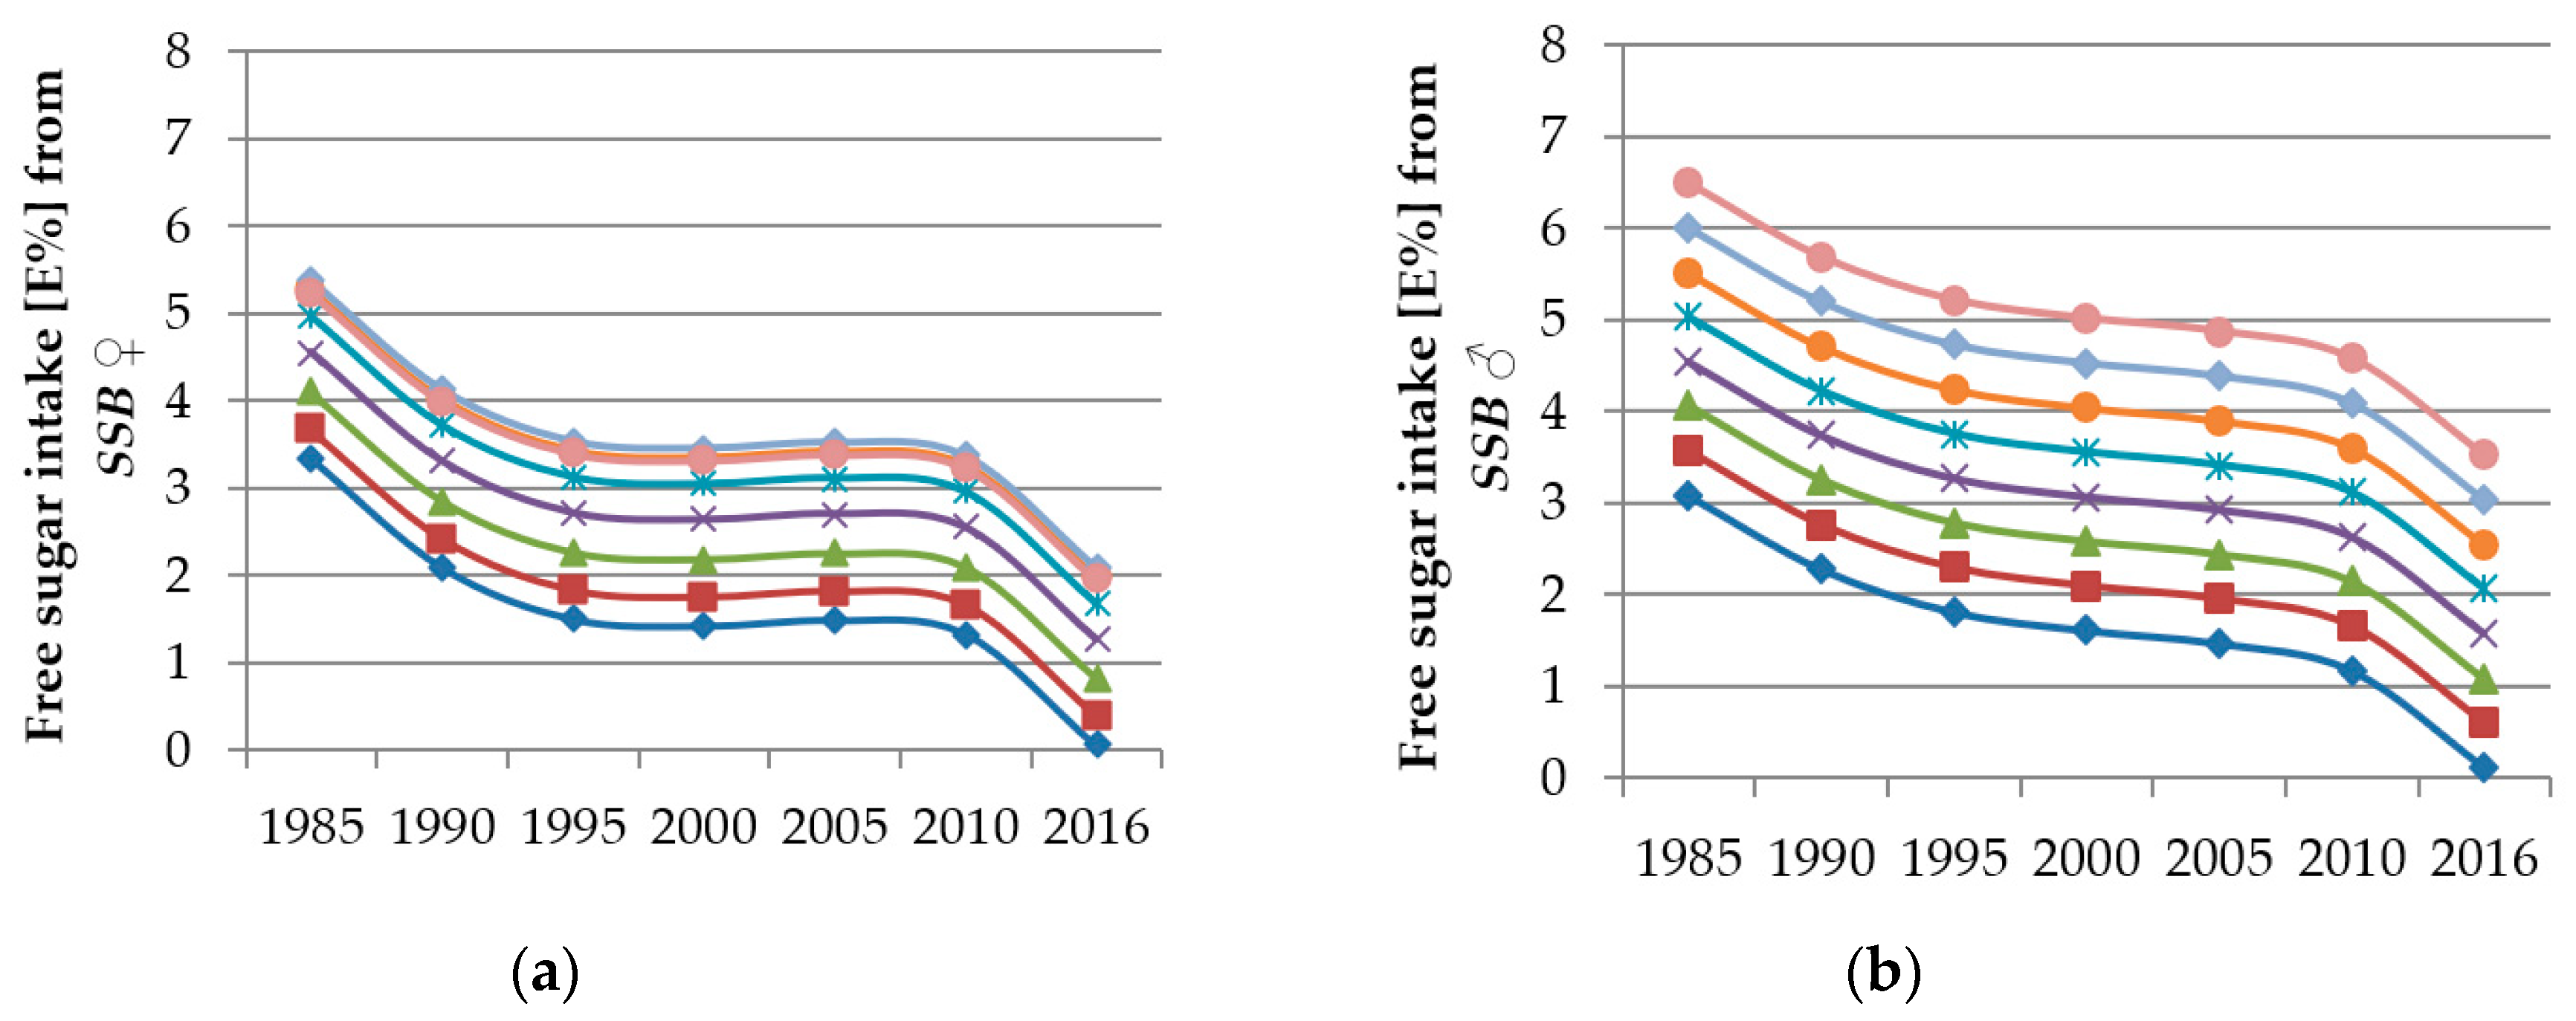
3.2. Time and Age Trends

Results of the time and age trend analyses from the polynomial mixed-effects regression models for FS intake from sugar & sweets, juices, dairy products and SSB are shown in Table 5 and displayed in Figure 2, Figure 3, Figure 4 and Figure 5. Changes in FS intake from sweet breads & cakes, RTC and others with age or during the observation period were negligible (see Supplementary Table S1 and Figures S1–S3).
With respect to time trends, among girls, FS intake from sugar & sweets decreased between 1985 and 2016 continuously (Figure 2a, linear trend p < 0.0001). Among boys, FS intake from sugar & sweets did not change significantly over the study period.
Among the total sample, FS intake from juices increased between 1985 and 2000, remained constant until 2005 and subsequently decreased until 2016, reaching intake levels comparable to those seen in 1990 (linear and quadratic trend p < 0.0001) (Figure 3).
FS intake from dairy products increased slightly between 1985 and 2010 and decreased thereafter (quadratic trend p = 0.0009, cubic trend p < 0.0001) (Figure 4). The test on interaction between time and age was significant only in the model of FS intake from dairy products (p = 0.0489). Therefore, we included the term age × time in the model. This leads to the fact that the extent of time trends in FS intake from dairy products was dependent on age (Figure 4).
Among girls and boys, significant time trends in FS intake from SSB were observed (girls: linear, quadratic, cubic trend: p < 0.0001; boys: linear trend p = 0.0028, quadratic trend p = 0.0165, cubic trend p = 0.0135): FS intake from SSB among girls decreased from 1985 to 1995, stagnated until 2010 and decreased again thereafter (Figure 5a). FS intake from SSB among boys decreased continuously (Figure 5b).
In terms of age trends, FS intake from sugar & sweets changed with age among girls and boys (girls: linear and quadratic trend p < 0.0001, cubic trend p = 0.0033; boys: linear and quadratic trend p < 0.0001). The oldest girls and boys, followed by the 15/16 year-olds, had the lowest FS intakes from sugar & sweets (Figure 2a,b). The 7/8 and 9/10 year-olds had the largest FS intakes from sugar & sweets, yet only slightly higher than intake levels among the 5/6 and 11/12 year-olds (Figure 2a,b).
The youngest children, followed by the 5/6 year-olds, had the highest FS intakes from juices (linear trend p < 0.0001, quadratic trend p = 0.0009, cubic trend p = 0.0082). Differences among the other ages were negligible (Figure 3).
Younger participants also consumed more FS from dairy products than older ones (quadratic trend p = 0.0207, cubic trend p = 0.028). Due to the significant interaction between time and age in this model, differences between the ages were hardly discernible at the beginning of the observation period and became more obvious at the end (Figure 4).
In boys, younger participants had lower FS intakes from SSB than older participants (linear trend p < 0.0001) (Figure 5b). A similar trend was observed among girls. However, 15/16 year-olds had a larger FS intake from SSB than 17/18 year-olds (cubic trend p = 0.0211) (Figure 5a). In addition, age differences in FS intake from SSB among girls were not as clear as among boys.
Sensitivity analyses excluding under-reported records as well as including total daily energy intake as covariable, yielded similar results for time and age trends.

4. Discussion

The present study identified time and age trends in FS intake from sugar & sweets, dairy products, fruits & vegetables, juices and SSB, which are relevant for the implementation of public health measures to reduce FS intake among children and adolescents. The observed decline in FS intake from sugar & sweets, juices, dairy products and SSB over the study course provides additional insight into the nature of the time trends observed in previous analyses among the present study sample: Total FS intake increased between 1985 and 2005 and decreased, most notably since 2010 [30]. The increase in FS intake from juices between 1985 and 2005 contributes largely to the increase in total FS intake in this time period. While FS intake from juices and SSB as well as FS from sugar & sweets among girls started to decline since 2005, FS intake from dairy products only decreased from 2010 onwards, hence explaining the notable decrease in total FS intake since 2010.
Furthermore, we observed differences in the extent of FS decline between the investigated food groups. The decline in FS intake from sugar & sweets was the least pronounced. In contrast, the recent decline in FS intake from juices was the most pronounced, followed by FS intake from SSB, which may reflect an increasing awareness of health risks associated with liquid sugar sources [11,12,13,15,18,49]. This might be due to the comparably high SES of our study sample. A further explanation for these results might be a SSB specific under-reporting, since SSB intake is increasingly discussed to promote diseases such as overweight and obesity [2,3,4,5]. For the same reason, participants could consciously abstain from SSB during the dietary record days and thus, eat and record less FS from SSB than usual. Although we cannot preclude that the decreasing trend in FS intake from SSB partly reflect sugar specific misreporting [47], our sensitivity analyses do not support the notion of bias from general under-reporting since results for time and age trends were similar when we excluded under-reported records.
At the time of the decline of total FS intake or FS intake from food groups, e.g., from SSB, juices or sugar & sweets in Germany, measures to reduce sugar intake were non-systematic and directed at the individuals (e.g., education initiatives in kindergarden and schools), hence, the cause of the observed decrease of FS intake from many food groups in recent years is unclear. However, total FS intake still markedly exceeded the 10%E limit, set by the WHO, across all age groups and time windows [30]. Our data suggest that public health strategies focusing on FS from sugar & sweets are needed to reduce intake from these sources among children and adolescents. To date, only voluntary reformulation measures have been implemented in Germany (since 2019) and will be complemented by voluntary front-of-package logos, i.e., the NutriScore in due course [50]. However, the current reformulation strategy explicitly excludes sugars & sweets [51,52] and a voluntary introduction of the NutriScore is unlikely to affect the choice of sugar & sweets. Hence, additional measures—ideally targeted at sugar & sweets—will be necessary.
Time trends in FS intake from SSB differed depending on the sex of the participants: the declining trend in FS intake from SSB was less pronounced among girls than among boys. This is probably due to the fact that boys generally consume more SSB than girls, which was recently confirmed in a representative study among children and adolescents in Germany [53,54]. Hence, FS intake from SSB may have decreased faster among boys than among girls.
To our knowledge, no time trend analyses in FS intake from food groups among other young study populations existed up to now. Welsh et al. investigated time trends in added sugars (AS, i.e., FS minus sugar from juices) intake from different food groups among young participants (2–17 years) from the National Health and Nutrition Examination Survey (NHANES) in the U.S. [55]. In line with our study results, significant linearly decreasing time trends in AS intake from both sweets and regular sodas were observed between 1999/2000 and 2007/2008 [55]. Studies among European children only examined time trends in the intake of food groups, but not sugar intake levels: Stahl et al. (2009) compared food intake among 6–17 year-olds between two cross-sectional representative German surveys, the German National Food Consumption Study (Nationale Verzehrsstudie, NVS) from 1985–1988 (n = 2265) and the nutrition module ‘EsKiMo’ of the German Health Interview and Examination Survey for Children and Adolescents (KiGGS) from 2003 to 2006 (n = 2506) [56]. In this study, children consumed significantly more confectionery/jam/sugar and non-alcoholic beverages (juices and SSB) in 2003–2006 than children in 1985–1988 [56]. In a comparison between the first (2003–2006) and the second KiGGS (2014–2017) survey, the daily consumption of confectionary [53] and SSB [53,54] decreased. Our findings also point to an increasing juice intake between 1985 and 2006, while the intakes of sugar & sweets and SSB already decreased between 1985 and 2006. Differences in time trends between these studies may be explained by different populations, methodologies and statistical tests. Furthermore, it must be kept in mind that we examined FS intake from food groups, while the other studies investigated absolute intake amounts. A decline in FS intake from food groups may not be solely attributable to a decline consumed amounts. It could also reflect product reformulation during this time period, since food manufacturers change the recipe of their products, e.g., the sugar content, over time. Due to its continuously updated in-house nutrient database LEBTAB [39] the DONALD study is probably the only study that can take this change into account: if the recipe of a product was changed, resulting in different nutrient and energy contents of the product, a new entry was added to LEBTAB, whilst the entry for the product with the old recipe was marked and retained in the database. Thus, our analyses account for recipe changes in our time trends.
This fact also allows us to investigate differences in the contribution of food groups to free sugar intake over time. Sugar & sweets and juices, were the main food sources of FS throughout the observation period (Figure 1), together contributing to more than half of FS intake. While SSBs were the third largest source for FS in the first 20 years of observation, dairy products have replaced SSBs in the last decades. In view of the fact that FS from dairy products was lower than FS from the other three investigated sources throughout the entire observation period, this is presumably due to the remarkably sharp decline in SSB intake (by over 50% between 1990 and 2016).
Our results for age trends in food group intake partly confirm the hypothesis of an age-depending shift from naturally occurring sugar sources such as fruits, milk, dairy products and juices, to those sources with high amounts of AS such as sugar & sweets and SSB, which was suggested from our previous trend analyses in total sugar and AS intake [30]. This shift is in accordance with results from other studies. Lytle et al. reported a change in dietary pattern in children between third and eight grade due to a decreased consumption of fruits, vegetables, and milk [57], whereas SSB consumption increased during puberty in several studies [57,58]. Daily SSB consumption in the second KiGGS survey was also higher among older as compared to younger children [54]. While age trends in FS intake from SSB and juices from the present analyses would support our initial hypothesis, age trends in FS intake especially from sugar& sweets are not in line with the hypothesis that intakes highest among 7/8 and 9/10 year-olds lower intakes among both younger children and adolescents (Figure 2). In addition, FS intake from dairy products decreased with age.
The observed shift in eating patterns may reflect the increasing autonomy in food choice with age. In addition, the environment of older children provides more food choices. Dairy products seem to be an exception, as they often contain both natural sugar and added sugar. Furthermore, marketing efforts explicitly focus on taste preferences of children and adolescents, which may have affected the intake of some food groups. In Germany, advertisement for SSB are more commonly directed at adolescents or young adults whereas advertisements for juices or some dairy products are targeted to younger children.
The knowledge of these age-dependent dietary patterns may contribute to the development of specific public health measures for children and adolescents.
Sex-specific differences in age trends emerged for FS intakes from SSB only. While FS intake in boys increased continuously with age, consumption in girls remained fairly stable throughout adolescence. This may to some extent reflect the commonly observed tendency of female adolescents to exhibit a more “healthy” food choice [59]. To our knowledge, to date, there are no data on sex- or gender-specific development of dietary patterns during childhood and adolescence, which could explain the difference in age trends observed in our study.
Age differences in FS intake from food groups were investigated only by one other study: Among European participants from the IDEFICS (Identification and prevention of Dietary- and lifestyle-induced health EFfects In Children and infantS) study, FS intake from dairy was significantly lower among older girls (6–<10 years) compared to younger ones (2–<6 years) [29], which supports our findings. In contrast to our results, FS intake from juices was significantly higher among older participants, but only among boys [29]. These differences most likely reflect differences in the methodology and/or characteristics of the study populations, such SES.
The relatively high SES of the DONALD study population may limit the generalizability of our results to the general German pediatric population [37]. Some studies showed a clear inverse association between SES and intake of sugary foods, especially SSB intake [60,61,62]. In the DONALD study, in particular, young children did not consume any SSB but instead consumed substantial amounts of fruit juices. Nevertheless, median total sugar and FS intake as well as absolute intake amounts of food groups observed in our sample are similar to intake levels reported from representative German nutrition surveys [63,64] or other European countries [65,66].
A further limitation of the current analyses is that we were not able to adjust for physical activity levels in the statistical model, as data on physical activity in the DONALD study has only been systematically collected since 2004.
The main strength of this study is its longitudinal design, allowing time and age trend analyses covering a period of 31 years in a large sample size using a large number of 3-day weighed dietary records. The weighed dietary records and the continuously updated in-house nutrient database LEBTAB allow the consideration of brand-specific sugar content in commercial products as well as sugars or sweetening agents such as syrups and honey, which are used for food preparation at home [39]. In addition, LEBTAB [39] accounts for changes in recipes over time and allows the estimation of both total FS intake and FS intake from different food groups. Finally, a variety of covariates that have been linked to dietary sugar intake could be considered as potential confounders [61,62,67].

5. Conclusions

Our study provides important insights into time and age trends in FS intake from different food groups relevant for future public health measures. While FS intake from juices, SSB, sugar & sweets and dairy products declined, especially in recent years, overall, FS intakes continue to exceed the recommendations of 10%E and therefore, call for further public health measures. Since the decline in FS intake from sugar & sweets was less pronounced and these products remained the main source for FS over the entire observation period, public health measures should not only focus on SSB, but also address a decline of FS intake from sugar & sweets. The consideration of age trends should also play a role in this context as primary school children particularly showed a high intake of FS from sugar & sweets and older children from SSB. Especially, since sugary foods are ubiquitously available and are offered in the daily environment of children and adolescents, e.g., in schools.

Supplementary Materials

The following are available online at https://0-www-mdpi-com.brum.beds.ac.uk/2072-6643/12/1/20/s1, Figure S1: Time and age trends in FS intake from sweet bread & cakes, Figure S2: Time and age trends in FS intake from RTC, Figure S3: Time and age trends in FS intake from others, Table S1: Time and age trends in free sugar intake from different food groups of 10,761 dietary records of 1312 DONALD study participants (n = 660 boys, n = 652 girls) (3–18 years) between 1985 and 2016.

Author Contributions

The authors responsibilities were as follows: A.E.B. conceived the research project. S.S. assigned each food to a food group. A.M.S. and I.P. conducted the statistical analysis. I.P. wrote the manuscript. U.A. supervised the project and had primary responsibility for the final content. All authors made substantial contributions, critically read and revised the manuscript as well as approved the final version. All authors have read and agreed to the published version of the manuscript.

Funding

This research project was funded by the German Federal Ministry of Food and Agriculture (BMEL) through the Federal Office for Agriculture and Food (BLE), grant 2816HS024. The DONALD Study is financially supported by the Ministry of Science and Research of North Rhine-Westphalia, Germany.

Acknowledgments

We thank all participants and their families of the DONALD Study for providing their data. We also thank the staff of the DONALD study for carrying out the anthropometric measurements as well as for collecting and coding dietary records.

Conflicts of Interest

A.E.B. is a member of the International Carbohydrate Quality Consortium (ICQC) and the ILSI Europe Carbohydrate Task Force. I.P., A.M.S., S.S. and U.A. declare that they have no conflict of interest.

References

  1. Moynihan, P.J.; Kelly, S.A.M. Effect on caries of restricting sugars intake: Systematic review to inform WHO guidelines. J. Dent. Res. 2014, 93, 8–18. [Google Scholar] [CrossRef] [PubMed] [Green Version]
  2. Welsh, J.A.; Cunningham, S.A. The role of added sugars in pediatric obesity. Pediatr. Clin. N. Am. 2011, 58, 1455–1466. [Google Scholar] [CrossRef] [PubMed]
  3. Te Morenga, L.; Mallard, S.; Mann, J. Dietary sugars and body weight: Systematic review and meta-analyses of randomised controlled trials and cohort studies. BMJ 2012, 346, e7492. [Google Scholar] [CrossRef] [PubMed] [Green Version]
  4. Peres, M.A.; Sheiham, A.; Liu, P.; Demarco, F.F.; Silva, A.E.R.; Assunção, M.C.; Menezes, A.M.; Barros, F.C.; Peres, K.G. Sugar Consumption and Changes in Dental Caries from Childhood to Adolescence. J. Dent. Res. 2016, 95, 388–394. [Google Scholar] [CrossRef]
  5. Ludwig, D.S.; Peterson, K.E.; Gortmaker, S.L. Relation between consumption of sugar-sweetened drinks and childhood obesity: A prospective, observational analysis. Lancet 2001, 357, 505–508. [Google Scholar] [CrossRef]
  6. Welsh, J.A.; Sharma, A.; Cunningham, S.A.; Vos, M.B. Consumption of added sugars and indicators of cardiovascular disease risk among US adolescents. Circulation 2011, 123, 249–257. [Google Scholar] [CrossRef] [Green Version]
  7. Malik, V.S.; Hu, F.B. Sugar-Sweetened Beverages and Cardiometabolic Health: An Update of the Evidence. Nutrients 2019, 11, 1840. [Google Scholar] [CrossRef] [Green Version]
  8. Vos, M.B.; Kaar, J.L.; Welsh, J.A.; van Horn, L.V.; Feig, D.I.; Anderson, C.A.M.; Patel, M.J.; Cruz Munos, J.; Krebs, N.F.; Xanthakos, S.A.; et al. Added Sugars and Cardiovascular Disease Risk in Children: A Scientific Statement From the American Heart Association. Circulation 2017, 135, e1017–e1034. [Google Scholar] [CrossRef] [Green Version]
  9. Rodríguez, L.A.; Madsen, K.A.; Cotterman, C.; Lustig, R.H. Added sugar intake and metabolic syndrome in US adolescents: Cross-sectional analysis of the National Health and Nutrition Examination Survey 2005–2012. Public Health Nutr. 2016, 19, 2424–2434. [Google Scholar] [CrossRef] [Green Version]
  10. Mourao, D.M.; Bressan, J.; Campbell, W.W.; Mattes, R.D. Effects of food form on appetite and energy intake in lean and obese young adults. Int. J. Obes. 2007, 31, 1688–1695. [Google Scholar] [CrossRef] [Green Version]
  11. Malik, V.S.; Popkin, B.M.; Bray, G.A.; Després, J.-P.; Hu, F.B. Sugar Sweetened Beverages, Obesity, Type 2 Diabetes and Cardiovascular Disease risk. Circulation 2010, 121, 1356–1364. [Google Scholar] [CrossRef] [PubMed]
  12. Libuda, L.; Alexy, U.; Sichert-Hellert, W.; Stehle, P.; Karaolis-Danckert, N.; Buyken, A.E.; Kersting, M. Pattern of beverage consumption and long-term association with body-weight status in German adolescents--results from the DONALD study. Br. J. Nutr. 2008, 99, 1370–1379. [Google Scholar] [CrossRef] [PubMed] [Green Version]
  13. Malik, V.S.; Pan, A.; Willett, W.C.; Hu, F.B. Sugar-sweetened beverages and weight gain in children and adults: A systematic review and meta-analysis. Am. J. Clin. Nutr. 2013, 98, 1084–1102. [Google Scholar] [CrossRef] [PubMed] [Green Version]
  14. Malik, V.S.; Popkin, B.M.; Bray, G.A.; Després, J.-P.; Willett, W.C.; Hu, F.B. Sugar-sweetened beverages and risk of metabolic syndrome and type 2 diabetes: A meta-analysis. Diabetes Care 2010, 33, 2477–2483. [Google Scholar] [CrossRef] [PubMed] [Green Version]
  15. O’Connor, L.; Imamura, F.; Lentjes, M.A.H.; Khaw, K.-T.; Wareham, N.J.; Forouhi, N.G. Prospective associations and population impact of sweet beverage intake and type 2 diabetes, and effects of substitutions with alternative beverages. Diabetologia 2015, 58, 1474–1483. [Google Scholar] [CrossRef] [Green Version]
  16. Pepin, A.; Stanhope, K.L.; Imbeault, P. Are Fruit Juices Healthier Than Sugar-Sweetened Beverages? A Review. Nutrients 2019, 11, 1006. [Google Scholar] [CrossRef] [Green Version]
  17. DiMeglio, D.P.; Mattes, R.D. Liquid versus solid carbohydrate: Effects on food intake and body weight. Int. J. Obes. Relat. Metab. Disord. 2000, 24, 794–800. [Google Scholar] [CrossRef] [Green Version]
  18. Malik, V.S.; Schulze, M.B.; Hu, F.B. Intake of sugar-sweetened beverages and weight gain: A systematic review. Am. J. Clin. Nutr. 2006, 84, 274–288. [Google Scholar] [CrossRef]
  19. Expert Consultation on Diet, Nutrition, and the Prevention of Chronic Diseases; WHO; FAO; Joint WHO-FAO Expert Consultation on Diet, Nutrition, and the Prevention of Chronic Diseases. Diet, Nutrition, and the Prevention of Chronic Diseases. Report of a WHO-FAO Expert Consultation; [Joint WHO-FAO Expert Consultation on Diet, Nutrition, and the Prevention of Chronic Diseases, 2002, Geneva, Switzerland; World Health Organization: Geneva, Switzerland, 2003; ISBN 92-4-120916-X. [Google Scholar]
  20. Swan, G.E.; Powell, N.A.; Knowles, B.L.; Bush, M.T.; Levy, L.B. A definition of free sugars for the UK. Public Health Nutr. 2018, 21, 1636–1638. [Google Scholar] [CrossRef] [Green Version]
  21. Scientific Advisory Committee on Nutrition. Minutes of the 48th Meeting. Available online: https://app.box.com/s/ivrivaemf7fgeo9a17xdmv167c4uvteu/file/106585193169 (accessed on 18 December 2019).
  22. WHO. Guideline: Sugars Intake for Adults and Children; World Health Organization: Geneva, Switzerland, 2015; ISBN 978-92-4-154902-8. [Google Scholar]
  23. Ernst, J.B.; Arens-Azevêdo, U.; Bitzer, B.; Bosy-Westphal, A.; de Zwaan, M.; Egert, S.; Fritsche, A.; Gerlach, S.; Hauner, H.; Heseker, H.; et al. für die Deutsche Adipositas-Gesellschaft, Deutsche Diabetes Gesellschaft und Deutsche Gesellschaft für Ernährung. Quantitative Empfehlung zur Zuckerzufuhr in Deutschland. Available online: https://www.dge.de/fileadmin/public/doc/ws/stellungnahme/Konsensuspapier_Zucker_DAG_DDG_DGE_2018.pdf (accessed on 18 December 2019).
  24. Perrar, I.; Alexy, U. Comments on: “The role of dietary sugars in health: Molecular composition or just calories?”. Eur. J. Clin. Nutr. 2019, 73, 1323–1324. [Google Scholar] [CrossRef]
  25. Prinz, P. The role of dietary sugars in health: Molecular composition or just calories? Eur. J. Clin. Nutr. 2019, 73, 1216–1223. [Google Scholar] [CrossRef] [PubMed] [Green Version]
  26. Ventura, A.K.; Mennella, J.A. Innate and learned preferences for sweet taste during childhood. Curr. Opin. Clin. Nutr. Metab. Care 2011, 14, 379–384. [Google Scholar] [CrossRef] [PubMed] [Green Version]
  27. Drewnowski, A.; Mennella, J.A.; Johnson, S.L.; Bellisle, F. Sweetness and food preference. J. Nutr. 2012, 142, 1142S–1148S. [Google Scholar] [CrossRef] [PubMed] [Green Version]
  28. De Graaf, C.; Zandstra, E. Sweetness intensity and pleasantness in children, adolescents, and adults. Physiol. Behav. 1999, 67, 513–520. [Google Scholar] [CrossRef]
  29. Graffe, M.I.M.; Pala, V.; de Henauw, S.; Eiben, G.; Hadjigeorgiou, C.; Iacoviello, L.; Intemann, T.; Jilani, H.; Molnar, D.; Russo, P.; et al. Dietary sources of free sugars in the diet of European children: The IDEFICS Study. Eur. J. Nutr. 2019. [Google Scholar] [CrossRef] [PubMed]
  30. Perrar, I.; Schmitting, S.; Della Corte, K.W.; Buyken, A.E.; Alexy, U. Age and time trends in sugar intake among children and adolescents: Results from the DONALD study. Eur. J. Nutr. 2019. [Google Scholar] [CrossRef] [PubMed]
  31. Heuer, T. Estimation of “Free” Sugar Intake in Germany Based on the Data of the German National Nutrition Survey II. Available online: https://www.openagrar.de/receive/openagrar_mods_00030594 (accessed on 22 July 2019).
  32. Dietz, W.H. Critical periods in childhood for the development of obesity. Am. J. Clin. Nutr. 1994, 59, 955–959. [Google Scholar] [CrossRef] [PubMed]
  33. Mahoney, L.T.; Burns, T.L.; Stanford, W.; Thompson, B.H.; Witt, J.D.; Rost, C.A.; Lauer, R.M. Coronary risk factors measured in childhood and young adult life are associated with coronary artery calcification in young adults: The Muscatine Study. J. Am. Coll. Cardiol. 1996, 27, 277–284. [Google Scholar] [CrossRef] [Green Version]
  34. Buyken, A.E.; Mitchell, P.; Ceriello, A.; Brand-Miller, J. Optimal dietary approaches for prevention of type 2 diabetes: A life-course perspective. Diabetologia 2010, 53, 406–418. [Google Scholar] [CrossRef] [Green Version]
  35. The, N.; Suchindran, C.; North, K.E.; Popkin, B.M.; Gordon-Larsen, P. Association of adolescent obesity with risk of severe obesity in adulthood. JAMA 2010, 304, 2042–2047. [Google Scholar] [CrossRef] [Green Version]
  36. Mikkilä, V.; Räsänen, L.; Raitakari, O.T.; Pietinen, P.; Viikari, J. Consistent dietary patterns identified from childhood to adulthood: The cardiovascular risk in Young Finns Study. Br. J. Nutr. 2005, 93, 923–931. [Google Scholar] [CrossRef] [PubMed]
  37. Kroke, A.; Manz, F.; Kersting, M.; Remer, T.; Sichert-Hellert, W.; Alexy, U.; Lentze, M.J. The DONALD Study. History, current status and future perspectives. Eur. J. Nutr. 2004, 43, 45–54. [Google Scholar] [CrossRef] [PubMed]
  38. Buyken, A.E.; Alexy, U.; Kersting, M.; Remer, T. Die DONALD Kohorte: Ein aktueller Überblick zu 25 Jahren Forschung im Rahmen der Dortmund Nutritional and Anthropometric Longitudinally Designed Study. Bundesgesundheitsblatt Gesundh. Gesundh. 2012, 55, 875–884. [Google Scholar] [CrossRef] [PubMed]
  39. Sichert-Hellert, W.; Kersting, M.; Chahda, C.; Schäfer, R.; Kroke, A. German food composition database for dietary evaluations in children and adolescents. J. Food Compos. Anal. 2007, 20, 63–70. [Google Scholar] [CrossRef]
  40. Cole, T.J.; Bellizzi, M.C.; Flegal, K.M.; Dietz, W.H. Establishing a standard definition for child overweight and obesity worldwide: International survey. BMJ 2000, 320, 1240–1243. [Google Scholar] [CrossRef] [PubMed] [Green Version]
  41. Cole, T.J.; Flegal, K.M.; Nicholls, D.; Jackson, A.A. Body mass index cut offs to define thinness in children and adolescents: International survey. BMJ 2007, 335, 194. [Google Scholar] [CrossRef] [Green Version]
  42. Libuda, L.; Alexy, U.; Kersting, M. Time trends in dietary fat intake in a sample of German children and adolescents between 2000 and 2010: Not quantity, but quality is the issue. Br. J. Nutr. 2014, 111, 141–150. [Google Scholar] [CrossRef] [Green Version]
  43. Diethelm, K.; Bolzenius, K.; Cheng, G.; Remer, T.; Buyken, A.E. Longitudinal associations between reported sleep duration in early childhood and the development of body mass index, fat mass index and fat free mass index until age 7. Int. J. Pediatr. Obes. 2011, 6, e114–e123. [Google Scholar] [CrossRef]
  44. Schofield, W.N. Predicting basal metabolic rate, new standards and review of previous work. Hum. Nutr. Clin. Nutr. 1985, 39, 5–41. [Google Scholar]
  45. Sichert-Hellert, W.; Kersting, M.; Schöch, G. Underreporting of energy intake in 1 to 18 year old German children and adolescents. Z. Ernahrungswiss. 1998, 37, 242–251. [Google Scholar] [CrossRef]
  46. Livingstone, M.B.; Robson, P.J. Measurement of dietary intake in children. Proc. Nutr. Soc. 2000, 59, 279–293. [Google Scholar] [CrossRef] [PubMed] [Green Version]
  47. Poppitt, S.D.; Swann, D.; Black, A.E.; Prentice, A.M. Assessment of selective under-reporting of food intake by both obese and non-obese women in a metabolic facility. Int. J. Obes. Relat. Metab. Disord. 1998, 22, 303–311. [Google Scholar] [CrossRef] [PubMed] [Green Version]
  48. Black, A.E. Critical evaluation of energy intake using the Goldberg cut-off for energy intake:basal metabolic rate. A practical guide to its calculation, use and limitations. Int. J. Obes. Relat. Metab. Disord. 2000, 24, 1119–1130. [Google Scholar] [CrossRef] [PubMed] [Green Version]
  49. Armfield, J.M.; Spencer, A.J.; Roberts-Thomson, K.F.; Plastow, K. Water fluoridation and the association of sugar-sweetened beverage consumption and dental caries in Australian children. Am. J. Public Health 2013, 103, 494–500. [Google Scholar] [CrossRef] [PubMed]
  50. Bergmann, K. Reformulierte Lebensmittel in Deutschland-Bestandsaufnahme, Barrieren, Handlungsfelder. Ernährungsumschau 2019, 30–40. [Google Scholar] [CrossRef]
  51. Bundesministerium für Ernährung und Landwirtschaft. Nationale Reduktions-und Innovationsstrategie für Zucker, Fette und Salz in Fertigprodukten. Available online: https://www.bmel.de/SharedDocs/Downloads/Ernaehrung/NationaleReduktionsInnovationsstrategie-Kabinett.pdf?__blob=publicationFile (accessed on 14 December 2019).
  52. Bagus, T.; Roser, S.; Watzl, B. Reformulierung von Verarbeiteten Lebensmitteln. Bewertungen und Empfehlungen zur Reduktion des Zuckergehalts. Available online: https://www.mri.bund.de/fileadmin/MRI/Themen/Reformulierung/Reformulierung_Thema-Zucker.pdf (accessed on 13 December 2019).
  53. Krug, S.; Finger, J.D.; Lange, C.; Richter, A.; Mensink, G.B.M. Sport-und Ernährungsverhalten bei Kindern und Jugendlichen in Deutschland—Querschnittergebnisse Aus KiGGS Welle 2 und Trends. 2018. Available online: https://www.rki.de/DE/Content/Gesundheitsmonitoring/Gesundheitsberichterstattung/GBEDownloadsJ/Journal-of-Health-Monitoring_02_2018_KiGGS-Welle2_Gesundheitsverhalten.pdf?__blob=publicationFile (accessed on 11 December 2019).
  54. Mensink, G.B.M.; Schienkiewitz, A.; Rabenberg, M.; Borrmann, A.; Richter, A.; Haftenberger, M. Konsum zuckerhaltiger Erfrischungsgetränke bei Kindern und Jugendlichen in Deutschland—Querschnittergebnisse aus KiGGS Welle 2 und Trends. Available online: https://www.rki.de/DE/Content/Gesundheitsmonitoring/Gesundheitsberichterstattung/GBEDownloadsJ/FactSheets/JoHM_01_2018_zuckerhaltige_Getraenke_KiGGS-Welle2.pdf?__blob=publicationFile (accessed on 11 December 2019).
  55. Welsh, J.A.; Sharma, A.J.; Grellinger, L.; Vos, M.B. Consumption of added sugars is decreasing in the United States. Am. J. Clin. Nutr. 2011, 94, 726–734. [Google Scholar] [CrossRef] [Green Version]
  56. Stahl, A.; Vohmann, C.; Richter, A.; Heseker, H.; Mensink, G.B.M. Changes in food and nutrient intake of 6- to 17-year-old Germans between the 1980s and 2006. Public Health Nutr. 2009, 12, 1912–1923. [Google Scholar] [CrossRef] [Green Version]
  57. Lytle, L.A.; Seifert, S.; Greenstein, J.; McGovern, P. How do children’s eating patterns and food choices change over time? Results from a cohort study. Am. J. Health Promot. 2000, 14, 222–228. [Google Scholar] [CrossRef]
  58. Cheng, G.; Libuda, L.; Karaolis-Danckert, N.; Alexy, U.; Bolzenius, K.; Remer, T.; Buyken, A.E. Trends in dietary carbohydrate quality during puberty from 1988 to 2007: A cause for concern? Br. J. Nutr. 2010, 104, 1375–1383. [Google Scholar] [CrossRef] [Green Version]
  59. Chen, L.; Zhu, H.; Gutin, B.; Dong, Y. Race, Gender, Family Structure, Socioeconomic Status, Dietary Patterns, and Cardiovascular Health in Adolescents. Curr. Dev. Nutr. 2019, 3. [Google Scholar] [CrossRef]
  60. Mazarello Paes, V.; Hesketh, K.; O’Malley, C.; Moore, H.; Summerbell, C.; Griffin, S.; van Sluijs, E.M.F.; Ong, K.K.; Lakshman, R. Determinants of sugar-sweetened beverage consumption in young children: A systematic review. Obes. Rev. 2015, 16, 903–913. [Google Scholar] [CrossRef] [PubMed] [Green Version]
  61. Kranz, S.; Siega-Riz, A.M. Sociodemographic determinants of added sugar intake in preschoolers 2 to 5 years old. J. Pediatr. 2002, 140, 667–672. [Google Scholar] [CrossRef] [PubMed]
  62. Desbouys, L.; de Ridder, K.; Rouche, M.; Castetbon, K. Food Consumption in Adolescents and Young Adults: Age-Specific Socio-Economic and Cultural Disparities (Belgian Food Consumption Survey 2014). Nutrients 2019, 11, 1520. [Google Scholar] [CrossRef] [PubMed] [Green Version]
  63. Heuer, T. Zuckerkonsum in Deutschland. Aktuel Ernahr. 2018, 43, S8–S11. [Google Scholar] [CrossRef]
  64. Mensink, G.B.M.; Kleiser, C.; Richter, A. Lebensmittelverzehr bei Kindern und Jugendlichen in Deutschland. Ergebnisse des Kinder- und Jugendgesundheitssurveys (KiGGS). Bundesgesundheitsblatt Gesundh. Gesundh. 2007, 50, 609–623. [Google Scholar] [CrossRef] [Green Version]
  65. Sluik, D.; van Lee, L.; Engelen, A.I.; Feskens, E.J.M. Total, Free, and Added Sugar Consumption and Adherence to Guidelines: The Dutch National Food Consumption Survey 2007–2010. Nutrients 2016, 8, 70. [Google Scholar] [CrossRef]
  66. Azaïs-Braesco, V.; Sluik, D.; Maillot, M.; Kok, F.; Moreno, L.A. A review of total & added sugar intakes and dietary sources in Europe. Nutr. J. 2017, 16, 6. [Google Scholar] [CrossRef] [Green Version]
  67. Svensson, A.; Larsson, C.; Eiben, G.; Lanfer, A.; Pala, V.; Hebestreit, A.; Huybrechts, I.; Fernández-Alvira, J.M.; Russo, P.; Koni, A.C.; et al. European children’s sugar intake on weekdays versus weekends: The IDEFICS study. Eur. J. Clin. Nutr. 2014, 68, 822–828. [Google Scholar] [CrossRef]
Figure 1. Percentages of FS intake from food groups, stratified by time period (1985–1995, 1996–2005, 2006–2016).
Nutrients 12 00020 g001
Figure 2. Time and age trends in FS intake from sugar & sweets among girls (a) and boys (b) of 10,761 dietary records of 660 male and 652 female DONALD study participants (3–18 years) between 1985 and 2016, predicted by polynomial mixed-effects regression models (see Table 5) (blue rhombi 3/4 year-olds, red squares 5/6 year-olds, green triangles 7/8 year-olds, purple crosses 9/10 year-olds, turquoise stars 11/12 year-olds, orange circles 13/14 year-olds, light blue rhombi 15/16 year-olds, pink circles 17/18 year-olds).
Nutrients 12 00020 g002
Figure 3. Time and age trends in FS intake from juices of 10,761 dietary records of 1312 DONALD study participants (3–18 years) between 1985 and 2016, predicted by polynomial mixed-effects regression models (see Table 5) (blue rhombi 3/4 year-olds, red squares 5/6 year-olds, green triangles 7/8 year-olds, purple crosses 9/10 year-olds, turquoise stars 11/12 year-olds, orange circles 13/14 year-olds, light blue rhombi 15/16-year-olds, pink circles 17/18 year-olds).
Nutrients 12 00020 g003
Figure 4. Time and age trends in FS intake from dairy products of 10,761 dietary records of 1312 DONALD study participants (3–18 years) between 1985 and 2016, predicted by polynomial mixed-effects regression models (see Table 5) (blue rhombi 3/4 year-olds, red squares 5/6 year-olds, green triangles 7/8 year-olds, purple crosses 9/10 year-olds, turquoise stars 11/12 year-olds, orange circles 13/14 year-olds, light blue rhombi 15/16 year-olds, pink circles 17/18 year-olds).
Nutrients 12 00020 g004
Figure 5. Time and age trends in FS intake from SSB among girls (a) and boys (b) of 10,761 dietary records of 660 male and 652 female DONALD study participants (3–18 years) between 1985 and 2016, predicted by polynomial mixed-effects regression models (see Table 5) (blue rhombi 3/4 year-olds, red squares 5/6 year-olds, green triangles 7/8 year-olds, purple crosses 9/10 year-olds, turquoise stars 11/12 year-olds, orange circles 13/14 year-olds, light blue rhombi 15/16 year-olds, pink circles 17/18 year-olds).
Nutrients 12 00020 g005
Table 1. Classifications of the food groups.
Food GroupComponents
Sugar & sweetsSugars and other sweeteners (including syrups), sweet spreads, sweets and marshmallows, chocolate and bars, ice cream, jelly desserts, sweet sauces, sweet baking ingredients (e.g., marzipan)
Dairy productsunfermented (e.g., milk, cream, pudding) and fermented dairy products (e.g., yoghurt, buttermilk) all types of cheese (e.g., cream, soft, hard and processed cheese), dairy powder, vegan milk and cheese substitutes, instant milk beverages (e.g., cocoa)
Fruits & vegetablesFresh, frozen, canned and dried fruits and vegetables
JuicesFruits and vegetable juices, juice spritzers and smoothies
Sugar sweetened beverages (SSB)Sweetened fruit juice drinks and nectars, soft drinks/sodas, sweetened teas and waters, instant beverages (except dairy drinks), sweetened sport drinks
Sweet bread & cakesSweet breads, pastries, cakes, pies, baking mixtures
Ready to eat breakfast cereals (RTC)Ready to eat cereals and mueslis
OthersEggs and egg meals (e.g., pancakes), meat and meat products, fish and fish products, vegetarian/vegan meat substitutes and spreads, fats and oils, flours, grains, breads, doughs, salty snacks, noodles, pasta, potatoes and potato products, nuts and seeds, legumes, alcoholic drinks, unsweetened teas, ready to eat meals, instant soups, sauces and dressings, spices, formula and baby food
Table 2. Participants’ overweight status and maternal characteristics of 1312 DONALD study participants.
Female652 (49.7)
Anthropometrics
Overweight 1161 (12.3)
Maternal characteristics
Overweight 2432 (32.9)
High educational status 3817 (62.3)
Employment784 (59.8)
Values are frequencies (%); %E = percentage of total daily energy intake; 1 BMI cutoff values for children and adolescents [40]; 2 BMI > 25 kg/m2; 3 ≥12 years of schooling.
Table 3. Dietary characteristics from 10,761 dietary records of 1312 DONALD study participants (3–18 years) between 1985 and 2016, stratified by sex (n = 660 boys, n = 652 girls) and time periods.
GirlsBoys
1985–19951996–20052006–20161985–19951996–20052006–2016
nrecords134819771953137519452163
Age7.0 (4.7; 10.1)9.0 (6.0; 13.0)10.0 (6.0; 14.0)7.0 (4.9; 10.3)9.1 (6.0; 13.1)9.3 (6.0; 14.0)
TEI [kcal]1390 (1156; 1680)1495 (1238; 1785)1524 (1265; 1821)1596 (1307; 1917)1742 (1409; 2162) 1731 (1372; 2139)
TEI/BMR1.4 (1.2; 1.6)1.4 (1.2; 1.5)1.4 (1.2; 1.5)1.5 (1.3; 1.6)1.4 (1.2; 1.6)1.4 (1.2; 1.6)
Carbohydrates [%E]49.8 (46.1; 53.5)52.1 (48.3; 55.8)52.3 (48.4; 56.3)49.8 (46.0; 53.9)51.9 (47.9; 55.9)52.1 (48.1; 55.9)
Total sugar [%E]27.5 (23.6; 31.7)27.5 (23.1; 32.0)25.5 (21.0; 30.6)27.1 (23.2; 31.9)27.6 (22.9; 32.1)25.6 (21.0; 30.1)
Added sugar [%E]12.5 (8.8; 16.4)12.9 (9.4; 16.9)11.8 (8.7; 15.5)12.8 (9.3; 16.6)13.0 (9.7; 17.3)12.0 (8.9; 15.4)
Free sugar intake [%E]16.5 (12.3; 20.6)17.3 (13.2; 21.9)16.0 (11.6; 20.4)16.3 (12.3; 20.7)17.9 (13.8; 22.4)16.1 (12.1; 20.8)
FS from sugar & sweets5.8 (3.7; 8.2)5.5 (3.5; 8.0)5.0 (3.0; 7.6)5.5 (3.6; 7.8)4.9 (2.9; 7.7)4.7 (2.8; 7.2)
FS from juices2.5 (0.0; 5.7)3.2 (0.0; 6.5)2.8 (0.0; 6.2)2.1 (0.0; 5.1)3.4 (0.7; 6.9)2.9 (0.0; 6.2)
FS from dairy products1.6 (0.4; 3.0)1.6 (0.4; 2.9)1.5 (0.3; 2.8)1.6 (0.4; 3.0)1.6 (0.4; 3.2)1.5 (0.1; 3.1)
FS from SSB1.9 (0.0; 5.0)1.5 (0.0; 4.9)0.0 (0.0; 3.3)2.2 (0.0; 5.6)2.1 (0.0; 4.9)0.9 (0.0; 3.8)
FS from sweet breads & cakes0.8 (0.1; 1.7)0.9 (0.1; 2.0)1.1 (0.2; 2.3)0.7 (0.0; 1.8)0.7 (0.0; 1.8)1.0 (0.0; 2.3)
FS from RTC0.0 (0.0; 0.3)0.0 (0.0; 1.0)0.0 (0.0; 0.8)0.0 (0.0; 0.5)0.0 (0.0; 1.5)0.0 (0.0; 1.1)
FS from others0.1 (0.0; 0.3)0.2 (0.1; 0.5)0.4 (0.2; 0.8)0.1 (0.0; 0.3)0.2 (0.0; 0.5)0.4 (0.2; 0.8)
FS from fruits & vegetables0.0 (0.0; 0.2)0.0 (0.0; 0.0)0.0 (0.0; 0.0)0.0 (0.0; 0.2)0.0 (0.0; 0.0)0.0 (0.0; 0.0)
Values are medians (25th, 75th percentile); nrecords = number of records; TEI total energy intake; TEI/BMR total energy intake/basal metabolic rate; FS = Free sugar; %E = Percentage of total daily energy intake, RTC = Ready-to-eat cereals.
Table 4. Dietary characteristics from 10,761 dietary records of 1312 DONALD study participants (3–18 years) between 1985 and 2016, stratified by sex (n = 660 boys, n = 652 girls) and age groups.
GirlsBoys
3–5 Years6–10 Years11–14 Years15–18 Years3–5 Years6–10 Years11–14 Years15–18 Years
nrecords138218951163838142819781216861
TEI [kcal]11331497177217711242167320102452
(1003; 1274)(1309; 1685)(1529; 2021)(1498; 2056)(1091; 1402)(1466; 1884)(1743; 2319)(2100; 2819)
TEI/BMR1.36 (1.23; 1.51)1.43 (1.28;1.59)1.35 (1.15; 1.52)1.19 (1.00; 1.40)1.39 (1.24; 1.54)1.49 (1.32; 1.64)1.36 (1.17; 1.54)1.31 (1.11; 1.51)
Carbohydrates [%E]51.4 (47.4; 55.3)51.8 (48.2; 55.7)51.4 (47.5; 55.5)51.4 (47.2; 55.6)51.8 (47.9; 56.1)51.8 (47.9; 55.6)51.3 (47.6; 55.1)50.1 (45.9; 54.5)
Total sugar [%E]28.1 (24.0; 32.7)27.4 (23.3; 31.6)25.6 (21.3; 30.3)25.0 (19.8; 30.0)28.5 (24.4; 33.5)26.9 (23.0; 31.2)25.7 (21.3; 30.3)23.5 (19.5; 28.7)
Added sugar [%E]11.6 (8.6; 14.9)13.3 (9.9; 16.8)12.8 (8.9; 15.6)11.6 (7.9; 15.8)11.7 (8.5; 15.3)13.0 (9.7; 16.6)13.2 (9.7; 17.2)12.2 (8.5; 16.5)
Free sugar intake [%E]16.3 (12.1; 20.6)17.5 (13.4; 21.5)16.7 (12.4; 21.3)15.2 (10.8; 20.0)16.9 (12.6; 21.7)17.0 (13.1; 21.4)16.9 (13.0; 21.4)15.8 (11.7; 20.7)
FS from sugar & sweets 5.4 (3.4; 7.9)6.0 (3.9; 8.6)5.3 (3.3; 7.9)4.0 (2.2; 6.5)5.2 (3.3; 7.6)5.5 (3.5; 7.8)4.9 (3.0; 7.6)3.8 (1.8; 6.1)
FS from juices 3.6 (0.7; 7.1)3.0 (0.0; 6.4)2.4 (0.0; 5.5)1.8 (0.0; 5.2)4.0 (1.1, 7.6)2.8 (0.0; 6.2)2.2 (0.0; 5.2)2.2 (0.0; 5.2)
FS from dairy products 1.8 (0.5; 3.3)1.7 (0.6; 3.1)1.4 (0.2; 2.6)1.1 (0.0; 2.4)1.8 (0.5; 3.4)1.7 (0.5; 3.3)1.4 (0.2; 2.8)1.0 (0.0; 2.5)
FS from SSB 0.0 (0.0; 2.7)1.2 (0.0; 4.1)1.9 (0.0; 5.6)1.9 (0.0; 5.9)0.0 (0.0; 2.8)1.6 (0.0; 4.4)2.5 (0.0; 6.5)3.2 (0.0; 7.6)
FS from sweet breads & cakes 1.1 (0.3; 2.2)1.1 (0.2; 2.2)0.8 (0.0; 1.9)0.7 (0.0; 1.9)1.0 (0.0; 2.2)1.0 (0.1; 2.2)0.6 (0.0; 1.8)0.3 (0.0; 1.4)
FS from RTC 0.0 (0.0; 0.5)0.0 (0.0; 0.9)0.0 (0.0; 0.9)0.0 (0.0; 0.9)0.0 (0.0; 0.6)0.1 (0.0; 1.4)0.0 (0.0; 1.3)0.0 (0.0; 1.1)
FS from others 0.2 (0.0; 0.4)0.2 (0.0; 0.5)0.3 (0.1; 0.7)0.4 (0.1; 0.8)0.2 (0.0; 0.5)0.2 (0.1; 0.6)0.3 (0.1; 0.7)0.4 (0.1; 0.9)
FS from fruits & vegetables 0.0 (0.0; 0.0)0.0 (0.0; 0.0)0.0 (0.0; 0.0)0.0 (0.0; 0.0)0.0 (0.0; 0.0)0.0 (0.0; 0.0)0.0 (0.0; 0.0)0.0 (0.0; 0.0)
Values are medians (25th, 75th percentile); nrecords = number of records; TEI total energy intake; TEI/BMR total energy intake/basal metabolic rate; FS = Free sugar; %E = Percentage of total daily energy intake, RTC = Ready to eat cereals.
Table 5. Time and age trends in free sugar intake from different food groups of 10,761 dietary records of 1312 DONALD study participants (n = 660 boys, n = 652 girls) (3–18 years) between 1985 and 2016.
Age Trend Per Year of Age (3–18 Years) aTime Trend Per Study Year (1985–2016) bInteraction of Time and Age
Age β (p)Age2 β (p)Age3 β (p)Time β (p)Time2 β (p)Time3 β (p)Age × Time β (p)
FS from sugar & sweets
Girls c Unadjusted model0.9268 (<0.0001)−0.07895 (<0.0001)0.001717 (0.0029)−0.04032 (<0.0001)
Adjusted model0.9330 (<0.0001)−0.07851 (<0.0001)0.001697 (0.0033)−0.04294 (<0.0001)
Boys d Unadjusted model0.3994 (<0.0001)−0.02390 (<0.0001) 0.01535 (0.8293)−0.00605 (0.2198)0.000156 (0.1144)
Adjusted model0.4158 (<0.0001)−0.02409 (<0.0001)0.01052 (0.8833)−0.00548 (0.2700)0.000144 (0.1482)
FS from juicese
Unadjusted model−0.7443 (0.0001)0.05349 (0.0009)−0.00136 (0.0084)0.3250 (<0.0001)−0.00895 (<0.0001)
Adjusted model−0.7304 (0.0001)0.05339 (0.0009)−0.00136 (0.0082)0.3150 (<0.0001)−0.00892 (<0.0001)
FS from dairy productsf
Unadjusted model0.1192 (0.0699)−0.01531 (0.0273)0.000471 (0.0352)−0.03703 (0.1907)0.006421 (0.0009)−0.00017 (<0.0001)−0.00149 (0.0489)
Adjusted model0.1159 (0.0780)−0.01604 (0.0207)0.000492 (0.0280)−0.02873 (0.3094)0.006435 (0.0009)−0.00017 (<0.0001)−0.00140 (0.0634)
FS from SSB
Girls g Unadjusted model−0.04422 (0.8096)0.03543 (0.0715)−0.00144 (0.0241)−0.4051 (<0.0001)0.02430 (<0.0001)−0.00049 (<0.0001)
Adjusted model−0.07104 (0.6987)0.03659 (0.0629)−0.00148 (0.0211)−0.3789 (<0.0001)0.02412 (<0.0001)−0.00049 (<0.0001)
Boys h Unadjusted model0.2649 (<0.0001) −0.2793 (0.0004)0.01462 (0.0085)−0.00030 (0.0072)
Adjusted model0.2433 (<0.0001)−0.2359 (0.0028)0.01329 (0.0165)−0.00028 (0.0135)
Time and age trends were tested using polynomial mixed-effects regression models; significant p-values of the adjusted models are marked bold; FS = Free sugar; SSB = Sugar sweetened beverages; a age = linear age trend, age2 = quadratic age trend, age3 = cubic age trend, b time = linear time trend, time2 = quadratic time trend, time3 = cubic time trend; c Model contains a random statement for the family level with an unstructured covariance structure and a random statement for the person level with an unstructured covariance structure. Adjusted for number of weekdays per record (1/2/3) and overweight status (yes/no); d Model contains a random statement for the family level with an unstructured covariance structure and a random statement for the person level with an unstructured covariance structure. Adjusted for overweight status (yes/no), number of weekdays per record (1/2/3), maternal employment (yes/no), high maternal educational status (yes/no); e Model contains a repeated statement with a heterogeneous Toeplitz covariance structure. Adjusted for overweight status (yes/no), high maternal educational status (yes/no); f Model contains a random statement for the family level with an unstructured covariance structure and a random statement for the person level with an unstructured covariance structure. Adjusted for high maternal educational status (yes/no), number of weekdays per record (1/2/3); g Model contains a random statement for the family level with an unstructured covariance structure and a random statement for the person level with an unstructured covariance structure. Adjusted for high maternal educational status (yes/no), number of weekdays per record (1/2/3); h Model contains a repeated statement with a heterogeneous Toeplitz covariance structure. Adjusted for high maternal educational status (yes/no).

