Associations of Breast Milk Microbiota, Immune Factors, and Fatty Acids in the Rat Mother–Offspring Pair

 ,
,  ,
,  , ,
, ,  ,
,  , and
, and
Abstract
:1. Introduction
2. Materials and Methods
2.1. Animals
2.2. Experimental Design and Sample Collection
2.3. Lipid Extraction, Methylation, and Quantification of FA
2.4. Quantification of Ig and Cytokines
2.5. Microbial DNA Extraction and Sequencing
2.6. Processing of Sequences
2.7. Analysis of the Microbiota Composition
2.8. Statistical Analysis
3. Results
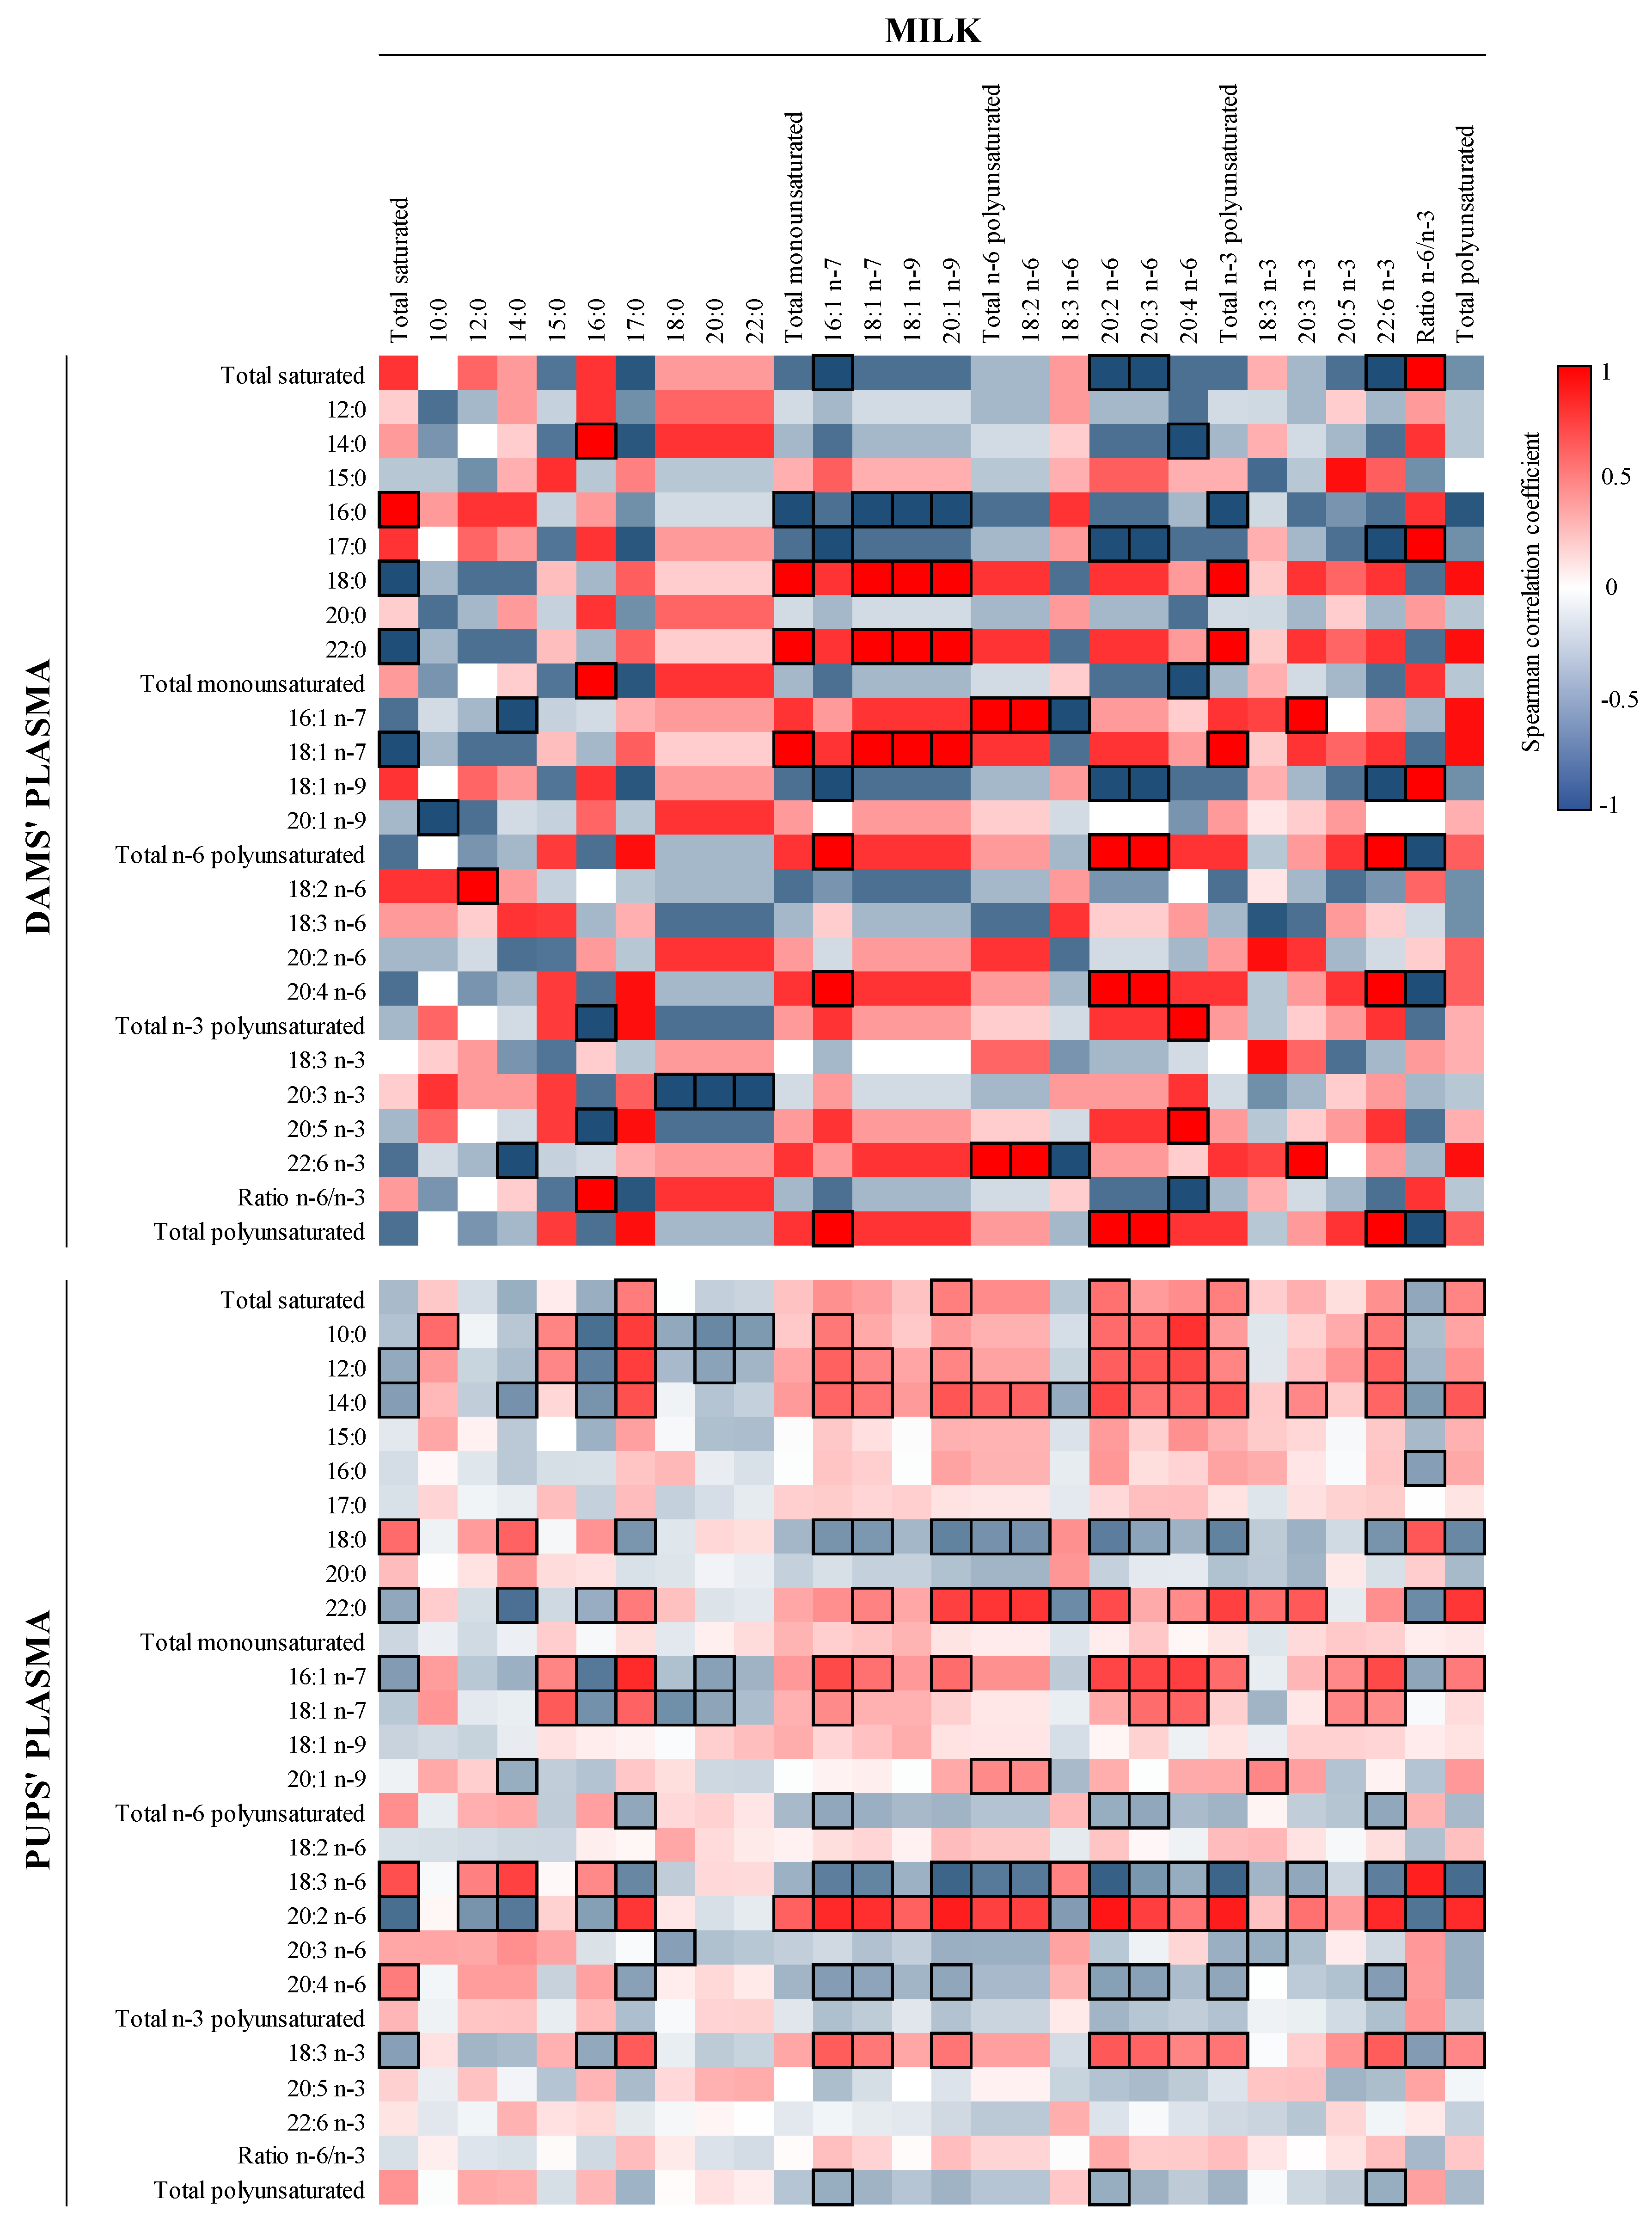
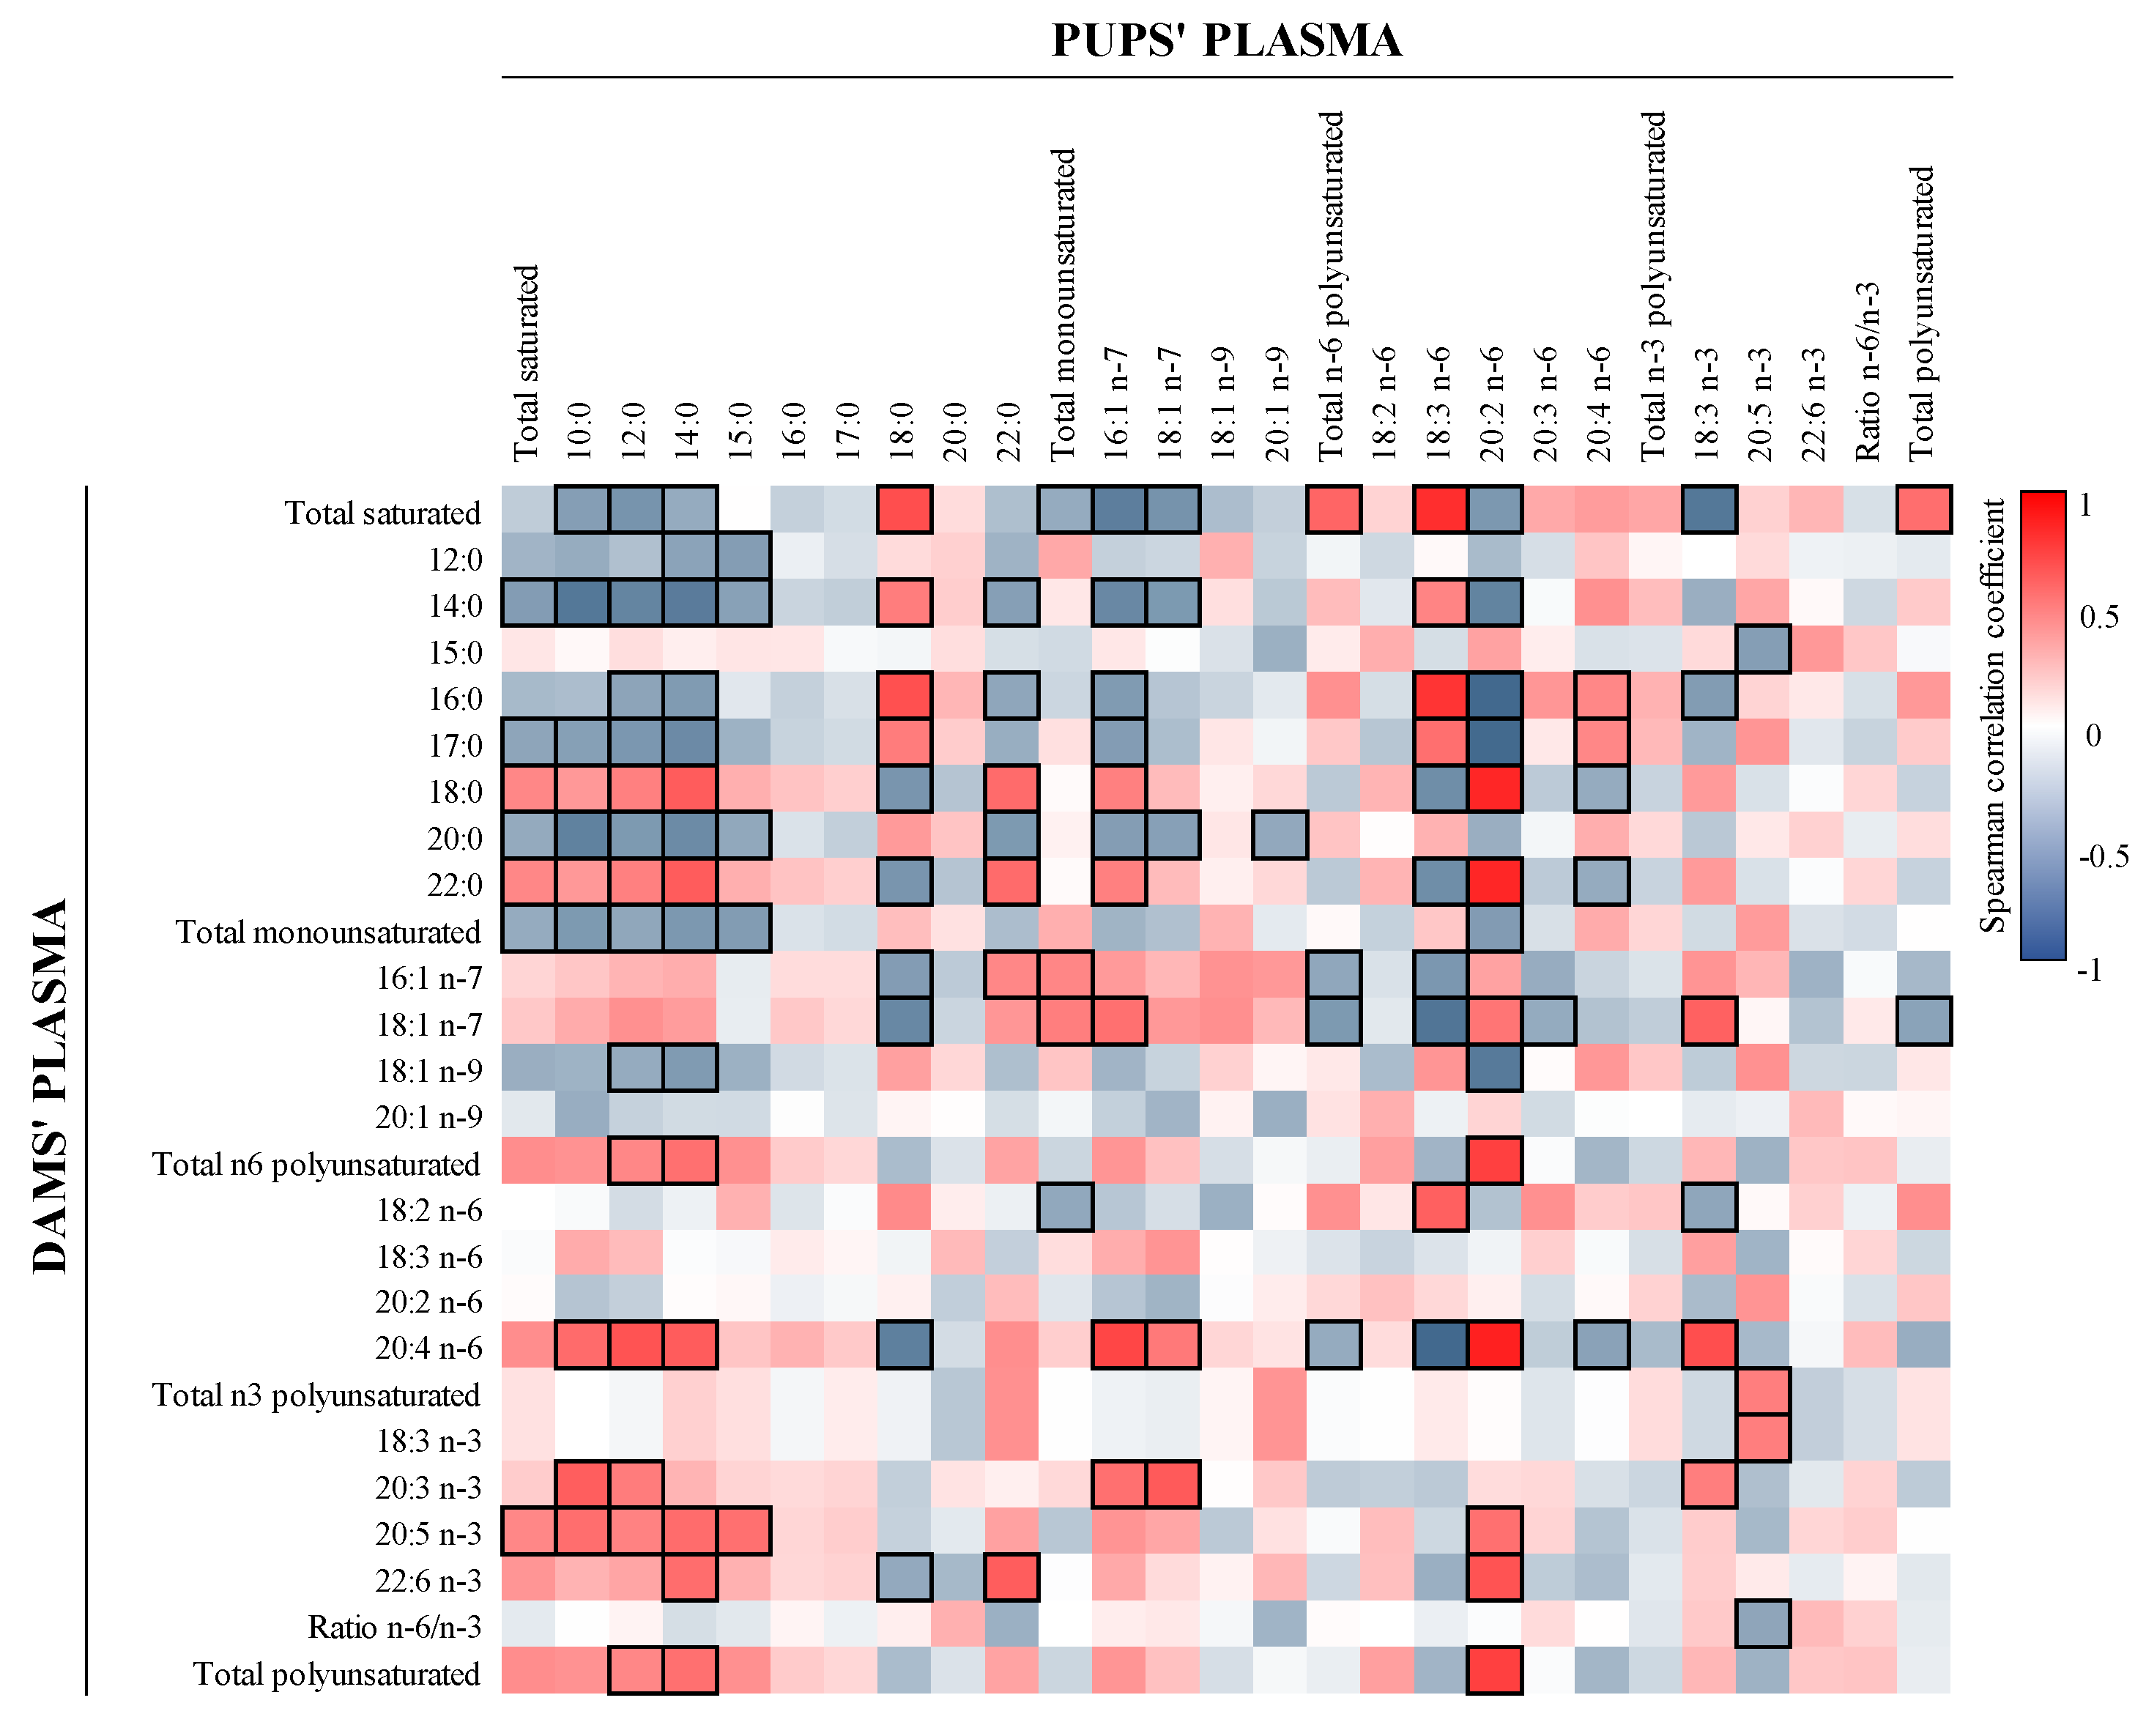
3.1. FA Composition
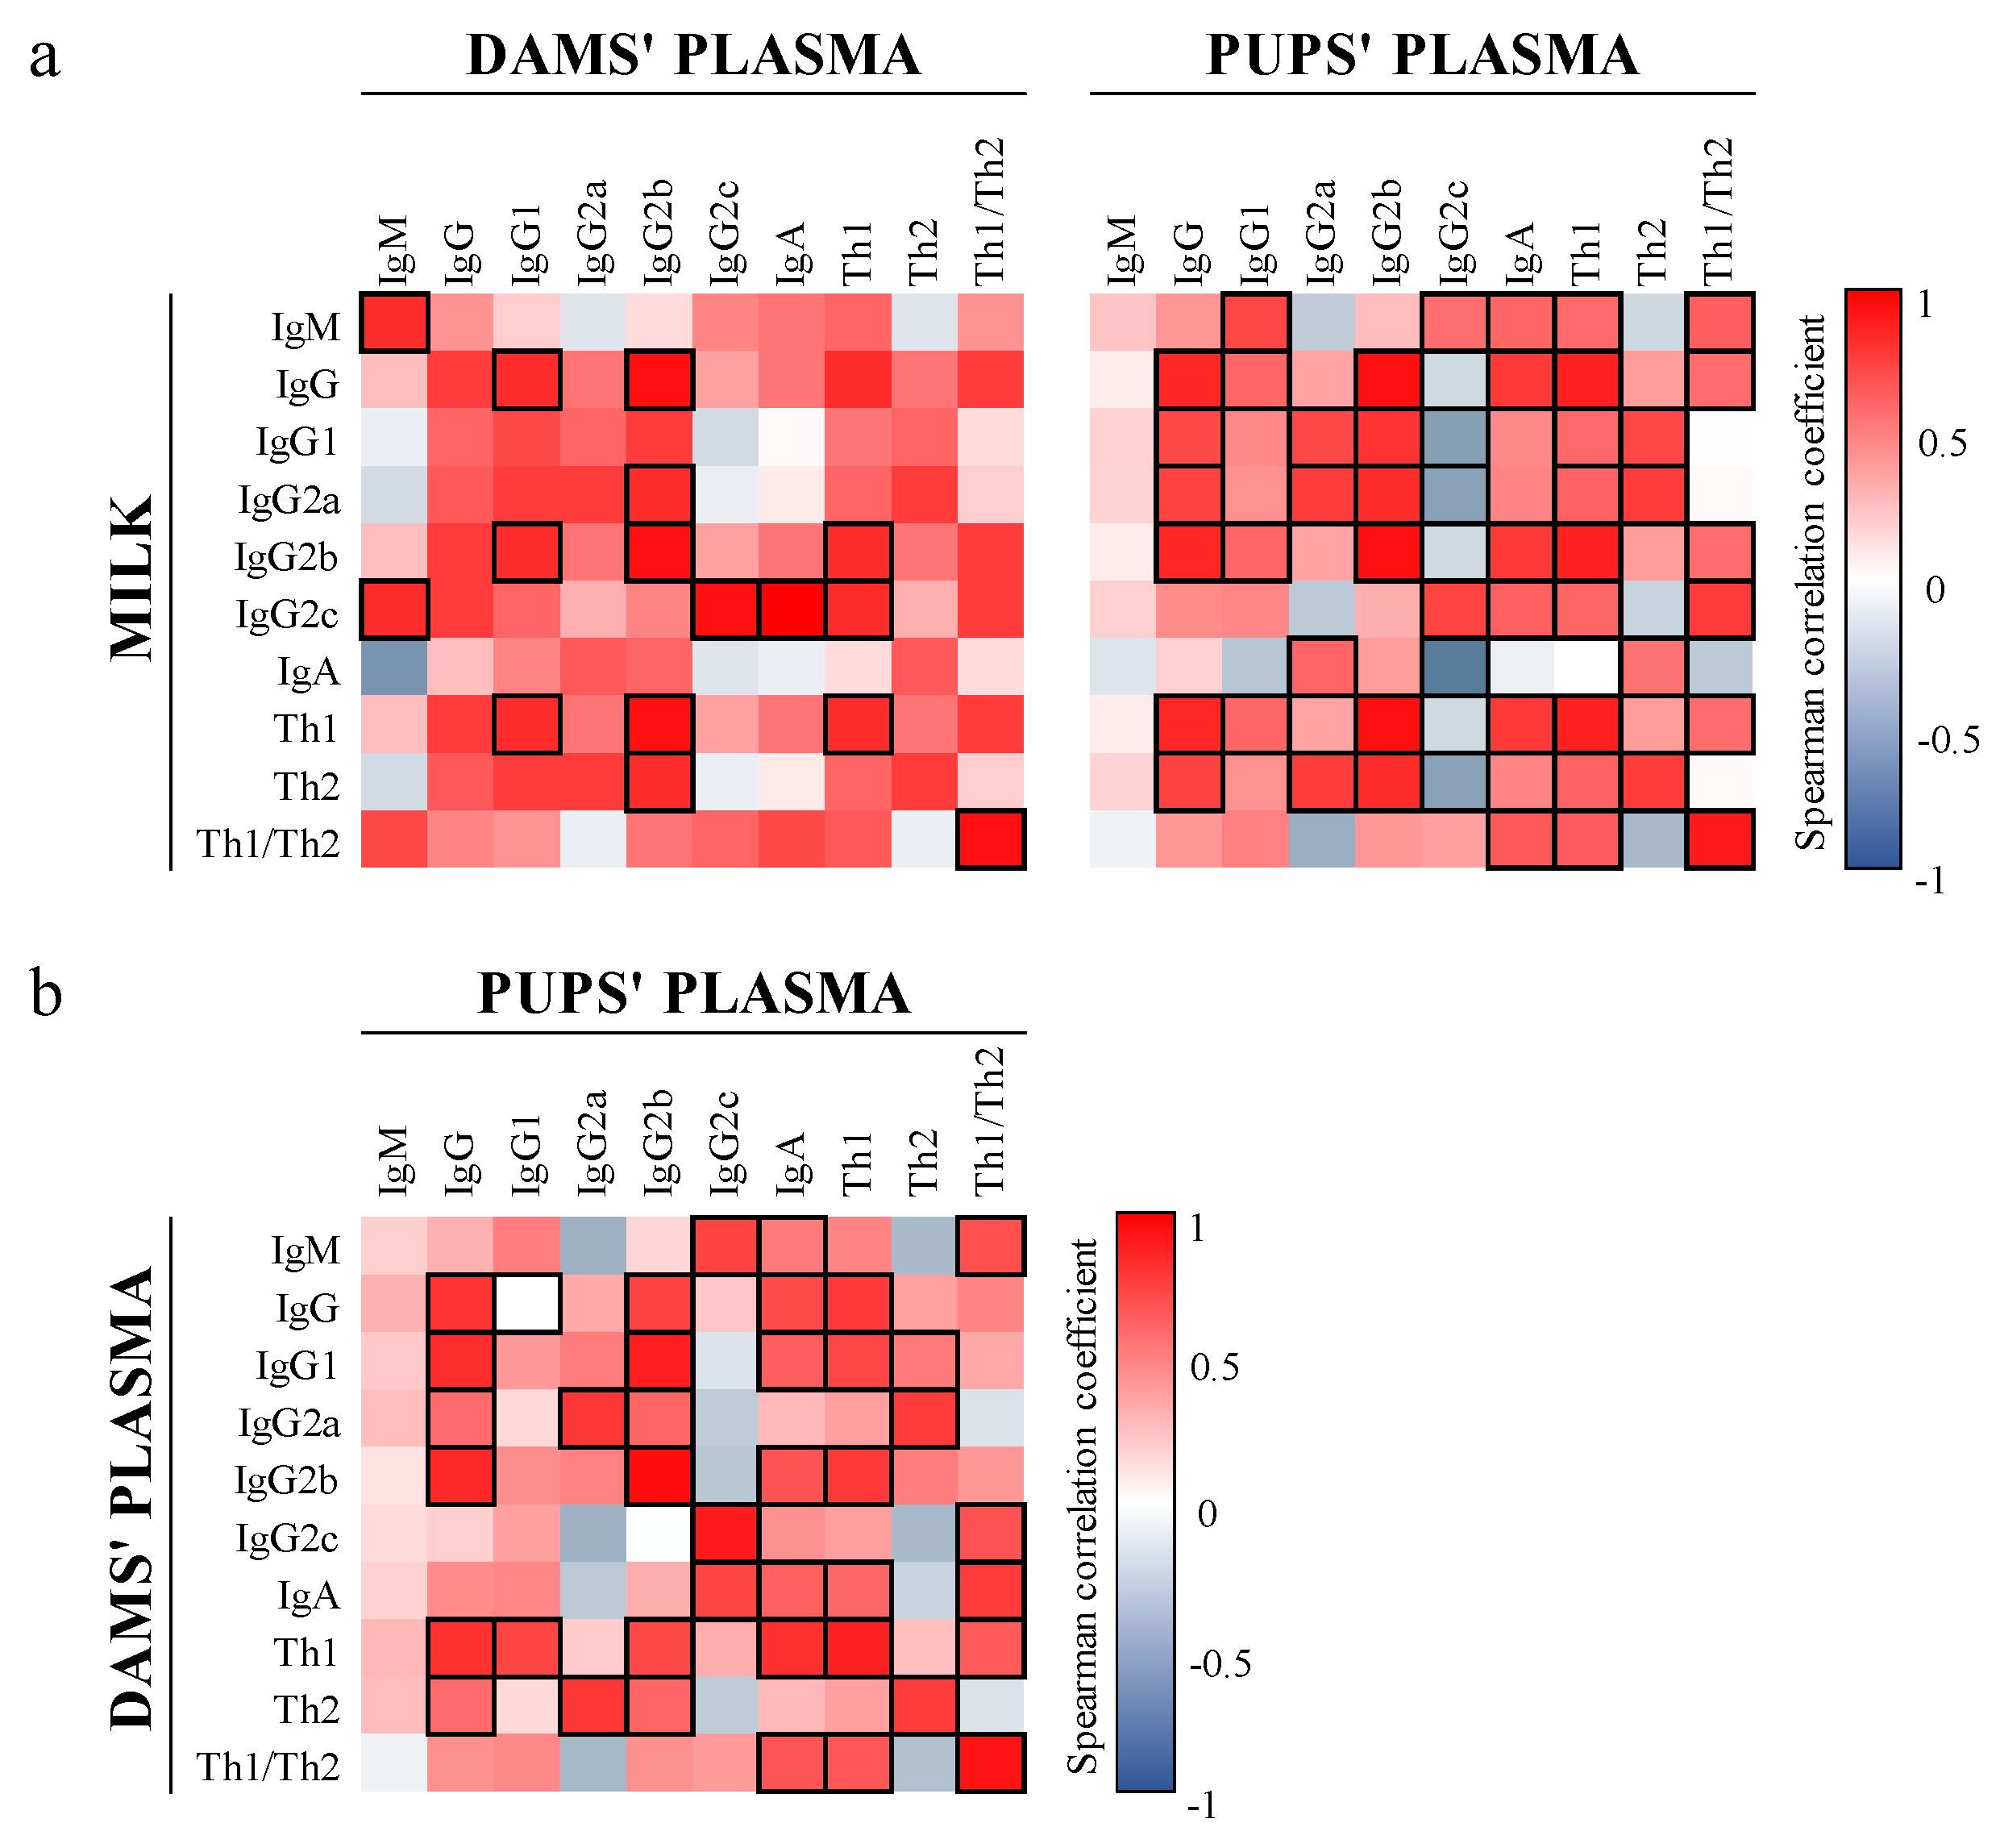
3.2. Ig Profile
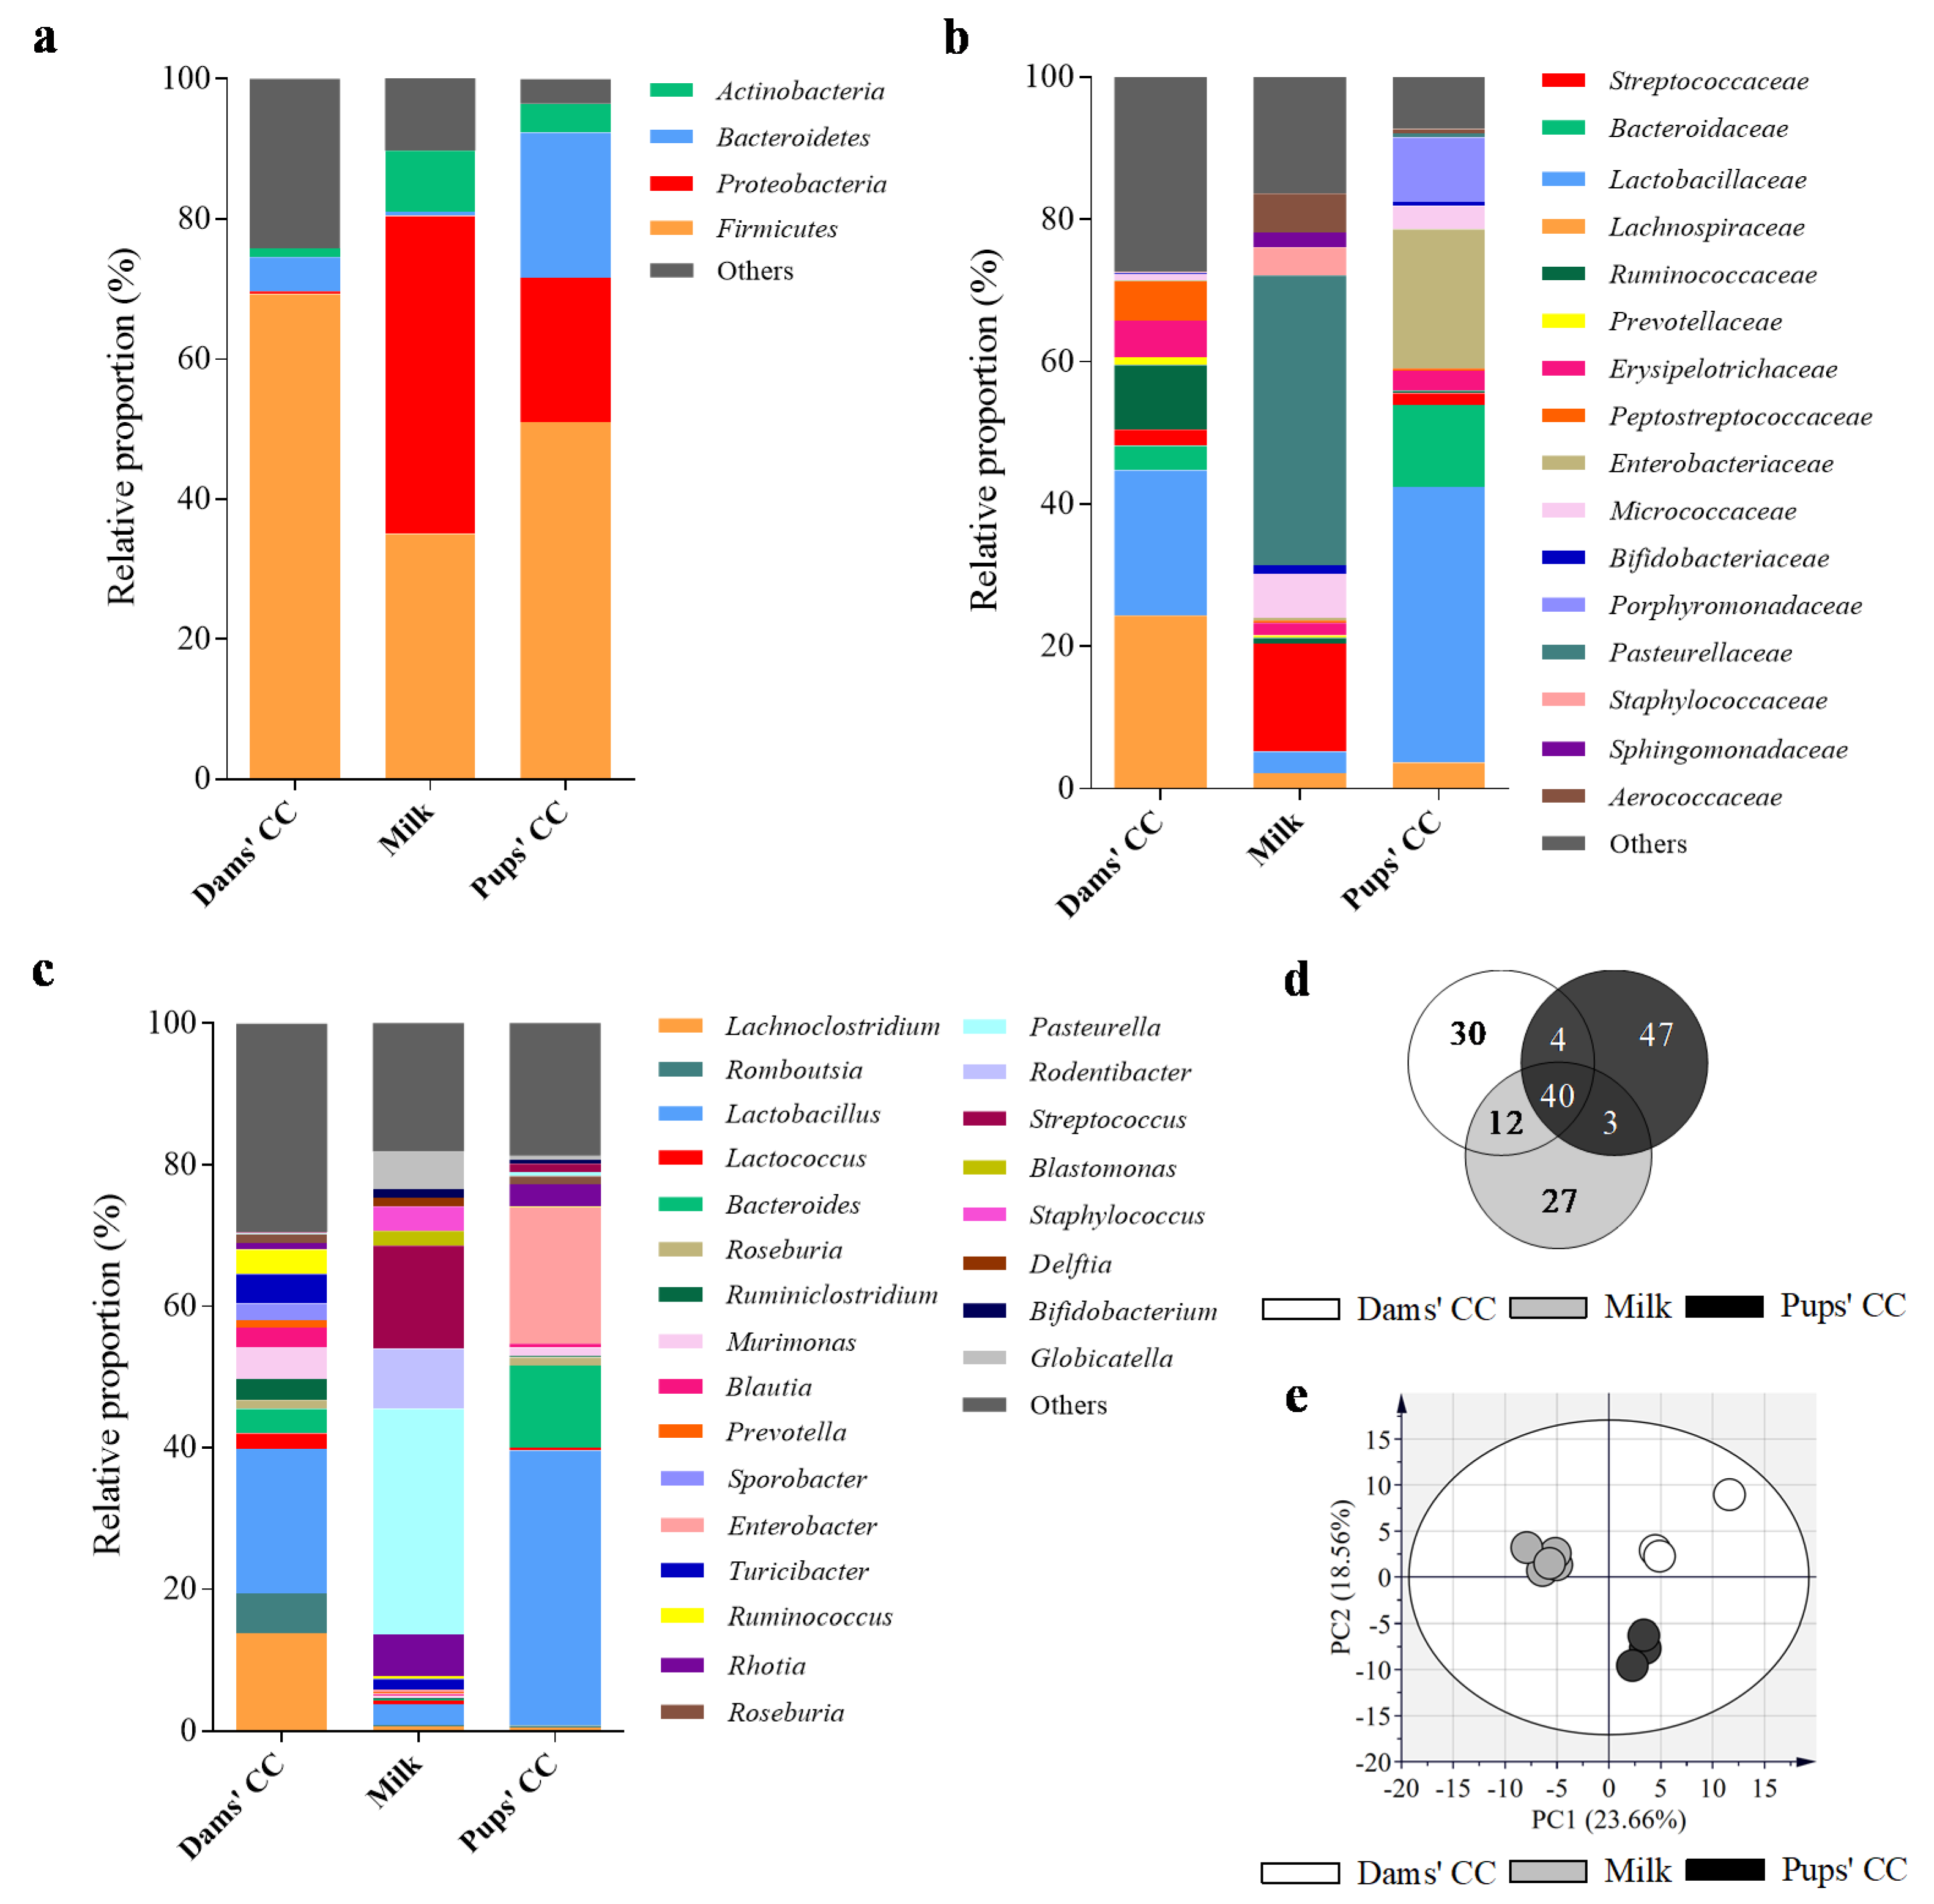
3.3. Microbiota Composition
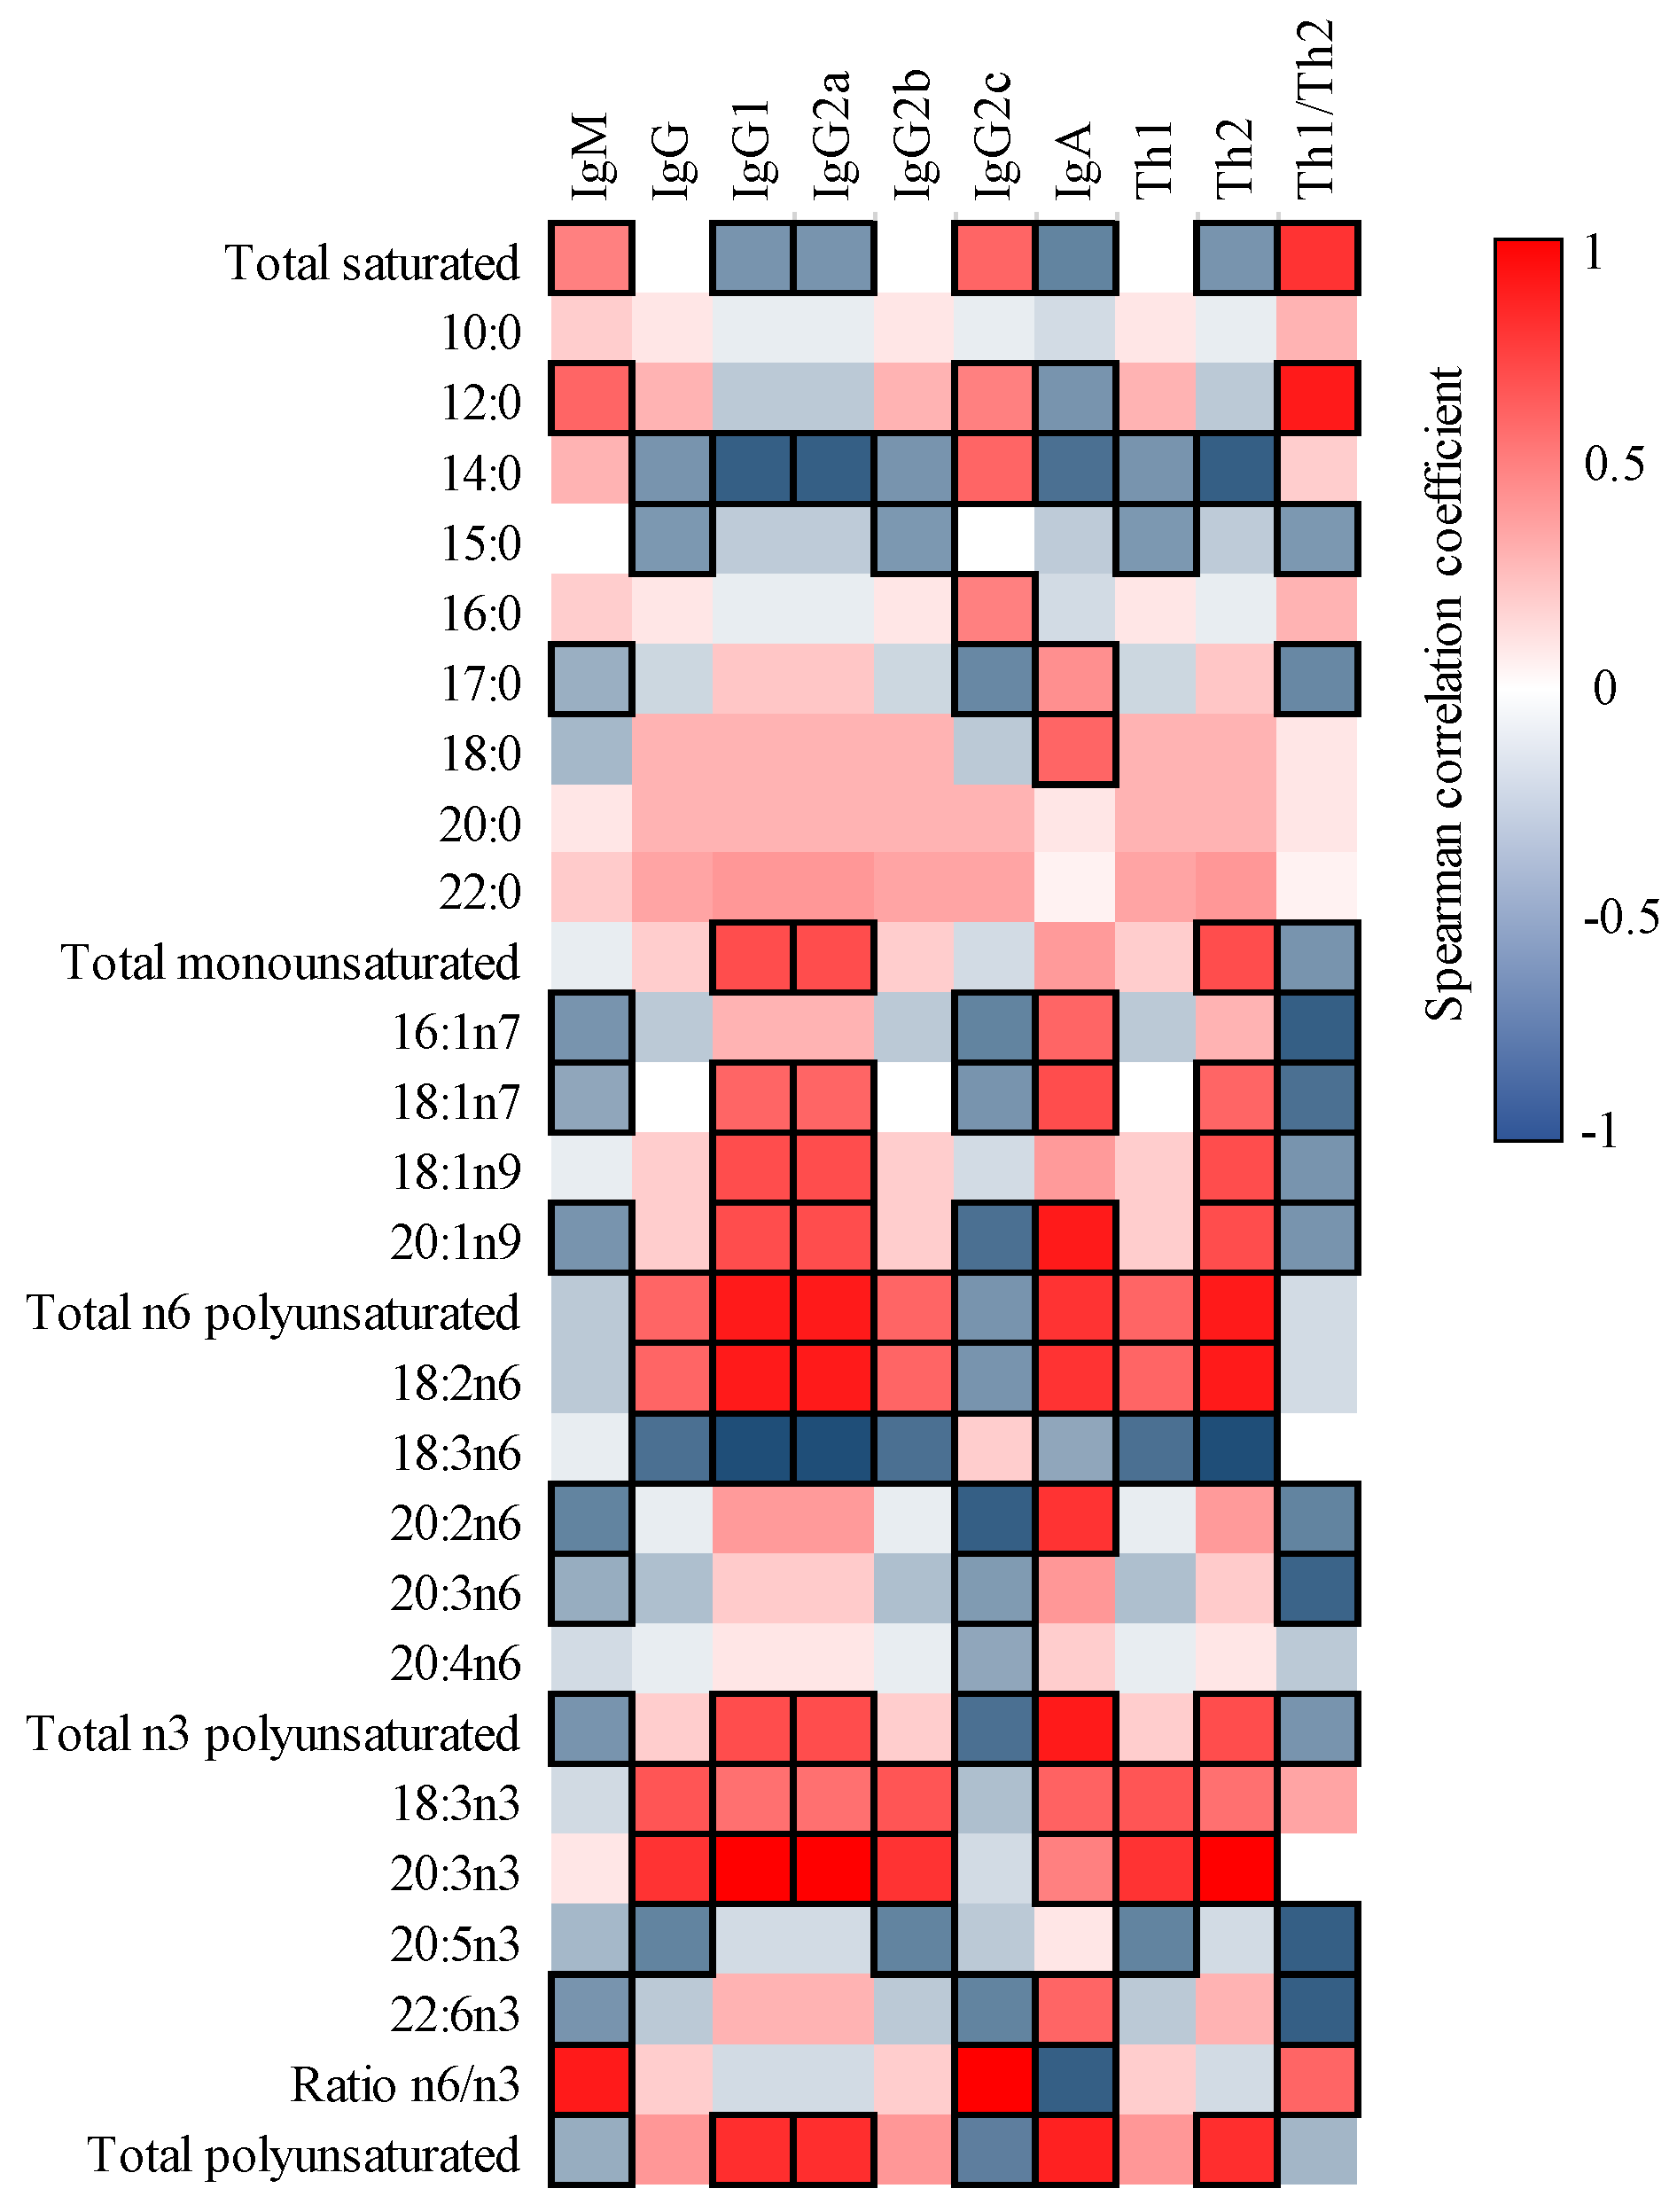
3.4. Correlation between FA and Ig in Milk
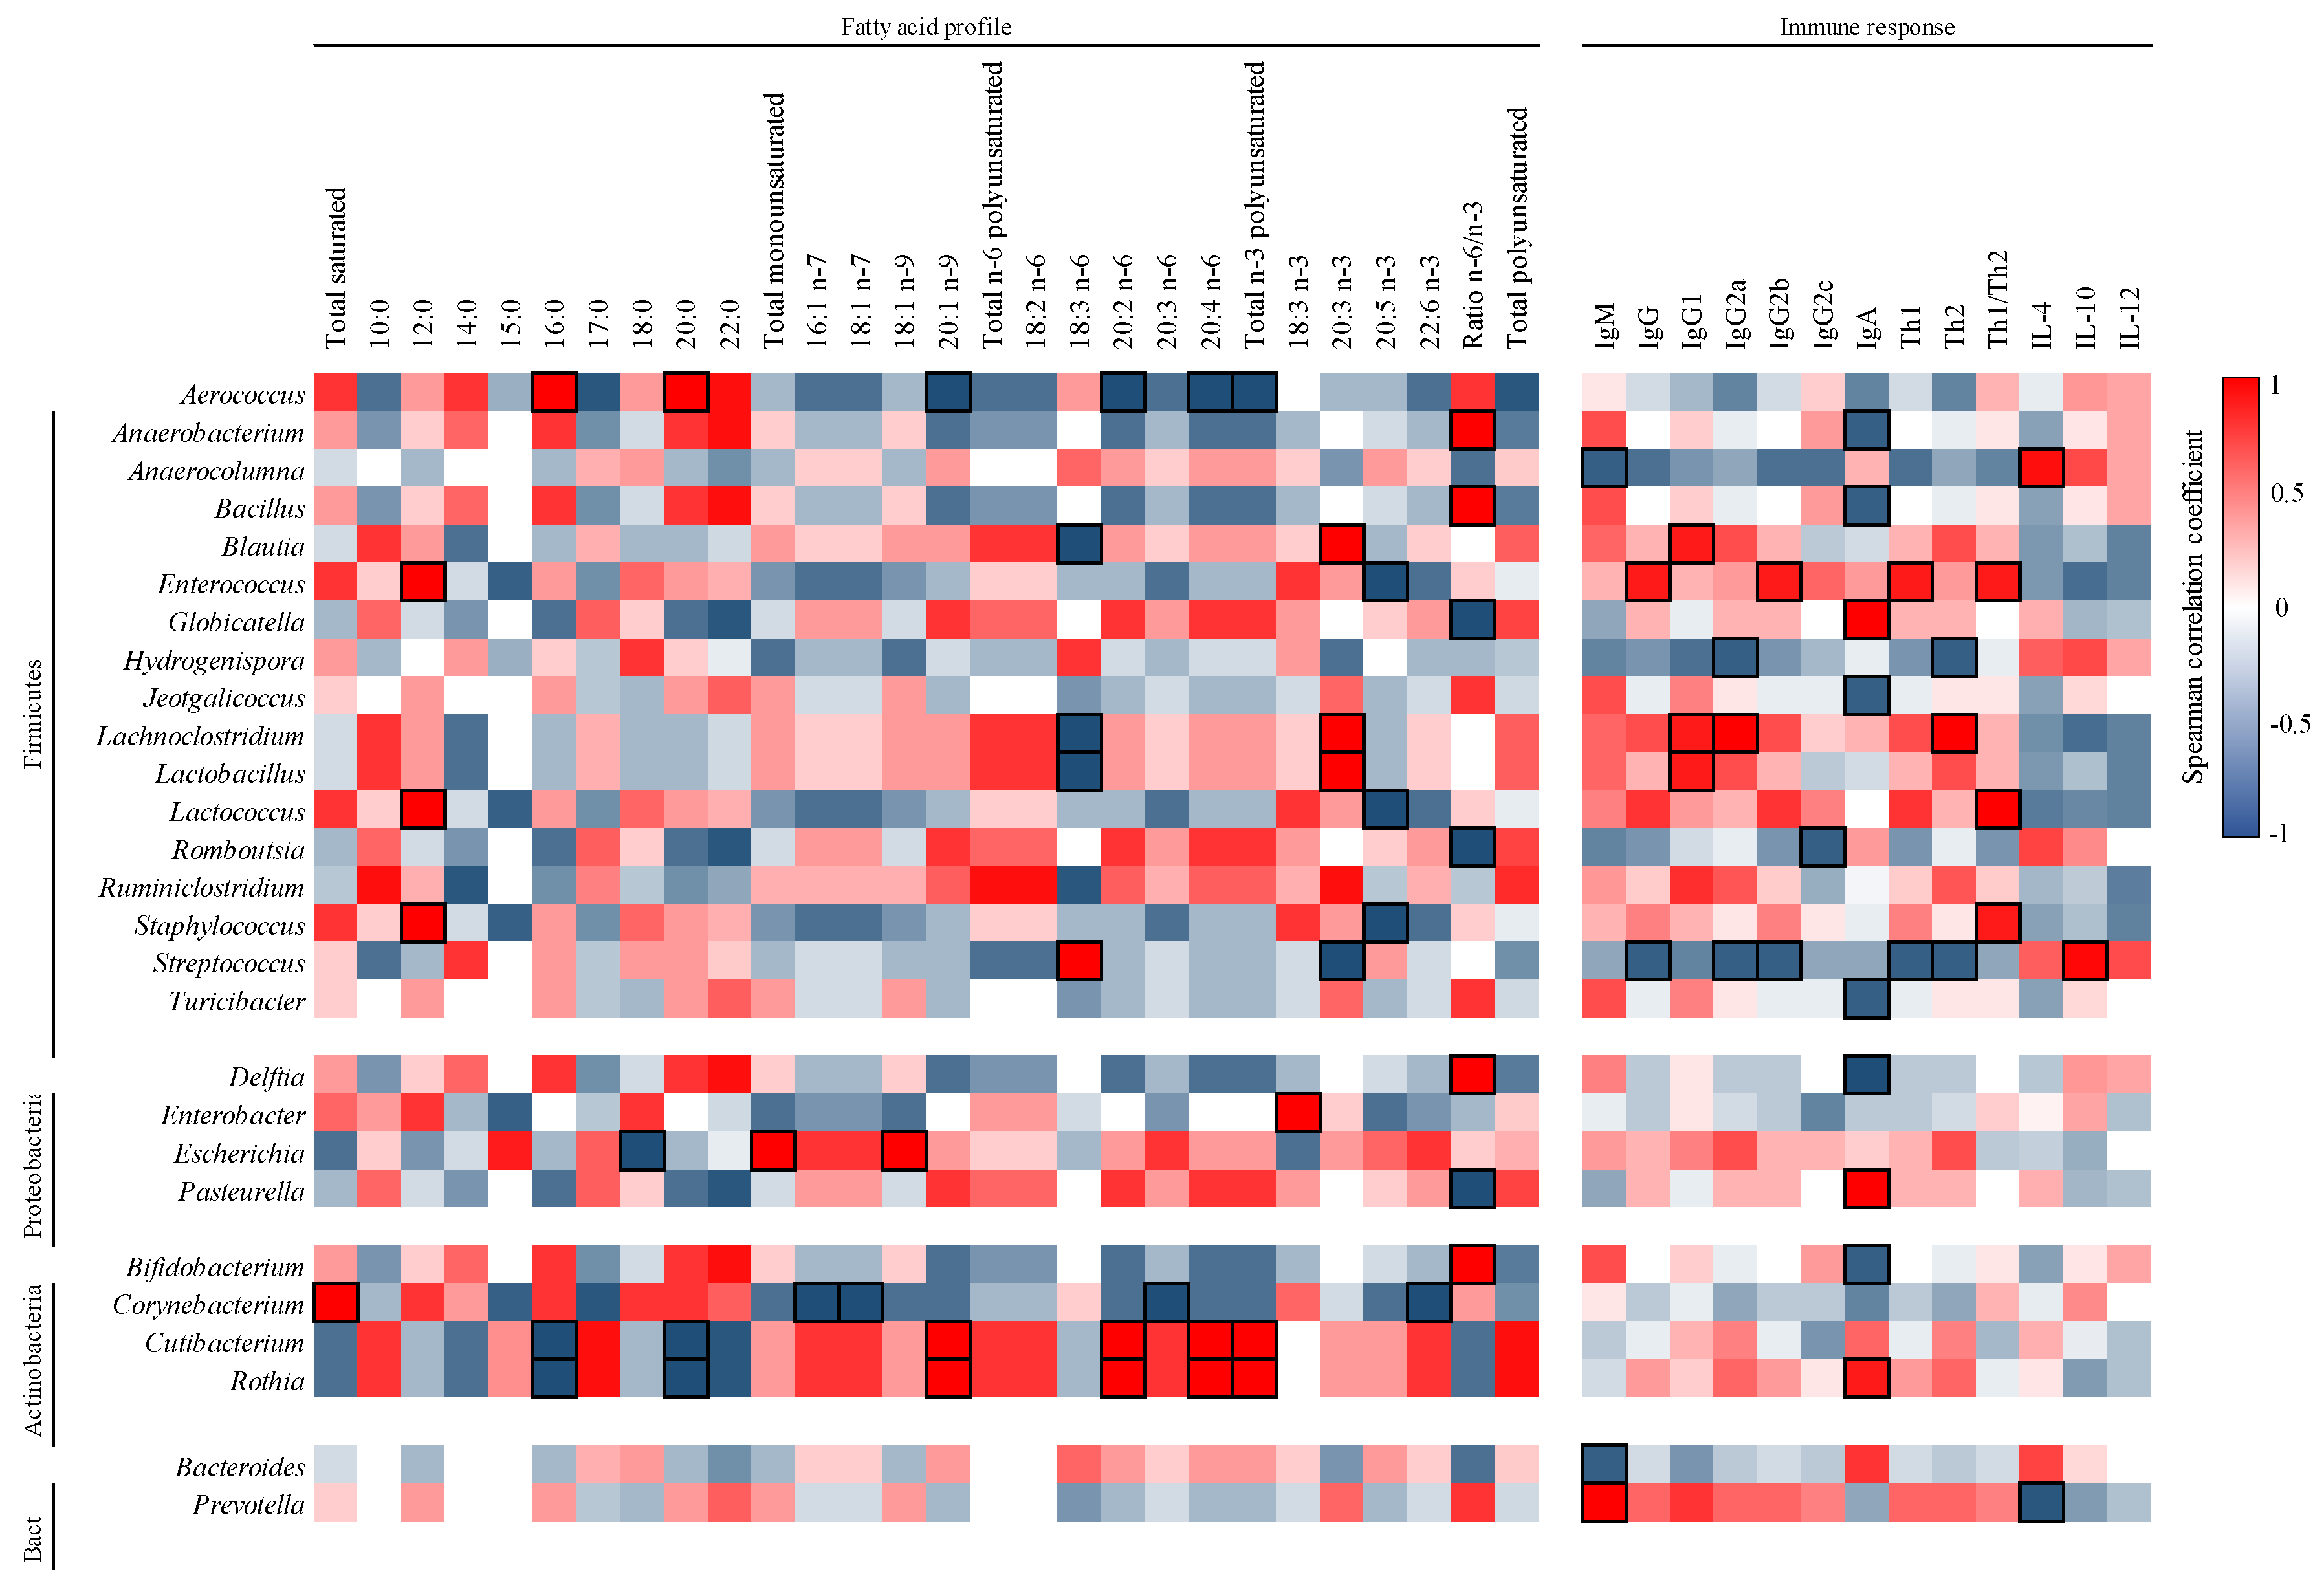
3.5. Correlation between FA and Microbiota in Milk
3.6. Correlation between Ig and Microbiota in Milk
4. Discussion
5. Conclusions
Author Contributions
Funding
Acknowledgments
Conflicts of Interest
References
- Grabarics, M.; Csernák, O.; Balogh, R.; Béni, S. Analytical characterization of human milk oligosaccharides—Potential applications in pharmaceutical analysis. J. Pharm. Biomed. Anal. 2017, 146, 168–178. [Google Scholar] [CrossRef] [PubMed]
- Ballard, O.; Morrow, A.L. Human milk composition: Nutrients and bioactive factors. Pediatr. Clin. 2013, 60, 49–74. [Google Scholar]
- Koletzko, B.; Rodriguez-Palmero, M.; Demmelmair, H.; Fidler, N.; Jensen, R.; Sauerwald, T. Physiological aspects of human milk lipids. Early Hum. Dev. 2001, 65, S3–S18. [Google Scholar] [CrossRef]
- Demmelmair, H.; Koletzko, B. Lipids in human milk. Best Pract. Res. Clin. Endocrinol. Metab. 2018, 32, 57–68. [Google Scholar] [CrossRef]
- Innis, S.M. Impact of maternal diet on human milk composition and neurological development of infants. Am. J. Clin. Nutr. 2014, 99, 734S–741S. [Google Scholar] [CrossRef] [Green Version]
- Koletzko, B. Human milk lipids. Ann. Nutr. Metab. 2016, 69, 28–40. [Google Scholar] [CrossRef] [Green Version]
- Emmett, P.M.; Rogers, I.S. Properties of human milk and their relationship with maternal nutrition. Early Hum. Dev. 1997, 49, S7–S28. [Google Scholar] [CrossRef]
- Fu, Y.; Liu, X.; Zhou, B.; Jiang, A.C.; Chai, L. An updated review of worldwide levels of docosahexaenoic and arachidonic acid in human breast milk by region. Public Health Nutr. 2016, 19, 2675–2687. [Google Scholar] [CrossRef] [Green Version]
- Ganapathy, S. Long chain polyunsaturated fatty acids and immunity in infants. Indian Pediatr. 2009, 46, 785–790. [Google Scholar]
- Calder, P.C.; Grimble, R.F. Polyunsaturated fatty acids, inflammation and immunity. Eur. J. Clin. Nutr. 2002, 56, S14–S19. [Google Scholar] [CrossRef] [Green Version]
- Cacho, N.T.; Lawrence, R.M. Innate immunity and breast milk. Front. Immunol. 2017, 8, 584. [Google Scholar] [CrossRef] [PubMed] [Green Version]
- Simopoulos, A.P. An increase in the omega-6/omega-3 fatty acid ratio increases the risk for obesity. Nutrients 2016, 8, 128. [Google Scholar] [CrossRef] [PubMed] [Green Version]
- Rudolph, M.C.; Young, B.E.; Lemas, D.J.; Palmer, C.E.; Hernandez, T.L.; Barbour, L.A.; Friedman, J.E.; Krebs, N.F.; MacLean, P.S. Early infant adipose deposition is positively associated with the n-6 to n-3 fatty acid ratio in human milk independent of maternal BMI. Int. J. Obes. 2017, 41, 510–517. [Google Scholar] [CrossRef] [PubMed] [Green Version]
- Van Land, B.; Boehm, G.; Garssen, J. Breast milk: Components with immune modulating potential and their possible role in immune mediated disease resistance. In Dietary Components and Immune Function; Humana Press: New York, NY, USA; pp. 25–42. ISBN 978-1-60761-060-1.
- Van De Perre, P. Transfer of antibody via mother’s milk. Vaccine 2003, 21, 3374–3376. [Google Scholar] [CrossRef]
- Weng, M.; Walker, W.A. The role of gut microbiota in programming the immune phenotype. J. Dev. Orig. Health Dis. 2013, 4, 203–214. [Google Scholar] [CrossRef] [Green Version]
- Walker, W.A.; Iyengar, R.S. Breast milk, microbiota, and intestinal immune homeostasis. Pediatr. Res. 2015, 77, 220–228. [Google Scholar] [CrossRef] [Green Version]
- Martín, R.; Langa, S.; Reviriego, C.; Jiménez, E.; Marín, M.L.; Xaus, J.; Fernández, L.; Rodríguez, J.M. Human milk is a source of lactic acid bacteria for the infant gut. J. Pediatr. 2003, 143, 754–758. [Google Scholar] [CrossRef]
- Moossavi, S.; Miliku, K.; Sepehri, S.; Khafipour, E.; Azad, M.B. The prebiotic and probiotic properties of human milk: Implications for infant immune development and pediatric asthma. Front. Pediatr. 2018, 6, 197. [Google Scholar] [CrossRef] [Green Version]
- Pérez-Cano, F.J.; Franch, À.; Castellote, C.; Castell, M. The suckling rat as a model for immunonutrition studies in early life. Clin. Dev. Immunol. 2012, 2012, 537310. [Google Scholar] [CrossRef] [Green Version]
- Reeves, P.G.; Nielsen, F.H.; Fahey, G.C. AIN-93 purified diets for laboratory rodents: Final report of the American Institute of Nutrition ad hoc Writing Committee on the reformulation of the AIN-76A rodent diet. J. Nutr. 1993, 123, 1939–1951. [Google Scholar] [CrossRef]
- Ramírez-Santana, C.; Pérez-Cano, F.J.; Castellote, C.; Castell, M.; Rivero, M.; Rodríguez-Palmero, M.; Franch, À. Higher immunoglobulin production in conjugated linoleic acid-supplemented rats during gestation and suckling. Br. J. Nutr. 2009, 102, 858–868. [Google Scholar] [CrossRef] [PubMed] [Green Version]
- Guardiola, F.; Codony, R.; Rafecas, M.; Boatella, J.; López, A. Fatty acid composition and nutritional value of fresh eggs, from large- and small-scale farms. J. Food Compos. Anal. 1994, 7, 171–188. [Google Scholar] [CrossRef]
- Azagra-Boronat, I.; Massot-Cladera, M.; Knipping, K.; van Land, B.; Stahl, B.; Garssen, J.; Rodríguez-Lagunas, M.J.; Franch, À.; Castell, M.; Pérez-Cano, F.J. Supplementation with 2′-FL and scGOS/lcFOS ameliorates rotavirus-induced diarrhea in suckling rats. Front. Cell. Infect. Microbiol. 2018, 8, 372. [Google Scholar] [CrossRef] [PubMed]
- Klindworth, A.; Pruesse, E.; Schweer, T.; Peplies, J.; Quast, C.; Horn, M.; Glöckner, F.O. Evaluation of general 16S ribosomal RNA gene PCR primers for classical and next-generation sequencing-based diversity studies. Nucleic Acids Res. 2013, 41, e1. [Google Scholar] [CrossRef]
- Martin, M. Cutadapt removes adapter sequences from high-throughput sequencing reads. EMBnet. J. 2011, 17, 10–12. [Google Scholar] [CrossRef]
- Kim, J.; Friel, J. Lipids and human milk. Lipid Technol. 2012, 24, 103–105. [Google Scholar] [CrossRef]
- Sala-Vila, A.; Castellote, A.I.; Rodriguez-Palmero, M.; Campoy, C.; López-Sabater, M.C. Lipid composition in human breast milk from Granada (Spain): Changes during lactation. Nutrition 2005, 21, 467–473. [Google Scholar] [CrossRef]
- Nishimura, R.Y.; De Castro, G.S.F.; Jordão, A.A.; Sartorelli, D.S. Breast milk fatty acid composition of women living far from the coastal area in Brazil. J. Pediatr. 2013, 89, 263–268. [Google Scholar] [CrossRef] [Green Version]
- Rocquelin, G.; Tapsoba, S.; Dop, M.C.; Mbemba, F.; Traissac, P.; Martin-Prével, Y. Lipid content and essential fatty acid (EFA) composition of mature Congolese breast milk are influenced by mothers’ nutritional status: Impact on infants’ EFA supply. Eur. J. Clin. Nutr. 1998, 52, 164–171. [Google Scholar] [CrossRef]
- Szabó, É.; Boehm, G.; Beermann, C.; Weyermann, M.; Brenner, H.; Rothenbacher, D.; Decsi, T. Human milk fatty acid composition from nine countries varies most in DHA. Lipids 2006, 41, 851–858. [Google Scholar]
- Wan, Z.; Wang, X.; Xu, L.; Geng, Q.; Zhang, Y. Lipid content and fatty acids composition of mature human milk in rural North China. Br. J. Nutr. 2010, 103, 913–916. [Google Scholar] [CrossRef] [PubMed] [Green Version]
- Kumar, H.; du Toit, E.; Kulkarni, A.; Aakko, J.; Linderborg, K.M.; Zhang, Y.; Nicol, M.P.; Isolauri, E.; Yang, B.; Collado, M.C.; et al. Distinct patterns in human milk microbiota and fatty acid profiles across specific geographic locations. Front. Microbiol. 2016, 7, 1619. [Google Scholar] [CrossRef] [Green Version]
- Gómez-Gallego, C.; Morales, J.M.; Monleón, D.; Du Toit, E.; Kumar, H.; Linderborg, K.M.; Zhang, Y.; Yang, B.; Isolauri, E.; Salminen, S.; et al. Human Breast Milk NMR Metabolomic Profile across Specific Geographical Locations and Its Association with the Milk Microbiota. Nutrients 2018, 10, 1355. [Google Scholar] [CrossRef] [PubMed] [Green Version]
- Sabel, K.G.; Lundqvist-Persson, C.; Bona, E.; Petzold, M.; Strandvik, B. Fatty acid patterns early after premature birth, simultaneously analysed in mothers’ food, breast milk and serum phospholipids of mothers and infants. Lipids Health Dis. 2009, 8, 20. [Google Scholar] [CrossRef] [PubMed] [Green Version]
- Wang, Y.; Jiang, X.; He, J.; Diraviyam, T.; Zhang, X. Quantitative investigation on correlation between IgG and FcRn during gestation and lactating periods in rat. Am. J. Reprod. Immunol. 2016, 75, 81–85. [Google Scholar] [CrossRef] [PubMed]
- Hurley, W.L.; Theil, P.K. Perspectives on immunoglobulins in colostrum and milk. Nutrients 2011, 3, 442–474. [Google Scholar] [CrossRef] [PubMed]
- Hjelholt, A.; Christiansen, G.; Sørensen, U.S.; Birkelund, S. IgG subclass profiles in normal human sera of antibodies specific to five kinds of microbial antigens. Pathog. Dis. 2013, 67, 206–213. [Google Scholar] [CrossRef] [Green Version]
- Holdsworth, S.R.; Kitching, A.R.; Tipping, P.G. Th1 and th2 T helper cell subsets affect patterns of injury and outcomes in glomerulonephritis. Kidney Int. 1999, 55, 1198–1216. [Google Scholar] [CrossRef] [Green Version]
- Kim, K.; Keller, M.A.; Heiner, D.C. Immunoglobulin G subclasses in human colostrum, milk and saliva. Acta Pædiatrica 1992, 81, 113–118. [Google Scholar] [CrossRef]
- Mehta, P.D.; Mehta, S.P.; Isaacs, C.E. Distribution of IgG subclasses in human colostrum and milk. Immunol. Lett. 1989, 22, 235–238. [Google Scholar] [CrossRef]
- Pedersen, S.H.; Wilkinson, A.L.; Andreasen, A.; Kinung’hi, S.M.; Urassa, M.; Michael, D.; Todd, J.; Changalucha, J.; McDermid, J.M. Longitudinal analysis of mature breastmilk and serum immune composition among mixed HIV-status mothers and their infants. Clin. Nutr. 2016, 35, 871–879. [Google Scholar] [CrossRef] [PubMed] [Green Version]
- Demers-Mathieu, V.; Huston, R.K.; Markell, A.M.; McCulley, E.A.; Martin, R.L.; Spooner, M.; Dallas, D.C. Differences in maternal immunoglobulins within mother’s own breast milk and donor breast milk and across digestion in preterm infants. Nutrients 2019, 11, 920. [Google Scholar] [CrossRef] [PubMed] [Green Version]
- Corthésy, B. Multi-faceted functions of secretory IgA at mucosal surfaces. Front. Immunol. 2013, 4, 185. [Google Scholar] [CrossRef] [PubMed] [Green Version]
- Ruiz, L.; Espinosa-Martos, I.; García-Carral, C.; Manzano, S.; McGuire, M.K.; Meehan, C.L.; McGuire, M.A.; Williams, J.E.; Foster, J.; Sellen, D.W.; et al. What’s normal? Immune profiling of human milk from healthy women living in different geographical and socioeconomic settings. Front. Immunol. 2017, 8, 696. [Google Scholar] [CrossRef] [PubMed]
- Fujimori, M.; França, E.L.; Fiorin, V.; Morais, T.C.; Honorio-França, A.C.; de Abreu, L.C. Changes in the biochemical and immunological components of serum and colostrum of overweight and obese mothers. BMC Pregnancy Childbirth 2015, 15, 166. [Google Scholar] [CrossRef] [PubMed]
- Pérez-Cano, F.J.; Ramírez-Santana, C.; Molero-Luís, M.; Castell, M.; Rivero, M.; Castellote, C.; Franch, À. Mucosal IgA increase in rats by continuous CLA feeding during suckling and early infancy. J. Lipid Res. 2008, 50, 467–476. [Google Scholar] [CrossRef] [Green Version]
- Mantis, N.; Rol, N.; Blaise, C. Secretory IgA’s complex roles in immunity and mucosal homeostasis in the gut. Mucosal Immunol. 2011, 4, 603–611. [Google Scholar] [CrossRef]
- Corthésy, B. Roundtrip ticket for secretory IgA: Role in mucosal homeostasis? J. Immunol. 2014, 178, 27–32. [Google Scholar] [CrossRef] [Green Version]
- Hammerberg, B.; Musoke, A.; Williams, J.; Leid, R. Uptake of colostral immunoglobulins by the suckling rat. Lab. Anim. Sci. 1977, 27, 50–53. [Google Scholar]
- Toscano, M.; de Grandi, R.; Grossi, E.; Drago, L. Role of the human breast milk-associated microbiota on the newborns’ immune system: A mini review. Front. Microbiol. 2017, 8, 2100. [Google Scholar] [CrossRef]
- Moossavi, S.; Sepehri, S.; Robertson, B.; Bode, L.; Goruk, S.; Field, C.J.; Lix, L.M.; de Souza, R.J.; Becker, A.B.; Mandhane, P.J.; et al. Composition and variation of the human milk microbiota are influenced by maternal and early-life factors. Cell Host Microbe 2019, 25, 324–335. [Google Scholar] [CrossRef] [PubMed] [Green Version]
- Gomez-Gallego, C.; Garcia-Mantrana, I.; Salminen, S.; Collado, M.C. The human milk microbiome and factors influencing its composition and activity. Semin. Fetal Neonatal Med. 2016, 21, 400–405. [Google Scholar] [CrossRef] [PubMed] [Green Version]
- Rodríguez, J.M. The origin of human milk bacteria: Is there a bacterial entero-mammary pathway during late pregnancy and lactation? Am. Soc. Nutr. Adv. Nutr. 2014, 5, 779–784. [Google Scholar] [CrossRef] [PubMed] [Green Version]
- Marungruang, N.; Arévalo Sureda, E.; Lefrançoise, A.; Weström, B.; Nyman, M.; Prykhodko, O.; Fåk Hållenius, F. Impact of dietary induced precocious gut maturation on cecal microbiota and its relation to the blood-brain barrier during the postnatal period in rats. Neurogastroenterol. Motil. 2018, 30, e13285. [Google Scholar] [CrossRef] [Green Version]
- Shin, N.R.; Whon, T.W.; Bae, J.W. Proteobacteria: Microbial signature of dysbiosis in gut microbiota. Trends Biotechnol. 2015, 33, 496–503. [Google Scholar] [CrossRef]
- Flemer, B.; Gaci, N.; Borrel, G.; Sanderson, I.R.; Chaudhary, P.P.; Tottey, W.; O’Toole, P.W.; Brugère, J.-F. Fecal microbiota variation across the lifespan of the healthy laboratory rat. Gut Microbes 2017, 8, 428–439. [Google Scholar] [CrossRef]
- Lin, M.T.; Hsu, C.S.; Yeh, S.L.; Yeh, C.L.; Chang, K.J.; Lee, P.H.; Chen, W.J. Effects of ω-3 fatty acids on leukocyte Th1/Th2 cytokine and integrin expression in rats with gut-derived sepsis. Nutrition 2007, 23, 179–186. [Google Scholar] [CrossRef]
- Zhang, P.; Smith, R.; Chapkin, R.S.; McMurray, D.N. Dietary (n-3) polyunsaturated fatty acids modulate murine Th1/Th2 balance toward the Th2 pole by suppression of Th1 development. J. Nutr. 2005, 135, 1745–1751. [Google Scholar] [CrossRef] [Green Version]
- Choi, M.; Baek, J.; Park, I.; Lim, S. Moderating effect of synthesized docosahexaenoic acid-enriched phosphatidylcholine on production of Th1 and Th2 cytokine in lipopolysaccharide-induced inflammation. Asian Pac. J. Trop. Biomed. 2018, 8, 340–344. [Google Scholar]
- Krauss-Etschmann, S.; Hartl, D.; Rzehak, P.; Heinrich, J.; Shadid, R.; del Carmen Ramírez-Tortosa, M.; Campoy, C.; Pardillo, S.; Schendel, D.J.; Decsi, T.; et al. Decreased cord blood IL-4, IL-13, and CCR4 and increased TGF-β levels after fish oil supplementation of pregnant women. J. Allergy Clin. Immunol. 2008, 121, 464–470. [Google Scholar] [CrossRef]
- Yao, W.; Li, J.; Wang, J.J.; Zhou, W.; Wang, Q.; Zhu, R.; Wang, F.; Thacker, P. Effects of dietary ratio of n-6 to n-3 polyunsaturated fatty acids on immunoglobulins, cytokines, fatty acid composition, and performance of lactating sows and suckling piglets. J. Anim. Sci. Biotechnol. 2012, 3, 43. [Google Scholar] [CrossRef] [PubMed] [Green Version]
- Costantini, L.; Molinari, R.; Farinon, B.; Merendino, N. Impact of omega-3 fatty acids on the gut microbiota. Int. J. Mol. Sci. 2017, 18, 2645. [Google Scholar] [CrossRef] [PubMed] [Green Version]
- Kindt, A.; Liebisch, G.; Clavel, T.; Haller, D.; Hörmannsperger, G.; Yoon, H.; Kolmeder, D.; Sigruener, A.; Krautbauer, S.; Seeliger, C.; et al. The gut microbiota promotes hepatic fatty acid desaturation and elongation in mice. Nat. Commun. 2018, 9, 3760. [Google Scholar] [CrossRef] [PubMed] [Green Version]
- Kankaanpää, P.E.; Salminen, S.J.; Isolauri, E.; Lee, Y.K. The influence of polyunsaturated fatty acids on probiotic growth and adhesion. FEMS Microbiol. Lett. 2001, 194, 149–153. [Google Scholar] [CrossRef]
- Lazar, V.; Ditu, L.M.; Pircalabioru, G.G.; Gheorghe, I.; Curutiu, C.; Holban, A.M.; Picu, A.; Petcu, L.; Chifiriuc, M.C. Aspects of gut microbiota and immune system interactions in infectious diseases, immunopathology, and cancer. Front. Immunol. 2018, 9, 1830. [Google Scholar] [CrossRef] [Green Version]
- Castro, M.S.; Azpiroz, M.B.; Molina, M.A.; Mourelle, A.C.; Alaniz, F.S.; Maldonado, A.M.; Manghi, M.A. Preliminary studies on the prevention of the ovalbumin-induced allergic response by Enterococcus faecalis CECT7121 in mice. Int. Arch. Allergy Immunol. 2012, 157, 11–20. [Google Scholar] [CrossRef]
- Castro, M.S.; Molina, M.A.; Di Sciullo, P.; Azpiroz, M.B.; Leocata Nieto, F.; Sterín-Speziale, N.B.; Mongini, C.; Manghi, M.A. Beneficial activity of Enterococcus faecalis CECT7121 in the anti-lymphoma protective response. J. Appl. Microbiol. 2010, 109, 1234–1243. [Google Scholar] [CrossRef]
- Castro, M.; Molina, M.; Sparo, M.; Manghi, M. Effects of Enterococcus faecalis CECT7121 on the specific immune response after DTPW vaccination. Int. J. Probiotics Prebiotics 2008, 3, 25–30. [Google Scholar]
- Doare, K.L.; Bellis, K.; Faal, A.; Birt, J.; Munblit, D.; Humphries, H.; Taylor, S.; Warburton, F.; Heath, P.T.; Kampmann, B.; et al. SIgA, TGF-β1, IL-10, and TNFα in colostrum are associated with infant group B Streptococcus colonization. Front. Immunol. 2017, 8, 1269. [Google Scholar] [CrossRef]


| (%) | Dams’ Plasma | Milk | Pups’ Plasma |
|---|---|---|---|
| Total saturated | 40.93 ± 0.27 | 63.88 ± 1.69 | 42.50 ± 0.44 |
| 8:0 | - | 2.06 ± 0.17 | - |
| 10:0 | - | 7.90 ± 0.42 | 0.72 ± 0.07 |
| 12:0 | 0.47 ± 0.03 | 9.53 ± 0.37 | 2.19 ± 0.13 |
| 14:0 | 0.59 ± 0.03 | 12.47 ± 0.57 | 3.95 ± 0.16 |
| 15:0 | 0.24 ± 0.01 | 0.14 ± 0.01 | 0.17 ± 0.01 |
| 16:0 | 21.18 ± 0.47 | 28.22 ± 0.89 | 24.62 ± 0.29 |
| 17:0 | 0.38 ± 0.01 | 0.15 ± 0.01 | 0.24 ± 0.01 |
| 18:0 | 17.27 ± 0.24 | 3.23 ± 0.06 | 10.12 ± 0.19 |
| 20:0 | 0.32 ± 0.01 | 0.12 ± 0.01 | 0.22 ± 0.01 |
| 22:0 | 0.47 ± 0.06 | 0.06 ± 0.01 | 0.27 ± 0.01 |
| Total monounsaturated | 15.35 ± 0.77 | 16.31 ± 1.21 | 10.73 ± 0.38 |
| 16:1 n-7 | 1.37 ± 0.12 | 1.11 ± 0.23 | 0.51 ± 0.02 |
| 18:1 n-7 | 1.24 ± 0.09 | 1.02 ± 0.16 | 0.96 ± 0.02 |
| 18:1 n-9 | 12.49 ± 0.70 | 13.69 ± 0.85 | 8.90 ± 0.37 |
| 20:1 n-9 | 0.28 ± 0.02 | 0.23 ± 0.03 | 0.36 ± 0.10 |
| Total n-6 polyunsaturated | 43.73 ± 0.84 | 18.39 ± 0.55 | 41.42 ± 0.41 |
| 18:2 n-6 | 21.10 ± 0.76 | 16.09 ± 0.40 | 20.67 ± 021 |
| 18:3 n-6 | 0.64 ± 0.06 | 0.34 ± 0.02 | 0.49 ± 0.02 |
| 20:2 n-6 | 0.30 ± 0.07 | 0.39 ± 0.07 | 0.30 ± 0.02 |
| 20:3 n-6 | - | 0.33 ± 0.03 | 1.09 ± 0.04 |
| 20:4 n-6 | 18.34 ± 0.89 | 0.93 ± 0.05 | 19.97 ± 0.43 |
| 22:4 n-6 | - | 0.24 ± 0.05 | - |
| 22:5 n-6 | - | 0.07 ± 0.01 | - |
| Total n-3 polyunsaturated | 3.35 ± 0.20 | 1.30 ± 0.05 | 3.26 ± 0.11 |
| 18:3 n-3 | 0.38 ± 0.06 | 0.90 ± 0.02 | 0.32 ± 0.02 |
| 20:3 n-3 | 1.34 ± 0.20 | 0.05 ± 0.01 | - |
| 20:5 n-3 | 0.52 ± 0.03 | 0.11 ± 0.01 | 0.16 ± 0.02 |
| 22:5 n-3 | - | 0.10 ± 0.02 | - |
| 22:6 n-3 | 1.11 ± 0.10 | 0.13 ± 0.01 | 2.78 ± 0.12 |
| Ratio n-6/n-3 | 12.18 ± 0.58 | 14.14 ± 0.12 | 12.96 ± 0.37 |
| Total polyunsaturated | 43.73 ± 0.84 | 19.69 ± 0.59 | 45.77 ± 0.47 |
| Dams’ plasma | Milk | Pups’ Plasma | ||||
|---|---|---|---|---|---|---|
| µg/mL | % | µg/mL | % | µg/mL | % | |
| IgM | 191.7 ± 36.5 | 4.8 ± 1.0 | 9.5 ± 2.0 | 1.6 ± 0.2 | 18.8 ± 0.6 | 0.5 ± 0.0 |
| IgG | 4139.7 ± 969.6 | 92.94 ± 1.1 | 589.1 ± 120.4 | 88.5 ± 1.6 | 4207.3 ± 400.7 | 97.9 ± 0.1 |
| IgG1 | 93.7 ± 9.7 | 2.37 ± 0.3 | 9.6 ± 1.0 | 1.6 ± 0.2 | 125.3 ± 6.2 | 3.1 ± 0.2 |
| IgG2a | 576.5 ± 66.3 | 14.89 ± 2.3 | 70.1 ± 7.3 | 12.0 ± 1.8 | 682.3 ± 35.5 | 17.2 ± 1.3 |
| IgG2b | 2425.3 ± 779.5 | 50.56 ± 5.6 | 362.6 ± 102.5 | 50.0 ± 6.7 | 2534.4 ± 372.0 | 55.5 ± 3.4 |
| IgG2c | 1044.1 ± 199.8 | 25.12 ± 4.4 | 146.8 ± 24.0 | 24.9 ± 5.3 | 865.3 ± 88.3 | 22.1 ± 3.0 |
| Th1/Th2 a | 5.1 ± 1.0 | 5.06 ± 1.0 | 6.3 ± 1.2 | 6.3 ± 1.2 | 4.2 ± 0.4 | 4.2 ± 0.4 |
| IgA | 90.1 ± 9.8 | 2.26 ± 0.2 | 57.4 ± 6.6 | 10.0 ± 1.6 | 65.7 ± 2.9 | 1.6 ± 0.1 |
© 2020 by the authors. Licensee MDPI, Basel, Switzerland. This article is an open access article distributed under the terms and conditions of the Creative Commons Attribution (CC BY) license (http://creativecommons.org/licenses/by/4.0/).
Share and Cite
Azagra-Boronat, I.; Tres, A.; Massot-Cladera, M.; Franch, À.; Castell, M.; Guardiola, F.; Pérez-Cano, F.J.; Rodríguez-Lagunas, M.J. Associations of Breast Milk Microbiota, Immune Factors, and Fatty Acids in the Rat Mother–Offspring Pair. Nutrients 2020, 12, 319. https://0-doi-org.brum.beds.ac.uk/10.3390/nu12020319
Azagra-Boronat I, Tres A, Massot-Cladera M, Franch À, Castell M, Guardiola F, Pérez-Cano FJ, Rodríguez-Lagunas MJ. Associations of Breast Milk Microbiota, Immune Factors, and Fatty Acids in the Rat Mother–Offspring Pair. Nutrients. 2020; 12(2):319. https://0-doi-org.brum.beds.ac.uk/10.3390/nu12020319
Chicago/Turabian StyleAzagra-Boronat, Ignasi, Alba Tres, Malén Massot-Cladera, Àngels Franch, Margarida Castell, Francesc Guardiola, Francisco J. Pérez-Cano, and Maria J. Rodríguez-Lagunas. 2020. "Associations of Breast Milk Microbiota, Immune Factors, and Fatty Acids in the Rat Mother–Offspring Pair" Nutrients 12, no. 2: 319. https://0-doi-org.brum.beds.ac.uk/10.3390/nu12020319