Potential Health Claims of Durum and Bread Wheat Flours as Functional Ingredients

 ,
, 
 and
and
Abstract
:
1. Introduction
2. Material and Methods
2.1. Wheat Samples
2.2. Milling Process
2.3. Analysis of Bioactive Compounds
2.3.1. Total, Soluble and Insoluble Dietary Fiber
2.3.2. Arabinoxylans
2.3.3. Tocopherols
2.3.4. Total Phenols Content
2.3.5. Evaluation of Antioxidant Activity
2.4. Statistical Analysis
3. Results
3.1. Dietary Fiber and Arabinoxylans
3.2. Total Phenols Content
3.3. Tocopherols
3.4. Evaluation of Antioxidant Activity
4. Discussion
4.1. Dietary Fiber and Arabinoxylans
4.2. Total Phenols Content
4.3. Tocopherols
4.4. Evaluation of Antioxidant Activity
5. Conclusions
Author Contributions
Funding
Conflicts of Interest
References
- Lv, J.; Yub, L.; Lu, Y.; Niu, Y.; Liu, L.; Costa, J.; Yu, L. Phytochemical compositions, and antioxidant properties, and antiproliferative activities of wheat flour. Food Chem. 2012, 135, 325–331. [Google Scholar] [CrossRef]
- Engelsen, M.M.; Hansen, A. Tocopherol and Tocotrienol Content in Commercial Wheat Mill Streams. Cereal Chem. 2009, 86, 499–502. [Google Scholar] [CrossRef]
- Visioli, G.; Comastri, A.; Imperiale, D.; Paredi, G.; Faccini, A.; Marmiroli, N. Gel-Based and Gel-Free Analytical Methods for the Detection of HMW-GS and LMW-GS in Wheat Flour. Food Anal. Method 2016, 9, 469–476. [Google Scholar] [CrossRef]
- Taccari, M.; Aquilanti, L.; Polverigiani, S.; Osimani, A.; Garofalo, C.; Milanovic, V.; Clementi, F. Microbial Diversity of Type I Sourdoughs Prepared and Back-Slopped with Wholemeal and Refined Soft (Triticum aestivum) Wheat Flours. J. Food Sci. 2016, 81, 1996–2005. [Google Scholar] [CrossRef] [PubMed]
- Nurit, E.; Lyan, B.; Pujos-Guillot, E.; Branlard, G.; Piquet, A. Change in B and E vitamin and lutein, β-sitosterol contents in industrial milling fractions and during toasted bread production. J. Cereal Sci. 2016, 69, 290–296. [Google Scholar] [CrossRef]
- Harris, K.A.; Kris-Etherton, P.M. Effects of Whole Grains on Coronary Heart Disease Risk. Curr. Atheroscler. Rep. 2010, 12, 368–376. [Google Scholar] [CrossRef]
- Latimer, G.W. Official Methods of Analysis of AOAC International, 18th ed.; AOAC International: Gaithersburg, MD, USA, 2012. [Google Scholar]
- Ciudad-Mulero, M.; Barros, L.; Fernandes, A.; Berrios, J.D.J.; Cámara, M.; Morales, P.; Fernández-Ruiz, V.; Ferreira, I.C.F.R. Bioactive compounds and antioxidant capacity of extruded snack-type products developed from novel formulations of lentil and nutritional yeast flours. Food Funct. 2018, 9, 819–829. [Google Scholar] [CrossRef] [Green Version]
- Morales, P.; Cebadera-Miranda, L.; Cámara, R.M.; Reis, F.S.; Barros, L.; Berrios, J.J.; Ferreira, I.C.F.R.; Cámara, M. Lentil flour formulations to develop new snack-type products by extrusion processing: Phytochemicals and antioxidant capacity. J. Funct. Foods 2015, 19, 537–544. [Google Scholar] [CrossRef]
- Wolfe, K.; Wu, X.; Liu, R.H. Antioxidant activity of apple peels. J. Agric. Food Chem. 2003, 51, 609–614. [Google Scholar] [CrossRef]
- Vignola, M.B.; Moiraghi, M.; Salvucci, E.; Baroni, V.; Pérez, G.T. Whole meal and white flour from Argentine wheat genotypes: Mineral and arabinoxylans differences. J. Cereal Sci. 2016, 71, 217–223. [Google Scholar] [CrossRef]
- European Parliament & Council of the European Union. Regulation (EC) No 1924/2006 of the European Parliament and of the Council of 20 December 2006 on Nutrition and Health Claims Made on Foods; European Parliament & Council of the European Union: Brussels, Belgium, 2006.
- European Commission. Commission Regulation (EU) No 432/2012 of 16 May, Official Journal of European Union L136/1:40 (25/5/2012). Establishing a List of Permitted Health Claims Made on Foods, Other Than Those Referring to the Reduction of Disease Risk and to Children’s Development and Health; European Commission: Brussels, Belgium, 2012.
- Domínguez Díaz, L.; Fernández-Ruíz, V.; Cámara, M. The frontier between nutrition and pharma: The international regulatory framework of functional foods, food supplements and nutraceuticals. Crit. Rev. Food Sci. Nutr. 2019, 29, 1–9. [Google Scholar] [CrossRef] [PubMed]
- ILSI. Scientific concepts of functional foods in Europe consensus document. Br. J. Nutr. 1999, 81, S1–S27. [Google Scholar] [CrossRef] [Green Version]
- Rainakari, A.I.; Rita, H.; Putkonen, T.; Pastell, H. New dietary fibre content results for cereals in the Nordic countries using AOAC 2011.25 method. J. Food Compos. Anal. 2016, 51, 1–8. [Google Scholar] [CrossRef]
- Marotti, I.; Bregola, V.; Aloisio, I.; Di Gioia, D.; Bosi, S.; Di Silvestro, R.; Quinn, R.; Dinelli, G. Prebiotic effect of soluble fibres from modern and old durum-type wheat varieties on Lactobacillus and Bifidobacterium strains. J. Sci. Food Agric. 2012, 92, 2133–2140. [Google Scholar] [CrossRef]
- Sobota, A.; Rzedzicki, Z.; Zarzycki, P.; Kuzawinska, E. Application of common wheat bran for the industrial production of high-fibre pasta. Int. J. Food Sci. Technol. 2015, 50, 111–119. [Google Scholar] [CrossRef]
- Schmiele, M.; Zafalon Jaekel, L.; Cardoso Patricio, S.M.; Joy Steel, C.; Chang, Y.K. Rheological properties of wheat flour and quality characteristics of pan bread as modified by partial additions of wheat bran or whole grain wheat flour. Int. J. Food Sci. Technol. 2012, 47, 2141–2150. [Google Scholar] [CrossRef]
- Shewry, P.R.; Hawkesford, M.J.; Piironen, V.; Lampi, A.M.; Gebruers, K.; Boros, D.; Andersson, A.A.M.; Åman, P.; Rakszegi, M.; Bedo, Z.; et al. Natural Variation in Grain Composition of Wheat and Related Cereals. J. Agric. Food Chem. 2013, 61, 8295–8303. [Google Scholar] [CrossRef]
- Gélinas, P.; McKinnon, C. Dietary fibre and β-glucan in strong bread wheat cultivars: Does it matter? Int. J. Food Sci. Technol. 2013, 48, 670–672. [Google Scholar] [CrossRef]
- European Food Safety Authority (2010) Sets European Dietary Reference Values for Nutrient Intakes. Available online: http://www.efsa.europa.eu/en/press/news/nda100326 (accessed on 15 January 2020).
- De Santis, M.A.; Kosik, O.; Passmore, D.; Flagella, Z.; Shewry, P.R.; Lovegrove, A. Comparison of the dietary fibre composition of old and modern durum wheat (Triticum turgidum spp. durum) genotypes. Food Chem. 2018, 244, 304–310. [Google Scholar] [CrossRef]
- Broekaert, W.F.; Courtin, C.M.; Verbeke, K.; Van de Wiele, T.; Verstraete, W.; Delcour, J.A. Prebiotic and Other Health-Related Effects of Cereal-Derived Arabinoxylans, Arabinoxylan-Oligosaccharides, and Xylooligosaccharides. Crit. Rev. Food Sci. Nutr. 2011, 51, 178–194. [Google Scholar] [CrossRef]
- Turner, M.A.; Soh, C.H.N.; Ganguli, N.K.; Sissons, M.J. A survey of water-extractable arabinopolymers in bread and durum wheat and the effect of water-extractable arabinoxylan on durum dough rheology and spaghetti cooking quality. J. Sci. Food Agric. 2008, 88, 2551–2555. [Google Scholar] [CrossRef]
- Gebruers, K.; Dornez, E.; Boros, D.; Fras, A.; Dynkowska, W.; Bedo, Z.; Rakszegi, M.; Delcour, J.A.; Courtin, C.M. Variation in the Content of Dietary Fiber and Components There of in Wheats in the HEALTHGRAIN Diversity Screen. J. Agric. Food Chem. 2008, 56, 9740–9749. [Google Scholar] [CrossRef] [PubMed]
- Li, W.; Pickard, M.D.; Beta, T. Effect of thermal processing on antioxidant properties of purple wheat bran. Food Chem. 2007, 104, 1080–1086. [Google Scholar] [CrossRef]
- Vaher, M.; Matso, K.; Levandi, T.; Helmja, K.; Kaljurand, M. Phenolic compounds and the antioxidant activity of the bran, flour and whole grain of different wheat varieties. Procedia Chem. 2010, 2, 76–82. [Google Scholar] [CrossRef] [Green Version]
- Kosík, T.; Lacko-Bartošová, M.; Kobida, L. Free Phenol Content and Antioxidant Activity of Winter Wheat In Sustainable Farming Systems. J. Microbiol. Biotechnol. Food Sci. 2014, 3, 247–249. [Google Scholar]
- Beta, T.; Nam, S.; Dexter, J.E.; Sapirstein, H.D. Phenolic Content and Antioxidant Activity of Pearled Wheat and Roller-Milled Fractions. Cereal Chem. 2005, 82, 390–393. [Google Scholar] [CrossRef]
- Cãlinoiu, L.F.; Vodnar, D.C. Whole Grains and Phenolic Acids: A Review on Bioactivity, Functionality, Health Benefits and Bioavailability. Nutrients 2018, 10, 1615. [Google Scholar] [CrossRef] [Green Version]
- Hussain, A.; Larsson, H.; Olsson, M.E.; Kuktaite, R.; Grausgruber, H.; Johansson, E. Is organically produced wheat a source of tocopherols and tocotrienols for health food? Food Chem. 2012, 132, 1789–1795. [Google Scholar] [CrossRef]
- Gani, A.; Wani, S.M.; Masoodi, F.A.; Hameed, G. Whole-Grain Cereal Bioactive Compounds and Their Health Benefits: A Review. J. Food Process. Technol. 2012, 3, 3. [Google Scholar] [CrossRef] [Green Version]
- Nielsen, M.M.; Hansen, A. Stability of Vitamin E in Wheat Flour and Whole Wheat Flour during Storage. Cereal Chem. 2008, 85, 716–720. [Google Scholar] [CrossRef] [Green Version]
- Sedej, I.; Mandic, A.; Sakac, M.; Misan, A.; Tumbas, V. Comparison of Antioxidant Components and Activity of Buckwheat and Wheat Flours. Cereal Chem. 2010, 87, 387–392. [Google Scholar] [CrossRef]
- Zielinski, H.; Ciska, E.; Kozlowska, H. The cereal grains: Focus on vitamin E. Czech J. Food Sci. 2001, 19, 182–188. [Google Scholar] [CrossRef] [Green Version]
- Lachman, J.; Hejtmánková, A.; Orsák, M.; Popov, M.; Martinek, P. Tocotrienols and tocopherols in colored-grain wheat, tritordeum and barley. Food Chem. 2018, 240, 725–735. [Google Scholar] [CrossRef] [PubMed]
- Lampi, A.M.; Nurmi, T.; Piironen, V. Effects of the Environment and Genotype on Tocopherols and Tocotrienols in Wheat in the HEALTHGRAIN Diversity Screen. J. Agric. Food Chem. 2010, 58, 9306–9313. [Google Scholar] [CrossRef] [PubMed]
- Carocho, M.; Ferreira, I.C.F.R. A review on antioxidants, prooxidants and related controversy: Natural and synthetic compounds, screening and analysis methodologies and future perspectives. Food Chem. Toxicol. 2013, 51, 15–25. [Google Scholar] [CrossRef]
- Mamatha, B.S.; Sangeetha, R.K.; Baskaran, V. Provitamin-A and xanthophyll carotenoids in vegetables and food grains of nutritional and medicinal importance. IJFST 2011, 46, 315–323. [Google Scholar] [CrossRef]
- Paznocht, L.; Kotíková, Z.; Šulc, M.; Lachman, J.; Orsák, M.; Eliášová, M.; Martinek, P. Free and esterified carotenoids in pigmented wheat, tritordeum and barley grains. Food Chem. 2018, 240, 670–678. [Google Scholar] [CrossRef]
- Zhai, S.; Xia, X.; He, Z. Carotenoids in Staple Cereals: Metabolism, Regulation, and Genetic Manipulation. Front. Plant. Sci. 2016, 7, 1197. [Google Scholar] [CrossRef] [Green Version]
- Trono, D. Carotenoids in Cereal Food Crops: Composition and Retention throughout Grain Storage and Food Processing. Plants 2019, 8, 551. [Google Scholar] [CrossRef] [Green Version]
- Okarter, N.; Liu, C.S.; Sorrells, M.E.; Liu, R.H. Phytochemical content and antioxidant activity of six diverse varieties of whole wheat. Food Chem. 2010, 119, 249–257. [Google Scholar] [CrossRef]
- Whent, M.; Huang, H.; Xie, Z.; Lutterodt, H.; Yu, L.; Fuerst, E.P.; Morris, C.F.; Yu, L.; Luthria, D. Phytochemical Composition, Anti-inflammatory, and Antiproliferative Activity of Whole Wheat Flour. J. Agric. Food Chem. 2012, 60, 2129–2135. [Google Scholar] [CrossRef] [PubMed]
- Yu, L.; Nanguet, A.L.; Beta, T. Comparison of Antioxidant Properties of Refined and Whole Wheat Flour and Bread. Antioxidants 2013, 2, 370–383. [Google Scholar] [CrossRef] [PubMed] [Green Version]


| White Flour | ||||||||
| Wheat Variety | Year | Sample Code | IDF | SDF | TDF | WE-AX | TO-AX | |
| Triticum turgidum L. | Aldura | 1 | D-A#1-WF | 5.5 ± 0.3 b,c,B | 1.0 ± 0.0 d,A | 7.0 ± 0.4 d,B | 1.0 ± 0.1 e,B | 6.0 ± 0.2 c,B |
| 2 | D-A#2-WF | 4.9. ± 0.4 a,b.A | 0.9. ± 0.0 d,A | 5.8. ± 0.5 b,c,A | 0.5. ± 0.0 c,A | 4.2. ± 0.1 a,A | ||
| Endural | 1 | D-E#1-WF * | - | - | - | - | - | |
| 2 | D-E#2-WF | 4.4 ± 0.3 a | 1.2 ± 0.0 e | 5.4 ± 0.4 a,b,c | 0.6 ± 0.0 c | 6.8 ± 0.5 d,e | ||
| Triticum aestivum L. | Cajeme | 1 | S-C#1-WF | 6.5 ± 0.1 d,B | 0.4 ± 0.1 c,A | 6.9 ± 0.1 d,B | 0.5 ± 0.0 c,A | 6.5 ± 0.6 c,d,e,A |
| 2 | S-C#2-WF | 5.8 ± 0.5 c,d,A | 0.4 ± 0.0 c,A | 6.2 ± 0.5 c,d,A | 0.9 ± 0.0 d,B | 6.3 ± 0.1 c,d,A | ||
| Marius | 1 | S-M#1-WF | 4.5 ± 0.2 a,A | 0.1 ± 0.0 a,A | 4.7 ± 0.3 a,A | 0.3 ± 0.0 a,A | 7.0 ± 0.4 e,B | |
| 2 | S-M#2-WF | 4.7 ± 0.2 a,b,A | 0.3 ± 0.0 b,B | 5.0 ± 0.2 a,b,A | 0.4 ± 0.0 b,B | 4.9 ± 0.2 b,A | ||
| Whole Grain Flour | ||||||||
| Wheat Variety | Year | Sample Code | IDF | SDF | TDF | WE-AX | TO-AX | |
| Triticum turgidum L. | Aldura | 1 | D-A#1-WGF | 12.1 ± 0.3 a,A | 1.5 ± 0.1 a,b,c,B | 13.1 ± 0.3 a,A | 1.1 ± 0.0 d,B | 6.7 ± 0.1 a,A |
| 2 | D-A#2-WGF | 12.4 ± 1.0 a,A | 0.9 ± 0.0 a,b,A | 13.3 ± 1.0 a,A | 0.8 ± 0.1 b,A | 8.1 ± 0.3 c,B | ||
| Endural | 1 | D-E#1-WGF | 15.9 ± 0.8 b,B | 1.8 ± 0.3 c,A | 17.0 ± 1.0 b,c,B | 1.1 ± 0.0 d,A | 6.8 ± 0.2 a,A | |
| 2 | D-E#2-WGF | 13.1 ± 1 a,A | 3.2 ± 0.4 d,B | 16.3 ± 1 b,A | 1.1 ± 0.1 d,A | 8.2 ± 0.3 c,B | ||
| Triticum aestivum L. | Cajeme | 1 | S-C#1-WGF | 18.3 ± 0.3 b,A | 1.4 ± 0.1 a,b,c,A | 19.7 ± 0.3 d,A | 0.9 ± 0.0 c,B | 7.3 ± 0.4 b,A |
| 2 | S-C#2-WGF | 17.4 ± 1.5 b,A | 1.6 ± 0.0 b,c,A | 19.8 ± 1.8 c,d,A | 0.7 ± 0.1 b,A | 8.5 ± 0.4 c,B | ||
| Marius | 1 | S-M#1-WGF | 17.6 ± 0.4 b,A | 0.8 ± 0.1 a,A | 18.4 ± 0.4 b,c,d,A | 0.6 ± 0.0 a,A | 6.7 ± 0.7 a,A | |
| 2 | S-M#2-WGF | 17.2 ± 0.6 b,A | 1.0 ± 0.1 a,b,B | 18.2 ± 0.7 b,c,d,A | 0.5 ± 0.0 a,A | 6.5 ± 0.4 a,A | ||
| Bran | ||||||||
| Wheat Variety | Year | Sample Code | IDF | SDF | TDF | WE-AX | TO-AX | |
| Triticum turgidum L. | Aldura | 1 | D-A#1- Bran | 23.4 ± 1.3 a,A | 2.5 ± 0.2 b,B | 23.5 ± 1.3 a,A | 1.1 ± 0.1 c,A | 7.7 ± 0.3 a,b,A |
| 2 | D-A#2- Bran | 22.8 ± 2.0 a,A | 0.8 ± 0.1 a,A | 23.6 ± 2.0 a,A | 1.1 ± 0.1 c,A | 13.5 ± 0.4 e,B | ||
| Endural | 1 | D-E#1- Bran * | - | - | - | - | - | |
| 2 | D-E#2- Bran | 25.7 ± 1.7 a | 6.5 ± 0.3 e | 32.1 ± 2.0 b | 1.9 ± 0.1 e | 10.6 ± 0.6 d | ||
| Triticum aestivum L. | Cajeme | 1 | S-C#1- Bran | 43.2 ± 1.0 b,A | 3.3 ± 0.3 c,A | 46.8 ± 1.0 c,A | 1.7 ± 0.1 d,B | 8.4 ± 1.3 b,c,A |
| 2 | S-C#2- Bran | 47.4 ± 2.1 c,B | 4.2 ± 0.1 d,B | 51.6 ± 2.1 d,B | 0.3 ± 0.0 a,A | 13.8 ± 1.0 e,B | ||
| Marius | 1 | S-M#1- Bran | 44.1 ± 2.0 b,c,A | 2.1 ± 0.1 b,A | 46.1 ± 1.6 c,A | 1.2 ± 0.1 c,B | 6.3 ± 0.6 ª,A | |
| 2 | S-M#2- Bran | 45.0 ± 2.2 b,c,A | 2.4 ± 0.2 b,A | 47.4 ± 2.2 c,A | 0.9 ± 0.0 b,A | 9.5 ± 0.9 c,d,B | ||
| White Flour | ||||||||
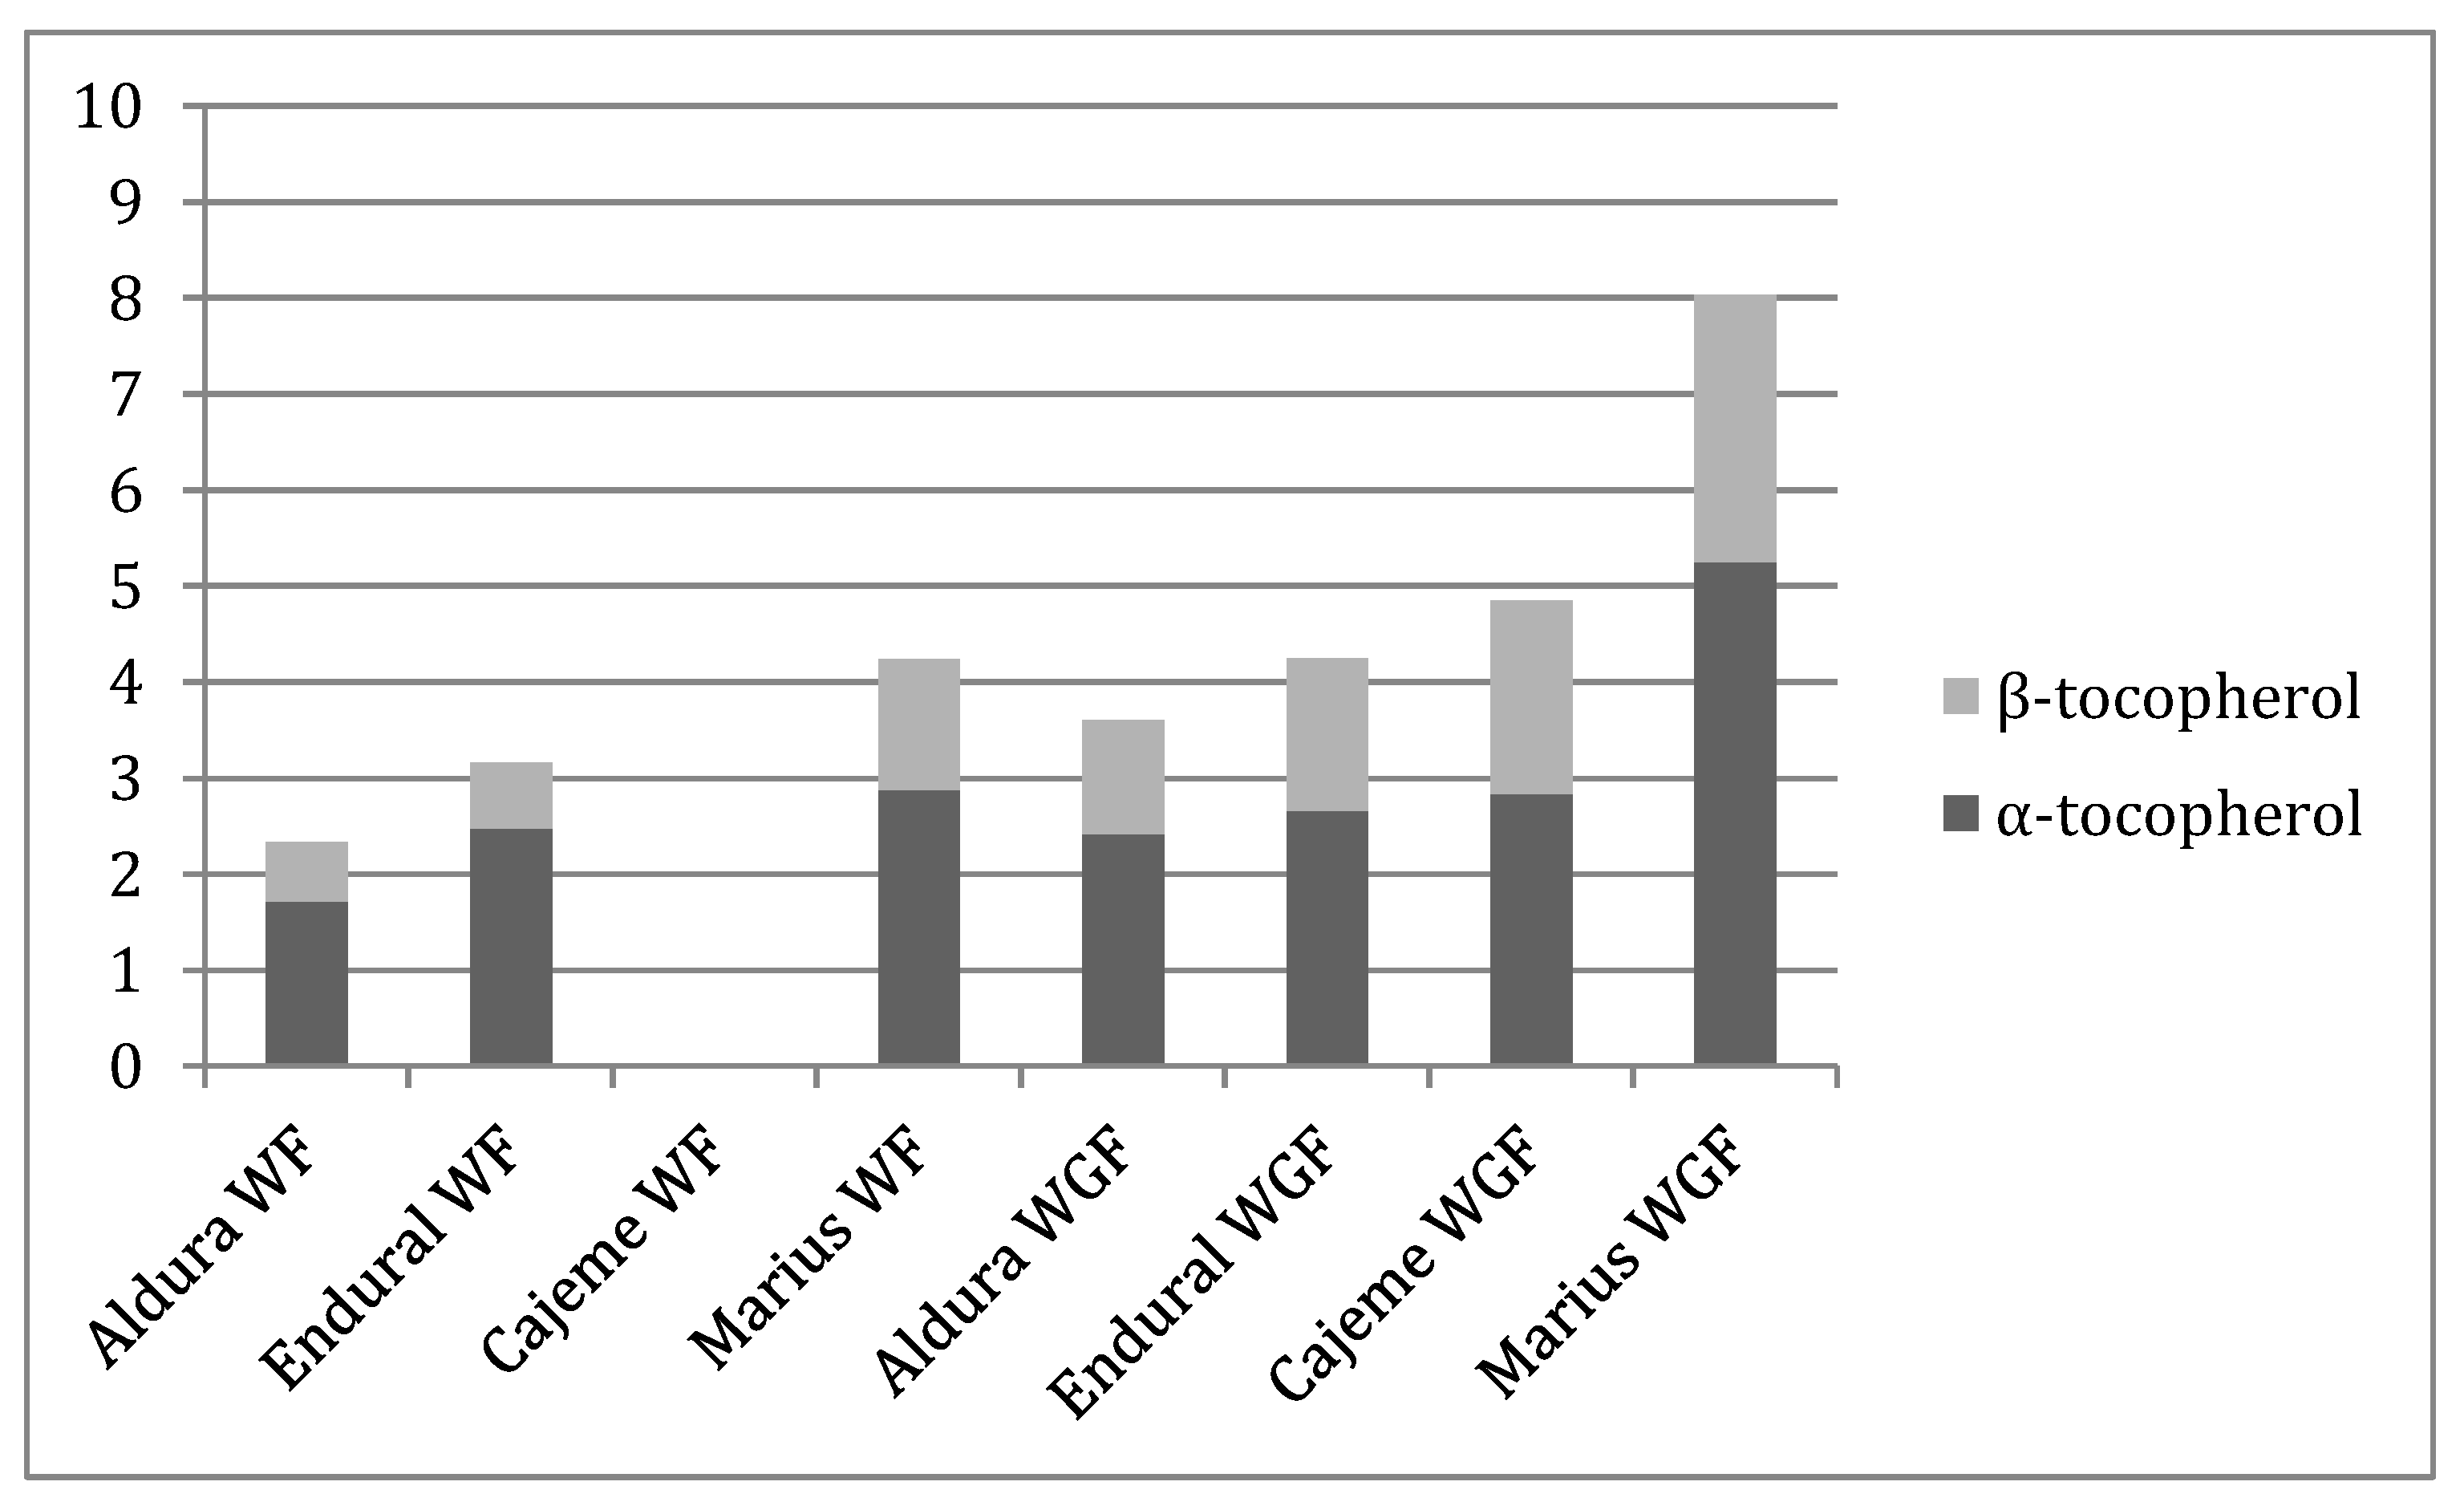
| Wheat Variety | Total Phenols | α-Tocopherol | β-Tocopherol | Total Tocopherols | DPPH | Reducing Power | β-Carotene Bleaching Inhibition | |
| Triticum turgidum L. | Aldura | 5.44 ± 0.09 a | 1.72 ± 0.01 a | 0.62 ± 0.02 a | 2.34 ± 0.01 a | 17.4 ± 0.4 c | 2.98 ± 0.03 c | 1.71 ± 0.02 a |
| Endural | 14.6 ± 0.4 c | 2.48 ± 0.02 b | 0.68 ± 0.00 b | 3.16 ± 0.03 b | 14.5 ± 0.4 b | 2.00 ± 0.01 a | 2.01 ± 0.09 b | |
| Triticum aestivum L. | Cajeme | 14.2 ± 0.5 c | nd | nd | nd | 19.5 ± 0.2 d | 2.26 ± 0.11 b | 4.63 ± 0.06 c |
| Marius | 11.1 ± 0.5 b | 2.88 ± 0.01 c | 1.36 ± 0.01 c | 4.24 ± 0.01 c | 11.5 ± 0.5 a | 3.9 ± 0.1 d | 5.7 ± 0.2 d | |
| Whole Grain Flour | ||||||||
| Wheat Variety | Total Phenols | α-Tocopherol | β-Tocopherol | Total Tocopherols | DPPH | Reducing Power | β-Carotene Bleaching Inhibition | |
| Triticum turgidum L. | Aldura | 20.7 ± 0.5 a | 2.42 ± 0.05 a | 1.19 ± 0.08 a | 3.63 ± 0.03 a | 8.3 ± 0.1 c | 2.59 ± 0.06 d | 1.80 ± 0.07 d |
| Endural | 20 ± 1 a | 2.66 ± 0.05 b | 1.59 ± 0.03 b | 4.26 ± 0.08 b | 9.13. ± 0.08 d | 2.33. ± 0.07 c | 1.63. ± 0.04 c | |
| Triticum aestivum L. | Cajeme | 20.0 ± 0.9 a | 2.84 ± 0.03 c | 2.01 ± 0.02 c | 4.85 ± 0.01 c | 6.1 ± 0.2 b | 0.9 ± 0.2 a | 1.30 ± 0.02 b |
| Marius | 26 ± 1 b | 5.25 ± 0.05 d | 2.78 ± 0.04 d | 8.02 ± 0.01 d | 4.19 ± 0.05 a | 1.57 ± 0.02 b | 1.13 ± 0.07 a | |
© 2020 by the authors. Licensee MDPI, Basel, Switzerland. This article is an open access article distributed under the terms and conditions of the Creative Commons Attribution (CC BY) license (http://creativecommons.org/licenses/by/4.0/).
Share and Cite
Ciudad-Mulero, M.; Barros, L.; Fernandes, Â.; C.F.R. Ferreira, I.; Callejo, M.J.; Matallana-González, M.C.; Fernández-Ruiz, V.; Morales, P.; Carrillo, J.M. Potential Health Claims of Durum and Bread Wheat Flours as Functional Ingredients. Nutrients 2020, 12, 504. https://0-doi-org.brum.beds.ac.uk/10.3390/nu12020504
Ciudad-Mulero M, Barros L, Fernandes Â, C.F.R. Ferreira I, Callejo MJ, Matallana-González MC, Fernández-Ruiz V, Morales P, Carrillo JM. Potential Health Claims of Durum and Bread Wheat Flours as Functional Ingredients. Nutrients. 2020; 12(2):504. https://0-doi-org.brum.beds.ac.uk/10.3390/nu12020504
Chicago/Turabian StyleCiudad-Mulero, María, Lillian Barros, Ângela Fernandes, Isabel C.F.R. Ferreira, Mª Jesús Callejo, Mª Cruz Matallana-González, Virginia Fernández-Ruiz, Patricia Morales, and José M. Carrillo. 2020. "Potential Health Claims of Durum and Bread Wheat Flours as Functional Ingredients" Nutrients 12, no. 2: 504. https://0-doi-org.brum.beds.ac.uk/10.3390/nu12020504