Article

Efficacy of Lactobacillus paracasei HA-196 and Bifidobacterium longum R0175 in Alleviating Symptoms of Irritable Bowel Syndrome (IBS): A Randomized, Placebo-Controlled Study

1
KGK Science Inc., London, ON N6A 5R8, Canada
2
Lallemand Health Solutions, Montreal, QC H4P 2R2, Canada
*
Author to whom correspondence should be addressed.
Submission received: 5 February 2020 / Revised: 19 March 2020 / Accepted: 16 April 2020 / Published: 21 April 2020
(This article belongs to the Section Prebiotics and Probiotics)

Abstract

:
Specific probiotic strains can alleviate the gastrointestinal (GI) symptoms and psychiatric comorbidities of irritable bowel syndrome (IBS). In this randomized, double-blind, placebo-controlled study, the efficacy of Lactobacillus paracasei HA-196 (L. paracasei) and Bifidobacterium longum R0175 (B. longum) in reducing the GI and psychological symptoms of IBS was evaluated in 251 adults with either constipation (IBS-C), diarrhea (IBS-D), or mixed-pattern (IBS-M). Following a 2-week run-in period, participants were randomized to one of three interventions: L. paracasei (n = 84), B. longum (n = 83) or placebo (n = 81). IBS symptoms, stool frequency and consistency and quality of life were assessed by questionnaires. The differences from baseline in the severity of IBS symptoms at 4 and 8 weeks were similar between groups. Participants in this study were classified, after randomization, into subtypes according to Rome III. Within the L. paracasei group, complete spontaneous and spontaneous bowel movement frequency increased in participants with IBS-C (n = 10) after 8 weeks of supplementation (both p < 0.05) and decreased in participants with IBS-D (n = 10, p = 0.013). Both L. paracasei and B. longum supplementation improved the quality of life in emotional well-being and social functioning compared with baseline (all p < 0.05). In conclusion, L. paracasei and B. longum may reduce GI symptom severity and improve the psychological well-being of individuals with certain IBS subtypes.

1. Introduction

Irritable bowel syndrome (IBS) is one of the most common functional gastrointestinal disorders (GI) worldwide, affecting approximately 11% of the global population [1]. IBS is characterized by the co-occurrence of abdominal pain or discomfort, changes in bowel habits, and defecation [2]. Based on bowel habits and stool consistency, IBS patients are grouped into three subtypes, namely the constipation-predominant IBS (IBS-C), diarrhea-predominant IBS (IBS-D), and the mixed bowel habits or cyclic patterns IBS (IBS-M) characterized by the occurrence of both constipation and diarrhea episodes [2]. The physical symptoms of IBS are variable in severity, ranging from unpleasant to debilitating, and as a result, patients’ psychological well-being and quality of life can be adversely affected in more severe cases. This variability in the severity of IBS symptoms, coupled with our incomplete understanding of its pathophysiology, often results in extended delays for patients before receiving a diagnosis. This also leads to inconsistencies in the efficacy of symptom management regimes. Currently, the first step in IBS symptom management involves lifestyle and dietary modifications, such as the adoption of low fermentable oligo-, di-, and monosaccharides and polyols (FODMAPs) and gluten-free diets [3]. In cases where dietary changes are ineffective, adjunctive pharmacotherapies such as antidiarrheal agents, antibiotics, laxatives, antispasmodics, or antidepressants are introduced. Pharmacological interventions often target specific but not all symptoms of IBS and may result in serious adverse events [4,5]. Based on accumulating research evidence, gut microbial dysbiosis is thought to play a role in the pathophysiology of IBS and symptom severity. Consequently, promising leads in IBS management now include the potential use of specific probiotic bacteria to improve both the GI symptoms and psychological comorbidities in IBS [6].
The potential use of probiotics in IBS management stems from their documented beneficial effects on GI health as well as their strong history of safe use [7]. In addition, a lower abundance of Bifidobacterium and Lactobacillus species has been observed in IBS patients [8], and a reduction in IBS symptom severity following supplementation with probiotic strains from these genera was reported by several randomized controlled trials (RCTs) [9,10]. For instance, Bifidobacterium lactis DN-173 010, Lactobacillus paracasei NCC2461, Lactobacillus acidophilus NCFM, Bifidobacterium infantis 35624, and Bifidobacterium longum NCC3001 have shown some efficacy at reducing GI symptoms of IBS, such as frequency of bowel movements (BMs), pain, and visceral hypersensitivity [11]. Supplementation for 2 months with B. longum W11 in combination with rifaximine, a broad-spectrum antibiotic, significantly reduced symptoms of IBS compared to rifaximine alone, as measured by a visual analogue scale [12]. A clinical study exploring the effects of Lactobacillus paracasei F19 on IBS symptoms reported an improvement in the bowel habits of participants with constipation or diarrhea and showed significant improvements in the frequency and intensity of self-reported pain [13].
Probiotics were found to exert both strain-specific and dose-dependent effects on gut health [10,14], but these effects are poorly characterized in IBS patients. Hence, characterizing the specific and dose-related effects of single probiotic strains in clinical trials could foster the development of more efficient probiotic blends tailored to IBS patients’ needs. Supplementation with Lactobacillus helveticus R0052 and Bifidobacterium longum R0175 has shown beneficial psychological effects in healthy human volunteers [15] and patients with major depressive disorder [16]. However, B. longum R0175 supplementation has not been studied in IBS patients. Similarly, there are no previous studies on Lactobacillus paracasei HA-196 in a population with IBS.
Therefore, the aim of the current study was to evaluate the efficacy of two single strain probiotics, B. longum R0175 (B. longum) and L. paracasei HA-196 (L. paracasei), in the management of GI and psychological symptoms in IBS patients.

2. Materials and Methods
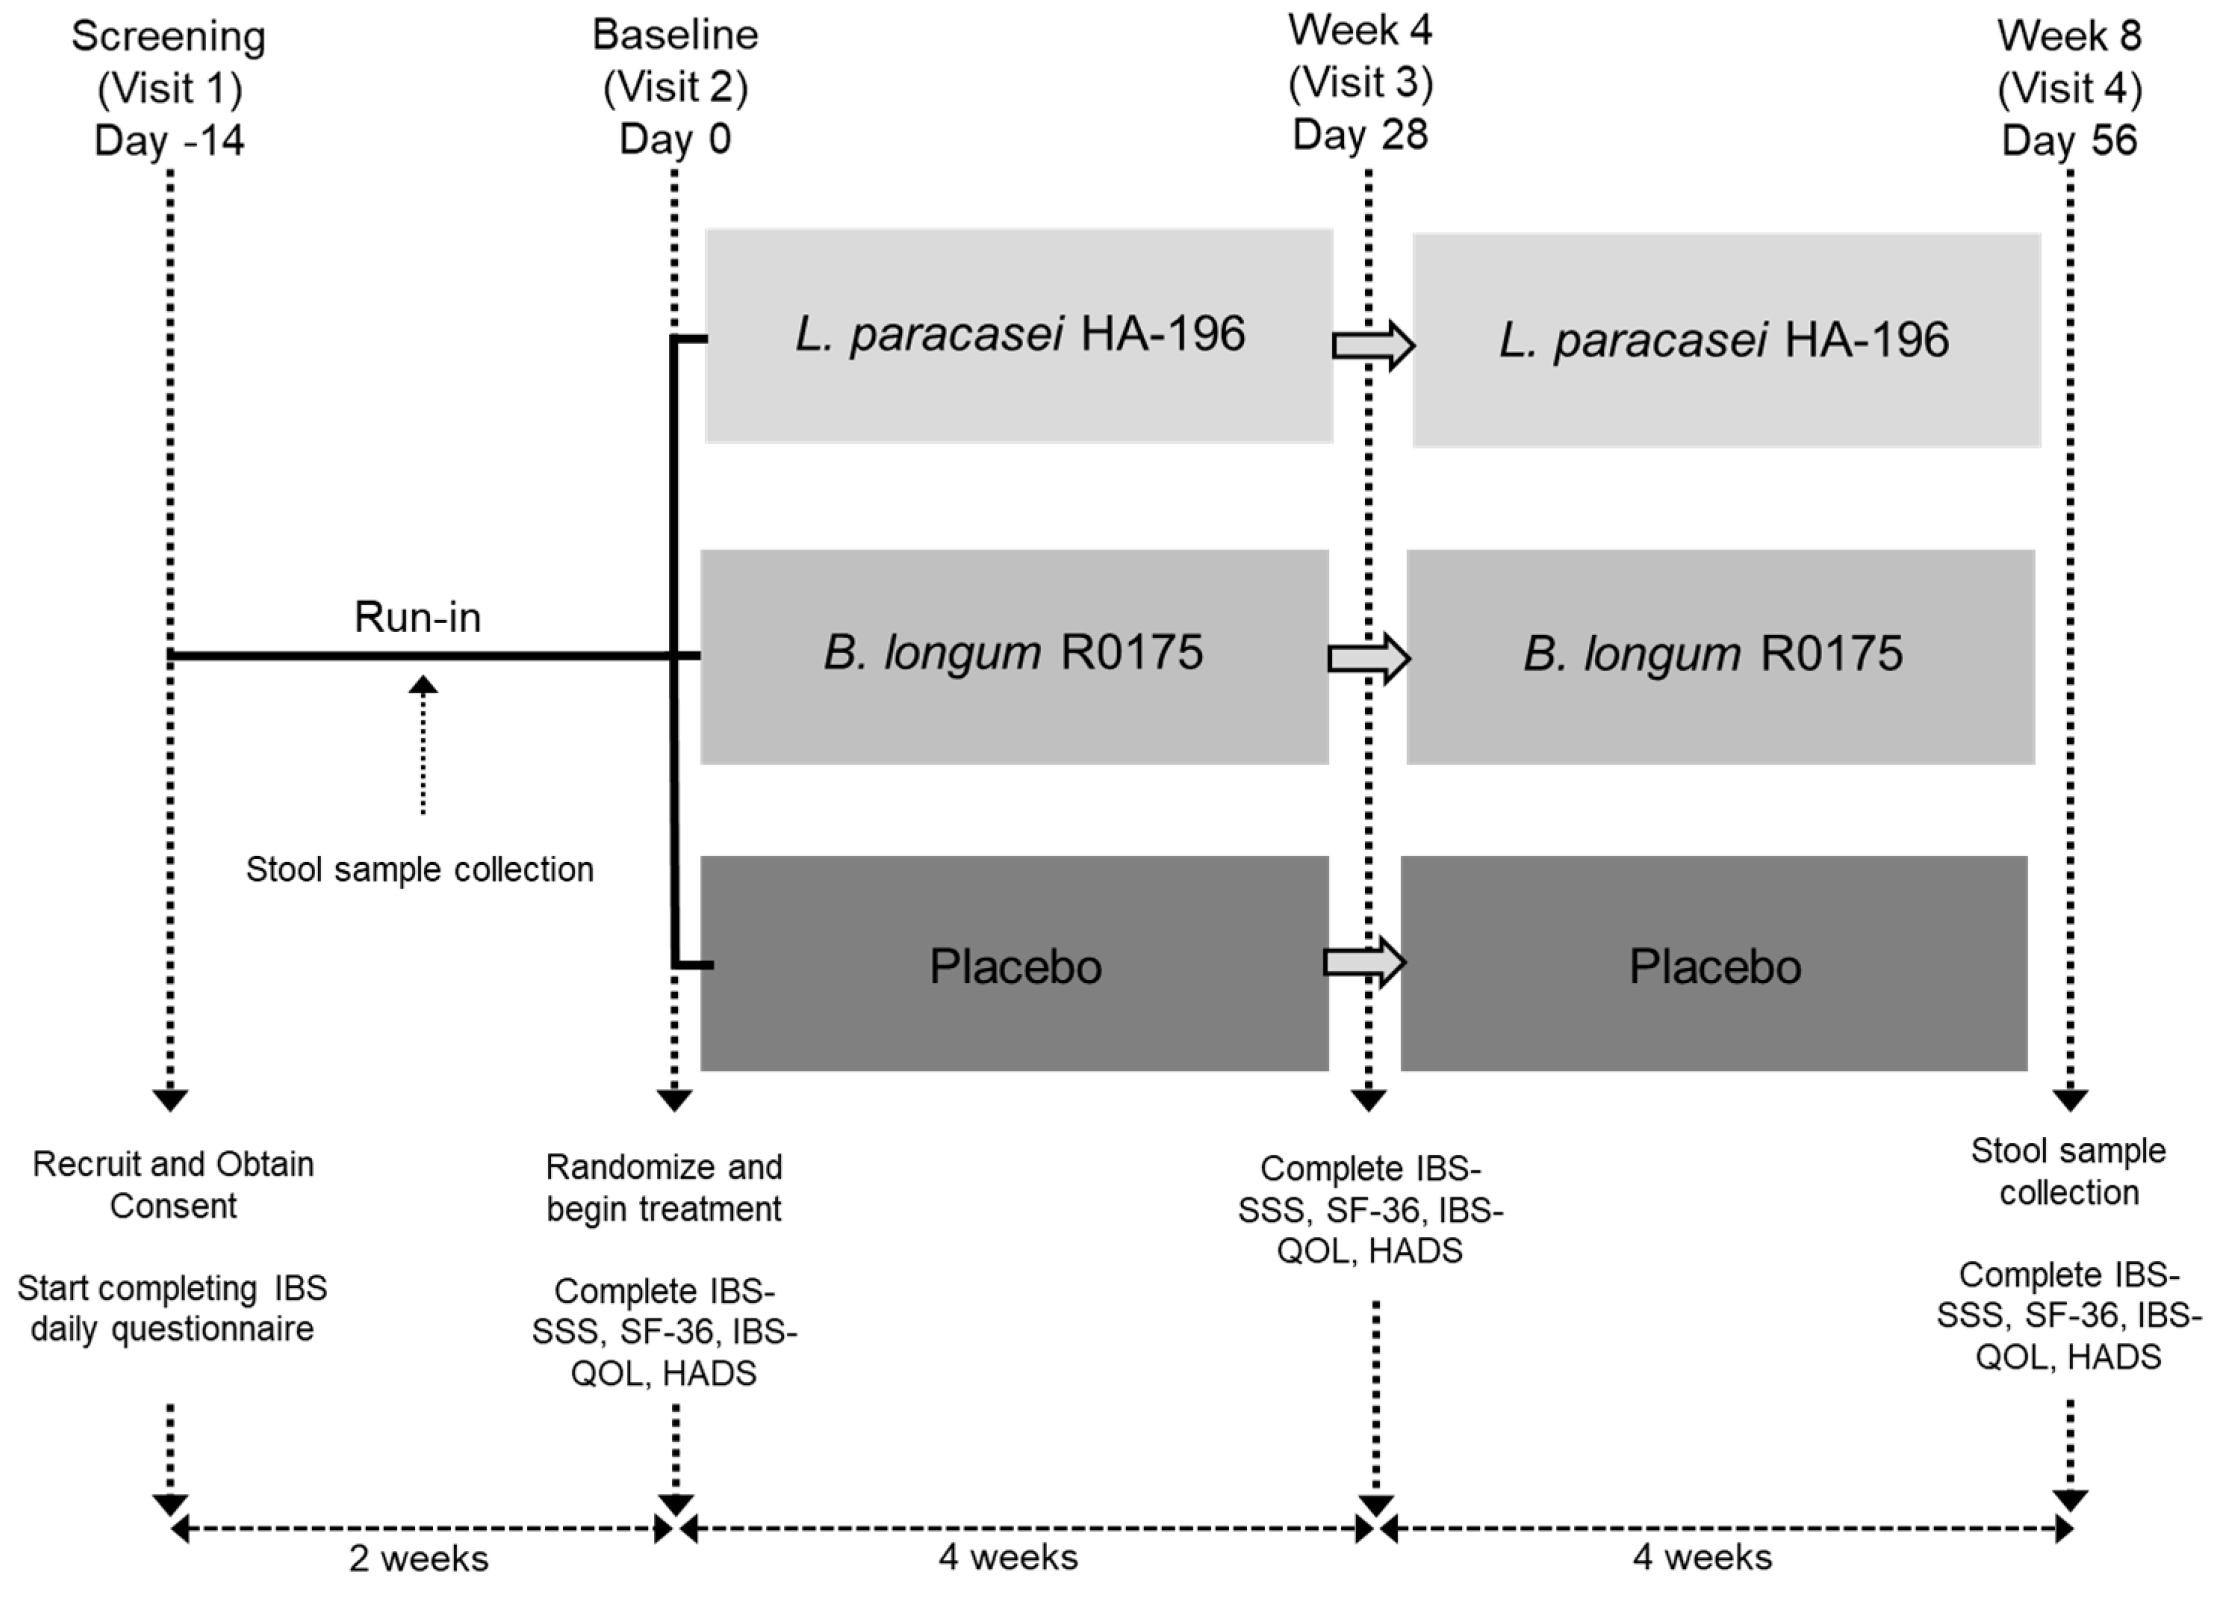
2.1. Study Design

This study was approved by the Natural and Non-Prescription Health Products Directorate, Health Canada, Ottawa, Ontario on 23 June 2014. Research ethics board approval was granted on 7 July 2014 from the Institutional Review Board (IRB) Services, Aurora, Ontario. All participants in the study provided written informed consent at the screening visit and the study was conducted in accordance with the Declaration of Helsinki guidelines and its subsequent amendments. The trial was registered at ClinicalTrials.gov (NCT02213172) and followed the CONSORT guidelines for randomized controlled trials [17] (Supplementary Table S1). The study was planned to only include participants with IBS-C. Due to low enrollment, the protocol was modified on 6 January 2016 to include participants with all IBS subtypes.
This randomized, double-blind, placebo-controlled, 3-arm parallel group study was conducted at KGK Science Inc., London, ON, Canada between September 2014 and February 2018. The study included a 2-week run-in period, during which regular bowel habits were reported, and an 8-week intervention period (day 1 to day 57), consisting of a total of four clinic visits (Figure 1).
Clinical and qualitative assessments were conducted at screening, day 0 (baseline), 4 weeks and 12 weeks (end-of-study). At the screening visit, participants were provided with a 3-day food record and a 2-week daily diary to complete before the baseline visit. The daily diary assessed the number of spontaneous bowel movements (SBM; defined as a stool not induced by rescue medication), complete spontaneous bowel movements (CSBM; defined as an SBM associated with a sensation of complete evacuation), and stool consistency based on the Bristol stool scale [18]. Participants were also instructed to collect a fecal sample (5–10 g) using the provided stool collection kits 3 days before taking the investigational product (IP). The fecal sample was to be frozen immediately upon collection and brought to the clinic before or at the baseline visit.
At all study visits, the Irritable Bowel Syndrome Symptom Severity Scale (IBS-SSS), Short Form (36) Health Survey v2TM (SF-36), Irritable Bowel Syndrome Quality of life (IBS-QOL), and Hospital Anxiety Depression Scale (HADS) questionnaires were administered and assessed. Additionally, 3-day food records and diaries were reviewed for daily IBS-SSS, concomitant therapies, adverse events, and study product use. Vital signs and anthropometric measurements were undertaken at each visit while hematology and clinical chemistry parameters for all safety endpoints were assessed at the screening and end-of-study visits.
At week 8, participants provided a fecal sample (5–10 g) collected within the 3 days preceding their last visit and frozen immediately after collection and then brought to the clinic.

2.2. Participants

Individuals diagnosed with IBS were recruited from Southwestern Ontario, Canada using the KGK Science Inc.’s internal participant database along with local electronic and physical advertisement devoid of gender or racial bias. Participants met the following inclusion criteria: aged 18 years or older, IBS diagnosed according to the Rome III criteria [19], and willingness to discontinue probiotic consumption for the duration of the study. After the broadening of eligibility criteria to all subtypes, the distribution of IBS subtypes in each intervention group was determined after randomization using the IBS Rome III Questionnaire completed at screening.
Participants were excluded if they used medications to manage IBS symptoms or narcotics in the past month, history of gastrointestinal surgery, gastrointestinal disease (except hemorrhoids and uncomplicated diverticula) or family history of colorectal cancer, inflammatory bowel disease, or celiac sprue.

2.3. Interventions

Each probiotic capsule contained 10 × 109 colony forming units (CFU) of either freeze-dried B. longum (Lot Numbers: NH131210-1VB and NH151104-ICP) or L. paracasei (Lot Numbers: NH131217-1VB and NH151106-ICP), with potato starch and magnesium stearate as excipients. The placebo (Lot Numbers: NH131226-ISC and NH151028-ICP) contained only potato starch and magnesium stearate. At the baseline visit, participants were instructed to start consuming one capsule of the investigational products with breakfast on the following day (Day 1), and then daily for 8 weeks. The investigational products and placebo were manufactured by Lallemand Health Solutions (LHS) and kept refrigerated (2–8 °C) before use at the study site.

2.4. Randomization and Blinding

Eligible participants were assigned a randomization code from a list generated by www.randomization.com, and allocated to each intervention group in a 1:1:1 ratio. Except for 13 participants enrolled while the study was focused on IBS-C, IBS subtypes were not considered before randomization after the eligibility criteria were extended to include all subtypes. The investigational products were labelled in accordance with the International Conference on Harmonisation Good Clinical Practice guidelines, applicable local regulatory guidelines, and included the applicable randomization number. All capsules were identical in size, shape, colour, and taste. Investigators, clinic staff and participants remained blinded for the duration of the study.

2.5. Assessments of IBS Symptom Severity, General Health and Psychological Well-Being

The primary outcome measure was the difference in the mean change in symptom severity between each probiotic group and the placebo group (calculated at week 4 and 8, over baseline; i.e., week 4–baseline and week 8–baseline). Symptom severity was assessed using the IBS-SSS.
The secondary outcomes included the difference in the mean change between each probiotic group and the placebo group (calculated at week 4 and 8, over baseline) in several aspects of general health, quality of life, and psychological well-being. The change in general health was assessed using the SF-36 questionnaire; a commonly used tool with 36-items to measure health-related quality of life in 8 domains [20]. Levels of depression and anxiety were measured using the HADS questionnaire; an easy-to-use and validated tool developed for the detection of anxiety disorders and depression in a non-psychiatric hospital clinic setting [21].
Other secondary outcomes were the difference in mean change between each probiotic group and placebo group (calculated at week 4 and 8, over baseline) for each of the following parameters: abdominal pain intensity, abdominal pain frequency, abdominal distension/tightness, bowel habit satisfaction, and IBS-SSS score for each IBS subtypes. Changes in the microbiome composition from baseline to week 8 for each probiotic group and the placebo group were also investigated. Additional secondary outcomes examined were the severity of straining and stool consistency according to the IBS daily diary and amount of rescue medication (Bisacodyl 5 mg, a laxative) used throughout the study for the relief of severe constipation (72 h since last BM or when symptoms of constipation became intolerable).

2.6. Fecal Microbe Composition Analysis

Stool samples collected at baseline and week 8 were used to confirm participant compliance and microbe composition through quantitative real-time polymerase chain reaction (qPCR). Total DNA from 250–350 mg of homogenized fecal samples was extracted using the QIAamp Fast DNA Stool Mini kit (QIAGEN, ON, Canada) with the following modifications: (1) two washes with 0.05 M phosphate buffer prior to the InhibitEx step and (2) a 0.1 mm zirconia/silica bead beating step (3 × 4 m/s for 1 min) prior to the centrifugation of samples to pellet particles. Ratios of A260/A280 were assessed to determine sample purity. Absolute quantification of the two probiotic strains and Bifidobacterium genus and relative quantification of Akkermansia mucinphilia and Faecalibaterium prausnitzii was conducted. Template DNA generated for the standard curve formation involved spiking 109 of the appropriate lyophilized powder into a fecal mix and proceeding with the DNA extraction. DNA was diluted 10-fold to generate a standard curve ranging from 109–104 bacteria for L. paracasei and B. longum Primers for B. longum R0175 forward: 5’-GTCGCCACATTTCATCGCAA-3’, reverse: 5’-GAGAGCTTCGATTGGCGAAC-3’; L. paracasei HA-196 forward: 5’-ACCGAAGTCTATCACCCGGA-3’, reverse: 5’-TCGCCAAATTTGCTGTCGTG-3’; Bifidobacterium genus forward: 5’-TGGAAGGTCTCGATGGAGGT-3’, reverse: 5’-CTGGACAAGCCGTTCCTGAT-3’). DNA was diluted 1/5 prior to qPCR. Each qPCR reaction contained 300 nM of the appropriate forward and reverse primer, 1X SYBR Select Master Mix (Thermo Fisher Scientific, Waltham, MA, USA) and 1 µL of diluted DNA. The epMotion 5075 liquid handling robot (Eppendorf, Hamburg, Germany) was used to dilute DNA from the fecal samples 5-fold, and add 9 mL of mastermix and 1 µL of diluted DNA to the reaction plate. The cycling conditions for the B. longum R0175, L. paracasei HA-196, Bifidobacterium species, and 16S rRNA universal bacterial primers included a 2-min hold at 50 °C, a 2-min hold at 95 °C and 40 cycles of 95 °C for 15 s, 60 °C for 30 s and 72 °C for 30 s. The relative quantifications of A. muciniphila and F. prausnitzii was performed via species-specific primers and DNA was normalized by bacterial primers targeting the 16S rRNA gene. The primers and cycling conditions used for A. muciniphila and F. prausnitzii quantification were obtained from literature [22,23,24]. The CFX384™ Touch Real-Time polymerase chain reaction (PCR) Detection System was used to perform quantitative PCR (qPCR) analyses and results were viewed using the CFX Maestro Software 1.1 (Bio-Rad, Hercules, CA).

2.7. Compliance

Compliance was assessed by counting the returned IP at the final study visit. Percent compliance was calculated by determining the number of capsules consumed divided by the number expected to have been taken multiplied by 100. Participants were also asked every day in the IBS daily diary if they consumed the IP. In the event of a discrepancy between the information in the IBS daily diary and the amount of IP returned, compliance was determined based on the product returned unless an explanation for the loss of product was provided.

2.8. Statistical Analyses

The proposed sample size for this study was 285 enrolled participants, with 95 participants randomized into each of the three study arms in a double-blinded manner. The sample size calculation was based on a standard deviation (SD) of 60, a significance level of 5% (two-sided α), 83% power (β = 0.17), 20% attrition rate and a 110-point detectable difference in IBS-SSS scores from baseline to week 8, compared between probiotics and placebo. The assumptions were based on two previous trials, by Dapoigny et al. (2012) [25] and Williams et al. (2009) [26], which examined the effect of probiotic interventions with Lactobacillus and Bifidobacterium strains on the symptom severity scores in adult IBS patients.
All statistical analyses were completed using SAS® software Version 9.3 (SAS Institute, Cary, NC, USA) for Microsoft Windows, where probabilities ≤0.05 were considered statistically significant. A blinded interim analysis was conducted on the primary outcome (IBS-SSS) after 50% recruitment. The blind was maintained for all study personnel including the statistician. The per protocol (PP) population consisted of all participants who consumed at least 80% of either product dose, did not have any major protocol violations, and completed all study visits and procedures connected with measurement of the primary variable. The safety population consisted of all participants who received either product and on whom any post-randomization safety information was available. An efficacy analysis based on the PP population and IBS subtypes was performed. Variables were tested for normality and log-normality, and variables showing a log-normal distribution were analyzed in the logarithmic domain.
Appropriate non-parametric tests were used to analyze non-normal variables. Continuous, normally distributed variables were analyzed by linear mixed-effects models with visit (baseline, week 4, and week 8), intervention (L. paracasei, B. longum, and placebo groups), and their interaction as fixed effects, and subject as a random effect to capture the repeated observations on each subject. Additionally, within-group changes from Day 0 were obtained from the linear mixed-effects models.

3. Results

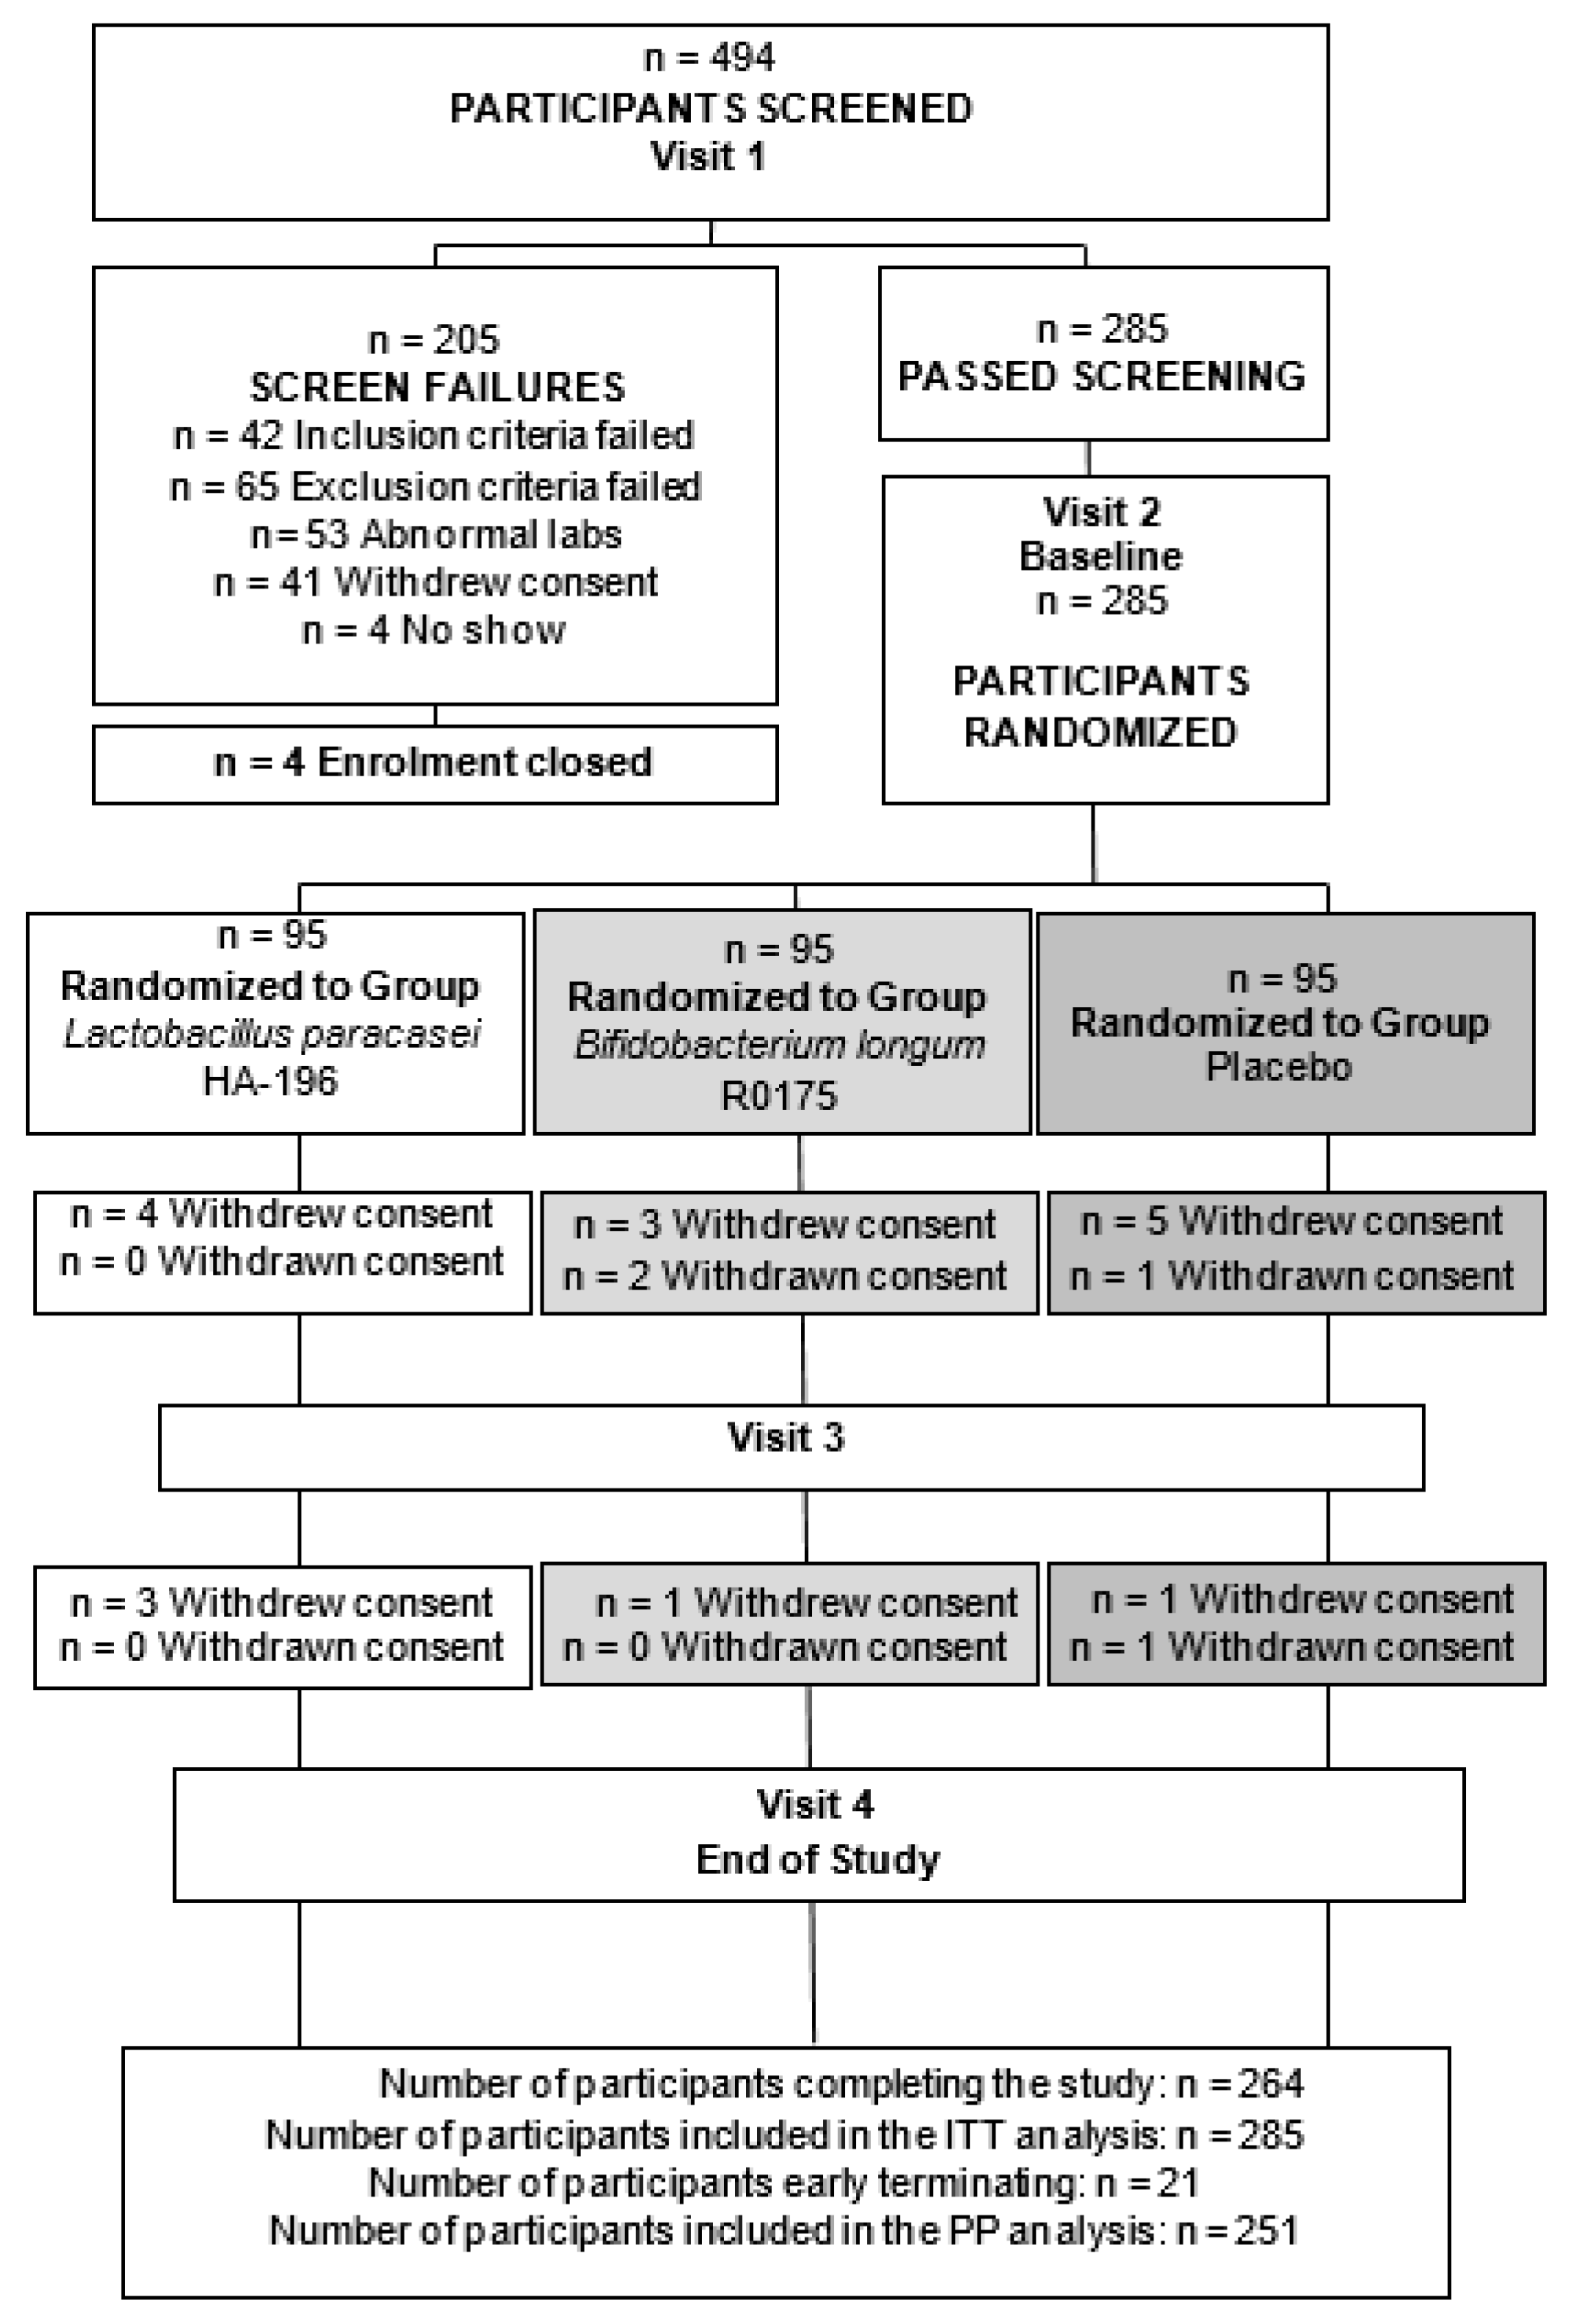
3.1. Study Participant Dispositions

Out of the 494 participants screened, 285 were eligible and enrolled in the study. Ninety-five participants were randomized into each of the three groups to receive either L. paracasei, B. longum, or placebo (Figure 2). Following randomization, six participants withdrew consent and 1 participant was lost to follow up in the L. paracasei group. In the B. longum group, two participants withdrew consent, two were withdrawn by the Qualified Investigator (QI) and two were lost to follow up. In the placebo group, eight participants discontinued the study (three withdrew consent, two were withdrawn by the QI and three were lost to follow up). Thirteen participants who completed the study were removed from per protocol (PP) analysis. Four participants were removed from the L. paracasei group due to consumption of magnesium throughout the study (n = 1), use of antibiotics (n = 1), or insufficient compliance (n = 2). Three participants were excluded from the B. longum group for consumption of NSAIDs (n = 1), antibiotics (n = 1), and laxatives (n = 1). In the placebo group, six participants were removed from PP analysis due to the consumption of NSAIDs and PPIs (n = 1) or antibiotics (n = 4), while another was enrolled 18 days outside of the screening window (n = 1). The demographic information of the PP population is presented in Table 1, along with the IBS subtype distribution within each treatment conditions.

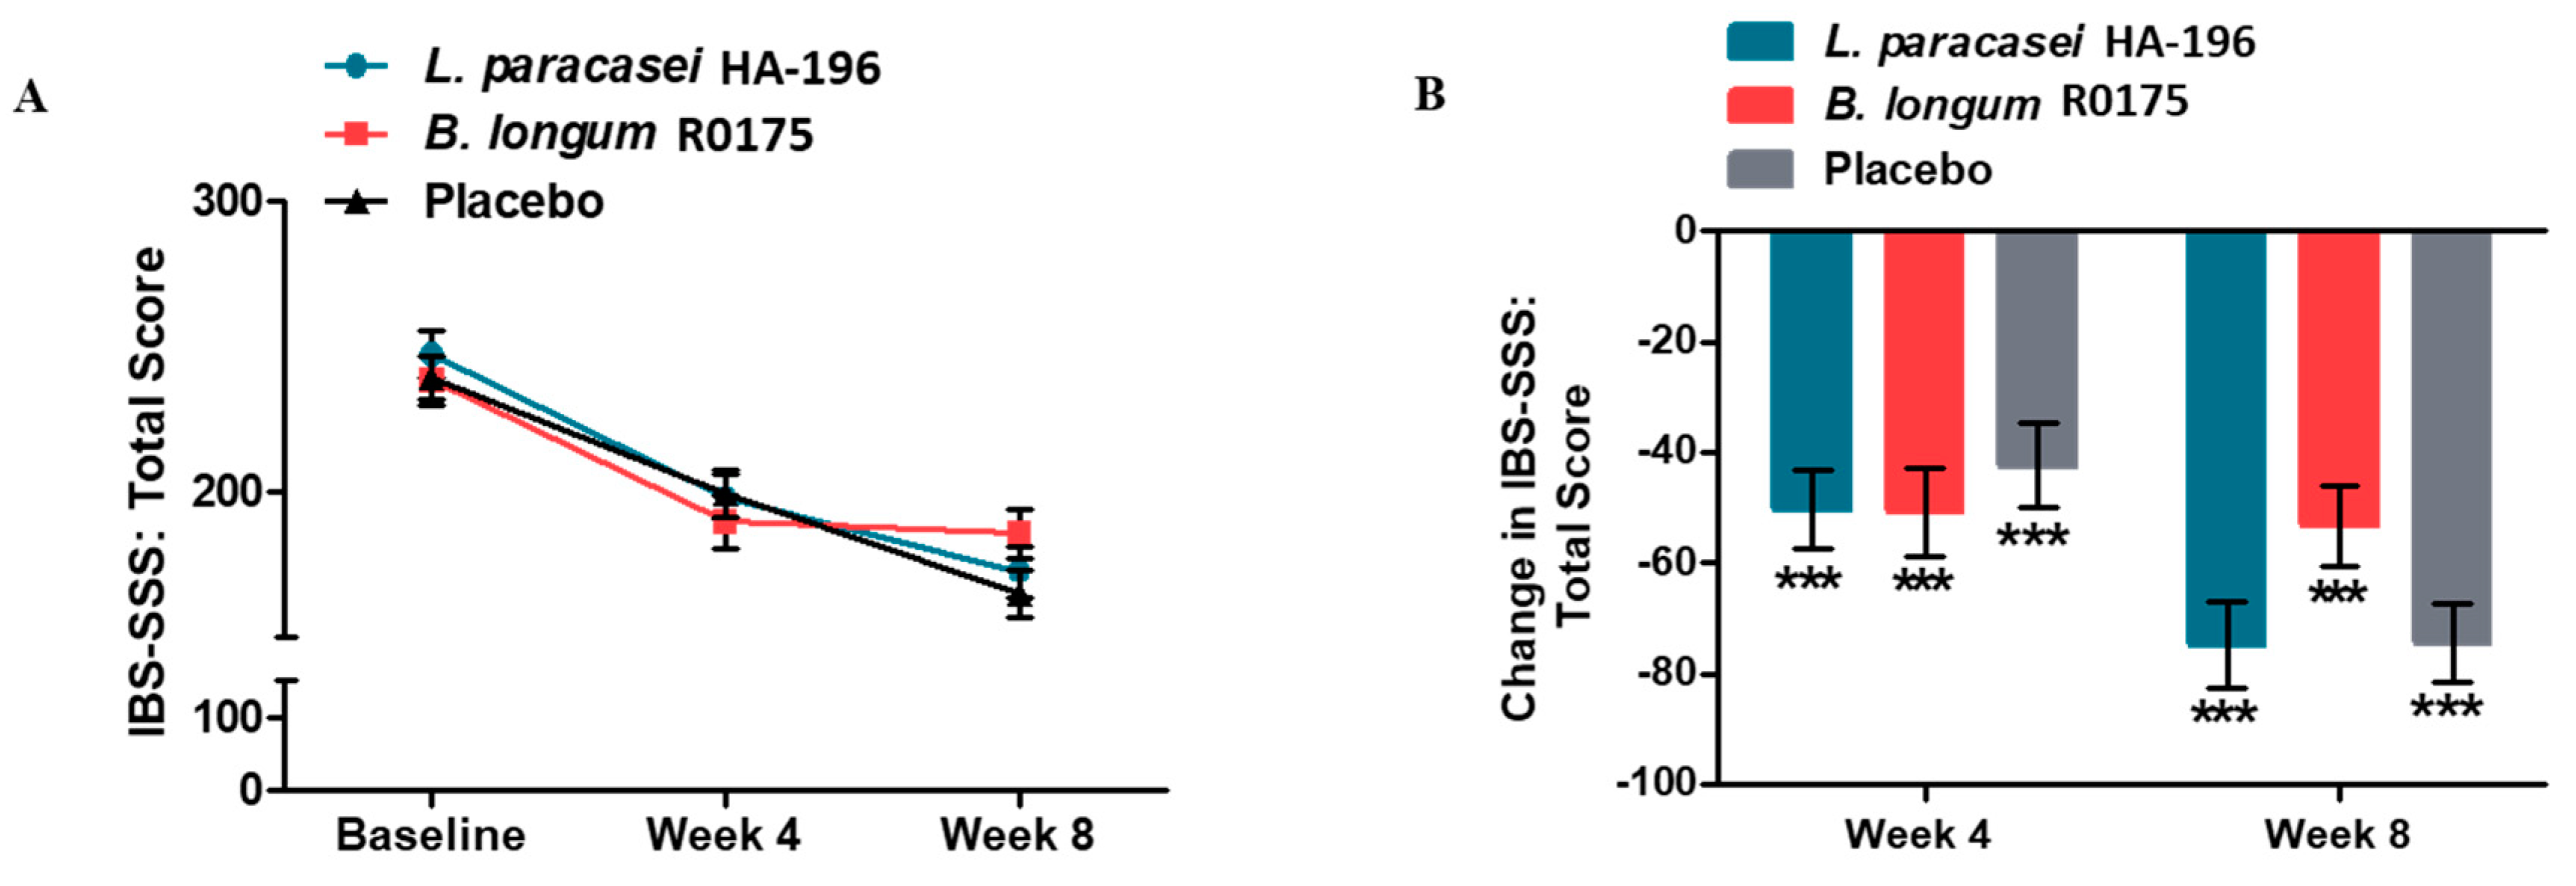
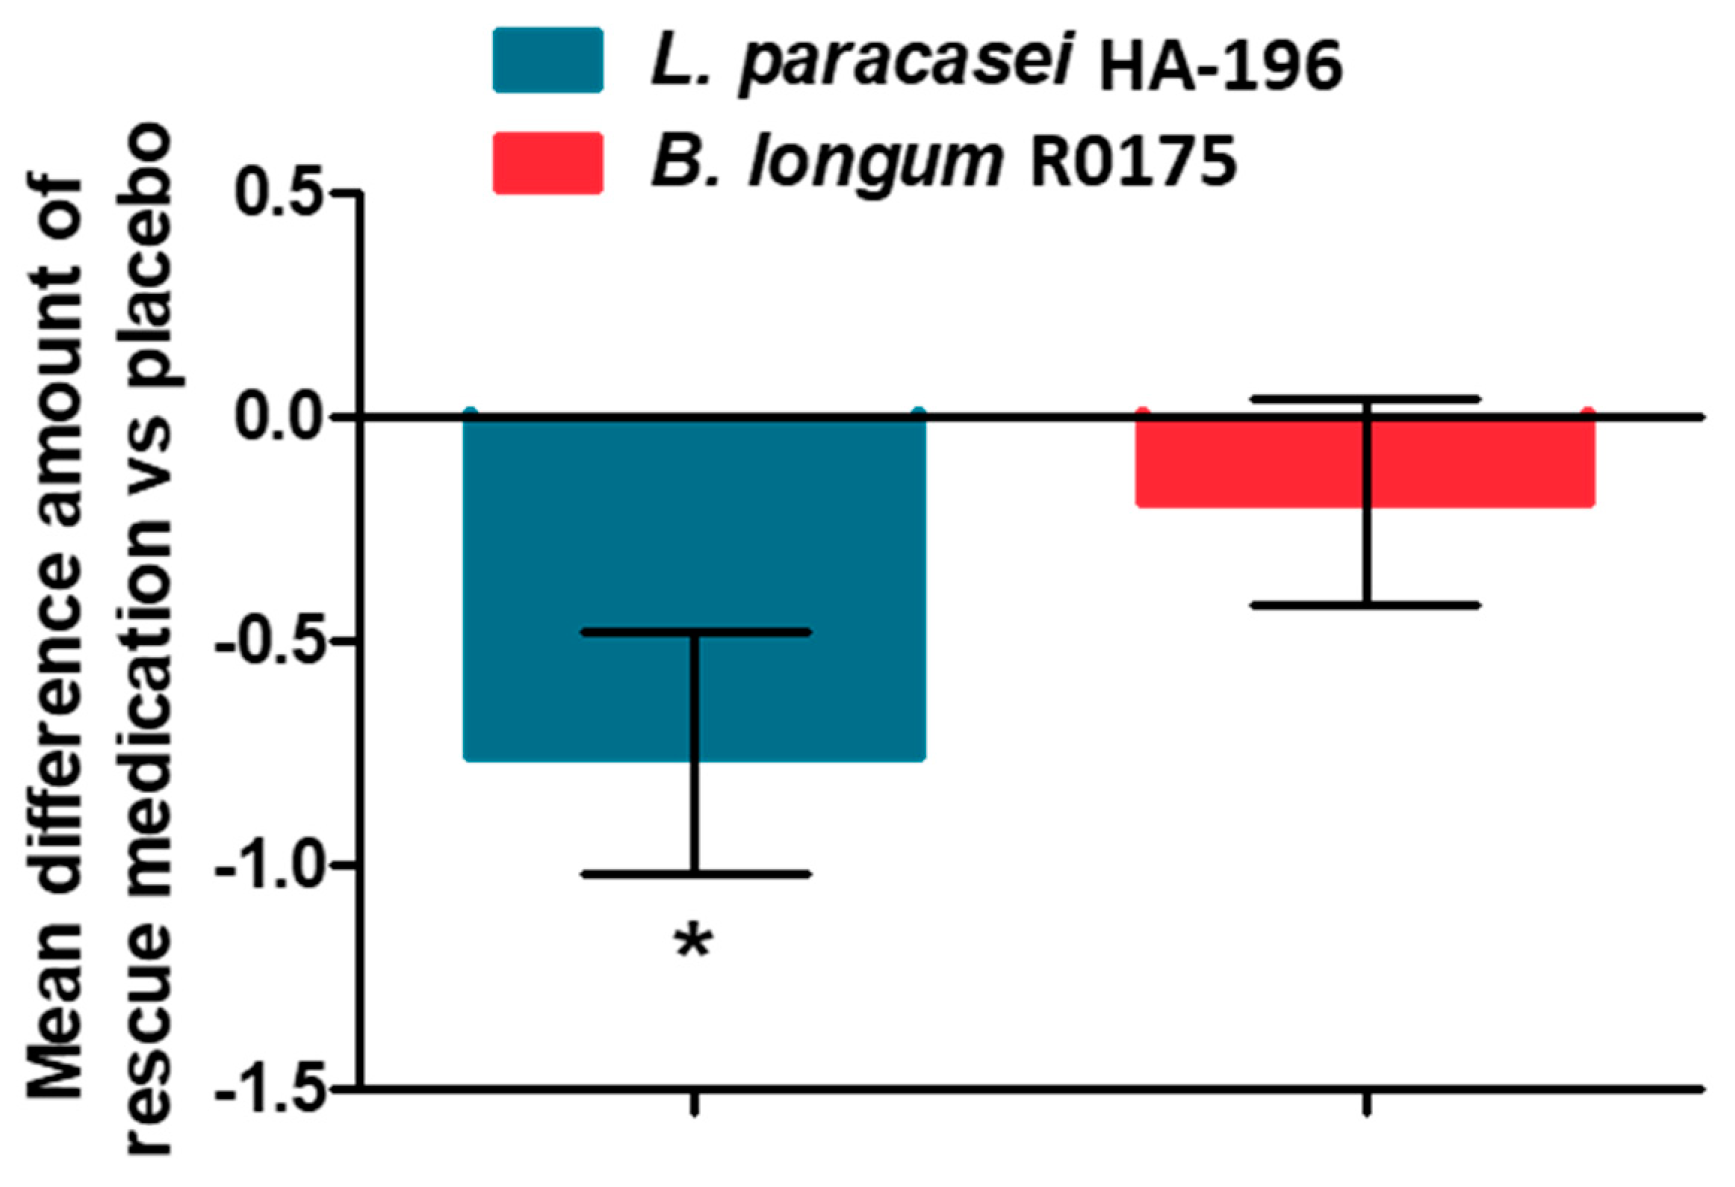
3.2. Improvement in the IBS Symptom Severity Score and Rescue Medication Use

There were no significant between group changes; however, there were significant reductions in IBS-SSS at week 4 and 8 week from baseline in all three groups. The IBS-SSS scores were reduced significantly at week 4 vs. baseline in participants supplemented with L. paracasei (−20%), B. longum (−20%), and placebo (−17%) (all p < 0.001; Table 2 and Figure 3). Similarly, IBS-SSS scores were significantly reduced at week 8 vs. baseline in the L. paracasei (−30%), B. longum (−22%), and placebo (−31%) groups (all p < 0.001; Table 2 and Figure 3). Rescue medication (bisacodyl 5 mg tablets) was permitted for the relief of severe constipation, defined as 72 h since last BM or when symptoms became intolerable. Participants from both probiotic supplemented groups reported consuming less rescue medication compared to the placebo group; this difference was found to be statistically significant only for the L. paracasei group (p < 0.05; Figure 4, Supplementary Table S2).

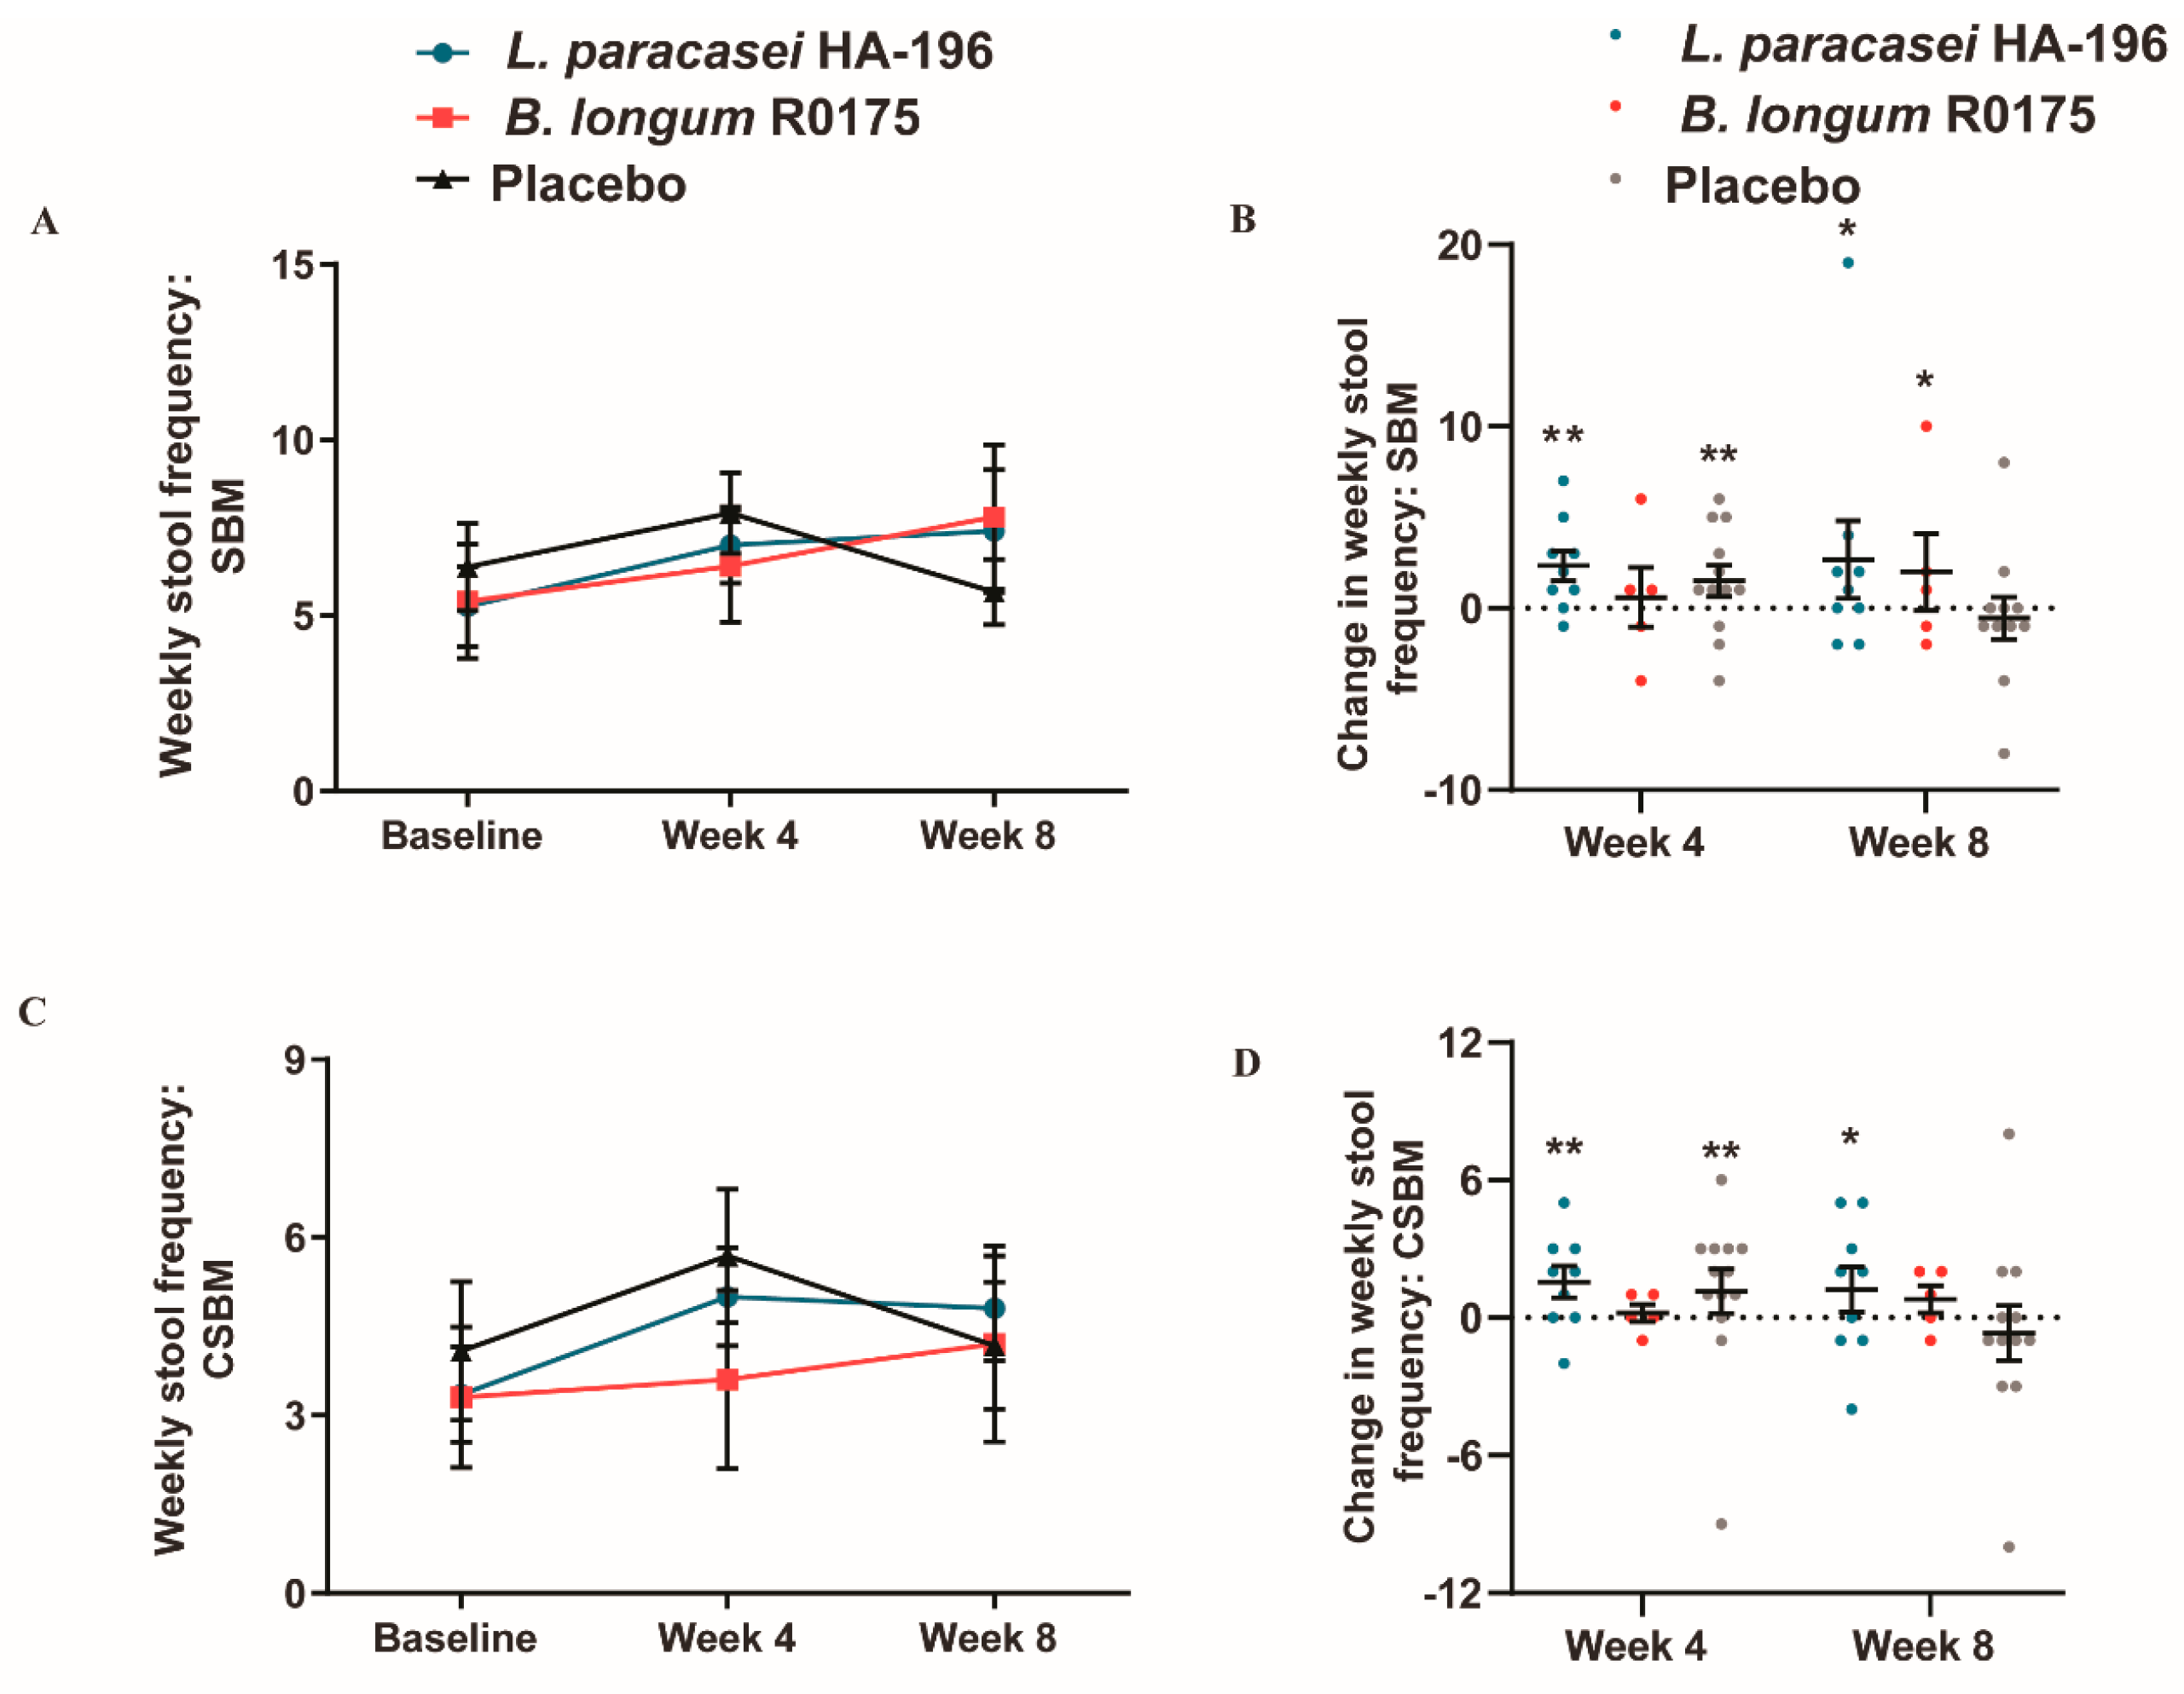
3.3. Increase in Bowel Movement Frequency in Participants with IBS-C

In participants with IBS-C, there were no significant between-group differences in SBM, CSBM, and stool consistency among the three groups (Table 3). However, L. paracasei and B. longum consumption led to increased number of within-group SBM and CSBM. At week 4, participants with IBS-C reported significant 33% and 24% improvements for the number of weekly SBM from baseline when consuming either L. paracasei or placebo, respectively (both p = 0.007). Although, participants receiving B. longum reported a 19% increase in SBM, it was not statistically significant until week 8, when a 44% improvement was reported (p = 0.03). At week 8, participants with IBS-C consuming L. paracasei continued to report a significant 33% improvement in the number of weekly SBM from baseline (p = 0.03). Conversely, a non-significant 11% decrease in the number of weekly SBM from baseline was reported by the placebo group (Figure 5A,B).
IBS-C participants consuming L. paracasei reported a significant 49% increase in CSBM at week 4, and a significant 43% increase at week 8 (p = 0.004 and p = 0.02, respectively). Whereas, the placebo group had reported a significant 39% increase (p = 0.04) at week 4 in the number of CSBM, but by the end of the study period a non-significant 2.2% decrease was reported from baseline (Figure 5C,D).

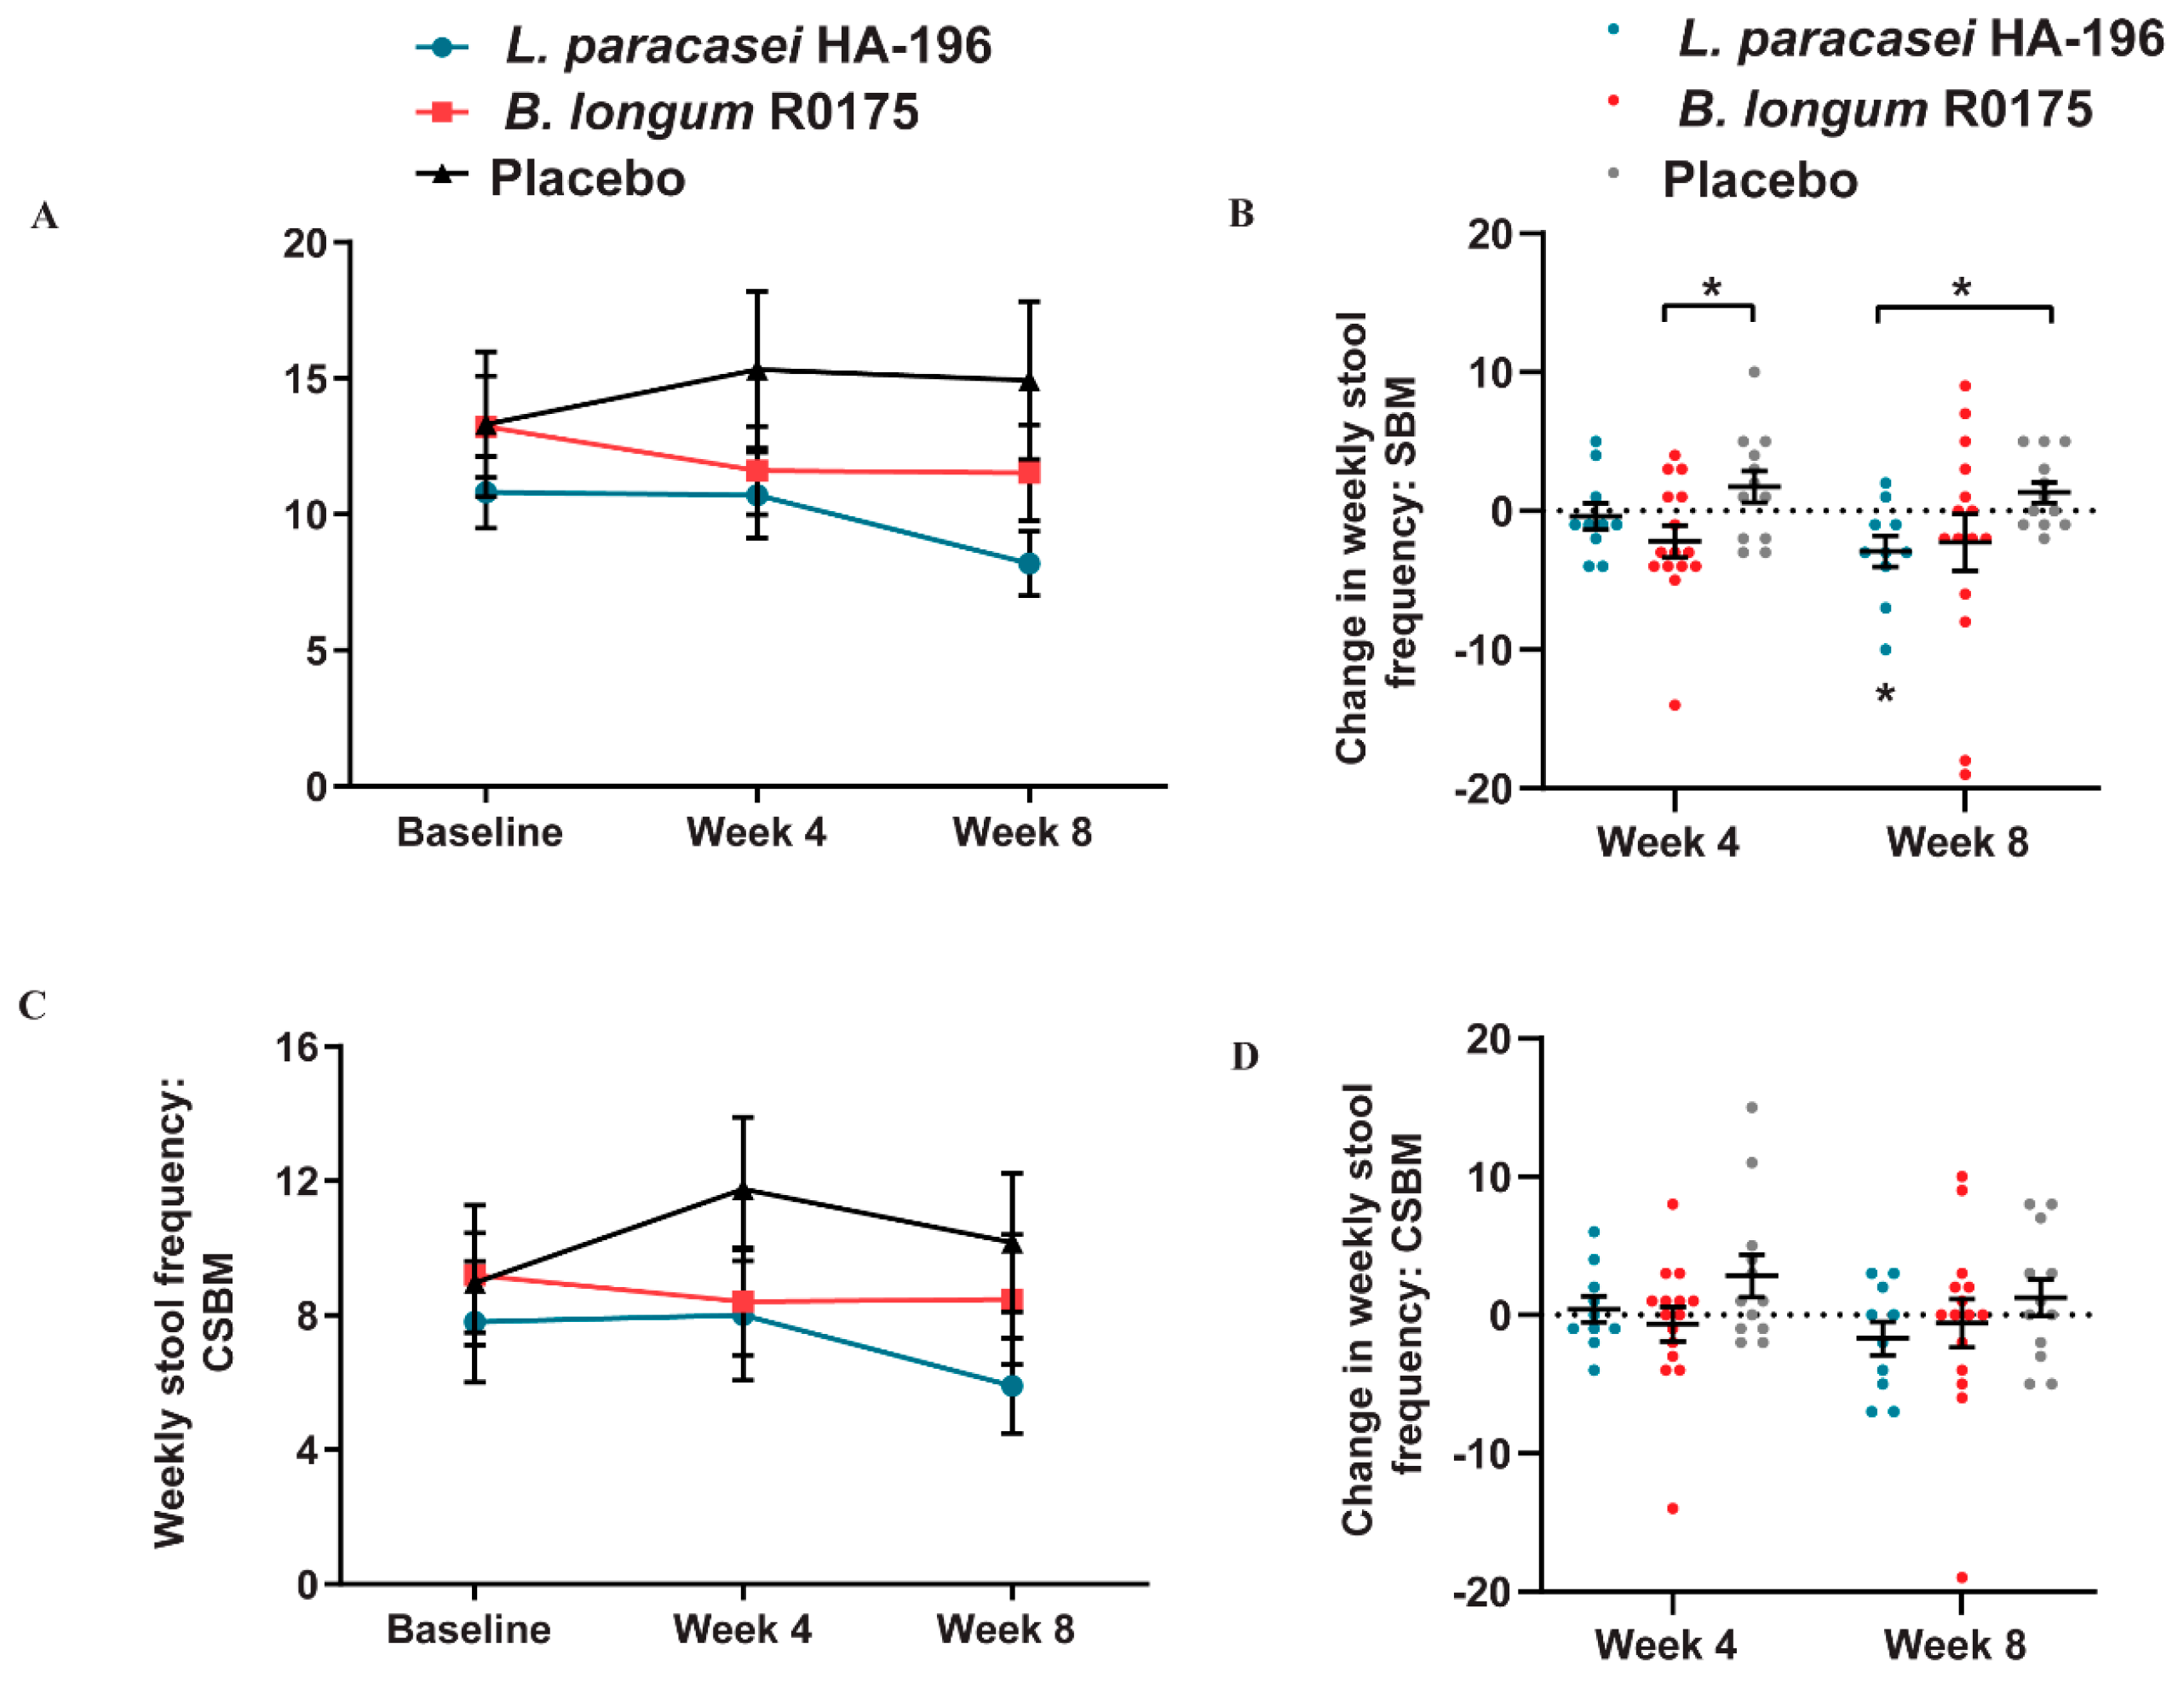
3.4. Decrease in the Bowel Movement Frequency in Participants with IBS-D

In participants with IBS-D, L. paracasei and B. longum consumption led to lower within group SBM and CSBM frequencies. The L. paracasei group reported a significant 21% decrease in SBM from baseline to week 8 that was decreased compared to placebo at week 8 (p < 0.05) (Figure 6A,B). Additionally, IBS-D participants supplemented with B. longum reported significant decreases in their SBM stool frequency compared to placebo at week 4 (Figure 6B). With respect to CSBM, there were no significant within-group differences in participants with IBS-D. The greatest reduction, however, in CSBM was reported by participants receiving L. paracasei (24%), followed by the B. longum group (8%); whereas participants in the placebo group reported a 13.5% increase from baseline to week 8 (Figure 6C,D).
Furthermore, IBS-D participants in the L. paracasei and placebo groups reported significant decreases in stool consistency at 4 weeks; however, the L. paracasei group was the only group to report a significant 15% within group decrease in stool consistency after 8 weeks (Table 4). There were no significant between-group differences for CSBM or stool consistency among the three groups at the end of 4 or 8 weeks of the supplementation period.

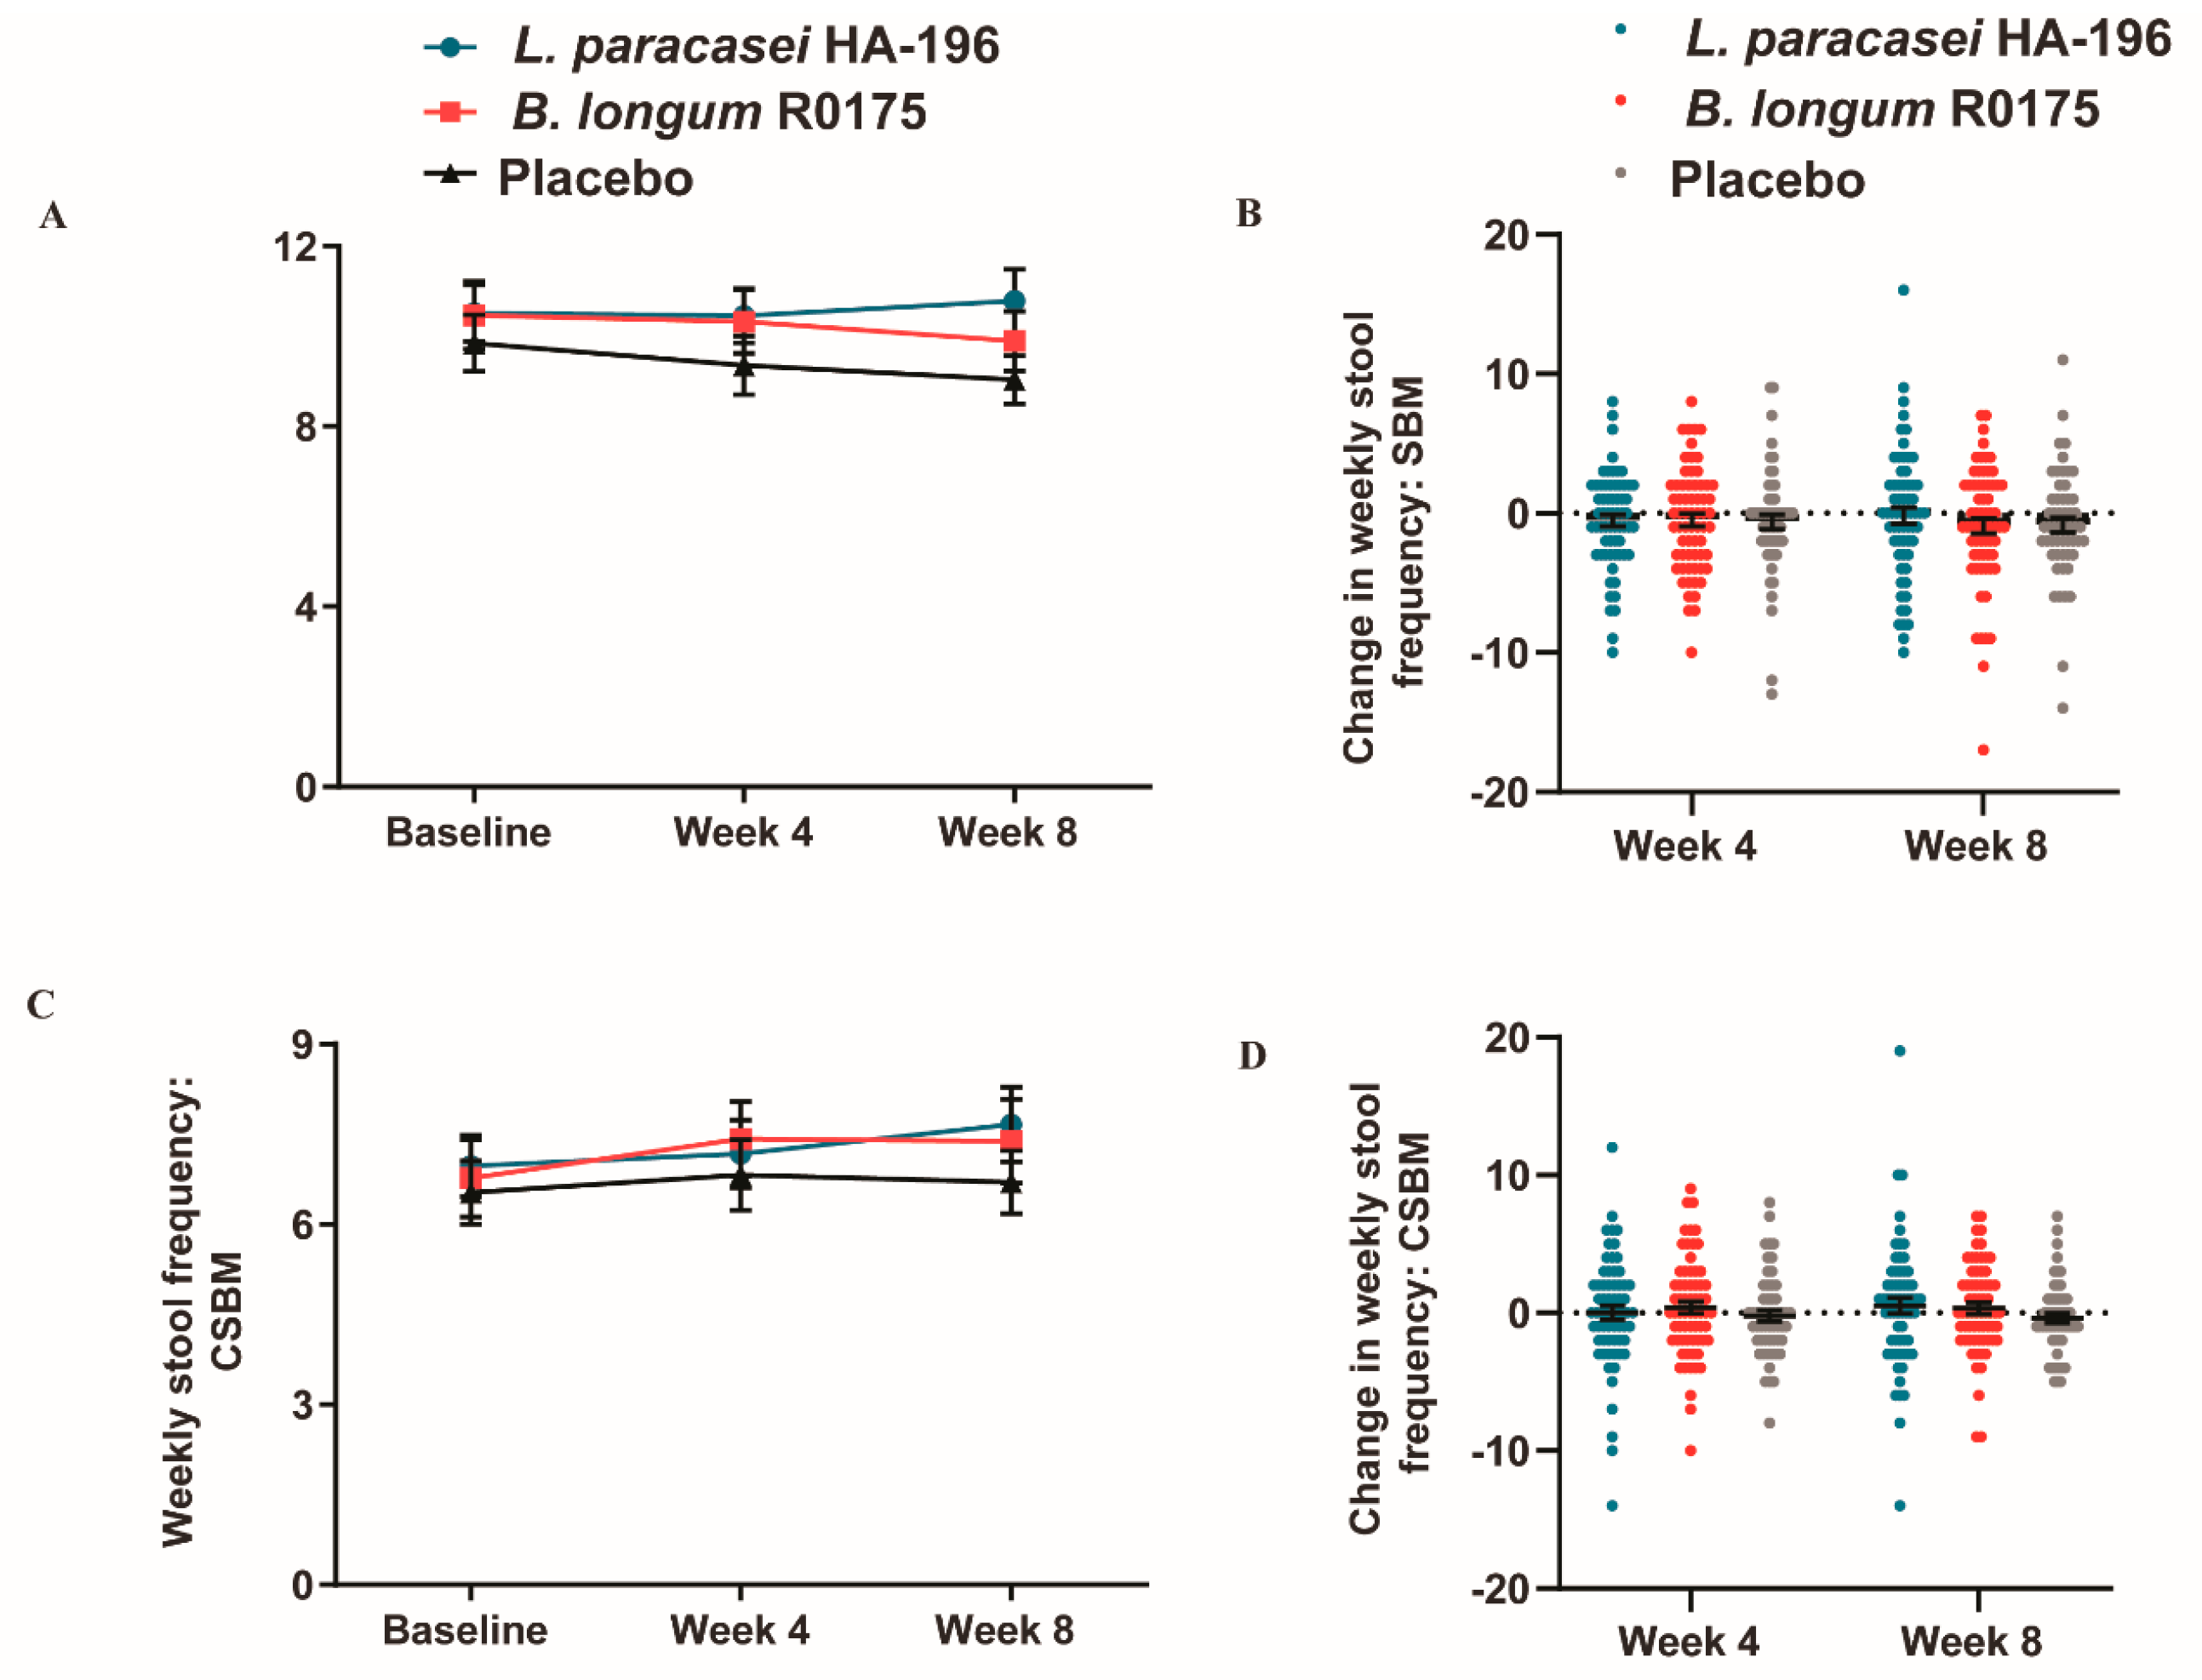
3.5. No Significant Changes in the Bowel Movement Frequency in Participants with IBS-M

In participants with IBS-M, L. paracasei or B. longum consumption did not result in any significant between or within group differences in SBM or CSBM. The L. paracasei group reported a 2.6% increase, whereas the B. longum and placebo groups reported 5.5% and 8.1% decreases, respectively, in SBM from baseline to week 8 (Figure 7A,B). At week 8, participants consuming L. paracasei and B. longum reported 9.9% and 9.0% increases in CSBM, respectively, while those on placebo reported a 2.6% decrease (Figure 7C,D). All groups reported decreases in stool consistency from baseline to week 4, however, the only significant decrease of 6.6% was reported by the placebo group (p = 0.025). There were, however, no significant between-group differences in stool consistency among the three groups (data not shown).

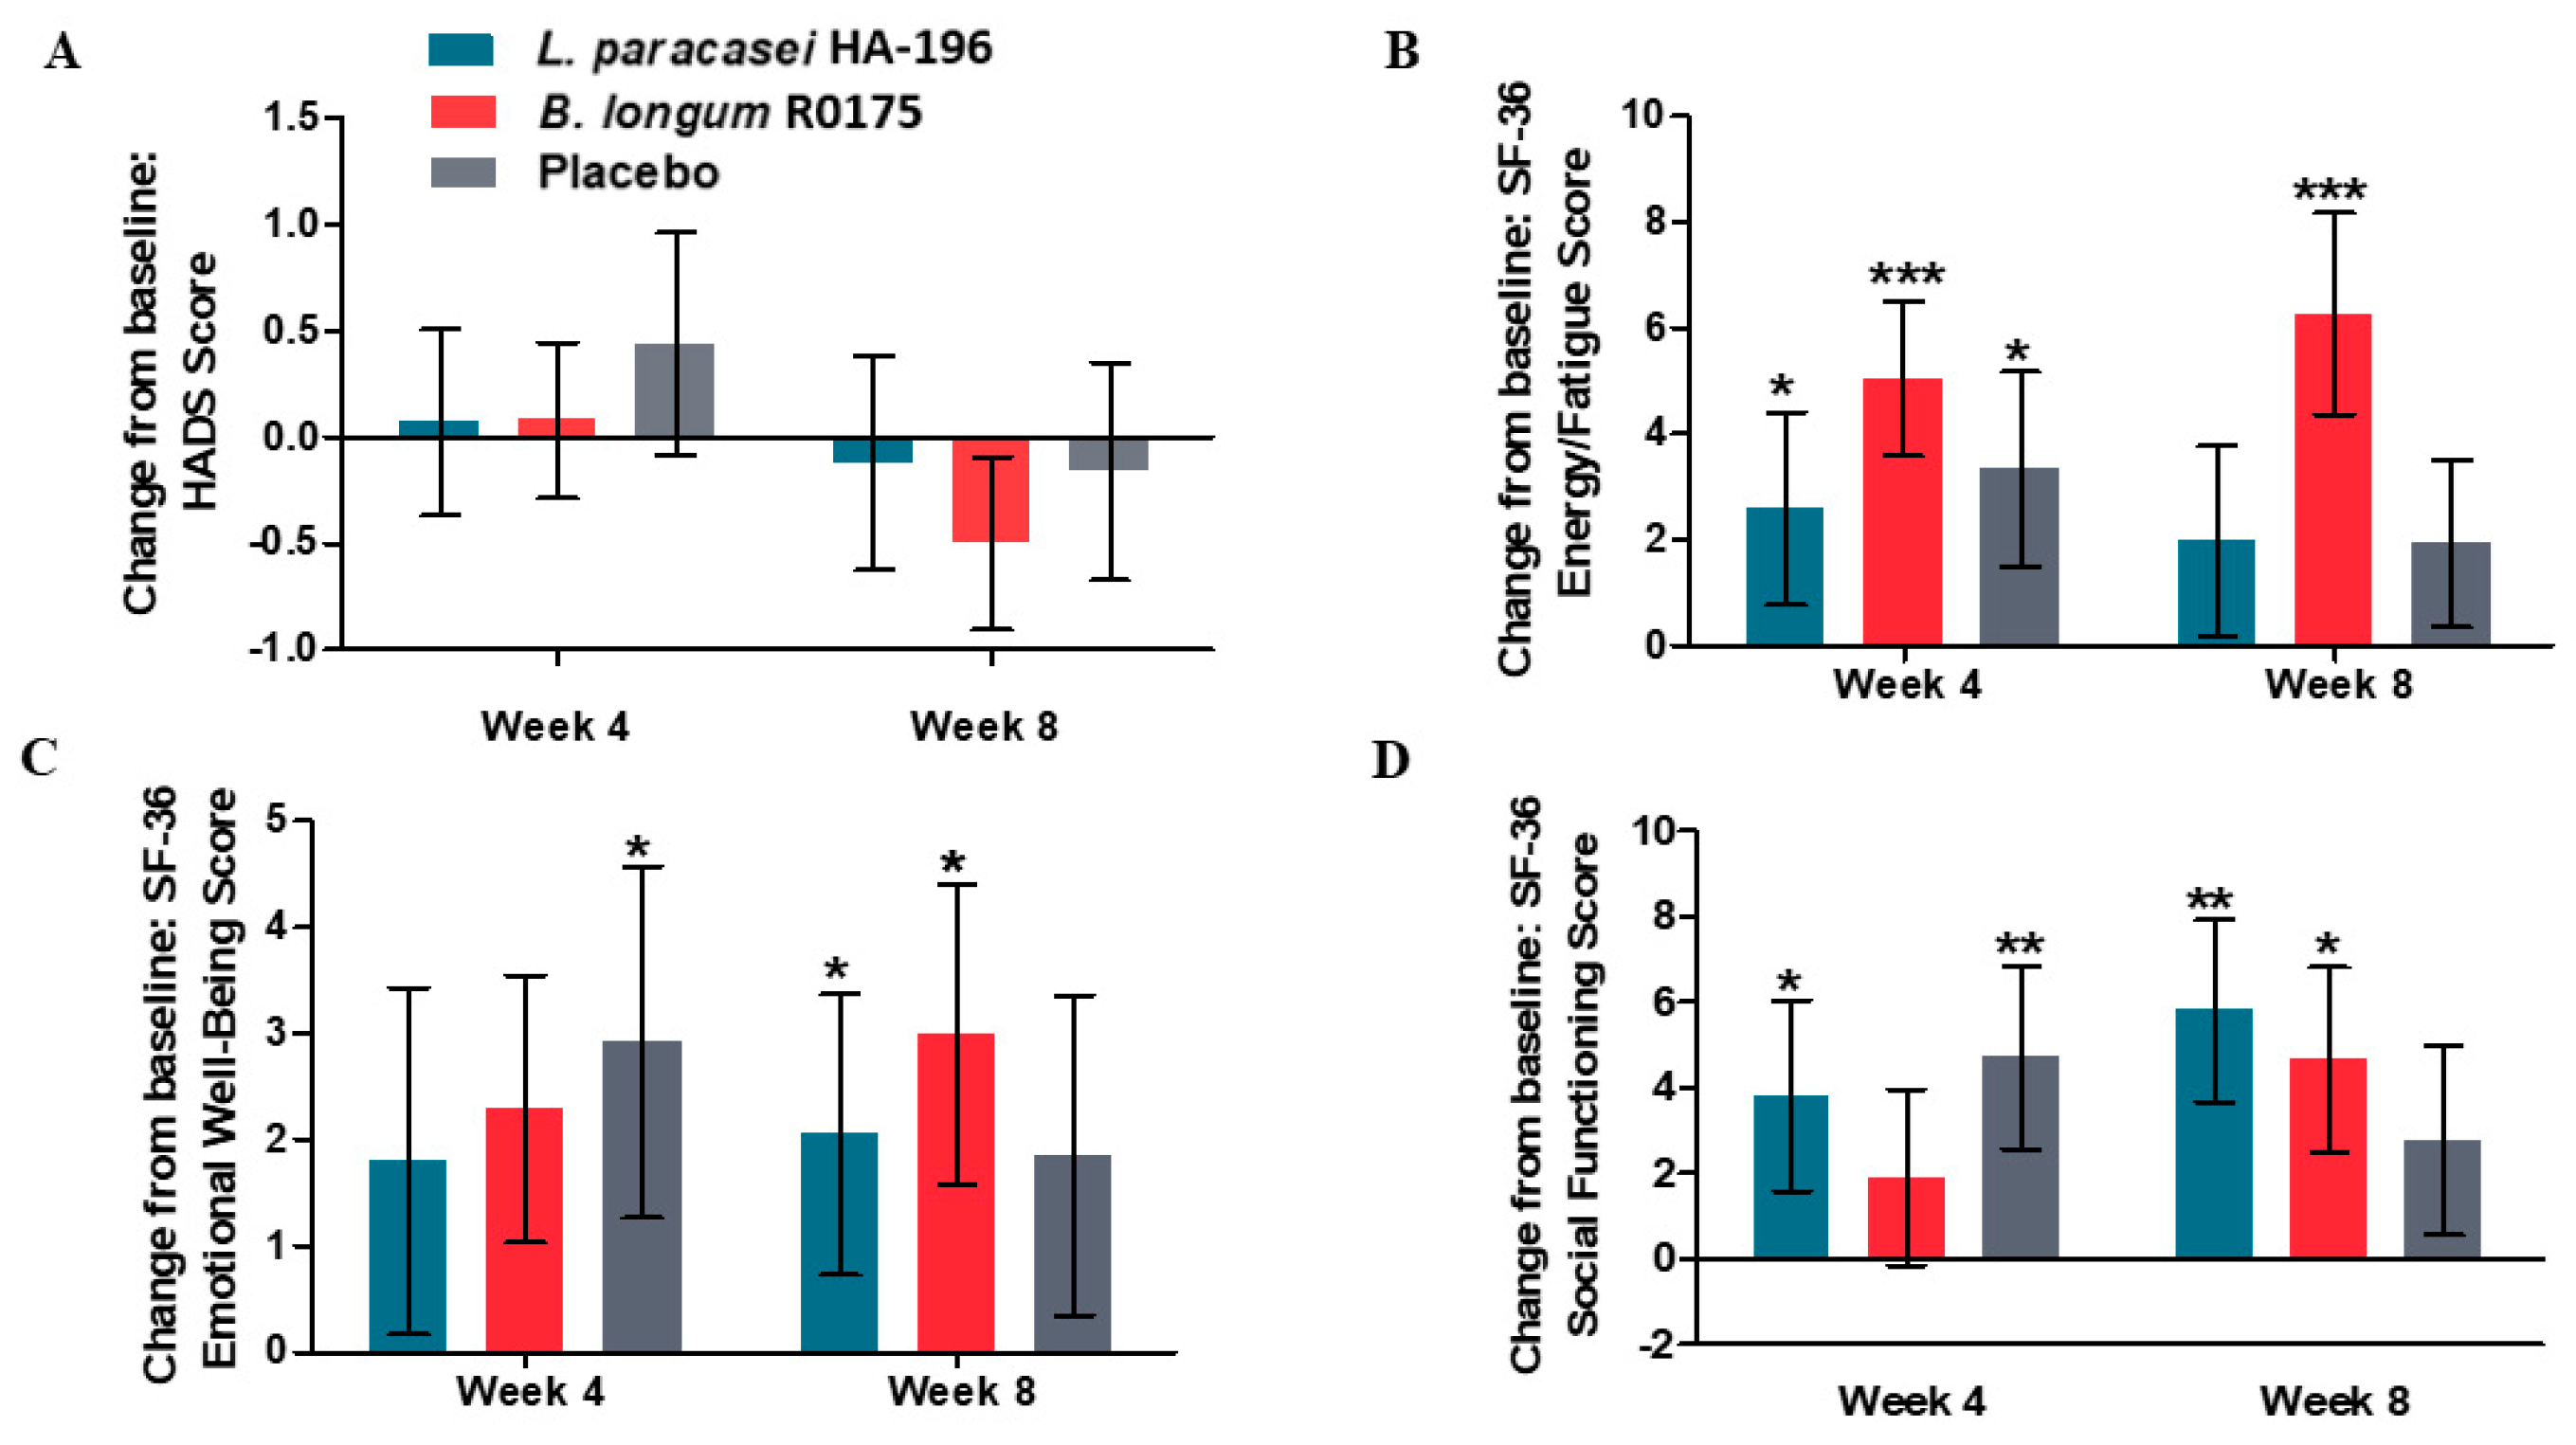
3.6. Improvements in Mental Health Measures in Participants Given Probiotics

There were no significant within group differences in HADS score, but participants receiving B. longum reported the greatest reduction (4%, p = 0.09) in HADS score after 8 weeks (Figure 8A). As assessed by the SF-36, participants supplemented with B. longum reported a significant increase of 12% (p < 0.001) and those in the L. paracasei group reported a non-significant 3.7% increase in energy from baseline to week 8 (Figure 8B). Evaluation of the emotional well-being parameter by SF-36 showed, significant 3% and 4% improvements in the L. paracasei and B. longum groups, respectively, from baseline to week 8 (all p < 0.05, Figure 8C). Participants receiving L. paracasei and B. longum reported significant 8% and 6% within-group increases in social functioning, respectively (all p < 0.05, Figure 8D). These within-group significant improvements in SF-36 parameters were not reported by participants given placebo. There were also no significant between-group differences among the three groups in the SF-36 parameters assessed.

3.7. L. paracasei and B. longum are Safe to Consume

A total of 89 adverse events (AEs) were reported by 72 participants in this study. All AEs, except two (ankle sprain and intestinal prolapse) were resolved by the end of the study and not related to the IPs. There we no significant differences between the probiotic groups and placebo group in number of participants reporting AEs. A single serious AE was reported (miscarriage), which was assessed as unrelated to IPs by the Investigator and self-resolved by the end of the study. All safety parameters were within clinically acceptable ranges and both probiotic products were considered safe.

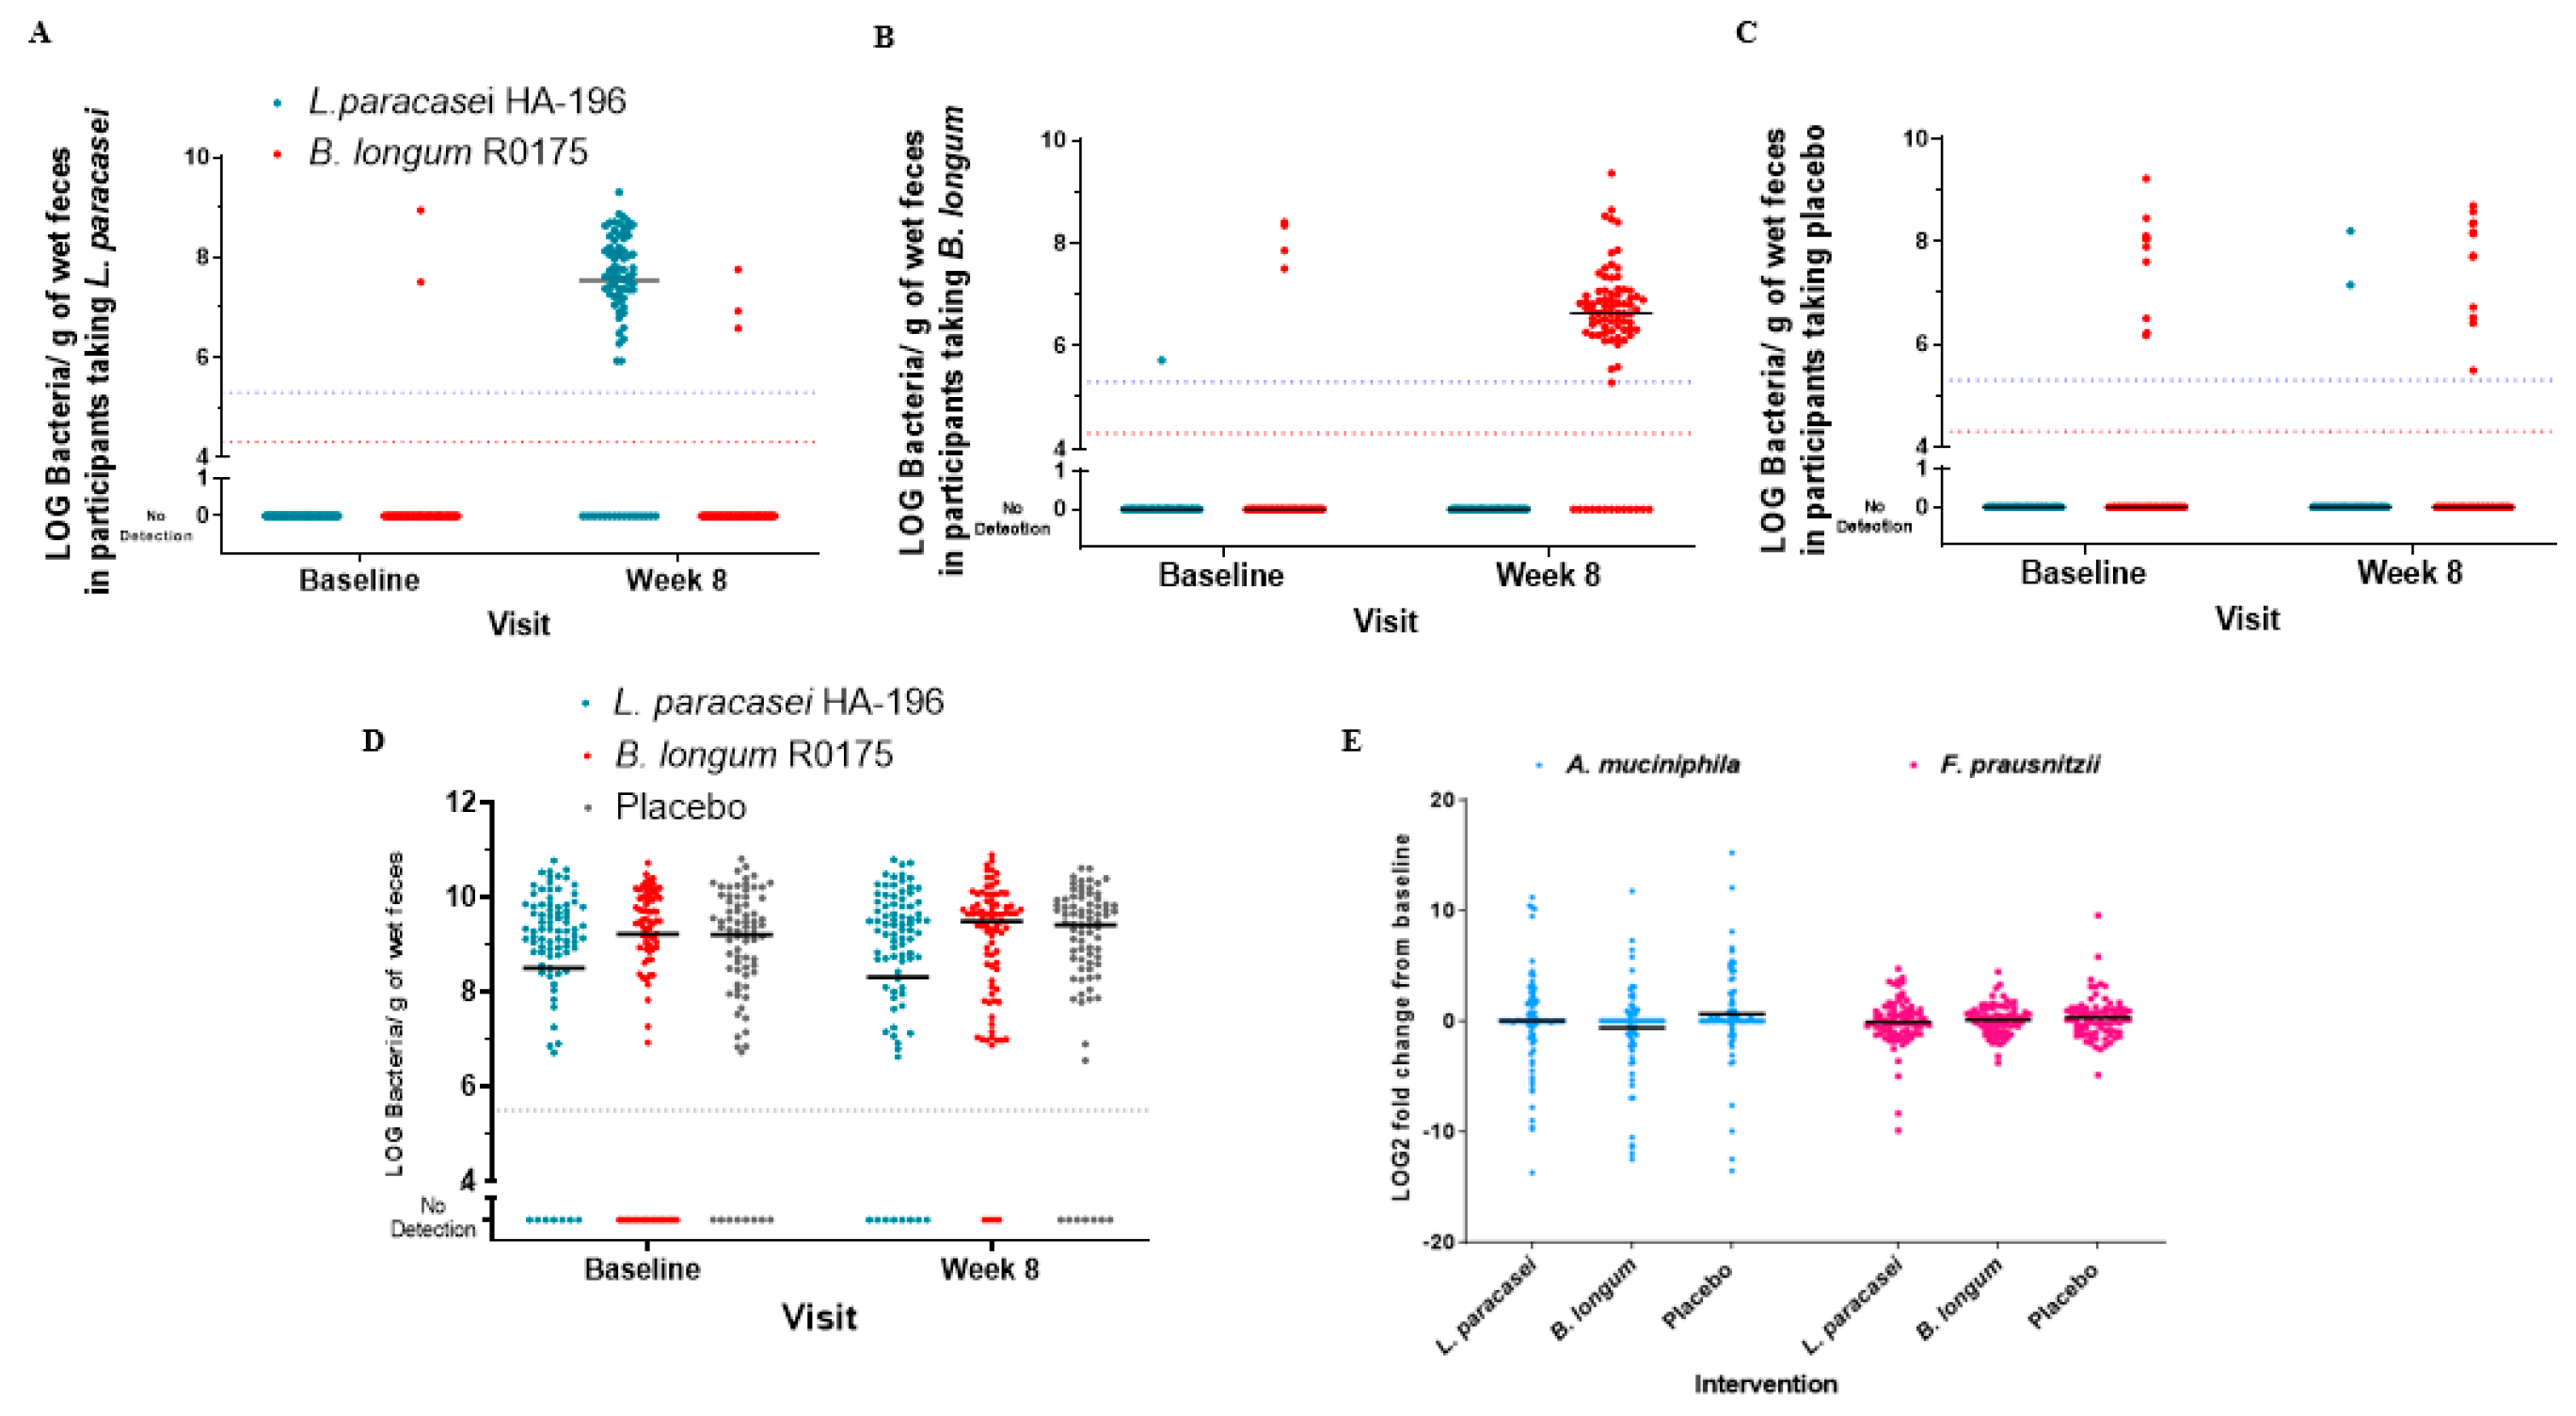
3.8. High Compliance and Increased Number of Participants with Bifidobacterium Species

In addition to assessing compliance based on counting capsules at each study visit, qPCR analysis was used to quantify probiotic strains in fecal samples and establish participant compliance. Compliance was found to be of 85% and 83% for participants receiving B. longum and L. paracasei, respectively. Probiotic strains were detected in their respective groups and in nine and eleven participants of the placebo group at baseline and the end of study, respectively (Figure 9A–C). We observed no significant changes in fecal Bifidobacterium species levels at baseline and at the end of study (median ~9 Log bacteria/g of wet feces). Notably, following B. longum administration, the number of participants without detection of Bifidobacterium species was only 4 participants at the end of the supplementation period (Figure 9D). There were no significant within group changes in relative quantification of A. muciniphila and F. prausnitzii in any of the study groups (Figure 9E). There were no differences in L. paracasei, B. longum or Bifidobacterium species levels in participants with IBS-C, -D or -M after supplementation (Supplementary Figure S1).

4. Discussion

In this randomized, double-blind, placebo-controlled study, both L. paracasei HA-196 and B. longum R0175 were found to be safe, and significantly improved participants’ experience of IBS-related symptoms after 8 weeks as reflected by reduced scores on the IBS-SSS. A similar decrease in symptom severity was also observed in the placebo group. The significant reduction in symptom severity was marked by a 30% decrease in L. paracasei and a 22% decrease in the B. longum groups compared to a 31% decrease in the placebo group. IBS-SSS is a widely used self-administered questionnaire that measures severity and frequency of abdominal pain, abdominal distension/tightness, bowel habit satisfaction, and quality of life. The total IBS-SSS score ranges from 0 to 500, with higher scores indicating more severe symptoms. A decrease in the IBS-SSS score indicates a reduction in symptom severity. When participants were grouped into IBS subtypes (IBS-C, IBS-D, IBS-M), a reduction in IBS-SSS was also observed in all three groups. However, L. paracasei supplemented IBS-C and IBS-D participants reported improvements in their bowel habits and stool consistency that were not observed in the placebo group.
In addition to IBS-SSS score, BM frequency was examined based on IBS subtype. At the end of the 8-week study, IBS-C participants in the L. paracasei group had significant improvements in both SBM and CSBM. Although not statistically significant, IBS-C participants in the placebo group reported fewer numbers of SBM and CSBM at the end of the study. For IBS-D participants, B. longum significantly reduced SBM compared to placebo from baseline to week 4, but this significant between-group difference was not sustained to the end of study. L. paracasei significantly improved the weekly frequency of SBM at week 8 in IBS-D participants compared to the placebo. Additionally, L. paracasei had a greater effect on reducing the number of CSBM in IBS-D participants than B. longum. As with IBS-C participants, the placebo did not alter bowel movement frequency with IBS-D. Although, not significantly different, L. paracasei supplemented IBS-M participants were the only group to report increases in SBM and CSBM after 8 weeks. IBS-M participants in the B. longum group did not report increases in SBM in participants, and those in the placebo had decreases in CSBM by the end of the study.
All participants with IBS who received L. paracasei reported improvements in stool consistency after 8 weeks, unlike IBS-C and IBS-M participants in the B. longum group as well as all participants given placebo. This shift in stool consistency in the L. paracasei groups was marked by a significant within-group reduction in stool consistency reported by IBS-D participants after 8 weeks. The monitoring of stool consistency and BM frequencies provide evidence of efficacy of the two probiotic strains, with L. paracasei being more efficacious in improving symptoms of IBS, particularly IBS-C and IBS-D.
An important aspect of this study was that of all IBS subtypes, the highest population of participants enrolled was those with IBS-M. IBS as a condition can be very transient in presentation of its type and intensity [27]. Participants in this study often changed their subtype between screening and baseline run-in. Furthermore, the recording of IBS intensity is highly subjective making clinical studies in this area challenging. Despite the challenges associated with studies in this area, this study suggests that both L. paracasei HA-196 and B. longum R0175 play a role in mitigating the effects of IBS in certain subtypes. These data would suggest that probiotic efficacy may be dependent on the IBS subtype. This warrants further investigation and studies focused on specific IBS symptoms within the IBS symptomatology continuum rather than considering all IBS patients as a homogenous population.
Psychological comorbidities are commonly observed in IBS patients, who are significantly more likely to develop mental health conditions such as depressive disorders, anxiety, and sleep disorders [28]. Considering this, probiotics consumption is viewed as a means to alleviate the psychological comorbidities of IBS [29]. However, similar to the efficacy of probiotics and the physical symptoms of IBS, there is heterogeneity among studies linking probiotics and modulation of behaviour in humans. A narrative review of seven systematic reviews of RCTs in individuals with depressive symptoms noted that five reviews reported a beneficial effect of probiotics on depressive symptoms. However, the authors stated that heterogeneity in the type of populations studied warranted further studies in clinically diagnosed depression before more definitive conclusions could be made [30]. More recently, a study on IBS participants with mild to moderate anxiety and/or depression reported that B. longum NCC3001 improved depression scores based on the HADS scale. A reduction of two or more points was reported in 64% of the participants in the probiotic group compared to 32% in the placebo group (p = 0.04) [31], although anxiety or IBS symptoms scores were not different compared to placebo. In the current study, we did not observe any significant improvements in the HADS score nor in general health assessment (based on the SF-36) among IBS participants compared to placebo. However, participants in the B. longum group reported having increased energy levels after 8 weeks, which can directly impact their willingness and ability to perform everyday tasks. Furthermore, participants in both B. longum and L. paracasei groups reported significant within-group improvements in social functioning after 8 weeks. In contrast, none of these improvements pertaining to mental health were found in participants receiving the placebo.
Ensuring compliance with the probiotic for the duration of the study is an essential component of examining efficacy. The ability to detect the probiotic strains in participant’s fecal samples can confirm the participant compliance calculated from the returned IP. Fecal samples from baseline and 8 weeks were analyzed by qPCR and revealed a high degree of compliance within the probiotic supplemented groups. In the placebo group, probiotic strain detection was not expected. However, a handful of participants in the placebo group did have detection, which may potentially be due to the participants harbouring similar sequences from the bacteria in their gut, which may occur naturally due to bacterial diversity.
The abundance of selected relevant bacteria, including A. muciniphila, F. prausnitzii and Bifidobacterium species was also investigated in fecal samples by qPCR. Compared to baseline, participants in all three treatment groups had no significant changes in the two species and one genus quantified, though more participants had detection of Bifidobacterium species in their fecal matter following 8-weeks of B. longum supplementation. The latter may have contributed to the BM improvement observed in the B. longum supplemented groups, as Bifidobacterium species have been shown to improve bowel habits in all IBS subtypes [32]. An increase in A. muciniphila has been associated with a decrease in abdominal pain in IBS patients, and F. prausnitzii has been shown to reduce visceral hypersensitivity in a non-inflammatory animal model of IBS [33,34]. Thus, it is possible that the unchanged relative abundance of A. muciniphila and F. prausnitzii following probiotic supplementation may have contributed to the absence of significant differences in the IBS-SSS score between the groups. It also suggests that the potential mechanism by which L. paracasei, exerted its impact on bowel habits and stool consistency may be independent of the specific bacterial species investigated.
A placebo effect of 33% was observed in this study, consistent with reports from previous IBS clinical trials. A review of RCTs evaluating complementary health products showed an overall placebo response of 43%, with higher placebo responses associated with longer treatment duration and greater number of clinic visits [35]. A meta-analysis reported that the placebo response ranges from 16% to 71% in participants with IBS, with a population-weighted average of 40% in studies using natural health products and pharmaceutical interventions [36]. The subjective nature of the assessments and the intrinsic nature of IBS patients who display high levels of suggestibility and a strong placebo effect may have contributed to the placebo effect seen in this study. Additionally, this placebo effect may partially explain why some outcomes assessed were significant at either week 4 or 8. The placebo effect in studies within this area of research also exemplifies the importance of a run-in period, which was included in this study. However, examining bowel habits for a longer period prior to intervening may be an important aspect of understanding probiotic efficacy while mitigating the placebo effect.
Other limitations of this study include the relatively small sample size of the population, more specifically when considering the IBS subtypes, which may have introduced variability in the responses and reduced effect sizes. Moreover, the severity of IBS symptoms using IBS-SSS was only captured at baseline, week 4, and week 8 and not at any of the intermediate weeks. A characteristic feature of IBS is that some weeks were worse than the others, and due to the lack of data from intermediate weeks, temporary improvements experienced by participants associated with probiotic supplementation may have been missed. Furthermore, the duration of IBS in participants prior to enrollment into the study was not accounted for, which may have influenced the outcomes measured. Additionally, participants in this study were diagnosed and classified by IBS subtype according to Rome III, which has now been updated to Rome IV [37]. A recent study has shown differences in the diagnosis and classification of participants with IBS based on Rome III or Rome IV [38].Of note, at the time of classification based on the Rome III questionnaire, no participants in this study were classified as the IBS-unclassified (IBS-U) subtype.
Low grade inflammation has been suggested to play a role in the pathogenesis of IBS. Abnormal mast cell activation in the gut has been associated with the development of IBS symptoms [39]. Although beyond the scope of this study, it would be important to evaluate the anti-inflammatory effect of L. paracasei or B. longum in IBS patients. Overall, the results of the current study suggest a clinically relevant role for L. paracasei or B. longum as probiotics to reduce symptoms in IBS. Furthermore, they may add to the armamentarium of IBS management tools without the safety concerns that may accompany pharmaceuticals. The effects of each probiotic strain may be dependent on the IBS subtype, and future studies should target IBS-D and IBS-M for probiotic therapy.

Supplementary Materials

The following are available online at https://0-www-mdpi-com.brum.beds.ac.uk/2072-6643/12/4/1159/s1, Table S1: CONSORT 2010 checklist of information to include when reporting a randomised trial. Table S2: Number of rescue medication pills taken by participants with IBS-C, -D or -M during the 8-week intervention period. Figure S1: L. paracasei, B. longum or Bifidobacterium species levels in participants with IBS-C, -D or -M after supplementation.

Author Contributions

Conceptualization, T.A.T. and M.E.; methodology, T.A.T., M.E., A.P., D.C.C.; validation, M.E., J.M.A.; formal analysis, M.E., J.M.A.; investigation, D.C.C.; data curation, D.C.C.; manuscript—writing original draft, E.D.L., M.E.; Manuscript—review and editing, A.P., R.B. E.D.L., J.M.A., M.E.; visualization, E.D.L., R.B.; supervision, M.E., D.C.C.; funding acquisition, T.A.T., R.B., A.P. All authors have read and agreed to the published version of the manuscript.

Funding

This research was funded by Lallemand Health Solutions (LHS).

Acknowledgments

We would like to thank Mitchell Hendry, Jeremie Auger, and Justin Knapp, Sharif Shajib and Annie Tremblay for their valued discussions in the preparation of this manuscript. We also thank Jeremie Auger for data analysis.

Conflicts of Interest

LHS owns Bifidobacterium longum R0175 and Lactobacillus paracasei HA-196. TAT, RB and AP are employees of Lallemand Health Solutions. LHS was involved in the design of the study, revising the manuscript and decision to publish the results but was not involved in data collection and analyses, or writing the manuscript. The corresponding author oversaw collection and analysis of data and had final responsibility for the decision to submit for publication.

References

  1. Card, T.; Canavan, C.; West, J. The epidemiology of irritable bowel syndrome. Clin. Epidemiol. 2014, 6, 71. [Google Scholar] [CrossRef] [PubMed] [Green Version]
  2. Sultan, S.; Malhotra, A. Irritable Bowel Syndrome. Ann. Intern. Med. 2017, 166, Itc81–Itc96. [Google Scholar] [CrossRef] [PubMed]
  3. Occhipinti, K.; Smith, J. Irritable Bowel Syndrome: A Review and Update. Clin. Colon Rectal Surg. 2012, 25, 46–52. [Google Scholar] [CrossRef] [Green Version]
  4. Lewis, J.H. The risk of ischaemic colitis in irritable bowel syndrome patients treated with serotonergic therapies. Drug Saf. 2011, 34, 545–565. [Google Scholar] [CrossRef]
  5. Munjal, A.; Dedania, B.; Cash, B. Update on Pharmacotherapy for Irritable Bowel Syndrome. Curr. Gastroenterol. Rep. 2019, 21, 25. [Google Scholar] [CrossRef] [PubMed]
  6. Tap, J.; Derrien, M.; Törnblom, H.; Brazeilles, R.; Cools-Portier, S.; Doré, J.; Störsrud, S.; Le Nevé, B.; Öhman, L.; Simrén, M. Identification of an Intestinal Microbiota Signature Associated With Severity of Irritable Bowel Syndrome. Gastroenterology 2017, 152, 111–123.e8. [Google Scholar] [CrossRef] [Green Version]
  7. Lee, B.J.; Bak, Y.-T. Irritable Bowel Syndrome, Gut Microbiota and Probiotics. J. Neurogastroenterol. Motil. 2011, 17, 252–266. [Google Scholar] [CrossRef] [Green Version]
  8. Kerckhoffs, A.P.; Samsom, M.; van der Rest, M.E.; de Vogel, J.; Knol, J.; Ben-Amor, K.; Akkermans, L.M. Lower Bifidobacteria counts in both duodenal mucosa-associated and fecal microbiota in irritable bowel syndrome patients. World J. Gastroenterol. 2009, 15, 2887–2892. [Google Scholar] [CrossRef]
  9. Sinn, D.H.; Song, J.H.; Kim, H.J.; Lee, J.H.; Son, H.J.; Chang, D.K.; Kim, Y.H.; Kim, J.J.; Rhee, J.C.; Rhee, P.L. Therapeutic effect of Lactobacillus acidophilus-SDC 2012, 2013 in patients with irritable bowel syndrome. Dig. Dis. Sci. 2008, 53, 2714–2718. [Google Scholar] [CrossRef]
  10. Ouwehand, A.C.; Invernici, M.M.; Furlaneto, F.A.C.; Messora, M.R. Effectiveness of Multi-strain Versus Single-strain Probiotics: Current Status and Recommendations for the Future. J. Clin. Gastroenterol. 2018, 52, S35–S40. [Google Scholar] [CrossRef]
  11. Barbara, G.; Cremon, C.; Azpiroz, F. Probiotics in irritable bowel syndrome: Where are we? Neurogastroenterol. Motil. 2018, 30, e13513. [Google Scholar] [CrossRef]
  12. Fanigliulo, L.; Comparato, G.; Aragona, G.; Cavallaro, L.; Iori, V.; Maino, M.; Cavestro, G.M.; Soliani, P.; Sianesi, M.; Franze, A.; et al. Role of gut microflora and probiotic effects in the irritable bowel syndrome. Acta Biomed. 2006, 77, 85–89. [Google Scholar]
  13. Lombardo, L.; Vernetto, A.; Blanco, I. Clinical evaluation of Lactobacillus paracasei subsp. paracasei F19 with gluco-oligosaccharides in the short-term treatment of irritable bowel syndrome. Microb. Ecol. Health Dis. 2009, 21, 28–32. [Google Scholar] [CrossRef] [Green Version]
  14. McFarland, L.V.; Evans, C.T.; Goldstein, E.J.C. Strain-Specificity and Disease-Specificity of Probiotic Efficacy: A Systematic Review and Meta-Analysis. Front. Med. (Lausanne) 2018, 5, 124. [Google Scholar] [CrossRef] [PubMed]
  15. Messaoudi, M.; Lalonde, R.; Violle, N.; Javelot, H.; Desor, D.; Nejdi, A.; Bisson, J.-F.; Rougeot, C.; Pichelin, M.; Cazaubiel, M.; et al. Assessment of psychotropic-like properties of a probiotic formulation (Lactobacillus helveticus R0052 and Bifidobacterium longum R0175) in rats and human subjects. Br. J. Nutr. 2011, 105, 755–764. [Google Scholar] [CrossRef] [PubMed] [Green Version]
  16. Kazemi, A.; Noorbala, A.A.; Azam, K.; Eskandari, M.H.; Djafarian, K. Effect of probiotic and prebiotic vs placebo on psychological outcomes in patients with major depressive disorder: A randomized clinical trial. Clin. Nutr. 2019, 522–528. [Google Scholar] [CrossRef] [PubMed]
  17. Moher, D.; Hopewell, S.; Schulz, K.F.; Montori, V.; Gotzsche, P.C.; Devereaux, P.J.; Elbourne, D.; Egger, M.; Altman, D.G. CONSORT 2010 explanation and elaboration: Updated guidelines for reporting parallel group randomised trials. Int. J. Surg. 2012, 10, 28–55. [Google Scholar] [CrossRef] [PubMed] [Green Version]
  18. Blake, M.R.; Raker, J.M.; Whelan, K. Validity and reliability of the Bristol Stool Form Scale in healthy adults and patients with diarrhoea-predominant irritable bowel syndrome. Aliment. Pharm. Ther. 2016, 44, 693–703. [Google Scholar] [CrossRef] [Green Version]
  19. Longstreth, G.F.; Thompson, W.G.; Chey, W.D.; Houghton, L.A.; Mearin, F.; Spiller, R.C. Functional bowel disorders. Gastroenterology 2006, 130, 1480–1491. [Google Scholar] [CrossRef]
  20. Brazier, J.E.; Harper, R.; Jones, N.M.; O’Cathain, A.; Thomas, K.J.; Usherwood, T.; Westlake, L. Validating the SF-36 health survey questionnaire: New outcome measure for primary care. BMJ 1992, 305, 160–164. [Google Scholar] [CrossRef] [Green Version]
  21. Williams, V.S.; Nelson, L.M.; Fehnel, S.E.; MacDougall, J.; Carson, R.T.; Tourkodimitris, S.; Kurtz, C.; Baird, M.J.; Johnston, J.M. Psychometric validation of symptom severity measures in irritable bowel syndrome with constipation. Aliment. Pharm. Ther. 2014, 40, 298–308. [Google Scholar] [CrossRef] [PubMed] [Green Version]
  22. Derrien, M.; Collado, M.C.; Ben-Amor, K.; Salminen, S.; de Vos, W.M. The Mucin degrader Akkermansia muciniphila is an abundant resident of the human intestinal tract. Appl. Environ. Microbiol. 2008, 74, 1646–1648. [Google Scholar] [CrossRef] [Green Version]
  23. Lopez-Siles, M.; Martinez-Medina, M.; Busquets, D.; Sabat-Mir, M.; Duncan, S.H.; Flint, H.J.; Aldeguer, X.; Garcia-Gil, L.J. Mucosa-associated Faecalibacterium prausnitzii and Escherichia coli co-abundance can distinguish Irritable Bowel Syndrome and Inflammatory Bowel Disease phenotypes. Int. J. Med. Microbiol. 2014, 304, 464–475. [Google Scholar] [CrossRef] [PubMed] [Green Version]
  24. Hartman, A.L.; Lough, D.M.; Barupal, D.K.; Fiehn, O.; Fishbein, T.; Zasloff, M.; Eisen, J.A. Human gut microbiome adopts an alternative state following small bowel transplantation. Proc. Natl. Acad. Sci. USA 2009, 106, 17187–17192. [Google Scholar] [CrossRef] [Green Version]
  25. Dapoigny, M.; Piche, T.; Ducrotte, P.; Lunaud, B.; Cardot, J.M.; Bernalier-Donadille, A. Efficacy and safety profile of LCR35 complete freeze-dried culture in irritable bowel syndrome: A randomized, double-blind study. World J. Gastroenterol. 2012, 18, 2067–2075. [Google Scholar] [CrossRef] [PubMed]
  26. Williams, E.A.; Stimpson, J.; Wang, D.; Plummer, S.; Garaiova, I.; Barker, M.E.; Corfe, B.M. Clinical trial: A multistrain probiotic preparation significantly reduces symptoms of irritable bowel syndrome in a double-blind placebo-controlled study. Aliment. Pharm. Ther. 2009, 29, 97–103. [Google Scholar] [CrossRef] [PubMed]
  27. Saha, L. Irritable bowel syndrome: Pathogenesis, diagnosis, treatment, and evidence-based medicine. World J. Gastroenterol. 2014, 20, 6759–6773. [Google Scholar] [CrossRef]
  28. Lee, Y.T.; Hu, L.Y.; Shen, C.C.; Huang, M.W.; Tsai, S.J.; Yang, A.C.; Hu, C.K.; Perng, C.L.; Huang, Y.S.; Hung, J.H. Risk of Psychiatric Disorders following Irritable Bowel Syndrome: A Nationwide Population-Based Cohort Study. PLoS ONE 2015, 10, e0133283. [Google Scholar] [CrossRef] [Green Version]
  29. Bastiaanssen, T.F.S.; Cowan, C.S.M.; Claesson, M.J.; Dinan, T.G.; Cryan, J.F. Making Sense of … the Microbiome in Psychiatry. Int. J. Neuropsychopharmacol. 2019, 22, 37–52. [Google Scholar] [CrossRef]
  30. Nadeem, I.; Rahman, M.Z.; Ad-Dab’bagh, Y.; Akhtar, M. Effect of probiotic interventions on depressive symptoms: A narrative review evaluating systematic reviews. Psychiatry Clin. Neurosci. 2019, 73, 154–162. [Google Scholar] [CrossRef]
  31. Pinto-Sanchez, M.I.; Hall, G.B.; Ghajar, K.; Nardelli, A.; Bolino, C.; Lau, J.T.; Martin, F.P.; Cominetti, O.; Welsh, C.; Rieder, A.; et al. Probiotic Bifidobacterium longum NCC3001 Reduces Depression Scores and Alters Brain Activity: A Pilot Study in Patients With Irritable Bowel Syndrome. Gastroenterology 2017, 153, 448–459.e8. [Google Scholar] [CrossRef] [PubMed]
  32. Aragon, G.; Graham, D.B.; Borum, M.; Doman, D.B. Probiotic therapy for irritable bowel syndrome. Gastroenterol. Hepatol. (N Y) 2010, 6, 39–44. [Google Scholar]
  33. Cruz-Aguliar, R.M.; Wantia, N.; Clavel, T.; Vehreschild, M.; Buch, T.; Bajbouj, M.; Haller, D.; Busch, D.; Schmid, R.M.; Stein-Thoeringer, C.K. An Open-Labeled Study on Fecal Microbiota Transfer in Irritable Bowel Syndrome Patients Reveals Improvement in Abdominal Pain Associated with the Relative Abundance of Akkermansia Muciniphila. Digestion 2019, 100, 127–138. [Google Scholar] [CrossRef] [PubMed]
  34. Miquel, S.; Martin, R.; Lashermes, A.; Gillet, M.; Meleine, M.; Gelot, A.; Eschalier, A.; Ardid, D.; Bermudez-Humaran, L.G.; Sokol, H.; et al. Anti-nociceptive effect of Faecalibacterium prausnitzii in non-inflammatory IBS-like models. Sci. Rep. 2016, 6, 19399. [Google Scholar] [CrossRef] [Green Version]
  35. Dorn, S.D.; Kaptchuk, T.J.; Park, J.B.; Nguyen, L.T.; Canenguez, K.; Nam, B.H.; Woods, K.B.; Conboy, L.A.; Stason, W.B.; Lembo, A.J. A meta-analysis of the placebo response in complementary and alternative medicine trials of irritable bowel syndrome. Neurogastroenterol. Motil. Off. J. Eur. Gastrointest. Motil. Soc. 2007, 19, 630–637. [Google Scholar] [CrossRef] [PubMed]
  36. Patel, S.M.; Stason, W.B.; Legedza, A.; Ock, S.M.; Kaptchuk, T.J.; Conboy, L.; Canenguez, K.; Park, J.K.; Kelly, E.; Jacobson, E.; et al. The placebo effect in irritable bowel syndrome trials: A meta-analysis. Neurogastroenterol. Motil. 2005, 17, 332–340. [Google Scholar] [CrossRef]
  37. Drossman, D.A. Functional Gastrointestinal Disorders: History, Pathophysiology, Clinical Features, and Rome IV. Gastroenterology 2016, 150, 1262–1279. [Google Scholar] [CrossRef] [Green Version]
  38. Black, C.J.; Yiannakou, Y.; Houghton, L.A.; Ford, A.C. Epidemiological, Clinical, and Psychological Characteristics of Individuals with Self-reported Irritable Bowel Syndrome Based on the Rome IV vs Rome III Criteria. Clin. Gastroenterol. Hepatol. 2020, 18, 392–398. [Google Scholar] [CrossRef]
  39. Zhang, L.; Song, J.; Hou, X. Mast Cells and Irritable Bowel Syndrome: From the Bench to the Bedside. J. Neurogastroenterol. Motil. 2016, 22, 181–192. [Google Scholar] [CrossRef] [Green Version]
Figure 1. Schematic representation of the study design. This 10-week study consisted of 2 periods: a 2-week run-in and an 8-week supplementation period with one of two probiotics, Lactobacillus paracasei (L. paracasei) HA-196 or Bifidobacterium longum (B. longum) R0175 or a placebo (days 1–56).
Nutrients 12 01159 g001
Figure 2. Participant disposition throughout the study. At the end of the study, 251 participants were included in the per protocol population. ITT, intent-to-treat; PP, per protocol.
Nutrients 12 01159 g002
Figure 3. Effect of Lactobacillus paracasei HA-196 and Bifidobacterium longum R0175 on the IBS symptom severity score. (A) Mean Total IBS-SSS at baseline, week 4 and week 8; and (B) Mean change in IBS-SSS from baseline to week 4 and week 8 for participants in the PP population. L. paracasei group n = 84, B. longum group n = 86, placebo group n = 81; data represented as mean ± SD; *** p < 0.001; IBS-SSS, irritable bowel syndrome symptom severity scale. L. paracasei, Lactobacillus paracasei HA-196; B. longum, Bifidobacterium longum R0175.
Nutrients 12 01159 g003
Figure 4. Effect of Lactobacillus paracasei HA-196 and Bifidobacterium longum R0175 on the use of rescue medication (bisacodyl 5 mg tablets) in participants with IBS compared to placebo. L. paracasei group n = 84, B. longum group n = 86, placebo group n = 81; data represented as mean ± SD; * p < 0.05. L. paracasei, Lactobacillus paracasei HA-196; B. longum, Bifidobacterium longum R0175.
Nutrients 12 01159 g004
Figure 5. Effect of Lactobacillus paracasei HA-196 and Bifidobacterium longum R0175 on frequency of bowel movements in participants with IBS-C. (A) Weekly SBM at baseline, week 4 and week 8, (B) Change in total SBM from baseline to week 4 and week, (C) Total CSBM at baseline, week 4 and week 8, and (D) Change in weekly CSBM from baseline to week 4 and week 8. L. paracasei group n = 9, B. longum group n = 5, placebo group n = 13; data represented as mean ± SD; * p < 0.05, ** p < 0.01; SBM; spontaneous bowel movement; CSBM, complete spontaneous bowel movement; L. paracasei, Lactobacillus paracasei HA-196; B. longum, Bifidobacterium longum R0175.
Nutrients 12 01159 g005
Figure 6. Effect of Lactobacillus paracasei HA-196 and Bifidobacterium longum R0175 on frequency of bowel movements in participants with IBS-D. (A) Weekly SBM at baseline, week 4 and week 8, (B) Change in total SBM from baseline to week 4 and week 8, (C) Total CSBM at baseline, week 4 and week 8, and (D) Change in weekly CSBM from baseline to week 4 and week 8. L. paracasei group n = 10, B. longum group n = 15, placebo group n = 12; data represented as mean ± SD; * p < 0.05, ** p < 0.01; SBM; spontaneous bowel movement; CSBM, complete spontaneous bowel movement; L. paracasei, Lactobacillus paracasei HA-196; B. longum, Bifidobacterium longum R0175.
Nutrients 12 01159 g006
Figure 7. Effect of Lactobacillus paracasei HA-196 and Bifidobacterium longum R0175 on frequency of bowel movements in participants with IBS-M. (A) Weekly SBM at baseline, week 4 and week 8, (B) Change in total SBM from baseline to week 4 and week 8, (C) Total CSBM at baseline, week 4 and week 8, and (D) Change in weekly CSBM from baseline to week 4 and week 8. L. paracasei group n = 64, B. longum group n = 66, placebo group n = 55; data represented as mean ± SD; * p < 0.05, ** p < 0.01; SBM; spontaneous bowel movement; CSBM, complete spontaneous bowel movement; L. paracasei, Lactobacillus paracasei HA-196; B. longum, Bifidobacterium longum R0175.
Nutrients 12 01159 g007
Figure 8. Effect of Lactobacillus paracasei HA-196 and Bifidobacterium longum R0175 on psychological symptoms in participants with IBS from baseline to week 4 and week 8 (A) Mean change from baseline in HADS score, (B) Mean change from baseline in SF-36 energy levels, (C) Mean change from baseline in SF-36 emotional well-being, and (D) Mean change from baseline in SF-36 social functioning. L. paracasei group n = 84, B. longum group n = 86, placebo group n = 81; data represented as mean ± SD; * p < 0.05, ** p < 0.01, *** p < 0.001; HADS, Hospital Anxiety and Depression Scale; SF, Short Form; L. paracasei, Lactobacillus paracasei HA-196; B. longum, Bifidobacterium longum R0175.
Nutrients 12 01159 g008
Figure 9. Effect of Lactobacillus paracasei HA-196 and Bifidobacterium longum R0175 on fecal microbial composition in participants with IBS. qPCR analysis of absolute quantification of B. longum (red dots) and L. paracasei (blue dots) in participants receiving (A) L. paracasei (B) B. longum, or (C) placebo; (D) Absolute quantification of Bifidobacterium species at baseline and 8 weeks with limit of quantification for each species represented by corresponding coloured dotted line; (E) relative quantification of Akkermansia muciniphila and Faecalibacterium prausnitzii in the three groups. A. muciniphila, Akkermansia muciniphila; F. prausnitzii, Faecalibacterium prausnitzii; B. longum, Bifidobacterium longum; L. paracasei, Lactobacillus paracasei.
Nutrients 12 01159 g009
Table 1. Demographic characteristics for all participants in the per protocol (PP) population and their IBS-subtypes.
ParameterL. paracasei HA-196 (n)B. longum R0175 (n)Placebo (n)
Age (years)
Mean+/−SD42.42 ± 12.30 (84)42.31 ± 16.88 (86)41.84 ± 16.14 (81)
Median (Min–Max)43.00 (21.00–72.00)41.00 (19.00–87.00)40.00 (18.00–75.00)
p-value *0.95730.9706
Gender [n (%)]
Female67 (79.8%)64 (74.4%)64 (79.0%)
Male17 (20.2%)22 (25.6%)17 (21.0%)
p-value *1.00000.5836
Ethnicity [n (%)]
Hispanic or Latino7 (8.3%)5 (5.8%)1 (1.2%)
Not Hispanic or Latino77 (91.7%)81 (94.2%)80 (98.8%)
p-value *0.06410.2115
Race [n (%)]
Black or African American 2 (2.3%)2 (2.5%)
Central American1 (1.2%)1 (1.2%)
East Asian 2 (2.5%)
Eastern European White10 (11.9%)9 (10.5%)8 (9.9%)
Middle Eastern8 (9.5%)2 (2.3%)3 (3.7%)
North American Indian 1 (1.2%)1 (1.2%)
South American5 (6.0%)3 (3.5%)1 (1.2%)
South Asian 2 (2.3%)1 (1.2%)
South East Asian1 (1.2%) 1 (1.2%)
Western European White59 (70.2%)66 (76.7%)62 (76.5%)
p-value *0.14630.8926
Type of IBS: ROME III [n (%)]
IBS-C10 (11.9%)5 (5.8%)13 (16.0%)
IBS-D10 (11.9%)15 (17.4%)13 (16.0%)
IBS-M64 (76.2%)66 (76.7%)55 (67.9%)
p-value *0.54340.1041
IBS, irritable bowel syndrome; IBS-C, constipation-predominant IBS, IBS-D, diarrhea-predominant IBS; IBS-M, mixed bowel habits IBS; n, number; SD, standard deviation; Min, minimum; Max, maximum; * Continuous variables: p-values for comparison of each probiotic strain to placebo generated by ANOVA with Group as a fixed effect and subject as a random effect. Dunnett’s method was used to adjust for multiple comparisons; * Categorical variables: p-values for comparison of each probiotic strain to placebo generated by Fisher’s Exact (2-tail) test.
Table 2. Irritable Bowel Syndrome Symptom Severity Scale (IBS-SSS) score at baseline, week 4, and week 8 and change in IBS-SSS from baseline to week 4, and week 8 for participants in the PP population.
IBS-SSS
Study DayStatisticL. paracasei HA-196B. longum R0175Placebo
Baseline (Day 0)Mean ± SD (n)246.94 ± 75.53 (84)238.13 ± 76.59 (83)238.96 ± 64.55 (81)
p-value *0.70110.9960
Week 4Mean ± SD (n)198.22 ± 69.07 (82)189.57 ± 82.55 (83)199.39 ± 72.13 (77)
Week 8Mean ± SD (n)172.23 ± 80.90 (84)185.71 ± 77.74 (84)164.56 ± 73.25 (81)
Change from Baseline to Week 4Mean ± SD (n)−50.20 ± 64.42 (82)−50.78 ± 72.12 (82)−42.32 ± 66.93 (77)
Within Group p-Value +p < 0.001 (r)p < 0.001 (r)p < 0.001 (r)
Between Group p-value **0.4246 (r)0.1390 (r)
Change from Baseline to Week 8Mean ± SD (n)−74.71 ± 71.52 (84)−53.25 ± 65.65 (83)−74.41 ± 62.83 (81)
Within Group p-Value +p < 0.001 (r)p < 0.001 (r)p < 0.001 (r)
Between Group p-value **0.9632 (r)0.0763 (r)
n, number; SD, standard deviation; Min, minimum; Max, maximum; * For Baseline (Day 0), p-values for comparison of each probiotic strain to placebo generated by ANOVA with Group as a fixed effect and subject as a random effect. Dunnett’s method was used to adjust for multiple comparisons; ** Values generated from a Repeated Measures ANCOVA with baseline as a covariate and Group, Study Day and Group by Study Day interaction as fixed effects with subject as a random effect. p-values for comparison to placebo were adjusted for multiple comparisons using Dunnett’s method; + Within group p-values generated from the Repeated Measures ANCOVA specified above; (r) indicates values were ranked prior to generating ANOVA or ANCOVA.
Table 3. Stool consistency at baseline, week 4, and week 8 and change in stool consistency from baseline to week 4, and week for participants with IBS-C in the PP population.
Study DayStatisticL. paracasei HA-196B. longum R0175 Placebo
Baseline (average of Weeks −2 and −1)Mean ± SD (n)2.84 ± 1.43 (10)2.55 ± 1.57 (5)2.69 ± 0.78 (12)
p-value *0.94670.9656
Week 4Mean ± SD (n)3.14 ± 1.05 (10)3.21 ± 1.15 (5)2.91 ± 0.82 (13)
Week 8Mean ± SD (n)3.21 ± 1.32 (10)2.44 ± 0.74 (5)2.49 ± 0.95 (12)
Change from Baseline to Week 4Mean ± SD (n)0.44 ± 1.09 (9)0.49 ± 1.74 (5)−0.05 ± 0.80 (12)
Within Group p-Value +p = 0.221 (r)p = 0.210 (r)p = 0.295 (r)
Between Group p-value **0.2585 (r)0.9940 (r)
Change from Baseline to Week 8Mean ± SD (n)0.62 ± 1.12 (9)−0.28 ± 1.54 (5)−0.41 ± 1.00 (11)
Within Group p-Value +p = 0.186 (r)p = 0.789 (r)p = 0.858 (r)
Between Group p-value **0.0721 (r)0.9805 (r)
n, number; SD, standard deviation; Min, minimum; Max, maximum; * For Baseline (Day 0), p-values for comparison of each probiotic strain to placebo generated by ANOVA with Group as a fixed effect and subject as a random effect. Dunnett’s method was used to adjust for multiple comparisons; ** Values generated from a Repeated Measures ANCOVA with baseline as a covariate and Group, Study Day and Group by Study Day interaction as fixed effects with subject as a random effect. p-values for comparison to placebo were adjusted for multiple comparisons using Dunnett’s method; + Within group p-values generated from the Repeated Measures ANCOVA specified above; (r) indicates values were ranked prior to generating ANOVA or ANCOVA.
Table 4. Stool consistency at baseline, week 4, and week 8 and change in stool consistency from baseline to week 4, and week 8 for participants with IBS-D in the PP population.
Study DayStatisticL. paracasei HA-196B. longum R0175 Placebo
Baseline (average of Weeks −2 and −1)Mean ± SD (n)4.34 ± 0.65 (10)4.46 ± 0.89 (15)4.79 ± 0.77 (13)
p-value *0.31060.4416
Week 4Mean ± SD (n)3.73 ± 0.75 (10)4.13 ± 0.64 (15)4.26 ± 0.57 (12)
Week 8Mean ± SD (n)3.68 ± 0.95 (10)4.22 ± 0.97 (15)4.66 ± 0.76 (12)
Change from Baseline to Week 4Mean ± SD (n)−0.39 ± 0.80 (10)−0.36 ± 1.01 (15)−0.60 ± 0.74 (12)
Within Group p-Value +p = 0.023p = 0.132p = 0.016
Between Group p-value **0.85230.9868
Change from Baseline to Week 8Mean ± SD (n)−0.45 ± 1.14 (10)−0.26 ± 1.12 (15)−0.20 ± 0.78 (12)
Within Group p-Value +p = 0.013p = 0.281p = 0.450
Between Group p-value **0.28960.5955
n, number; SD, standard deviation; Min, minimum; Max, maximum; * For Baseline (Day 0), p-values for comparison of each probiotic strain to placebo generated by ANOVA with Group as a fixed effect and subject as a random effect. Dunnett’s method was used to adjust for multiple comparisons; ** Values generated from a Repeated Measures ANCOVA with baseline as a covariate and Group, Study Day and Group by Study Day interaction as fixed effects with subject as a random effect. p-values for comparison to placebo were adjusted for multiple comparisons using Dunnett’s method; + Within group p-values generated from the Repeated Measures ANCOVA specified above; (r) indicates values were ranked prior to generating ANOVA or ANCOVA.

