Omega-3 Eicosapentaenoic Acid (EPA) Rich Extract from the Microalga Nannochloropsis Decreases Cholesterol in Healthy Individuals: A Double-Blind, Randomized, Placebo-Controlled, Three-Month Supplementation Study


Abstract
:1. Introduction
2. Material and Methods
2.1. Clinical Trial Design, Registration and Ethical Approval
2.2. Participants
2.3. Investigational Products
2.4. Intervention and Study Procedures
2.5. Randomisation and Blinding
2.6. Outcome Measurements
2.7. Statistical Analyses
3. Results
3.1. Participants
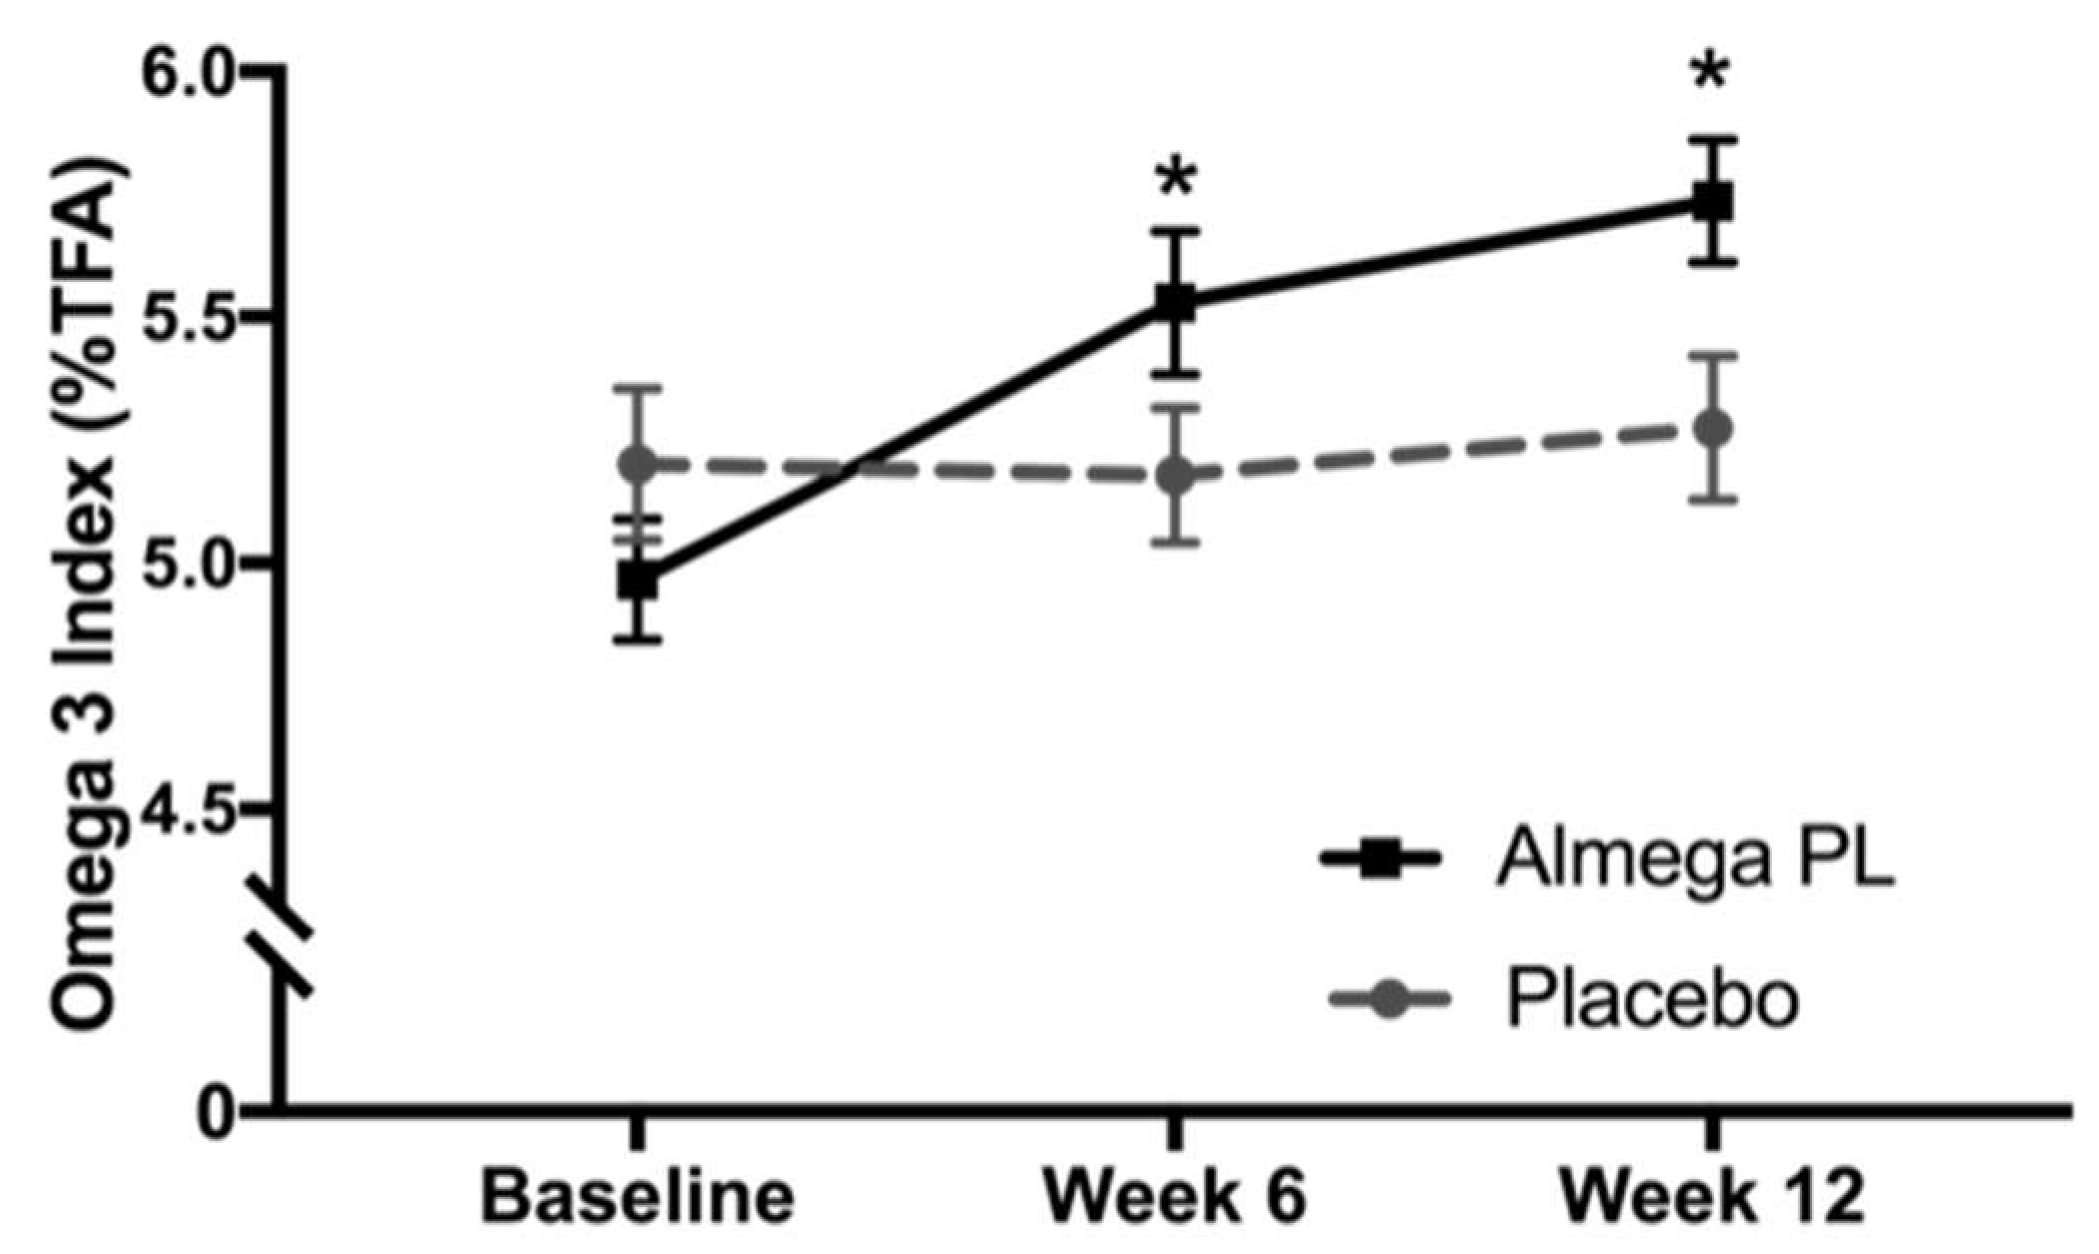
3.2. Omega-3 Status
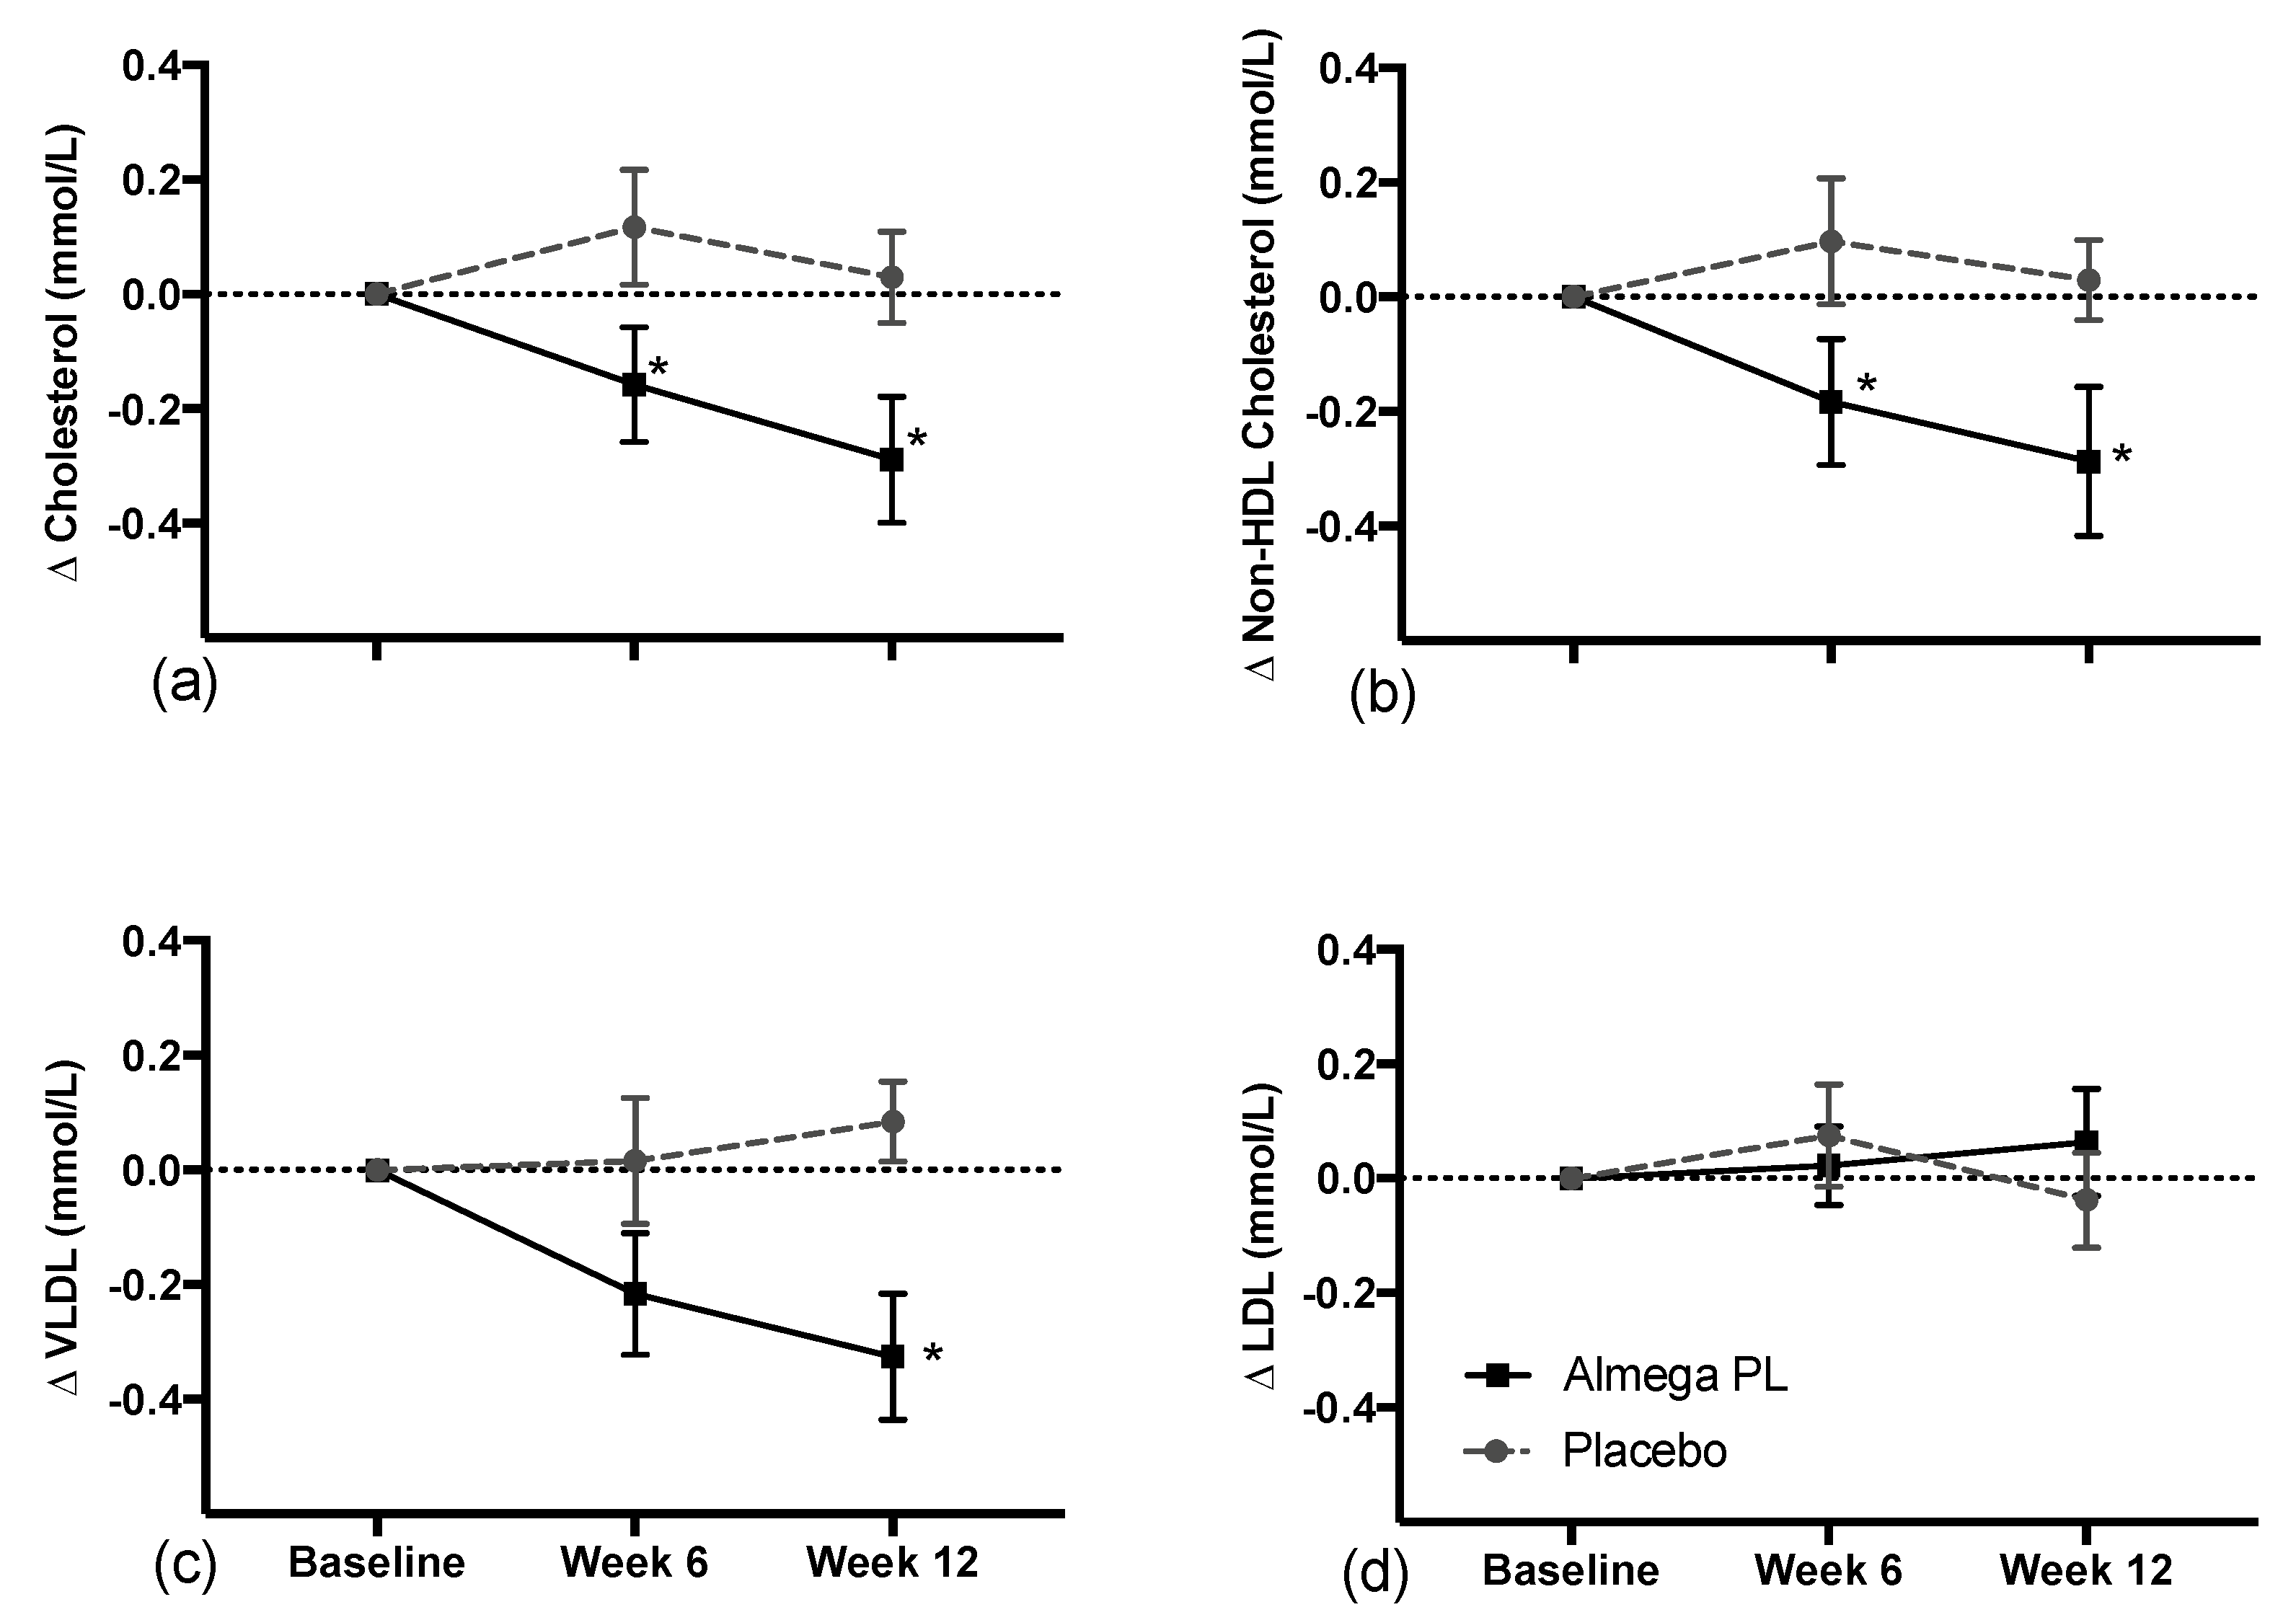
3.3. Cardiometabolic Markers
3.4. Antropometric Measures
3.5. Safety Markers and Adverse Reactions
3.6. Inflammatory Markers
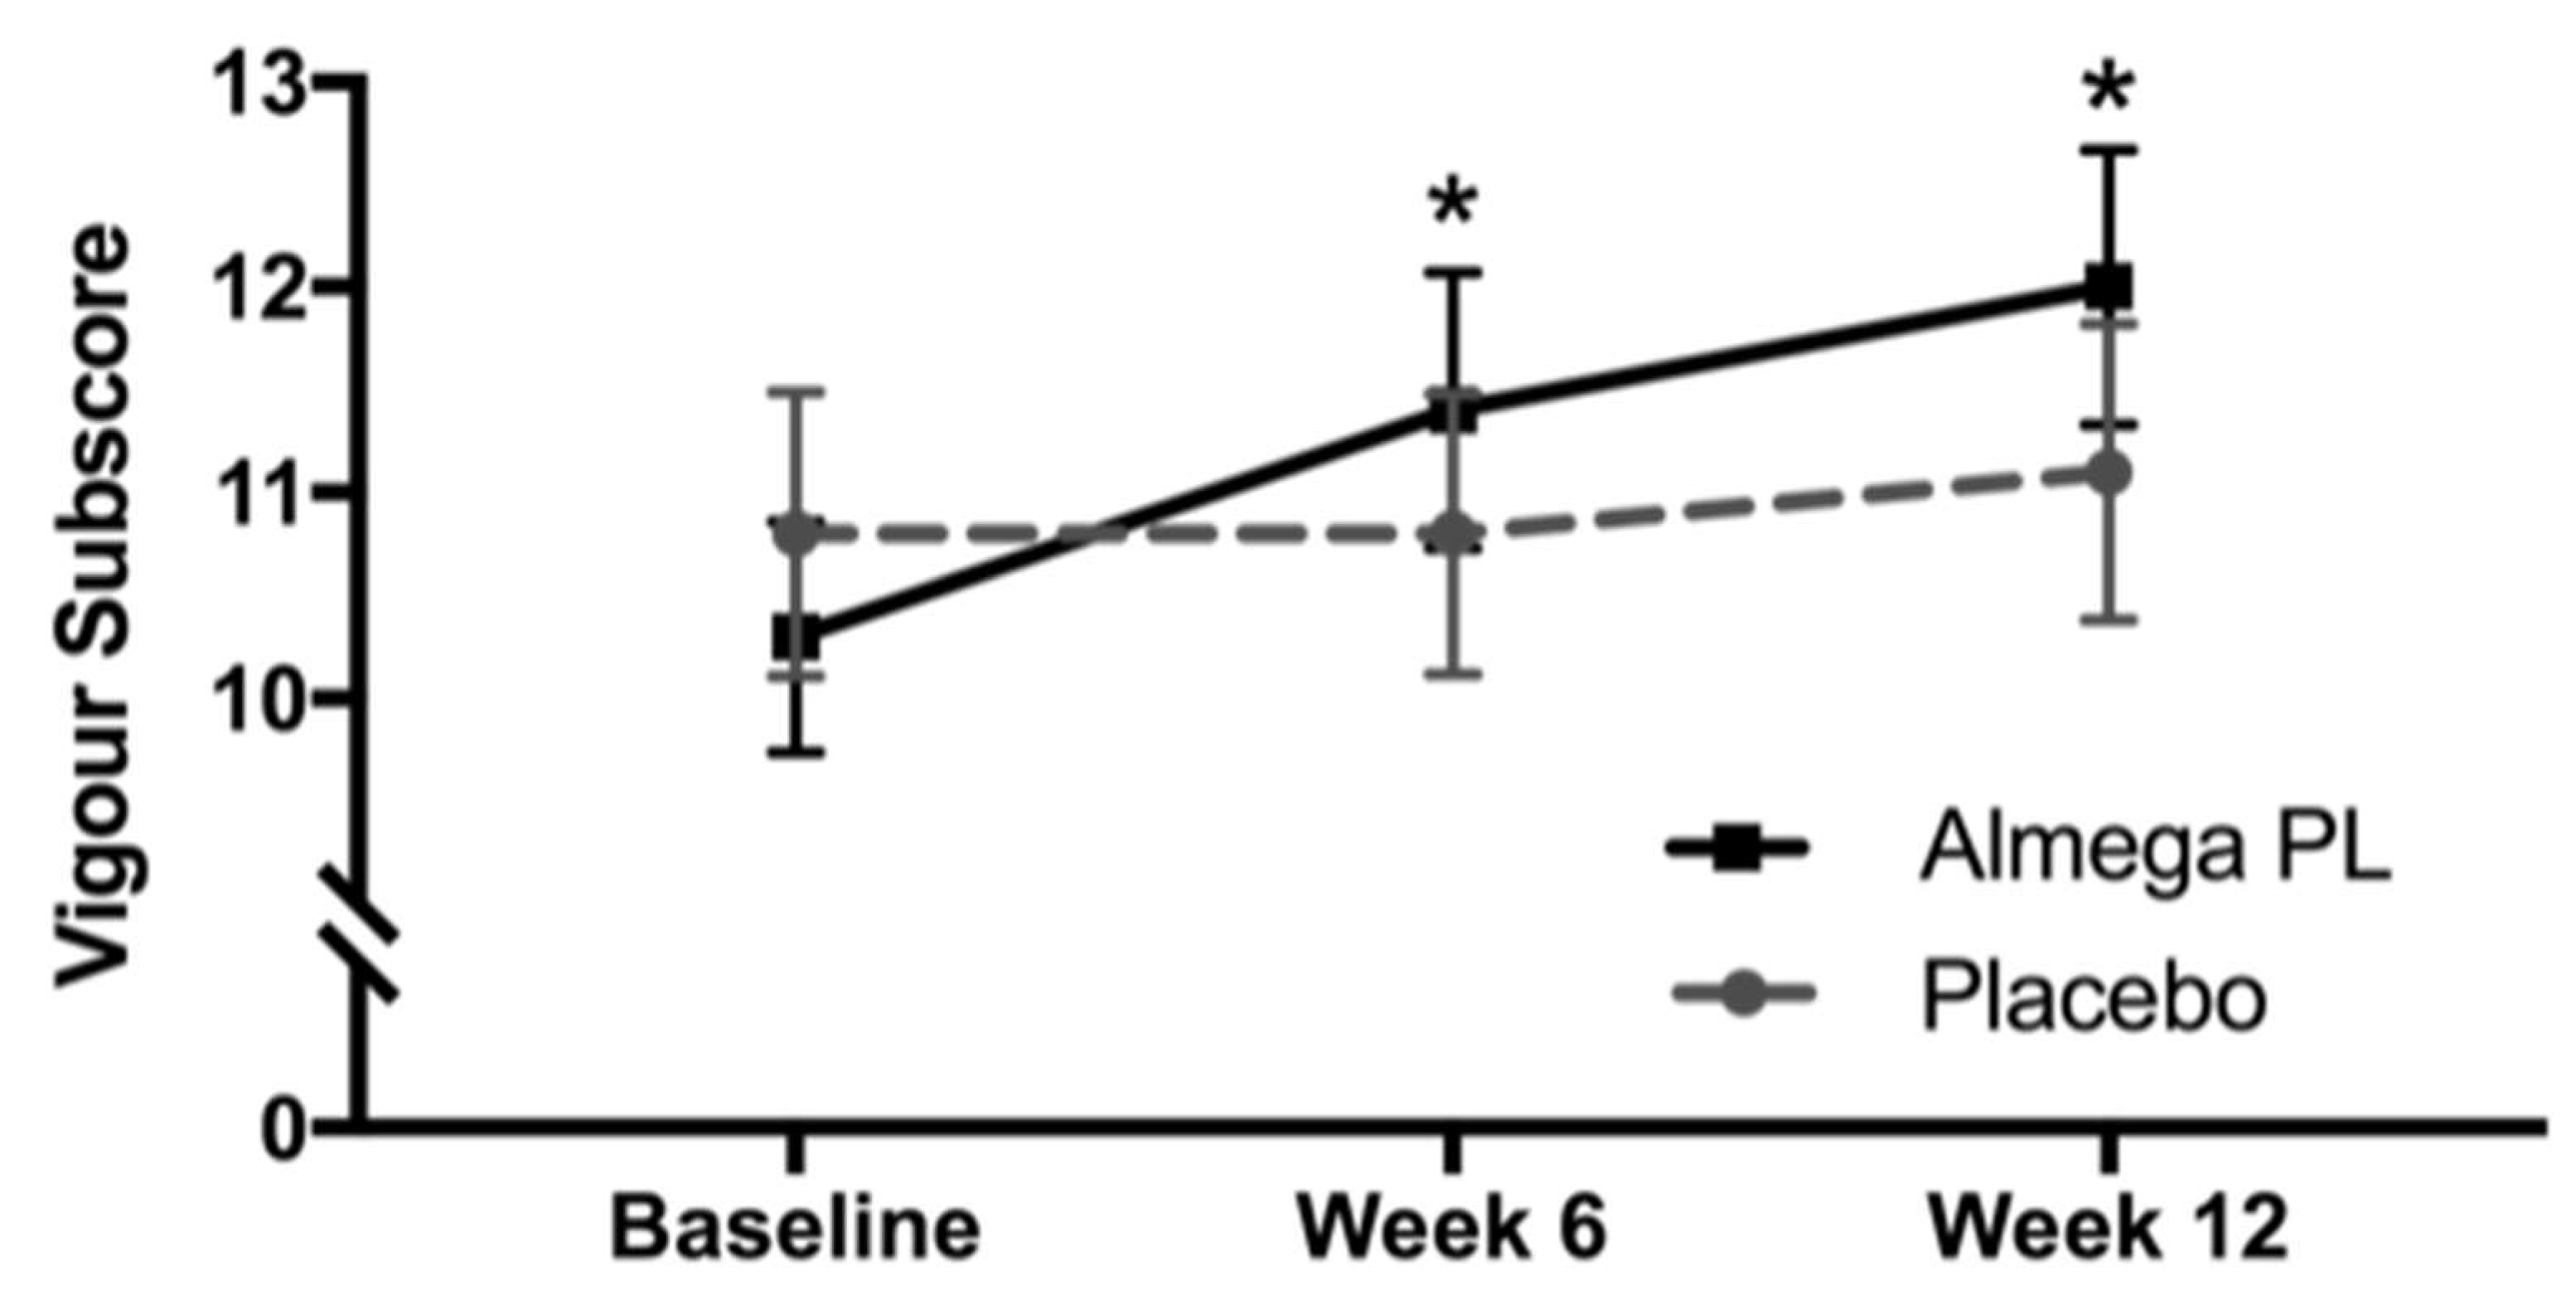
3.7. Mood Disturbance
3.8. Quality of Life Questionnaires
4. Discussion
Author Contributions
Funding
Acknowledgments
Conflicts of Interest
References
- World Health Organization Cardiovascular Diseases Fact Sheet. Available online: http://www.who.int/mediacentre/factsheets/fs317/en/ (accessed on 6 April 2020).
- Micha, R.; Peñalvo, J.L.; Cudhea, F.; Imamura, F.; Rehm, C.D.; Mozaffarian, D. Association between dietary factors and mortality from heart disease, stroke, and type 2 diabetes in the United States. JAMA 2017, 317, 912–924. [Google Scholar] [CrossRef] [PubMed] [Green Version]
- Murphy, R.A.; Yu, E.A.; Ciappio, E.D.; Mehta, S.; McBurney, M.I. Suboptimal plasma long chain n-3 concentrations are common among adults in the United States, NHANES 2003–2004. Nutrients 2015, 7, 10282–10289. [Google Scholar] [CrossRef] [PubMed] [Green Version]
- Institute of Medicine. New Dietary Reference Intakes Set for Energy, Carbohydrates, Fiber, Fat, Fatty Adds, Cholesterol, Proteins, and Amino Acids, 1st ed.; The National Academies Press: Washington, DC, USA, 2005; pp. 1–1357. [Google Scholar] [CrossRef]
- Australian Government, National Health and Medical Research Council. Nutrient Reference Values for Australia and New Zealand Including Recommended Dietary Intakes; Australian Government, National Health and Medical Research Council, 2006; Volume 308.
- Balk, E.M.; Lichtenstein, A.H.; Chung, M.; Kupelnick, B.; Chew, P.; Lau, J. Effects of omega-3 fatty acids on serum markers of cardiovascular disease risk: A systematic review. Atherosclerosis 2006, 189, 19–30. [Google Scholar] [CrossRef]
- Bays, H.E.; Ballantyne, C.M.; Kastelein, J.J.; Isaacsohn, J.L.; Braeckman, R.A.; Soni, P.N. Eicosapentaenoic acid ethyl ester (AMR101) therapy in patients with very high triglyceride levels (from the Multi-center, plAcebo-controlled, Randomized, double-blINd, 12-week study with an open-label Extension [MARINE] Trial). Am. J. Cardiol. 2011, 108, 682–690. [Google Scholar] [CrossRef] [PubMed]
- Miller, P.E.; Van Elswyk, M.; Alexander, D.D. Long-chain omega-3 fatty acids eicosapentaenoic acid and docosahexaenoic acid and blood pressure: A meta-analysis of randomized controlled trials. Am. J. Hypertens. 2014, 27, 885–896. [Google Scholar] [CrossRef] [PubMed]
- Maki, K.C.; Palacios, O.M.; Bell, M.; Toth, P.P. Use of supplemental long-chain omega-3 fatty acids and risk for cardiac death: An updated meta-analysis and review of research gaps. J. Clin. Lipidol. 2017, 11, 1152–1160. [Google Scholar] [CrossRef] [Green Version]
- Oscarsson, J.; Hurt-Camejo, E. Omega-3 fatty acids eicosapentaenoic acid and docosahexaenoic acid and their mechanisms of action on apolipoprotein B-containing lipoproteins in humans: A review. Lipids Health Dis. 2017, 16, 1–13. [Google Scholar] [CrossRef] [Green Version]
- Jacobson, T.A.; Glickstein, S.B.; Rowe, J.D.; Soni, P.N. Effects of eicosapentaenoic acid and docosahexaenoic acid on low-density lipoprotein cholesterol and other lipids: A review. J. Clin. Lipidol. 2012, 6, 5–18. [Google Scholar] [CrossRef]
- Kagan, M.L.; West, A.L.; Zante, C.; Calder, P.C. Acute appearance of fatty acids in human plasma—A comparative study between polar-lipid rich oil from the microalgae Nannochloropsis oculata and krill oil in healthy young males. Lipids Health Dis. 2013, 12, 1. [Google Scholar] [CrossRef] [Green Version]
- Barter, P. High-density-lipoprotein cholesterol testing: Implications for clinical management. Aust. Prescr. 1994, 17, 99–102. [Google Scholar] [CrossRef]
- Harris, W.S.; Polreis, J. Measurement of the Omega-3 Index in dried blood spots. Ann. Clin. Lab. Res. 2016, 4, 1–7. [Google Scholar] [CrossRef]
- Morfeld, M.; Petersen, C.; Krüger-Bödeker, A.; von Mackensen, S.; Bullinger, M. The assessment of mood at workplace - psychometric analyses of the revised Profile of Mood States (POMS) questionnaire. Psychsoc. Med. 2007, 4, 1–9. [Google Scholar]
- Lee, C.H.; Giuliani, F. The role of inflammation in depression and fatigue. Front. Immunol. 2019, 10, 1696. [Google Scholar] [CrossRef] [PubMed] [Green Version]
- Smyth, C. The Pittsburgh sleep quality index (PSQI). J. Gerontol. Nurs. 1999, 25, 10. [Google Scholar] [CrossRef]
- Stein, K.D.; Martin, S.C.; Hann, D.M.; Jacoben, P.B. A multidimensional measure of fatigue for use with cancer patients. Cancer Pract. 1998, 6, 143–152. [Google Scholar] [CrossRef]
- Lins, L.; Carvalho, F.M. SF-36 total score as a single measure of health-related quality of life: Scoping review. SAGE Open Med. 2016, 4, 1–12. [Google Scholar] [CrossRef] [Green Version]
- National Institute of Health, National Cancer Institute, Food Frequency Questionnaire (FFQ), Dietary Assessment Instrument Profiles. Available online: https://dietassessmentprimer.cancer.gov/profiles/questionnaire/ (accessed on 6 April 2020).
- Flock, M.R.; Skulas-Ray, A.C.; Harris, W.S.; Etherton, T.D.; Fleming, J.A.; Kris-Etherton, P.M. Determinants of erythrocyte omega-3 fatty acid content in response to fish oil supplementation: A dose-response randomized controlled trial. J. Am. Heart Assoc. 2013, 2, 20–23. [Google Scholar] [CrossRef] [Green Version]
- Walker, R.E.; Jackson, K.H.; Tintle, N.L.; Shearer, G.C.; Bernasconi, A.; Masson, S.; Latini, R.; Heydari, B.; Kwong, R.Y.; Flock, M.; et al. Predicting the effects of supplemental EPA and DHA on the omega-3 index. Am. J. Clin. Nutr. 2019, 110, 1034–1040. [Google Scholar] [CrossRef]
- The R Project for Statistical Computing V4.0.0, R Foundation for Statistical Computing, A Language and Environment for Statistical Computing, Vienna, Austria. Available online: https://www.R-project.org/ (accessed on 6 April 2020).
- Katan, M.B.; Deslypere, J.P.; van Birgelen, A.P.; Penders, M.; Zegwaard, M. Kinetics of the incorporation of dietary fatty acids into serum cholesteryl esters, erythrocyte membranes, and adipose tissue: An 18-month controlled study. J. Lipid Res. 1997, 38, 2012–2022. [Google Scholar]
- Harris, W.S. The omega-3 index as a risk factor for coronary heart disease. Am. J. Clin. Nutr. 2008, 87, 1997–2002. [Google Scholar] [CrossRef]
- Stark, K.D.; Van Elswyk, M.E.; Higgins, M.R.; Weatherford, C.A.; Salem, N. Global survey of the omega-3 fatty acids, docosahexaenoic acid and eicosapentaenoic acid in the blood stream of healthy adults. Prog. Lipid Res. 2016, 63, 132–152. [Google Scholar] [CrossRef] [PubMed]
- Rambjør, G.S.; Walen, A.I.; Windsor, S.L.; Harris, W.S. Eicosapentaenoic acid is primarily responsible for hypotriglyceridemic effect of fish oil in humans. Lipids 1996, 31, 45–49. [Google Scholar] [CrossRef] [PubMed]
- Allaire, J.; Harris, W.S.; Vors, C.; Charest, A.; Marin, J.; Jackson, K.H.; Tchernof, A.; Couture, P.; Lamarche, B. Supplementation with high-dose docosahexaenoic acid increases the Omega-3 Index more than high-dose eicosapentaenoic acid. Prostaglandins Leukot. Essent. Fatty Acids 2017, 120, 8–14. [Google Scholar] [CrossRef] [PubMed] [Green Version]
- Harris, W.S.; Jackson, K.H. Translating plasma eicosapentaenoic acid concentrations into erythrocyte percentages of eicosapentaenoic acid plus docosahexaenoic acid during treatment with icosapent ethyl. J. Clin. Lipidol. 2019, 13, 771–777. [Google Scholar] [CrossRef] [PubMed]
- Skulas-Ray, A.C.; Wilson, P.W.F.; Harris, W.S.; Brinton, E.A.; Kris-Etherton, P.M.; Richter, C.K.; Jacobson, T.A.; Engler, M.B.; Miller, M.; Robinson, J.G.; et al. Omega-3 fatty acids for the management of hypertriglyceridemia. A science advisory from the American Heart Association. Circulation 2019, 140, 673–691. [Google Scholar] [CrossRef] [Green Version]
- Ouguerram, K.; Maugeais, C.; Gardette, J.; Magot, T.; Krempf, M. Effect of n-3 fatty acids on metabolism of apoB100-containing lipoprotein in type 2 diabetic subjects. Br. J. Nutr. 2006, 96, 100–106. [Google Scholar] [CrossRef] [Green Version]
- Yokoyama, M.; Origasa, H.; Matsuzaki, M.; Matsuzawa, Y.; Saito, Y.; Ishikawa, Y.; Oikawa, S.; Sasaki, J.; Hishida, H.; Itakura, H.; et al. Effects of eicosapentaenoic acid on major coronary events in hypercholesterolaemic patients (JELIS): A randomised open-label, blinded endpoint analysis. Lancet 2007, 369, 1090–1098. [Google Scholar] [CrossRef]
- Bhatt, D.L.; Steg, P.G.; Miller, M.; Brinton, E.A.; Jacobson, T.A.; Ketchum, S.B.; Doyle, R.T.; Juliano, R.A.; Jiao, L.; Granowitz, C.; et al. Cardiovascular risk reduction with icosapent ethyl for hypertriglyceridemia. N. Engl. J. Med. 2019, 380, 11–22. [Google Scholar] [CrossRef]
- AstraZeneca, Update on Phase III STRENGTH Trial for Epanova in Mixed Dyslipidaemia. Available online: https://www.astrazeneca.com/content/astraz/media-centre/press-releases/2020/update-on-phase-iii-strength-trial-for-epanova-in-mixed-dyslipidaemia-13012020.html (accessed on 6 April 2020).
- Cabral, C.E.; Klein, M.R.S.T. Phytosterols in the treatment of hypercholesterolemia and prevention of cardiovascular diseases. Arq. Bras. Cardiol. 2017, 109, 475–482. [Google Scholar] [CrossRef]
- Montelius, C.; Erlandsson, D.; Vitija, E.; Stenblom, E.L.; Egecioglu, E.; Erlanson-Albertsson, C. Body weight loss, reduced urge for palatable food and increased release of GLP-1 through daily supplementation with green-plant membranes for three months in overweight women. Appetite 2014, 81, 295–304. [Google Scholar] [CrossRef] [Green Version]
- Dyerberg, J.; Madsen, P.; Møller, J.M.; Aardestrup, I.; Schmidt, E.B. Bioavailability of marine n-3 fatty acid formulations. Prostaglandins Leukot. Essent. Fatty Acids 2010, 83, 137–141. [Google Scholar] [CrossRef]
- Chu, B.S.; Gunning, A.P.; Rich, G.T.; Ridout, M.J.; Faulks, R.M.; Wickham, M.S.; Morris, V.J.; Wilde, P.J. Adsorption of bile salts and pancreatic colipase and lipase onto digalactosyldiacylglycerol and dipalmitoylphosphatidylcholine monolayers. Langmuir 2010, 26, 9782–9793. [Google Scholar] [CrossRef] [PubMed]
- Ohlsson, L.; Rosenquist, A.; Rehfeld, J.F.; Härröd, M. Postprandial effects on plasma lipids and satiety hormones from intake of liposomes made from fractionated oat oil: Two randomized crossover studies. Food Nutr. Res. 2014, 58, 1–11. [Google Scholar] [CrossRef] [Green Version]
- Burns, A.A.; Livingstone, M.B.; Welch, R.W.; Dunne, A.; Rowland, I.R. Dose-response effects of a novel fat emulsion (Olibra) on energy and macronutrient intakes up to 36h post-consumption. Eur. J. Clin. Nutr. 2002, 56, 368–377. [Google Scholar] [CrossRef] [PubMed] [Green Version]
- Shimokata, H.; Andres, R.; Coon, P.J.; Elahi, D.; Muller, D.C.; Tobin, J.D. Studies in the distribution of body fat. II. Longitudinal effects of change in weight. Int. J. Obes. 1989, 13, 455–464. [Google Scholar] [PubMed]
- Musa-Veloso, K.; Binns, M.A.; Kocenas, A.; Chung, C.; Rice, H.; Oppedal-Olsen, H.; Lloyd, H.; Lemke, S. Impact of low v. moderate intakes of long-chain n-3 fatty acids on risk of coronary heart disease. Br. J. Nutr. 2011, 106, 1129–1141. [Google Scholar] [CrossRef] [PubMed] [Green Version]


| Almega®PL (n = 53) | Placebo (n = 51) | |
|---|---|---|
| Female (n) | 31 | 32 |
| Male (n) | 22 | 19 |
| Age (years) | 53.9 ± 11.0 | 52.0 ± 12.9 |
| Weight (kg) | 77.1 ± 16.0 | 74.8 ± 14.5 |
| BMI (kg/m2) | 26.2 ± 4.8 | 26.4 ± 4.6 |
| Systolic Blood pressure (mmHg) | 124.9 ± 16.1 | 122.5 ± 14.8 |
| Diastolic Blood pressure (mmHg) | 81.0 ± 9.1 | 78.3 ± 8.5 |
| Resting heart rate (BPM) | 65.4 ± 9.6 | 65.7 ± 9.8 |
| Waist circumference (cm) | 90.0 ± 13.2 | 89.4 ± 12.9 |
| Hip Circumference (cm) | 104.6 ± 8.9 | 103.4 ± 8.6 |
| Almega®PL | Placebo | |||||
|---|---|---|---|---|---|---|
| Baseline | Week 6 | Week 12 | Baseline | Week 6 | Week 12 | |
| ARA | 14.83 ± 1.37 | 15.16 ±1.26 | 15.38 ± 0.99 | 14.67 ±1.26 | 14.76 ± 1.18 | 15.16 ± 1.14 |
| EPA | 0.82 ± 0.37 | 1.16 ± 0.36 * | 1.27 ± 0.36 * | 0.82 ± 0.27 | 0.86 ± 0.00 | 0.87 ± 0.30 |
| DPA | 3.01 ± 0.40 | 3.45 ± 0.28 * | 3.55 ± 0.31 * | 3.04 ± 0.58 | 3.01 ± 0.41 | 3.08 ± 0.54 |
| DHA | 4.18 ± 0.87 | 4.25 ± 0.82 | 4.29 ± 0.72 | 4.46 ± 1.02 | 4.42 ± 0.89 | 4.59 ± 1.02 |
| Per-protocol population | ||||||
| Almega®PL (n = 53) | Placebo (n = 51) | |||||
| Baseline | Week 6 | Week 12 | Baseline | Week 6 | Week 12 | |
| Cholesterol | 6.47 ± 1.20 | 6.44 ± 1.16 | 6.32 ± 1.05 * | 6.51 ± 1.48 | 6.55 ± 1.35 | 6.54 ± 1.42 |
| HDL | 1.87 ± 0.56 | 1.90 ± 0.56 | 1.89 ± 0.5 | 1.77 ± 0.56 | 1.83 ± 0.53 | 1.79 ± 0.56 |
| LDL | 3.76 ± 0.97 | 3.80 ± 0.98 | 3.76 ± 0.83 | 3.90 ± 1.09 | 3.93 ± 0.97 | 3.91 ± 0.97 |
| VLDL | 0.91 ± 0.73 | 0.78 ± 0.49 | 0.66 ± 0.49 * | 0.89 ± 0.59 | 0.83 ± 0.59 | 0.89 ± 0.59 |
| Triglycerides | 0.99 ± 0.59 | 1.02 ± 0.66 | 0.98 ± 0.52 | 1.04 ± 0.59 | 1.13 ± 0.54 | 1.05 ± 0.57 |
| non-HDL-C | 4.64 ± 1.20 | 4.54 ± 1.17 | 4.41 ± 1.03 | 4.74 ± 1.39 | 4.72 ± 1.32 | 4.77 ± 1.37 |
| TC:HDL Ratio | 3.82 ± 1.49 | 3.71 ± 1.35 | 3.66 ± 1.29 | 3.90 ± 1.09 | 3.81 ± 1.20 | 3.95 ± 1.44 |
| High cholesterol subgroup (>5.5 mmol/L) | ||||||
| Almega®PL (n = 40) | Placebo (n = 36) | |||||
| Baseline | Week 6 | Week 12 | Baseline | Week 6 | Week 12 | |
| Cholesterol | 6.94 ± 0.94 | 6.80 ± 1.05 * | 6.65 ± 0.91 * | 7.11 ± 1.19 | 7.09 ± 1.11 | 7.14 ± 1.18 |
| HDL | 1.92 ± 0.59 | 1.92 ± 0.57 | 1.91 ± 0.57 | 1.82 ± 0.60 | 1.86 ± 0.58 | 1.82 ± 0.61 |
| LDL | 4.09 ± 0.84 | 4.10 ± 0.91 | 4.10 ± 0.76 | 4.33 ± 0.87 | 4.30 ± 0.81 | 4.29 ± 0.74 |
| VLDL | 1.00 ± 0.77 | 0.83 ± 0.51 | 0.73 ± 0.50 * | 1.03 ± 0.58 | 1.01 ± 0.56 | 1.11 ± 0.60 |
| Triglyceride | 1.08 ± 0.65 | 1.10 ± 0.71 | 1.03 ± 0.52 | 1.16 ± 0.62 | 1.23 ± 0.55 | 1.15 ± 0.60 |
| non-HDL-C | 5.02 ± 1.06 | 4.89 ± 1.08 * | 4.74 ± 0.94 * | 5.28 ± 1.12 | 5.24 ± 1.08 | 5.31 ± 1.15 |
| TC:HDL ratio | 4.03 ± 1.59 | 3.89 ± 1.39 | 3.82 ± 1.31 | 4.22 ± 1.29 | 4.12 ± 1.18 | 4.28 ± 1.45 |
| Almega®PL | Placebo | |||||
|---|---|---|---|---|---|---|
| Baseline | Week 6 | Week 12 | Baseline | Week 6 | Week 12 | |
| CRP (mg/L) | 1.94 ± 2.35 | 1.47 ± 1.38 | 2.02 ± 2.88 | 1.73 ± 2.09 | 1.64 ± 1.74 | 2.07 ± 3.15 |
| ALT (U/L) | 23.81 ± 14.74 | 24.56 ± 15.82 | 22.23 ± 13.62 | 21.83 ± 12.0 | 21.09 ± 10.28 | 23.10 ± 13.82 |
| AST (U/L) | 27.85 ± 9.07 | 29.8 ± 14.10 | 27.78 ± 9.11 * | 26.69 ± 8.27 | 26.31 ± 8.01 | 28.20 ± 8.99 |
| HOM (umol/L) | 7.72 ± 2.12 | 7.56 ± 2.12 | 7.46 ± 1.80 | 7.03 ± 2.21 | 7.1 ± 1.93 | 6.95 ± 1.97 |
| GGT (U/L) | 23.21 ± 16.93 | 22.22 ± 13.58 | 24.74 ± 16.30 | 23.86 ± 20.94 | 23.40 ± 19.33 | 20.87 ± 14.16 |
| TBIL (umol/L) | 9.54 ± 4.34 | 9.75 ± 5.05 | 8.73 ± 5.62 | 8.59 ± 4.22 | 8.78 ± 3.97 | 8.16 ± 3.54 |
| CRE (umol/L) | 95.55 ± 19.88 | 106.17 ± 69.14 | 97.70 ± 18.65 | 95.06 ± 17.31 | 96.14 ± 20.56 | 99.34 ± 16.76 |
| GLU (mmol/L) | 5.74 ± 0.59 | 5.86 ± 0.72 | 5.89 ± 0.77 | 5.68 ± 0.69 | 5.72 ± 0.78 | 5.72 ± 0.72 |
| IL6 (pg/mL) | 8.55 ± 17.04 | 8.87 ± 16.71 | 9.43 ± 17.24 * | 14.45 ± 26.61 | 23.76 ± 43.78 | 22.88 ± 43.69 |
| TNF-α (pg/mL) | 7.19 ± 2.96 | 7.54 ± 4.35 | 7.86 ± 4.23 | 7.52 ± 6.08 | 8.15 ± 6.04 | 7.65 ± 4.26 |
| d-ROMS (u.carr) | 417.5 ± 134.8 | 404.4 ± 122.0 | 412.0 ± 104.1 | 412.3 ± 87.4 | 402.6 ± 112.9 | 422.7 ± 96.8 |
| WC (cm) | 90.03 ± 13.22 | 89.76 ± 13.48 | 89.38 ± 13.19 | 89.39 ± 12.92 | 89.43 ± 13.01 | 90.07 ± 13.21 |
| HC (cm) | 104.55 ± 8.89 | 103.82 ± 8.81 | 103.86 ± 8.68 * | 103.43 ± 8.55 | 103.40 ± 9.11 | 104.19 ± 8.98 * |
| SBP (mmHg) | 124.85 ± 16.14 | 123.17 ± 15.05 | 121.12 ± 16.40 | 122.49 ± 14.78 | 118.98 ± 13.07 | 120.74 ± 15.52 |
| DBP (mmHg) | 81 ± 9.12 | 79 ± 9.38 | 78.81 ± 9.79 | 78.24 ± 8.54 | 76.22 ± 8.57 | 78.06 ± 9.11 |
| HR (BPM) | 65.36 ± 9.64 | 67.19 ± 8.46 | 65.37 ± 9.06 | 64.69 ± 9.77 | 66.41 ± 10.43 | 65.37 ± 9.06 |
| Weight (kg) | 77.06 ± 15.98 | 76.76 ± 15.69 | 76.79 ± 15.68 | 74.80 ± 14.49 | 75.07 ± 14.72 | 75.22 ± 14.53 |
| BMI (kg/m2) | 26.20 ± 4.77 | 26.17 ± 4.59 | 26.09 ± 4.53 | 26.35 ± 4.58 | 26.39 ± 4.60 | 26.52 ± 4.56 |
© 2020 by the authors. Licensee MDPI, Basel, Switzerland. This article is an open access article distributed under the terms and conditions of the Creative Commons Attribution (CC BY) license (http://creativecommons.org/licenses/by/4.0/).
Share and Cite
Rao, A.; Briskey, D.; Nalley, J.O.; Ganuza, E. Omega-3 Eicosapentaenoic Acid (EPA) Rich Extract from the Microalga Nannochloropsis Decreases Cholesterol in Healthy Individuals: A Double-Blind, Randomized, Placebo-Controlled, Three-Month Supplementation Study. Nutrients 2020, 12, 1869. https://0-doi-org.brum.beds.ac.uk/10.3390/nu12061869
Rao A, Briskey D, Nalley JO, Ganuza E. Omega-3 Eicosapentaenoic Acid (EPA) Rich Extract from the Microalga Nannochloropsis Decreases Cholesterol in Healthy Individuals: A Double-Blind, Randomized, Placebo-Controlled, Three-Month Supplementation Study. Nutrients. 2020; 12(6):1869. https://0-doi-org.brum.beds.ac.uk/10.3390/nu12061869
Chicago/Turabian StyleRao, Amanda, David Briskey, Jakob O Nalley, and Eneko Ganuza. 2020. "Omega-3 Eicosapentaenoic Acid (EPA) Rich Extract from the Microalga Nannochloropsis Decreases Cholesterol in Healthy Individuals: A Double-Blind, Randomized, Placebo-Controlled, Three-Month Supplementation Study" Nutrients 12, no. 6: 1869. https://0-doi-org.brum.beds.ac.uk/10.3390/nu12061869