Relative Validity of the HELIUS Food Frequency Questionnaire for Measuring Dietary Intake in Older Adult Participants of the Longitudinal Aging Study Amsterdam

 , , , and
Abstract
:1. Introduction
2. Methods
2.1. Study Population and Design
2.2. Food Frequency Questionnaire
2.3. 24-Hour Dietary Recalls
2.4. Descriptive Variables
2.5. Statistics
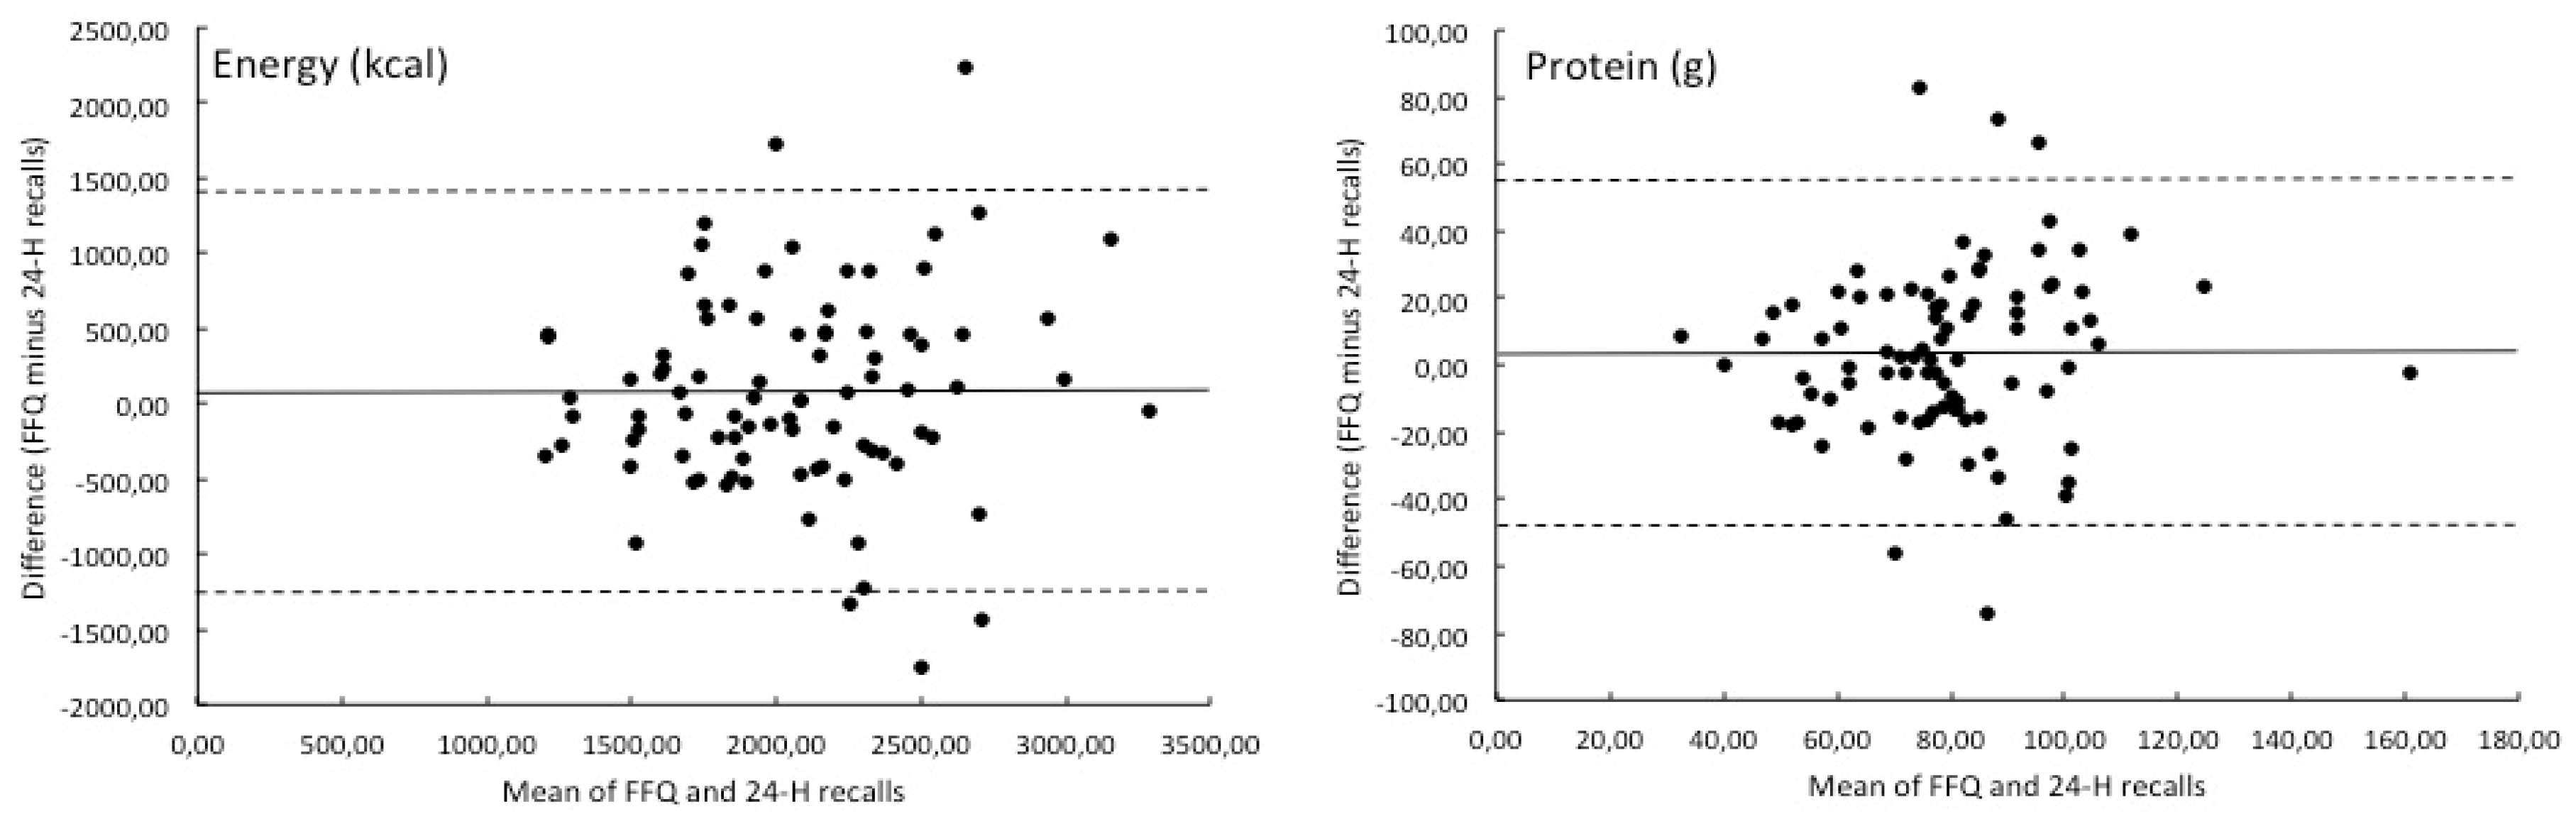
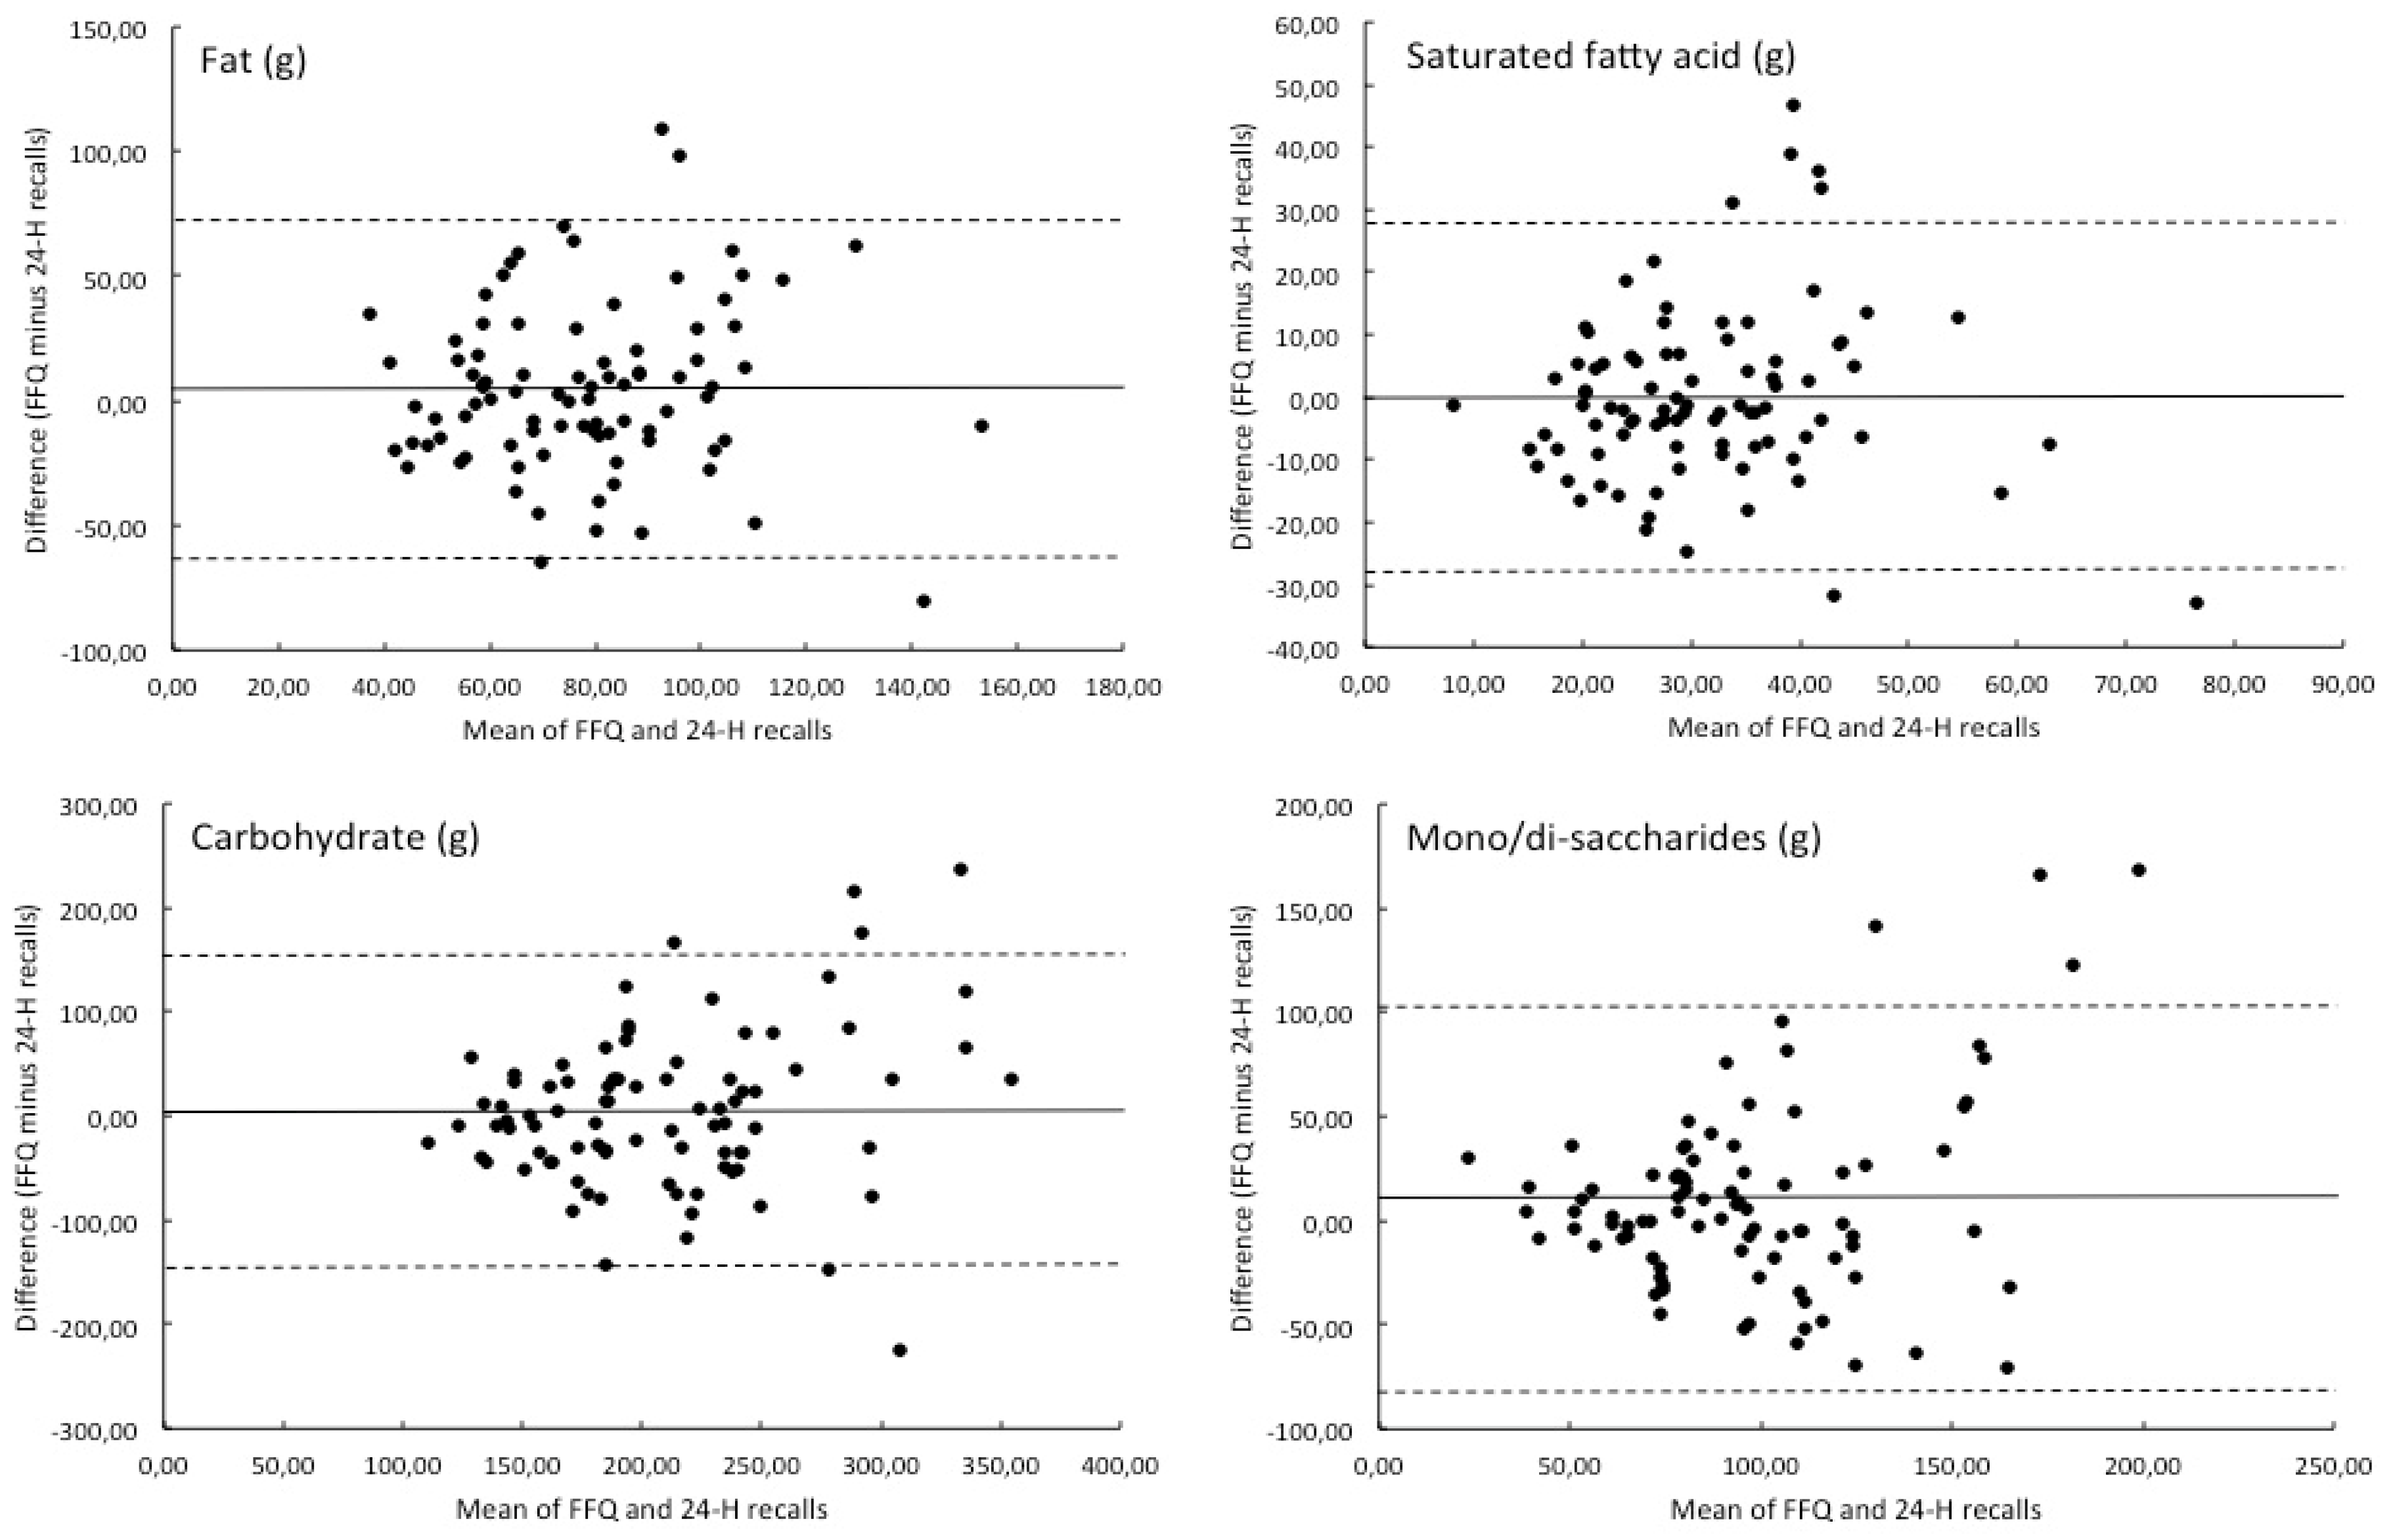
3. Results
4. Discussion
Supplementary Materials
Author Contributions
Funding
Acknowledgments
Conflicts of Interest
References
- Ocké, M.C.; Bueno-de-Mesquita, H.B.; Pols, M.A.; Smit, H.A.; van Staveren, W.A.; Kromhout, D. The Dutch EPIC food frequency questionnaire. II. Relative validity and reproducibility for nutrients. Int. J. Epidemiol. 1997, 26, S49–S58. [Google Scholar] [CrossRef] [PubMed] [Green Version]
- Hu, F.B.; Satija, A.; Rimm, E.B.; Spiegelman, D.; Sampson, L.; Rosner, B.; Camargo, C.A., Jr.; Stampfer, M.; Willett, W.C. Diet Assessment Methods in the Nurses’ Health Studies and Contribution to Evidence-Based Nutritional Policies and Guidelines. Am. J. Public Health 2016, 106, 1567–1572. [Google Scholar] [CrossRef] [PubMed]
- Van Staveren, W.A.; de Groot, L.C.P.G.M.; Blauw, Y.H.; van der Wielen, R.P.J. Assessing diets of elderly people: Problems and approaches. Am. J. Clin. Nutr. 1994, 59, 221S–223S. [Google Scholar] [CrossRef] [PubMed]
- Biró, G.; Hulshof, K.F.; Ovesen, L.; Cruz, J.A.A. Selection of methodology to assess food intake. Eur. J. Clin. Nutr. 2002, 56, S25–S32. [Google Scholar] [CrossRef] [Green Version]
- De Vries, J.H.M.; de Groot, L.C.P.G.M.; van Staveren, W.A. Dietary assessment in elderly people: Experiences gained from the studies in the Netherlands. Eur. J. Clin. Nutr. 2009, 63, S69–S74. [Google Scholar] [CrossRef]
- Goldbohm, R.A.; van den Brandt, P.A.; Brants, H.A.; van’t Veer, P.; Al, M.; Sturmans, F.; Hermus, R.J. Validation of a dietary questionnaire used in a large-scale prospective cohort study on diet and cancer. Eur. J. Clin. Nutr. 1994, 48, 25–65. [Google Scholar]
- Sluik, D.; Geelen, A.; de Vries, J.H.; Eussen, S.J.; Brants, H.A.; Meijboom, S.; van Dongen, M.C.; Bueno-de-Mesquita, H.B.; Wijckmans-Duysens, N.E.; van’t Veer, P.; et al. A national FFQ for The Netherlands (the FFQ-NL 1.0): Validation of a comprehensive FFQ for adults. Br. J. Nutr. 2016, 116, 913–923. [Google Scholar] [CrossRef] [Green Version]
- Streppel, M.T.; de Vries, J.H.; Meijboom, S.; Beekman, M.; de Craen, A.J.; Slagboom, P.E.; Feskens, E.J. Relative validity of the food frequency questionnaire used to assess dietary intake in the Leiden Longevity Study. Nutr. J. 2013, 12, 75. [Google Scholar] [CrossRef] [Green Version]
- Beukers, M.H.; Dekker, L.H.; de Boer, E.J.; Perenboom, C.W.; Meijboom, S.; Nicolaou, M.; de Vries, J.H.; Brants, H.A. Development of the HELIUS food frequency questionnaires: Ethnic-specific questionnaires to assess the diet of a multiethnic population in The Netherlands. Eur. J. Clin. Nutr. 2015, 69, 579–584. [Google Scholar] [CrossRef]
- Huisman, M.; Poppelaars, J.; van der Horst, M.; Beekman, A.T.; Brug, J.; van Tilburg, G.; Deeg, D.J. Cohort profile: The Longitudinal Aging Study Amsterdam. Int. J. Epidemiol. 2011, 40, 868–876. [Google Scholar] [CrossRef] [Green Version]
- Hoogendijk, E.O.; Deeg, D.J.H.; Poppelaars, J.; van der Horst, M.; van Groenou, M.I.B.; Comijs, H.C.; Pasman, H.R.W.; van Schoor, N.M.; Suanet, B.; Thomése, F.; et al. The Longitudinal Aging Study Amsterdam: Cohort update 2016 and major findings. Eur. J. Epidemiol. 2016, 31, 927–945. [Google Scholar] [CrossRef] [PubMed] [Green Version]
- Willett, W.C. Issues in analysis and presentation of dietary data. In Nutritional Epidemiology, 2nd ed.; Willett, W.C., Ed.; Oxford University Press: New York, NY, USA, 1998; pp. 321–346. [Google Scholar]
- Snijder, M.B.; Galenkamp, H.; Prins, M.; Derks, E.M.; Peters, R.J.G.; Zwinderman, A.H.; Stronks, K. Cohort profile: The Healthy Life in an Urban Setting (HELIUS) study in Amsterdam, The Netherlands. BMJ Open 2017, 7, e017873. [Google Scholar] [CrossRef] [PubMed] [Green Version]
- Van Rossum, C.T.M.; Fransen, H.P.; Verkaik-Kloosterman, J.; Buurma-Rethans, E.J.M.; Ocke, M.C. Dutch National Food Consumption Survey 2007–2010; The National Institute for Public Health and the Environment: Bilthoven, The Netherlands, 2011. [Google Scholar]
- National Institute for Public Health and the Environment; Netherlands Nutrition Centre. Dutch Food Composition Table 2011; National Institute for Public Health and the Netherlands Nutrition Centre: The Hague, The Netherlands, 2011. [Google Scholar]
- Folstein, M.F.; Folstein, S.E.; McHugh, P.R. “Mini-mental state”. A practical method for grading the cognitive state of patients for the clinician. J. Psychiatr. Res. 1975, 12, 189–198. [Google Scholar] [CrossRef]
- Ocke, M.C.; Buurma-Rethans, E.J.M.; de Boer, E.J.; Wilson-van den Hooven, C.; Etemad-Ghameslou, Z.; Drijvers, J.J.M.M.; Van Rossum, C.T.M. Diet. of Community-Dwelling Older Adults. Dutch National Food Consumption Survey Older Adults 2010–2012; National Institute for Public Health and the Environment: Bilthoven, The Netherlands, 2013. [Google Scholar]
- Welch, A.A.; Lund, E.; Amiano, P.; Dorronsoro, M.; Brustad, M.; Kumle, M.; Rodriguez, M.; Kasheras, C.; Janzon, L.; Jansson, J.; et al. Variability of fish consumption within the 10 European countries participating in the European Investigation into Cancer and Nutrition (EPIC) study. Public Health Nutr. 2002, 5, 1273–1285. [Google Scholar] [CrossRef] [Green Version]
- Thompson, F.E.; Kipnis, V.; Midthune, D.; Freedman, L.S.; Carroll, R.J.; Subar, A.F.; Brown, C.C.; Butcher, M.S.; Mouw, T.; Leitzmann, M.; et al. Performance of a food-frequency questionnaire in the US NIH-AARP (National Institutes of Health-American Association of Retired Persons) Diet and Health Study. Public Health Nutr. 2007, 11, 183–195. [Google Scholar] [CrossRef]
- Gilsing, A.; Mayhew, A.J.; Payette, H.; Shatenstein, B.; Kirkpatrick, S.I.; Amog, K.; Wolfson, C.; Kirkland, S.; Griffith, L.E.; Raina, P. Validity and reliability of a short diet questionnaire to estimate dietary intake in older adults in a subsample of the Canadian Longitudinal Study on Aging. Nutrients 2018, 10, 1522. [Google Scholar] [CrossRef] [Green Version]
- Erkkilä, A.T.; Järvinen, R.; Karvonen, H.; Keronen, L.; Tuppurainen, M.T. Validation of a semi-quantitative FFQ using food records as a reference in older women in the Kuopio Fracture Prevention Study (OSTPRE-FPS). Public Health Nutr. 2011, 15, 635–639. [Google Scholar] [CrossRef]
- Watanabe, D.; Nanri, H.; Yoshida, T.; Yamaguchi, M.; Sugita, M.; Nozawa, Y.; Okabe, Y.; Itoi, A.; Goto, C.; Yamada, Y.; et al. Validation of energy and nutrition intake in Japanese elderly individuals estimated based on a short food frequency questionnaire compared against a 7-day dietary record: The Kyoto-Kameoka Study. Nutrients 2019, 11, 688. [Google Scholar] [CrossRef] [Green Version]
- Dumartheray, E.W.; Krieg, M.A.; Cornuz, J.; Whittamore, D.R.; Lovell, D.P.; Butckhardt, P.; Lanham-New, S.A. Validation and reproducibility of a semi-quantitative food frequency questionnaire for use in elderly Swiss women. J. Hum. Nutr. Diet. 2006, 19, 321–330. [Google Scholar] [CrossRef]
- Fernández-Ballart, J.D.; Piñol, J.L.; Zazpe, I.; Corella, D.; Carrasco, P.; Toledo, E.; Perez-Bauer, M.; Martínez-Gonzáles, J.; Martín-Moreno, J.M. Relative validity of a semi-quantitative food-frequency questionnaire in an elderly Mediterranean population in Spain. Br. J. Nutr. 2010, 103, 1808–1816. [Google Scholar] [CrossRef] [Green Version]
- Freedman, L.S.; Commins, J.M.; Moler, J.E.; Arab, L.; Baer, D.J.; Kipnis, V.; Midthune, D.; Moshfegh, A.J.; Neuhouser, M.L.; Prentice, R.L.; et al. Pooled results from 5 validation studies of dietary self-report instruments using recovery biomarkers for energy and protein intake. Am. J. Epidemiol. 2014, 180, 172–188. [Google Scholar] [CrossRef] [Green Version]
- Freedman, L.S.; Commins, J.M.; Willett, W.; Tinker, L.F.; Spiegelman, D.; Rhodes, D.; Potischman, N.; Neuhouser, M.L.; Moshfegh, A.J.; Kipnis, V.; et al. Evaluation of the 24-Hour Recall as a Reference Instrument for Calibrating Other Self-Report Instruments in Nutritional Cohort Studies: Evidence From the Validation Studies Pooling Project. Am. J. Epidemiol. 2017, 186, 73–82. [Google Scholar] [CrossRef] [PubMed] [Green Version]
- Shahar, D.; Fraser, D.; Shai, I.; Vardi, H. Development of a food frequency questionnaire (FFQ) for an elderly population based on a population survey. Nutr. Epidemiol. 2003, 133, 3625–3629. [Google Scholar] [CrossRef] [PubMed]
- Timon, C.M.; Cooper, S.E.; Barker, M.E.; Astell, A.J.; Adlam, T.; Hwang, F.; Williams, E.A. A comparison of food portion size estimation by older adults, young adults and nutritionists. J. Nutr. Health Aging 2018, 22, 230–236. [Google Scholar] [CrossRef] [PubMed] [Green Version]
- Vilela, S.; Lopes, C.; Guiomar, S.; Severo, M.; Rangelova, L.; Petrova, S.; Horváth, Z.; Cseh, J.; Schweter, A.; Lindtner, O.; et al. Validation of a picture book to be used in a pan-European dietary survey. Public Health Nutr. 2018, 21, 1654–1663. [Google Scholar] [CrossRef] [PubMed] [Green Version]
- Cade, J.; Thompson, R.; Burley, V.; Warm, D. Development, validation and utilisation of food-frequency questionnaires—A review. Public Health Nutr. 2002, 5, 567–587. [Google Scholar] [CrossRef] [Green Version]


| Characteristic | Validation Sample | Total FFQ Sample |
|---|---|---|
| N | 88 | 1399 |
| Age (year) (mean (SD)) | 71.9 (8.6) | 69.5 (8.6) |
| Age (year) (minimum-maximum) | 58.0–88.4 | 56.8–101.8 |
| Female (%) | 54.5 | 52.7 |
| Marital status (%) | ||
| Married or registered partnership | 64.8 | 71.8 |
| Not married | 8.0 | 7.6 |
| Widowed or divorced | 27.2 | 20.6 |
| Educational level (%) | ||
| Low education | 12.5 | 12.2 |
| Middle education | 70.5 | 58.4 |
| High education | 17.0 | 29.4 |
| Smoking status (%) | ||
| Never smoker | 30.7 | 26.9 |
| Former smoker | 56.8 | 58.2 |
| Current smoker | 10.2 | 11.3 |
| Missing | 2.3 | 3.6 |
| Number of chronic diseases (%) | ||
| No chronic diseases | 11.4 | 15.9 |
| One chronic disease | 25.0 | 28.0 |
| ≥2 chronic diseases | 63.6 | 56.1 |
| Elevated waist circumference (%) * | 81.8 | 80.5 |
| MMSE score (mean (SD)) | 28.4 (1.5) | 28.3 (1.9) |
| Absolute Intake | Group-Level Bias | ||||
|---|---|---|---|---|---|
| FFQ | 24-Hour Dietary Recalls | ||||
| Mean | SD | Mean | SD | % | |
| Energy (kcal) | 2097 | 579 | 2021 | 533 | 3.8 |
| Macronutrients | |||||
| Protein (en%) | 15.6 | 2.9 | 15.5 | 2.7 | 0.8 |
| Total (g) | 81.1 | 24.2 | 77.5 | 21.7 | 4.7 |
| Vegetable (g) | 30.4 | 9.8 | 30.2 | 10.9 | 0.4 |
| Animal (g) | 50.7 | 19.9 | 47.3 | 15.1 | 7.3 |
| Fat (en%) | 34.2 | 6.1 | 33.3 | 6.2 | 2.6 |
| Total (g) | 80.5 | 28.9 | 75.6 | 27.1 | 6.5 |
| SFA (g) | 31.3 | 13.2 | 31.4 | 12.8 | −0.3 |
| PUFA (g) | 29.8 | 11.3 | 14.1 | 6.7 | 7.0 * |
| MUFA (g) | 17.2 | 7.8 | 27.8 | 10.9 | 21.4 |
| n-3 FA (g) | 2.3 | 1.1 | 1.9 | 0.9 | 20.5 * |
| n-6 FA (g) | 14.5 | 6.7 | 11.9 | 5.89 | 22.0 * |
| ALA (g) | 2.0 | 0.9 | 1.7 | 0.82 | 20.9 * |
| EPA (g) | 0.1 | 0.1 | 0.1 | 0.1 | 31.3 * |
| DHA (g) | 0.1 | 0.1 | 0.1 | 0.2 | 16.8 * |
| Carbohydrates (en%) | 40.6 | 7.8 | 41.5 | 7.0 | −2.2 |
| Total (g) | 212.0 | 72.7 | 207.3 | 58.8 | 2.3 |
| Polysaccharides (g) | 109.6 | 38.9 | 115.2 | 39.9 | −4.8 |
| Mono/di-saccharides (g) | 102.2 | 47.3 | 91.9 | 35.4 | 11.2 |
| Dietary fibre (g) | 22.2 | 7.0 | 21.5 | 7.1 | 3.5 |
| Alcohol (en%) | 4.8 | 6.2 | 5.0 | 5.6 | −3.7 |
| Alcohol (g) | 14.1 | 18.3 | 15.1 | 18.7 | −6.6 |
| Micronutrients | |||||
| Calcium (mg) | 1060.8 | 418.0 | 957.6 | 336.0 | 10.8 |
| Iron (mg) | 11.1 | 3.0 | 10.9 | 3.5 | 1.9 |
| Haem (mg) | 1.2 | 0.7 | 1.1 | 0.8 | 4.0 |
| Non-haem (mg) | 9.9 | 2.7 | 9.8 | 3.4 | 1.6 |
| Retinol (µg) | 851.5 | 882.0 | 708.9 | 553.1 | 20.1 |
| β-carotene (µg) | 2393.3 | 1472.0 | 2250.2 | 2431.7 | 6.4 |
| Vit B1 (mg) | 1.1 | 0.4 | 1.0 | 0.5 | 5.4 |
| Vit B2 (mg) | 1.5 | 0.6 | 1.4 | 0.5 | 8.1 |
| Vit B6 (mg) | 1.7 | 0.6 | 1.6 | 0.6 | 9.4 |
| Vit B12 (µg) | 5.8 | 4.2 | 4.7 | 3.2 | 23.8 * |
| Vit C (mg) | 139.4 | 70.7 | 101.8 | 58.5 | 36.9 ** |
| Vit D (µg) | 3.8 | 2.1 | 3.3 | 2.1 | 15.5 * |
| Folate (µg) | 282.9 | 80.6 | 252.4 | 80.7 | 12.1 * |
| Phosphorous (mg) | 1526.7 | 447.7 | 1407.1 | 409.0 | 8.5 * |
| Magnesium (mg) | 360.6 | 93.0 | 340.0 | 105.0 | 6.1 * |
| Zinc (mg) | 11.0 | 3.5 | 10.4 | 3.1 | 5.5 |
| Water (g) | 2439.9 | 707.3 | 2502 | 849 | −2.5 |
| Food groups (g) | |||||
| Meat | 86.9 | 51.7 | 100.1 | 59.5 | −13.2 * |
| Fish | 20.3 | 18.8 | 16.5 | 29.7 | 23.0 |
| Eggs | 16.2 | 17.0 | 13.2 | 17.2 | 22.4 |
| Dairy products | 363.5 | 269.4 | 295.0 | 168.9 | 23.2 * |
| Fruit | 227.2 | 166.0 | 144.0 | 111.8 | 57.8 ** |
| Vegetables | 155.6 | 93.3 | 160.7 | 117.1 | −3.2 |
| Nuts/seeds | 13.2 | 15.7 | 9.3 | 16.6 | 41.5 * |
| Potatoes | 86.5 | 71.8 | 97.7 | 103.5 | −11.4 |
| Legumes | 15.5 | 25.6 | 9.8 | 45.3 | 59.2 ** |
| Grains | 45.6 | 36.2 | 46.9 | 54.4 | −2.8 |
| Bread | 124.6 | 59.4 | 120.9 | 47.7 | 3.0 |
| Alcoholic beverages | 151.9 | 197.9 | 173.2 | 245.5 | −12.3 |
| Non-alcoholic beverages | 1335.1 | 580.1 | 1526.3 | 710.9 | −12.5 * |
| Sugar/sweets | 30.6 | 27.8 | 29.3 | 25.4 | 4.6 |
| Cakes/cookies | 27.0 | 22.1 | 40.6 | 30.5 | −33.4 ** |
| Fast food/snacks | 20.6 | 23.6 | 37.4 | 55.7 | −45.0 |
| Soups | 51.7 | 65.6 | 55.9 | 82.2 | −7.6 |
| Pearson’s Correlation Coefficient * | Attenuation Factor | De-Attenuated Correlation Coefficient | Agreement | ||||
|---|---|---|---|---|---|---|---|
| Same or Adjacent Quintile | Extreme Quintile | ||||||
| 95% CI | 95% CI | % | % | ||||
| Energy (kcal) | 0.32 | 0.13; 0.53 | 0.31 | 0.08; 0.53 | 0.46 | 63 | 2 |
| Macronutrients | |||||||
| Protein (en%) | |||||||
| Total (g) | 0.39 | 0.12; 0.62 | 0.43 | 0.21; 0.65 | 0.54 | 63 | 5 |
| Vegetable (g) | 0.49 | 0.31; 0.64 | 0.47 | 0.30; 0.63 | 0.65 | 77 | 2 |
| Animal (g) | 0.41 | 0.18; 0.59 | 0.46 | 0.23; 0.73 | 0.82 | 73 | 3 |
| Fat (en%) | |||||||
| Total (g) | 0.26 | 0.06; 0.47 | 0.28 | 0.07; 0.50 | 0.41 | 72 | 7 |
| SFA (g) | 0.43 | 0.17; 0.66 | 0.45 | 0.25; 0.64 | 0.67 | 74 | 5 |
| PUFA (g) | 0.26 | 0.07; 0.46 | 0.28 | 0.06; 0.51 | 0.38 | 72 | 7 |
| MUFA (g) | 0.20 | 0.04; 0.34 | 0.19 | 0.02; 0.40 | 0.34 | 57 | 7 |
| n-3 FA (g) | 0.32 | 0.11; 0.52 | 0.32 | 0.09; 0.56 | 0.51 | 66 | 5 |
| n-6 FA (g) | 0.28 | 0.06; 0.47 | 0.29 | 0.08; 0.51 | 0.41 | 65 | 6 |
| ALA (g) | 0.32 | 0.09; 0.49 | 0.29 | 0.06; 0.51 | 0.47 | 60 | 2 |
| EPA (g) | 0.21 | 0.01; 0.40 | 0.14 | 0.01; 0.27 | 0.46 | 68 | 9 |
| DHA (g) | 0.21 | 0.03; 0.45 | 0.06 | 0.08; 0.19 | 0.61 | 60 | 6 |
| Carbohydrates (en%) | |||||||
| Total (g) | 0.41 | 0.24; 0.58 | 0.45 | 0.20; 0.69 | 0.62 | 63 | 1 |
| Polysaccharides (g) | 0.51 | 0.35; 0.66 | 0.46 | 0.28; 0.65 | 0.73 | 75 | 0 |
| Mono/di-saccharides (g) | 0.53 | 0.35; 0.65 | 0.54 | 0.28; 0.81 | 0.71 | 69 | 2 |
| Dietary fibre (g) | 0.43 | 0.24; 0.59 | 0.43 | 0.24; 0.62 | 0.57 | 69 | 3 |
| Alcohol (en%) | |||||||
| Alcohol (g) | 0.72 | 0.57; 0.87 | 0.65 | 0.50; 0.81 | 0.93 | 91 | 1 |
| Micronutrients | |||||||
| Calcium (mg) | 0.45 | 0.23; 0.62 | 0.47 | 0.22; 0.71 | 0.61 | 73 | 1 |
| Iron (mg) | 0.43 | 0.23; 0.60 | 0.41 | 0.23; 0.57 | 0.60 | 67 | 2 |
| Haem (mg) | 0.50 | 0.20; 0.69 | 0.34 | 0.14; 0.54 | 1.12 | 65 | 3 |
| Non-haem (mg) | 0.47 | 0.28; 0.63 | 0.40 | 0.25; 0.55 | 0.61 | 74 | 1 |
| Retinol (µg) | 0.42 | 0.17; 0.56 | 0.34 | 0.01; 0.68 | 1.08 | 69 | 5 |
| β-carotene (µg) | 0.08 | 0.13; 0.28 | 0.03 | 0.10; 0.16 | 0.15 | 55 | 6 |
| Vit B1 (mg) | 0.19 | 0.03; 0.38 | 0.12 | 0.05; 0.29 | 0.46 | 68 | 6 |
| Vit B2 (mg) | 0.45 | 0.25; 0.60 | 0.51 | 0.27; 0.75 | 0.60 | 56 | 2 |
| Vit B6 (mg) | 0.27 | 0.05; 0.47 | 0.27 | 0.05; 0.48 | 0.58 | 65 | 2 |
| Vit B12 (µg) | 0.50 | 0.28; 0.67 | 0.44 | 0.18; 0.71 | 0.96 | 67 | 2 |
| Vit C (mg) | 0.44 | 0.29; 0.61 | 0.56 | 0.33; 0.79 | 0.96 | 72 | 6 |
| Vit D (µg) | 0.44 | 0.11; 0.80 | 0.22 | 0.01; 0.42 | 0.72 | 64 | 3 |
| Folate (µg) | 0.34 | 0.14; 0.51 | 0.34 | 0.13; 0.54 | 0.50 | 64 | 5 |
| Phosphorous (mg) | 0.34 | 0.14; 0.61 | 0.40 | 0.18; 0.62 | 0.43 | 69 | 6 |
| Magnesium (mg) | 0.46 | 0.26; 0.62 | 0.41 | 0.24; 0.58 | 0.58 | 67 | 1 |
| Zinc (mg) | 0.36 | 0.13; 0.61 | 0.41 | 0.18; 0.63 | 0.58 | 72 | 3 |
| Water (g) | 0.44 | 0.24; 0.60 | 0.48 | 0.34; 0.62 | 0.54 | 77 | 0 |
| Food groups (g) | |||||||
| Meat | 0.44 | 0.22; 0.63 | 0.34 | 0.22; 0.55 | 0.96 | 74 | 5 |
| Fish | 0.14 | 0.07; 0.34 | 0.09 | 0.05; 0.22 | 0.49 | 50 | 15 |
| Eggs | 0.26 | 0.05; 0.50 | 0.26 | 0.06; 0.47 | 0.92 | 55 | 6 |
| Dairy products | 0.49 | 0.34; 0.68 | 0.78 | 0.48;1.08 | 0.69 | 87 | 3 |
| Fruit | 0.34 | 0.17; 0.53 | 0.50 | 0.20; 0.80 | 0.50 | 73 | 3 |
| Vegetables | 0.34 | 0.15; 0.48 | 0.27 | 0.11; 0.43 | 0.51 | 59 | 2 |
| Nuts/seeds | 0.49 | 0.26; 0.72 | 0.46 | 0.29; 0.64 | 0.93 | 75 | 6 |
| Potatoes | 0.45 | 0.24; 0.72 | 0.31 | 0.18; 0.45 | 0.74 | 67 | 3 |
| Legumes | 0.34 | 0.07; 0.67 | 0.19 | 0.08; 0.31 | 0.46 | 83 | 16 |
| Grains | 0.24 | 0.08; 0.40 | 0.20 | 0.03; 0.38 | 0.31 | 65 | 6 |
| Bread | 0.53 | 0.34; 0.69 | 0.66 | 0.44; 0.87 | 0.81 | 73 | 1 |
| Alcoholic beverages | 0.78 | 0.55; 0.90 | 0.63 | 0.52; 0.74 | 1.08 | 86 | 1 |
| Non-alcoholic beverages | 0.70 | 0.56; 0.82 | 0.57 | 0.45; 0.70 | 0.85 | 77 | 0 |
| Sugar/sweets | 0.42 | 0.24; 0.65 | 0.46 | 0.25; 0.68 | 0.86 | 65 | 1 |
| Cakes/cookies | 0.38 | 0.16; 0.58 | 0.27 | 0.13; 0.42 | 0.79 | 74 | 5 |
| Fast food/snacks | 0.34 | 0.10; 0.65 | 0.14 | 0.06; 0.23 | 1.08 | 57 | 7 |
| Soups | 0.28 | 0.09; 0.49 | 0.22 | 0.06; 0.34 | 1.14 | 75 | 6 |
© 2020 by the authors. Licensee MDPI, Basel, Switzerland. This article is an open access article distributed under the terms and conditions of the Creative Commons Attribution (CC BY) license (http://creativecommons.org/licenses/by/4.0/).
Share and Cite
Visser, M.; Elstgeest, L.E.M.; Winkens, L.H.H.; Brouwer, I.A.; Nicolaou, M. Relative Validity of the HELIUS Food Frequency Questionnaire for Measuring Dietary Intake in Older Adult Participants of the Longitudinal Aging Study Amsterdam. Nutrients 2020, 12, 1998. https://0-doi-org.brum.beds.ac.uk/10.3390/nu12071998
Visser M, Elstgeest LEM, Winkens LHH, Brouwer IA, Nicolaou M. Relative Validity of the HELIUS Food Frequency Questionnaire for Measuring Dietary Intake in Older Adult Participants of the Longitudinal Aging Study Amsterdam. Nutrients. 2020; 12(7):1998. https://0-doi-org.brum.beds.ac.uk/10.3390/nu12071998
Chicago/Turabian StyleVisser, Marjolein, Liset E. M. Elstgeest, Laura H. H. Winkens, Ingeborg A. Brouwer, and Mary Nicolaou. 2020. "Relative Validity of the HELIUS Food Frequency Questionnaire for Measuring Dietary Intake in Older Adult Participants of the Longitudinal Aging Study Amsterdam" Nutrients 12, no. 7: 1998. https://0-doi-org.brum.beds.ac.uk/10.3390/nu12071998