Hypoalbuminemia on Admission as an Independent Risk Factor for Acute Functional Decline after Infection

 , , and
Abstract
:1. Introduction
2. Materials and Methods
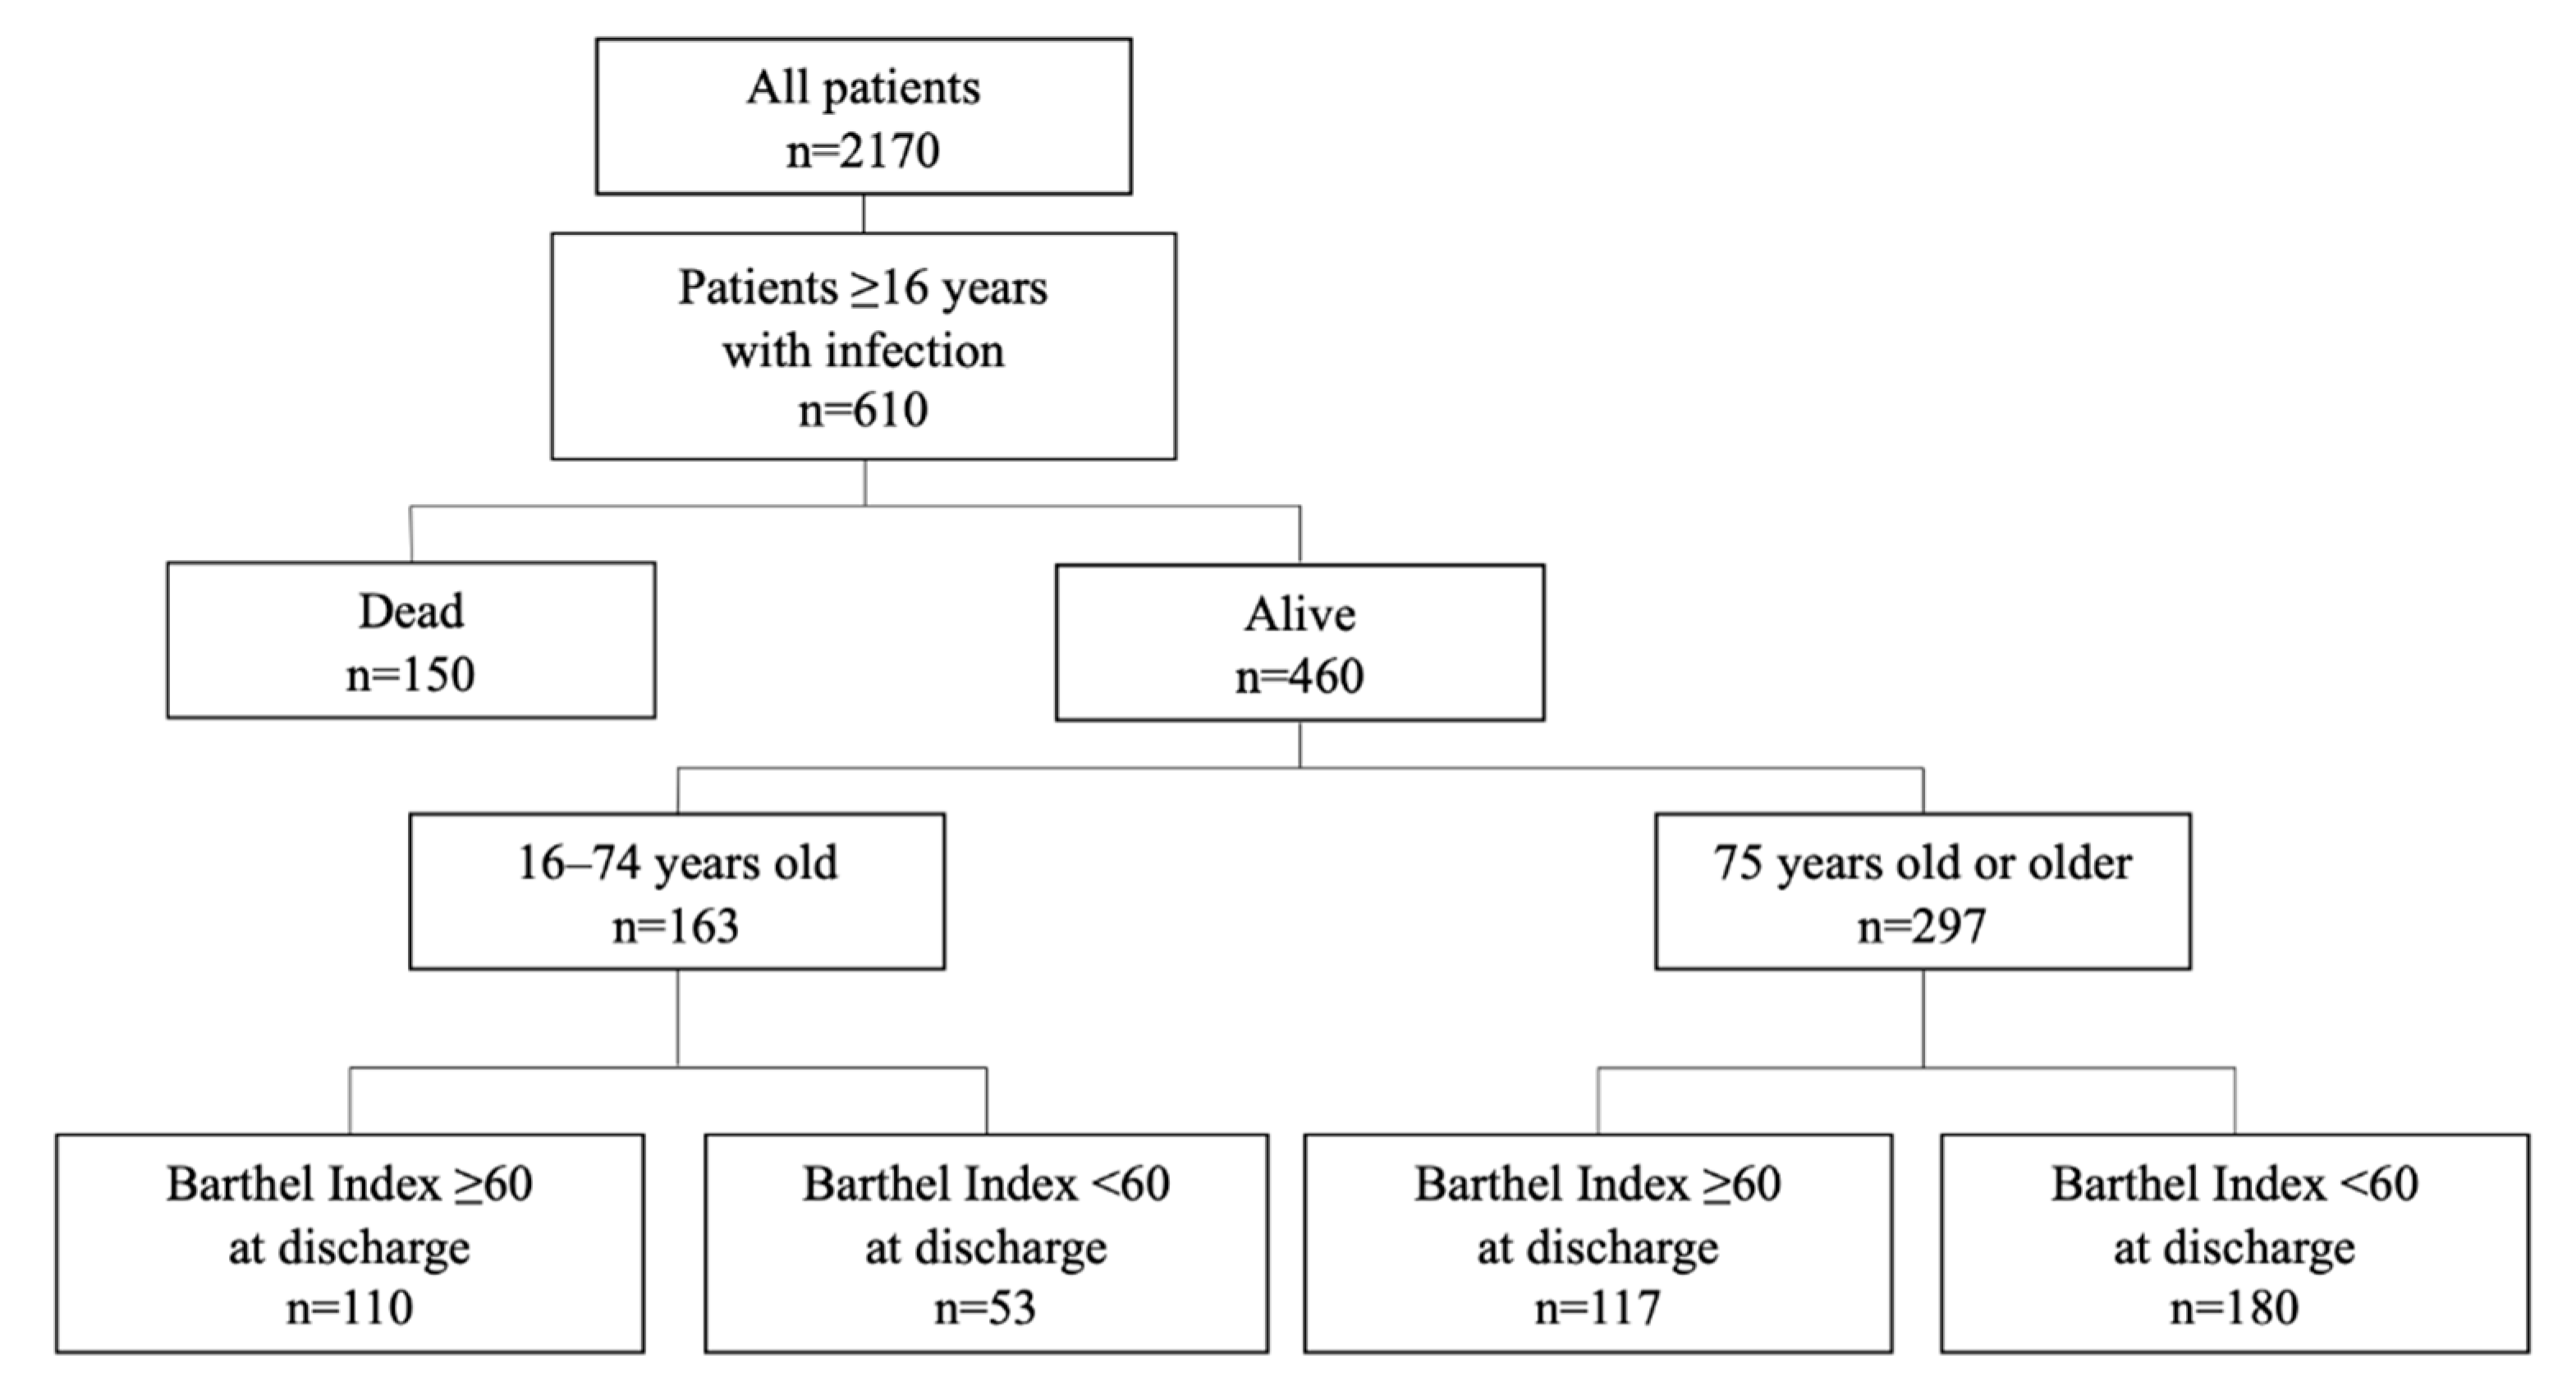
2.1. Study Design and Participants
2.2. Data Collection
2.3. Outcome Evaluation
2.4. Statistical Analysis
3. Results
3.1. Descriptives
3.2. Acute Functional Decline and Basic Characteristics
3.3. Acute Functional Decline and Laboratory Data on Admission
3.4. Risk Factors for Acute Functional Decline
4. Discussion
5. Conclusions
Supplementary Materials
Author Contributions
Funding
Institutional Review Board Statement
Informed Consent Statement
Data Availability Statement
Acknowledgments
Conflicts of Interest
References
- Inoue, S.; Hatakeyama, J.; Kondo, Y.; Hifumi, T.; Sakuramoto, H.; Kawasaki, T.; Taito, S.; Nakamura, K.; Unoki, T.; Kawai, Y.; et al. Post-intensive care syndrome: Its pathophysiology, prevention, and future directions. Acute Med. Surg. 2019, 6, 233–246. [Google Scholar] [CrossRef] [PubMed] [Green Version]
- Kress, J.P.; Hall, J.B. ICU-acquired weakness and recovery from critical illness. N. Engl. J. Med. 2014, 371, 287–288. [Google Scholar] [CrossRef] [PubMed] [Green Version]
- Patel, B.K.; Pohlman, A.S.; Hall, J.B.; Kress, J.P. Impact of early mobilization on glycemic control and ICU-acquired weakness in critically ill patients who are mechanically ventilated. Chest 2014, 146, 583–589. [Google Scholar] [CrossRef] [PubMed]
- Nakamura, K.; Azuhata, T.; Yokota, H.; Morimura, N. The swallowing problem after acute care in the elderly patients. J. Jpn. Assoc. Acute Med. 2019, 30, 103–109. [Google Scholar]
- Morley, J.E. Frailty and Sarcopenia: The New Geriatric Giants. Rev. Investig. Clin. 2016, 68, 59–67. [Google Scholar]
- Iwashyna, T.J.; Ely, E.W.; Smith, D.M.; Langa, K.M. Long-term cognitive impairment and functional disability among survivors of severe sepsis. JAMA 2010, 304, 1787–1794. [Google Scholar] [CrossRef] [Green Version]
- Martin, G.S.; Mannino, D.M.; Moss, M. The effect of age on the development and outcome of adult sepsis. Crit. Care Med. 2006, 34, 15–21. [Google Scholar] [CrossRef]
- Schefold, J.C.; Bierbrauer, J.; Weber-Carstens, S. Intensive care unit-acquired weakness (ICUAW) and muscle wasting in critically ill patients with severe sepsis and septic shock. J. Cachexia Sarcopenia Muscle 2010, 1, 147–157. [Google Scholar] [CrossRef] [Green Version]
- Allingstrup, M.J.; Kondrup, J.; Wiis, J.; Claudius, C.; Pedersen, U.G.; Hein-Rasmussen, R.; Bjerregaard, M.R.; Steensen, M.; Jensen, T.H.; Lange, T.; et al. Early goal-directed nutrition versus standard of care in adult intensive care patients: The single-centre, randomised, outcome assessor-blinded EAT-ICU trial. Intensiv. Care. Med. 2017, 43, 1637–1647. [Google Scholar] [CrossRef]
- Cruz-Jentoft, A.J.; Baeyens, J.P.; Bauer, J.M.; Boirie, Y.; Cederholm, T.; Landi, F.; Martin, F.C.; Michel, J.P.; Rolland, Y.; Schneider, S.M. European Working Group on Sarcopenia in Older People. Sarcopenia: European consensus on definition and diagnosis: Report of the European Working Group on Sarcopenia in Older People. Age Ageing 2010, 39, 412–423. [Google Scholar] [CrossRef] [Green Version]
- Cesari, M.; Calvani, R.; Marzetti, E. Frailty in Older Persons. Clin. Geriatr. Med. 2017, 33, 293–303. [Google Scholar] [CrossRef] [PubMed]
- Lorenzo-López, L.; Maseda, A.; de Labra, C.; Regueiro-Folgueira, L.; Rodríguez-Villamil, J.L.; Millán-Calenti, J.C. Nutritional determinants of frailty in older adults: A systematic review. BMC Geriatr. 2017, 17, 108. [Google Scholar] [CrossRef] [PubMed] [Green Version]
- Houston, D.K.; Nicklas, B.J.; Ding, J.; Harris, T.B.; A Tylavsky, F.; Newman, A.B.; Lee, J.S.; Sahyoun, N.R.; Visser, M.; Kritchevsky, S.B.; et al. Health ABC study. Dietary protein intake is associated with lean mass change in older, community-dwelling adults: The Health, Aging, and Body Composition (Health ABC) Study. Am. J. Clin. Nutr. 2008, 87, 150–155. [Google Scholar] [CrossRef] [PubMed] [Green Version]
- Beasley, J.M.; LaCroix, A.Z.; Neuhouser, M.L.; Huang, Y.; Tinker, L.; Woods, N.; Michael, Y.; Curb, J.D.; Prentice, R.L. Protein intake and incident frailty in the Women’s Health Initiative observational study. J. Am. Geriatr. Soc. 2010, 58, 1063–1071. [Google Scholar] [CrossRef] [Green Version]
- De Saint-Hubert, M.; Schoevaerdts, D.; Cornette, P.; D’Hoore, W.; Boland, B.; Swine, C. Predicting functional adverse outcomes in hospitalized older patients: A systematic review of screening tools. J. Nutr. Health Aging 2010, 14, 394–399. [Google Scholar] [CrossRef]
- Inouye, S.K.; Wagner, D.R.; Acampora, D.; Horwitz, R.I.; Cooney, L.M.; Hurst, L.D.; Tinetti, M.E. A predictive index for functional decline in hospitalized elderly medical patients. J. Gen. Intern. Med. 1993, 8, 645–652. [Google Scholar] [CrossRef]
- Nishimura, H.; Uragami, Y. Kaifukuki rehabilitation wo okonatta kourei kossetsu kanja ni okeru kaigohoken no kenntou -youkaigodo to taiinn tennki no kannkei- [Long-term care insurance considerations in elderly fracture patients undergoing recovery rehabilitation] (In Japanese). Orthop. Traumatol. 2020, 69, 843–848. [Google Scholar]
- De Ulíbarri, J.I.; González-Madroño, A.; De Villar, N.G.P.; González, P.; González, B.; Mancha, A.; Rodríguez, F.; Fernández, G. CONUT: A tool for controlling nutritional status. First validation in a hospital population. Nutr. Hosp. 2005, 20, 38–45. [Google Scholar]
- Collin, C.; Wade, D.T.; Davies, S.; Horne, V. The Barthel ADL Index: A reliability study. Int. Disabil. Stud. 1988, 10, 61–63. [Google Scholar] [CrossRef]
- Suárez-Dono, J.; Cervantes-Pérez, E.; Pena-Seijo, M.; Formigo-Couceiro, F.; Ferrón-Vidán, F.; Novo-Veleiro, I.; Del Corral-Beamonte, E.; Diez-Manglano, J.; Gude-Sampedro, F.; Pose-Reino, A. CRONIGAL: Prognostic index for chronic patients after hospital admission. Eur. J. Intern. Med. 2016, 36, 25–31. [Google Scholar] [CrossRef]
- Orimo, H. Reviewing the definition of elderly. Geriatr. Gerontolo. Int. 2006, 43, 27–34. [Google Scholar] [CrossRef]
- Huang, W.; Sun, Y.; Xing, Y.; Wang, C. Functional impairment and serum albumin predict in-hospital mortality in nonagenarians with acute infection: A retrospective cohort study. BMC Geriatr. 2019, 19, 269. [Google Scholar] [CrossRef] [PubMed] [Green Version]
- Takagi, K.; Domagala, P.; Polak, W.G.; Buettner, S.; Wijnhoven, B.P.L.; Ijzermans, J.N.M. Prognostic significance of the controlling nutritional status (CONUT) score in patients undergoing gastrectomy for gastric cancer: A systematic review and meta-analysis. BMC Surg. 2019, 19, 129. [Google Scholar] [CrossRef] [PubMed] [Green Version]
- Lee, J.S.; Choi, H.S.; Ko, Y.G.; Yun, D.H. Performance of the Geriatric Nutritional Risk Index in predicting 28-day hospital mortality in older adult patients with sepsis. Clin. Nutr. 2013, 32, 843–848. [Google Scholar] [CrossRef]
- Cabrerizo, S.; Cuadras, D.; Gomez-Busto, F.; Artaza-Artabe, I.; Marín-Ciancas, F.; Malafarina, V. Serum albumin and health in older people: Review and meta analysis. Maturitas 2015, 81, 17–27. [Google Scholar] [CrossRef]
- Moshage, H.J.; Janssen, J.A.; Franssen, J.H.; Hafkenscheid, J.C.; Yap, S.H. Study of the molecular mechanism of decreased liver synthesis of albumin in inflammation. J. Clin. Investig. 1987, 79, 1635–1641. [Google Scholar] [CrossRef]
- Garwe, T.; Albrecht, R.M.; Stoner, J.A.; Mitchell, S.; Motghare, P. Hypoalbuminemia at admission is associated with increased incidence of in-hospital complications in geriatric trauma patients. Am. J. Surg. 2016, 212, 109–115. [Google Scholar] [CrossRef] [Green Version]
- Sullivan, D.H. What do the serum proteins tell us about our elderly patients? J. Gerontol. A Biol. Sci. Med. Sci. 2001, 56, M71–M74. [Google Scholar] [CrossRef] [Green Version]
- Sung, J.; Bochicchio, G.V.; Joshi, M.; Bochicchio, K.; Costas, A.; Tracy, K.; Scalea, T.M. Admission serum albumin is predicitve of outcome in critically ill trauma patients. Am. Surg. 2004, 70, 1099–1102. [Google Scholar]
- Baumgartner, R.N.; Koehler, K.M.; Romero, L.; Garry, P.J. Serum albumin is associated with skeletal muscle in elderly men and women. Am. J. Clin. Nutr. 1996, 64, 552–558. [Google Scholar] [CrossRef]
- Visser, M.; Kritchevsky, S.B.; Newman, A.B.; Goodpaster, B.H.; Tylavsky, F.A.; Nevitt, M.C. Lower serum albumin concentration and change in muscle mass: The Health, Aging and Body Composition Study. Am. J. Clin. Nutr. 2005, 82, 531–537. [Google Scholar] [PubMed] [Green Version]
- Casaer, M.P. Muscle weakness and nutrition therapy in ICU. Curr. Opin. Clin. Nutr. Metab. Care 2015, 18, 162–168. [Google Scholar] [CrossRef] [PubMed]
- Yamada, M.; Kimura, Y.; Ishiyama, D.; Nishio, N.; Abe, Y.; Kakehi, T.; Fujimoto, J.; Tanaka, T.; Ohji, S.; Otobe, Y.; et al. Differential Characteristics of Skeletal Muscle in Community-Dwelling Older Adults. J. Am. Med. Dir. Assoc. 2017, 18, 807.e9–807.e16. [Google Scholar] [CrossRef] [PubMed]
- Needham, D.M.; Dinglas, V.D.; Morris, P.E.; Jackson, J.C.; Hough, C.L.; Mendez-Tellez, P.A.; Wozniak, A.W.; Colantuoni, E.; Ely, E.W.; Rice, T.W.; et al. Physical and cognitive performance of patients with acute lung injury 1 year after initial trophic versus full enteral feeding. EDEN trial follow-up. Am. J. Respir. Crit. Care Med. 2013, 188, 567–576. [Google Scholar] [CrossRef]
- Cruz-Jentoft, A.J.; Bahat, G.; Bauer, J.; Boirie, Y.; Bruyère, O.; Cederholm, T.; Cooper, C.; Landi, F.; Rolland, Y.; Sayer, A.A.; et al. Writing Group for the European Working Group on Sarcopenia in Older People (EWGSOP2), and the Extended Group for EWGSOP2. Sarcopenia: Revised European consensus on definition and diagnosis. Age Ageing 2019, 48, 601. [Google Scholar] [CrossRef] [Green Version]
- Landi, F.; Camprubi-Robles, M.; Bear, D.E.; Cederholm, T.; Malafarina, V.; Welch, A.A.; Cruz-Jentoft, A.J. Muscle loss: The new malnutrition challenge in clinical practice. Clin. Nutr. 2019, 38, 2113–2120. [Google Scholar] [CrossRef] [Green Version]
- Cederholm, T.; Barazzoni, R.; Austin, P.D.P.; Ballmer, P.P.; Biolo, G.; Bischoff, S.C.; Compher, C.; Mitd, C.; Higashiguchi, T.T.; Holst, M.M.; et al. ESPEN guidelines on definitions and terminology of clinical nutrition. Clin. Nutr. 2017, 36, 49–64. [Google Scholar] [CrossRef]
- Puthucheary, Z.A.; Rawal, J.; McPhail, M.; Connolly, B.; Ratnayake, G.; Chan, P.; Hopkinson, N.S.; Phadke, R.; Dew, T.; Sidhu, P.S.; et al. Acute skeletal muscle wasting in critical illness. JAMA 2013, 310, 1591–1600. [Google Scholar] [CrossRef] [Green Version]
- Wu, A.W.; Yasui, Y.; Alzola, C.; Galanos, A.N.; Tsevat, J.; Phillips, R.S.; Connors, A.F., Jr.; Teno, J.M.; Wenger, N.S.; Lynn, J. Predicting functional status outcomes in hospitalized patients aged 80 years and older. J. Am. Geriatr. Soc. 2000, 48, S6–S15. [Google Scholar] [CrossRef]
- Norman, K.; Pichard, C.; Lochs, H.; Pirlich, M. Prognostic impact of disease-related malnutrition. Clin. Nutr. 2008, 27, 5–15. [Google Scholar] [CrossRef]


| Overall | -64 | 65–74 | 75–84 | 85- | p | |
|---|---|---|---|---|---|---|
| n | 610 | 101 | 107 | 216 | 186 | |
| Age (years) | 80.0 (70.0–86.0) | 56.0 (46.0–60.0) | 70.0 (68.0–72.5) | 80.0 (78.0–82.0) | 89.0 (87.0–92.0) | <0.001 * |
| Male | 383 (62.8) | 62 (61.4) | 76 (71.0) | 133 (61.6) | 112 (60.2) | 0.277 |
| Survival discharge | 460 (75.4) | 83 (82.2) | 80 (74.8) | 163 (75.5) | 134 (72.0) | 0.301 |
| SOFA score | 5.0 (3.0–8.0) | 6.0 (3.0–9.0) | 5.0 (3.0–9.0) | 5.0 (3.0–8.0) | 4.0 (2.0–8.00) | 0.042 * |
| APACHE II score | 15.0 (11.0–21.0) | 14.0 (11.0–20.8) | 15.00 (10.0–21.0) | 16.0 (12.0–21.5) | 14.0 (11.0–19.0) | 0.154 |
| Need for care prior to admission † | 211 (43.5) | 3 (3.9) | 22 (27.8) | 72 (41.1) | 114 (73.5) | <0.001 * |
| Cognitive impairment | 145 (28.5) | 19 (24.1) | 11 (13.8) | 59 (32.1) | 56 (33.9) | 0.005 * |
| Length of hospitalization (days) | 9.0 (5.0–17.0) | 9.0 (3.0–15.0) | 9.0 (5.0–15.0) | 10.0 (6.0–18.0) | 9.0 (5.3–17.8) | 0.268 |
| ICU admission | 187 (30.7) | 37 (36.6) | 42 (39.3) | 76 (35.2) | 32 (17.2) | <0.001 * |
| Mechanical ventilation | 153 (25.1) | 27 (26.7) | 35 (32.7) | 66 (30.6) | 25 (13.4) | <0.001 * |
| Renal replacement therapy | 105 (17.2) | 24 (23.8) | 25 (23.4) | 34 (15.7) | 22 (11.8) | 0.019 * |
| Barthel Index ‡ | 55.0 (10.0–100.0) | 100.0 (67.5–100.0) | 67.5 (15.0–100.0) | 45.0 (0.0–85.0) | 30.0 (0.0–70.0) | <0.001 * |
| Barthel Index < 60 ‡ | 233 (50.7) | 17 (20.5) | 36 (45.0) | 94 (57.7) | 86 (64.2) | <0.001 * |
| Died | Survived | p | |
|---|---|---|---|
| n | 150 | 460 | |
| Age (years) | 81.0 (71.2–88.8) | 79.0 (69.0–85.2) | 0.011 * |
| Male | 107 (71.3) | 276 (60.0) | 0.017 * |
| SOFA score | 8.0 (5.0–11.0) | 4.0 (2.0–7.0) | <0.001 * |
| APACHE II score | 21.0 (14.0–25.0) | 14.0 (10.0–18.2) | <0.001 * |
| Need for care prior to admission † | 60 (52.2) | 151 (40.8) | 0.041 * |
| Cognitive impairment | 43 (35.8) | 102 (26.3) | 0.056 |
| Length of hospitalization (days) | 10.5 (4.0–20.0) | 9.0 (5.0–16.8) | 0.574 |
| ICU admission | 77 (51.3) | 110 (23.9) | <0.001 * |
| Mechanical ventilation | 71 (47.3) | 82 (17.8) | <0.001 * |
| Renal replacement therapy | 51 (34.0) | 54 (11.7) | <0.001 * |
| ALB (g/dL) | 2.5 (0.6) | 3.0 (0.7) | <0.001 * |
| CONUT score | 8.0 (6.0–10.0) | 6.0 (4.0–9.0) | <0.001 * |
| Overall | Patients Younger Than 75 Years | Patients Aged 75 Years or Older | |||||||
|---|---|---|---|---|---|---|---|---|---|
| Barthel Index ≥ 60 | Barthel Index < 60 | p | Barthel Index ≥ 60 | Barthel Index < 60 | p | Barthel Index ≥ 60 | Barthel Index < 60 | p | |
| n | 227 | 233 | 110 | 53 | 117 | 180 | |||
| Age (years) | 75.0 (62.5–83.0) | 81.0 (75.0–87.0) | <0.001 * | 62.0 (49.5–68.0) | 69.0 (61.0–71.0) | <0.001 * | 83.0 (78.0–87.0) | 84.0 (80.0–89.0) | 0.083 |
| Male | 139 (61.2) | 137 (58.8) | 0.662 | 72 (65.5) | 32 (60.4) | 0.647 | 67 (57.3) | 105 (58.3) | 0.951 |
| SOFA score | 4.0 (2.0–7.0) | 4.0 (3.0–7.0) | 0.189 | 4.0 (3.0–7.0) | 6.0 (4.0–8.0) | 0.017 * | 4.0 (2.0–6.3) | 4.0 (2.0–7.0) | 0.664 |
| APACHE II score | 12.0 (9.0–18.0) | 15.0 (11.0–19.0) | <0.001 * | 12.0 (7.0–17.0) | 16.0 (12.0–20.0) | 0.003 * | 13.0 (10.0–18.0) | 15.0 (11.0–19.0) | 0.065 |
| Need for care prior to admission † | 38 (19.9) | 113 (63.1) | <0.001 * | 1 (1.1) | 17 (44.7) | <0.001 * | 37 (35.9) | 96 (68.1) | <0.001 * |
| Cognitive impairment | 35 (17.8) | 67 (35.1) | <0.001 * | 15 (16.7) | 8 (21.6) | 0.685 | 20 (18.7) | 59 (38.3) | 0.001 * |
| Length of hospitalization (days) | 7.0 (4.0–12.0) | 11.5 (7.0–20.0) | <0.001 * | 6.0 (3.0–12.8) | 12.0 (8.0–18.0) | <0.001 * | 7.0 (4.0–11.0) | 11.0 (7.0–21.0) | <0.001 * |
| ICU admission | 53 (23.3) | 57 (24.5) | 0.864 | 29 (26.4) | 21 (39.6) | 0.124 | 24 (20.5) | 36 (20.0) | 1 |
| Mechanical ventilation | 36 (15.9) | 46 (19.7) | 0.334 | 20 (18.2) | 15 (28.3) | 0.204 | 16 (13.7) | 31 (17.2) | 0.512 |
| Renal replacement therapy | 27 (11.9) | 27 (11.6) | 1 | 16 (14.5) | 14 (26.4) | 0.106 | 11 (9.4) | 13 (7.2) | 0.649 |
| Overall | Patients Younger Than 75 Years | Patients Aged 75 Years or Older | |||||||
|---|---|---|---|---|---|---|---|---|---|
| Barthel Index ≥ 60 | Barthel Index < 60 | p | Barthel Index ≥ 60 | Barthel Index < 60 | p | Barthel Index ≥ 60 | Barthel Index < 60 | p | |
| n | 227 | 233 | 110 | 53 | 117 | 180 | |||
| WBC (*10^2/µL) | 96.0 (69.0–137.5) | 98.0 (69.0–139.0) | 0.956 | 94.0 (67.0–132.8) | 100.0 (88.0–186.0) | 0.012 * | 103.0 (74.0–141.0) | 92.0 (64.8–131.0) | 0.144 |
| Lymphocytes (/µL) | 932 (626–1355) | 750 (504–1353) | 0.019 * | 959 (720–1276) | 1248 (693–1764) | 0.159 | 900 (598–1458) | 724 (478–1168) | 0.008 * |
| HGB (g/dL) | 12.40 ± 2.37 | 11.50 ± 2.65 | <0.001 * | 12.89 ± 2.52 | 10.79 ± 2.97 | <0.001 * | 11.96 ± 2.14 | 11.71 ± 2.52 | 0.383 |
| PLT (*10^4/µL) | 18.0 (12.6–23.7) | 18.7 (13.0–25.6) | 0.313 | 18.5 (12.5–24.4) | 17.6 (12.6–29.4) | 0.921 | 17.4 (13.9–23.1) | 18.8 (13.3–25.0) | 0.22 |
| ALB (g/dL) | 3.10 ± 0.72 | 2.84 ± 0.70 | <0.001 * | 3.12 ± 0.78 | 2.73 ± 0.81 | 0.004 * | 3.08 ± 0.66 | 2.87 ± 0.66 | 0.006 * |
| TC (mg/dL) | 141 (111–170) | 139 (109–167) | 0.677 | 137 (106–162) | 135 (110–163) | 0.975 | 145 (113–179) | 143 (110–168) | 0.289 |
| T-Bil (mg/dL) | 0.8 (0.6–1.2) | 0.8 (0.5–1.2) | 0.225 | 0.7 (0.5–1.1) | 0.6 (0.4–1.1) | 0.19 | 0.9 (0.6–1.3) | 0.8 (0.6–1.2) | 0.131 |
| BUN (mg/dL) | 21.0 (15.0–31.8) | 25.1 (17.9–44.3) | 0.001 * | 18.5 (13.4–30.8) | 27.9 (15.8–58.9) | 0.004 * | 22.9 (16.7–33.3) | 24.8 (18.4–38.5) | 0.173 |
| CRE (mg/dL) | 1.04 (0.77, 1.71) | 1.03 (0.75, 1.79) | 0.703 | 0.97 (0.73, 1.50) | 1.05 (0.56, 4.08) | 0.574 | 1.10 (0.83, 1.79) | 1.02 (0.76, 1.67) | 0.174 |
| CRP (mg/dL) | 7.32 (1.43–16.84) | 7.18 (2.32–15.59) | 0.952 | 6.46 (1.21–18.49) | 11.40 (5.03–21.82) | 0.125 | 7.92 (1.79–15.80) | 6.83 (2.01–12.51) | 0.562 |
| PCT (ng/mL) | 0.49 (0.13–5.42) | 0.92 (0.21–6.57) | 0.401 | 0.48 (0.12–6.31) | 0.73 (0.19–4.70) | 0.865 | 0.51 (0.15–4.65) | 1.00 (0.21–6.93) | 0.394 |
| PT (sec) | 1.10 (1.00–1.20) | 1.10 (1.00–1.20) | 0.73 | 1.10 (1.00–1.20) | 1.10 (1.00–1.22) | 0.371 | 1.10 (1.00–1.20) | 1.10 (1.00–1.20) | 0.726 |
| CONUT score | 6.0 (3.0–9.0) | 7.0 (5.0–9.0) | 0.001 * | 6.0 (3.0–9.0) | 8.0 (6.0–10.0) | 0.127 | 5.0 (3.5–8.0) | 7.0 (5.0–9.0) | 0.003 * |
| Category | Crude OR | p Value | Adjusted OR | p |
|---|---|---|---|---|
| Age | 1.01 (1.01–1.01) | <0.001 * | 1.03 (1.00–1.06) | 0.022 * |
| Sex | 0.97 (0.89–1.07) | 0.595 | 1.04 (0.60–1.81) | 0.893 |
| SOFA | 1.01 (0.99–1.02) | 0.267 | ||
| APACHE II | 1.01 (1.00–1.01) | 0.12 | 1.03 (0.99–1.06) | 0.174 |
| Length of hospitalization | 1.00 (1.00–1.00) | 0.004 * | 1.00 (1.00–1.01) | 0.296 |
| Need for care prior to admission † | 1.56 (1.42–1.72) | <0.001 * | 5.92 (3.15–11.15) | <0.001 * |
| Cognitive impairment | 1.25 (1.12–1.40) | <0.001 * | 1.47 (0.79–2.73) | 0.225 |
| Lymphocytes ‡ | 1.00 (1.00–1.00) | 0.145 | ||
| HGB ‡ | 0.97 (0.95–0.98) | <0.001 * | 1.04 (0.92–1.17) | 0.57 |
| PLT ‡ | 1.00 (1.00–1.01) | 0.052 | 1.02 (0.99–1.05) | 0.144 |
| ALB ‡ | 0.88 (0.83–0.94) | <0.001 * | 0.63 (0.41–0.99) | 0.043 * |
| BUN ‡ | 1.00 (1.00–1.00) | 0.003 * | 1.01 (1.00–1.02) | 0.088 |
| CONUT | 1.03 (1.01–1.04) | 0.001 * |
Publisher’s Note: MDPI stays neutral with regard to jurisdictional claims in published maps and institutional affiliations. |
© 2020 by the authors. Licensee MDPI, Basel, Switzerland. This article is an open access article distributed under the terms and conditions of the Creative Commons Attribution (CC BY) license (http://creativecommons.org/licenses/by/4.0/).
Share and Cite
Nakano, H.; Hashimoto, H.; Mochizuki, M.; Naraba, H.; Takahashi, Y.; Sonoo, T.; Nakamura, K. Hypoalbuminemia on Admission as an Independent Risk Factor for Acute Functional Decline after Infection. Nutrients 2021, 13, 26. https://0-doi-org.brum.beds.ac.uk/10.3390/nu13010026
Nakano H, Hashimoto H, Mochizuki M, Naraba H, Takahashi Y, Sonoo T, Nakamura K. Hypoalbuminemia on Admission as an Independent Risk Factor for Acute Functional Decline after Infection. Nutrients. 2021; 13(1):26. https://0-doi-org.brum.beds.ac.uk/10.3390/nu13010026
Chicago/Turabian StyleNakano, Hidehiko, Hideki Hashimoto, Masaki Mochizuki, Hiromu Naraba, Yuji Takahashi, Tomohiro Sonoo, and Kensuke Nakamura. 2021. "Hypoalbuminemia on Admission as an Independent Risk Factor for Acute Functional Decline after Infection" Nutrients 13, no. 1: 26. https://0-doi-org.brum.beds.ac.uk/10.3390/nu13010026