Serum Selenium Status as a Diagnostic Marker for the Prognosis of Liver Transplantation

 , , ,
, , ,
Abstract
: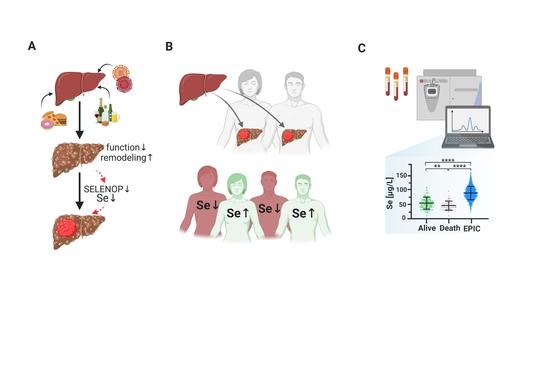
1. Introduction
2. Materials and Methods
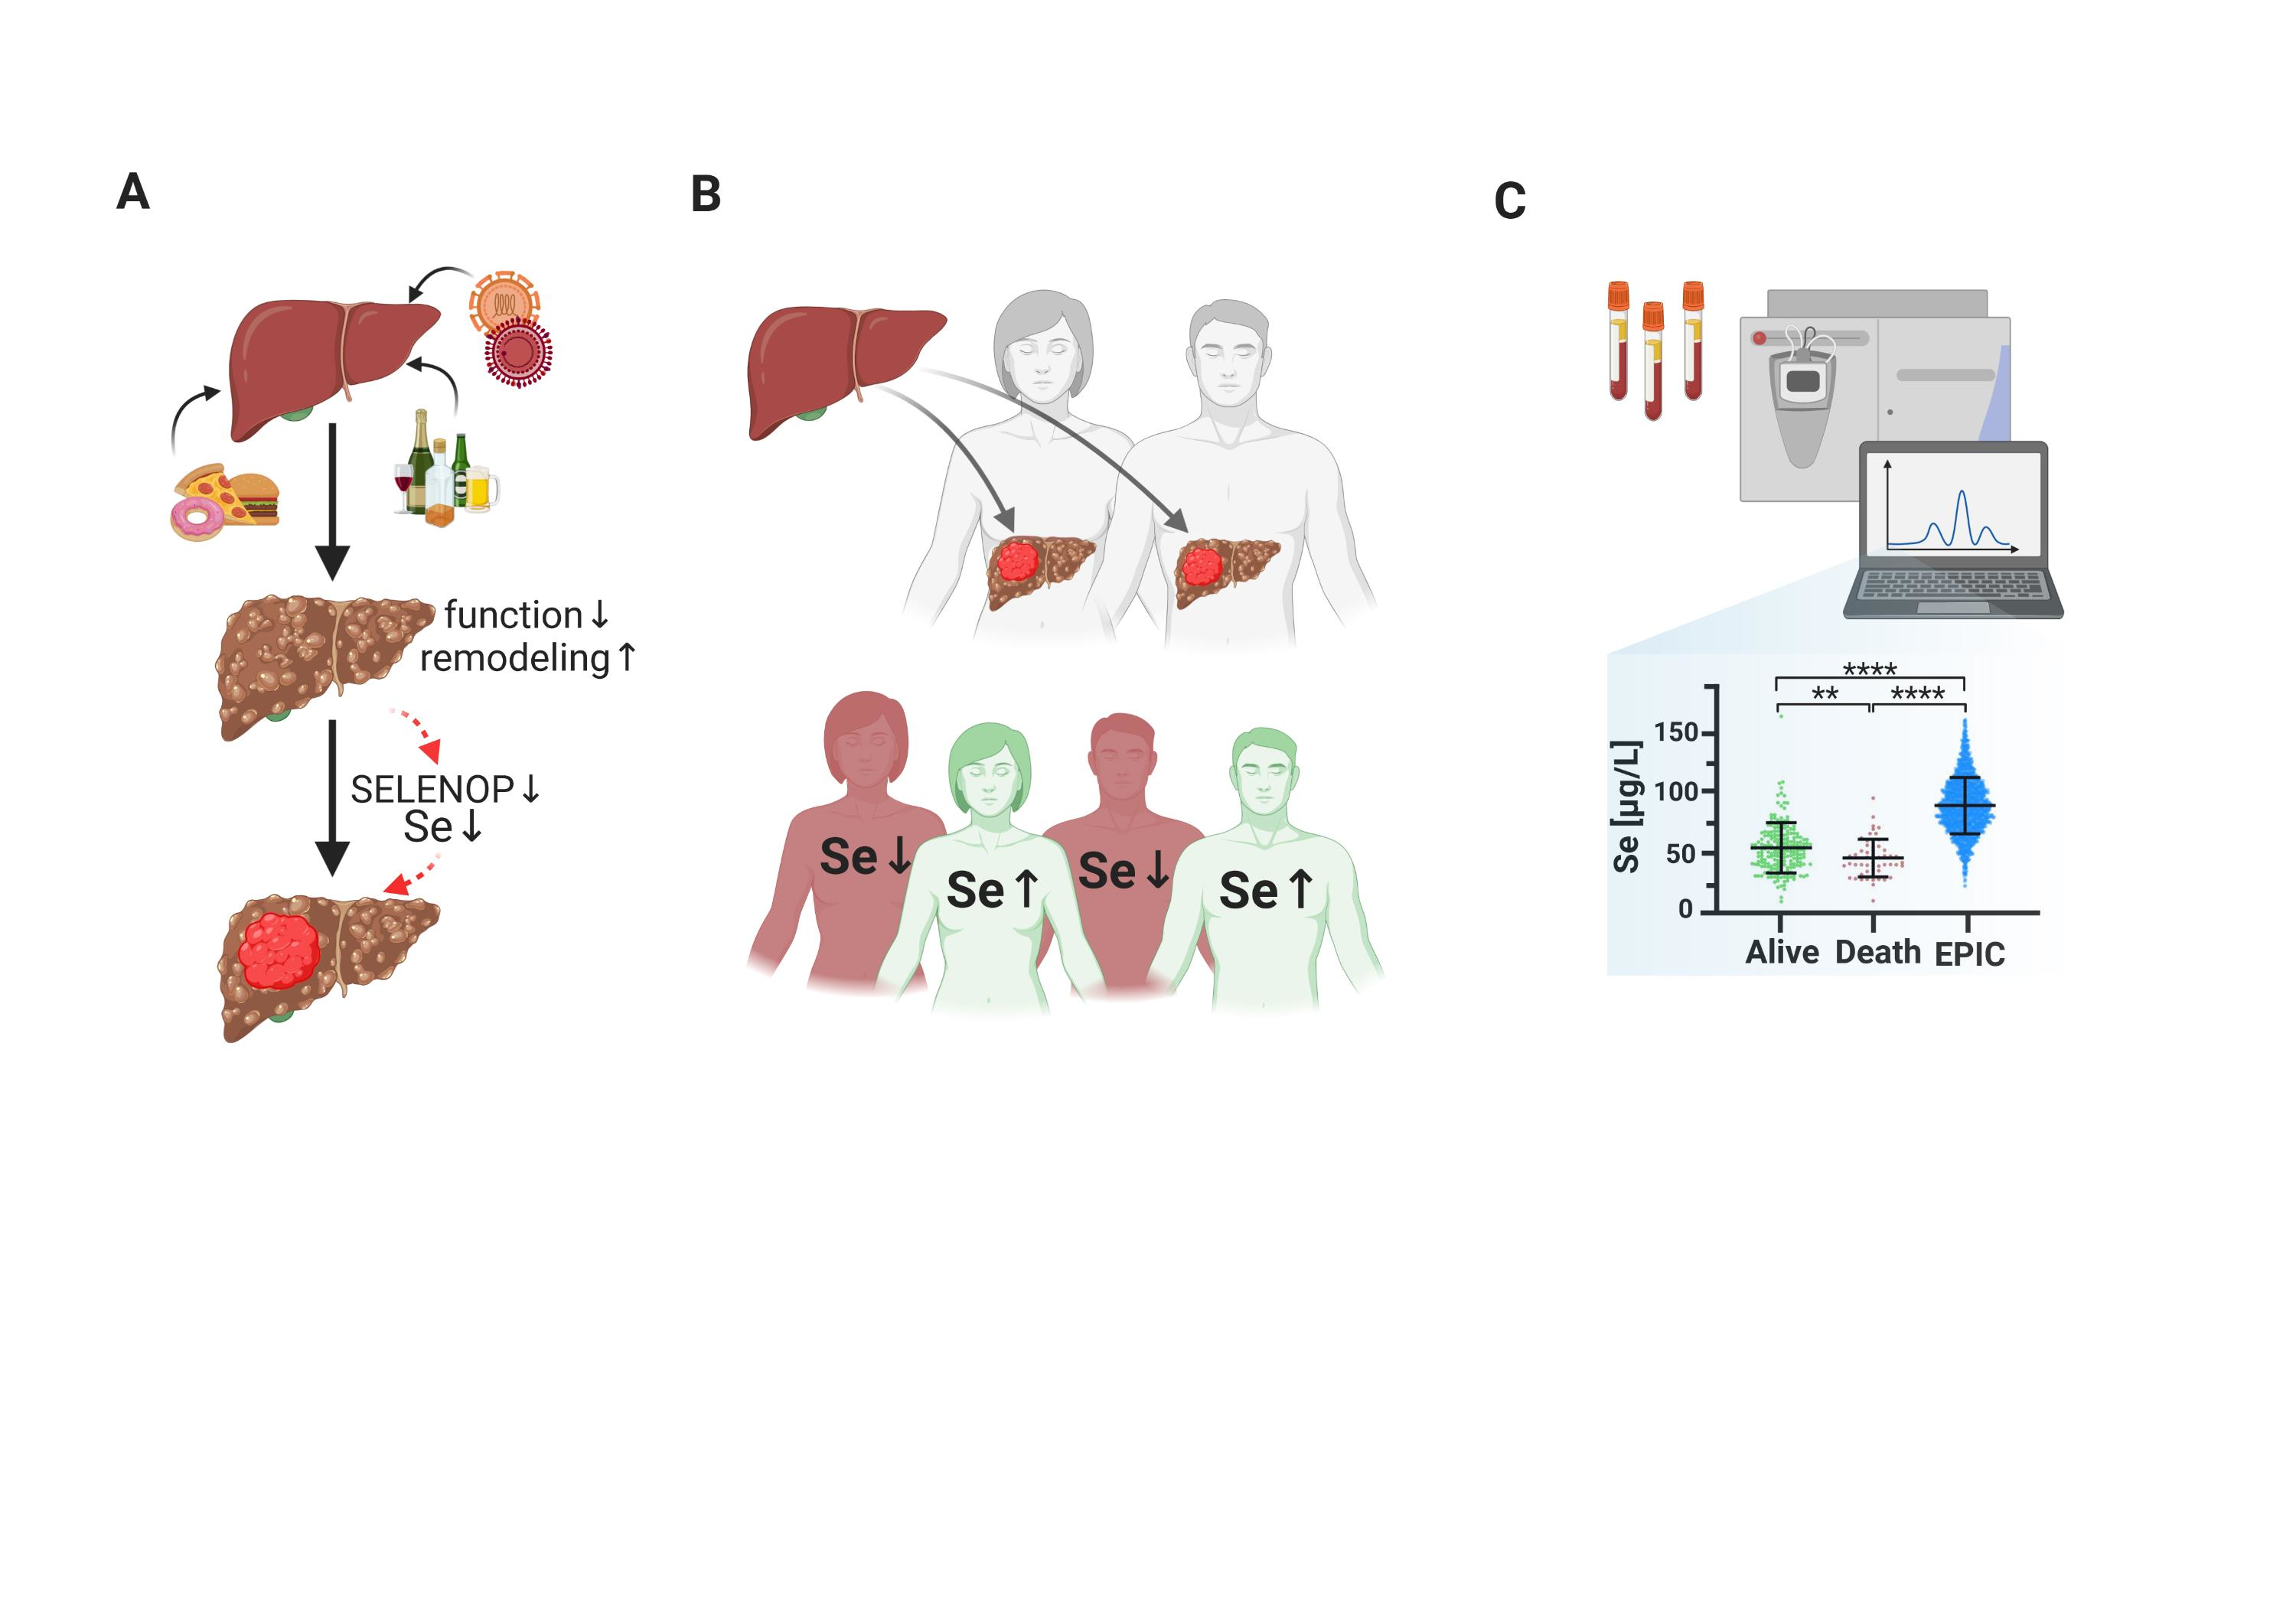
2.1. Study Design
2.2. Selenium Status Analysis
2.3. Statistical Analysis
3. Results
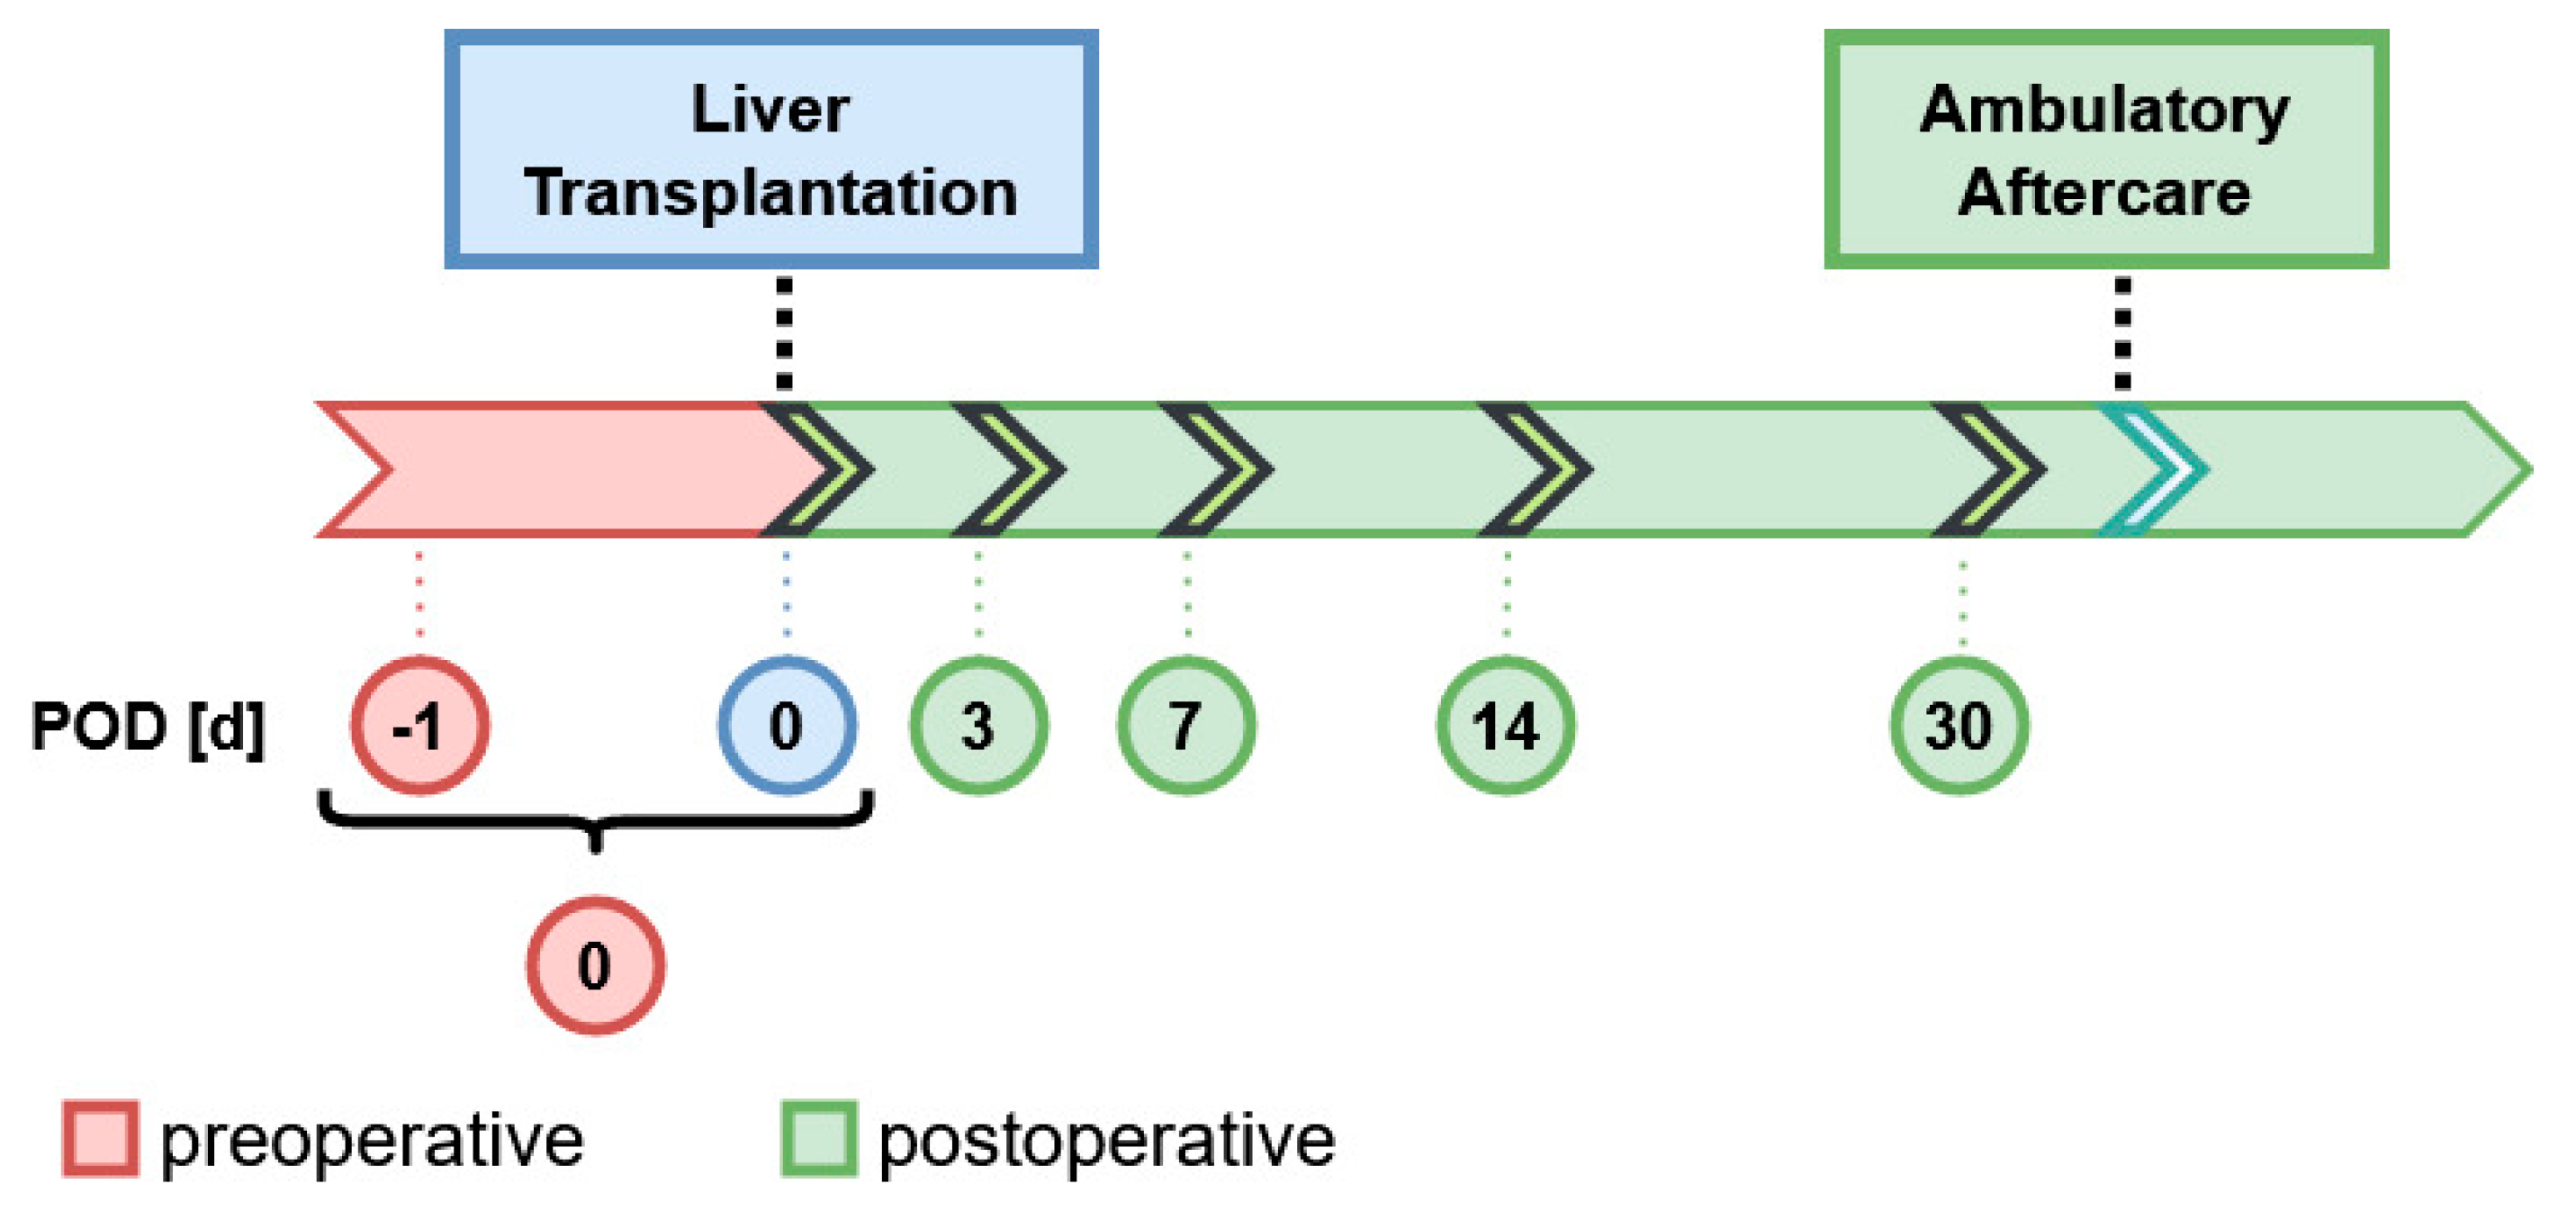
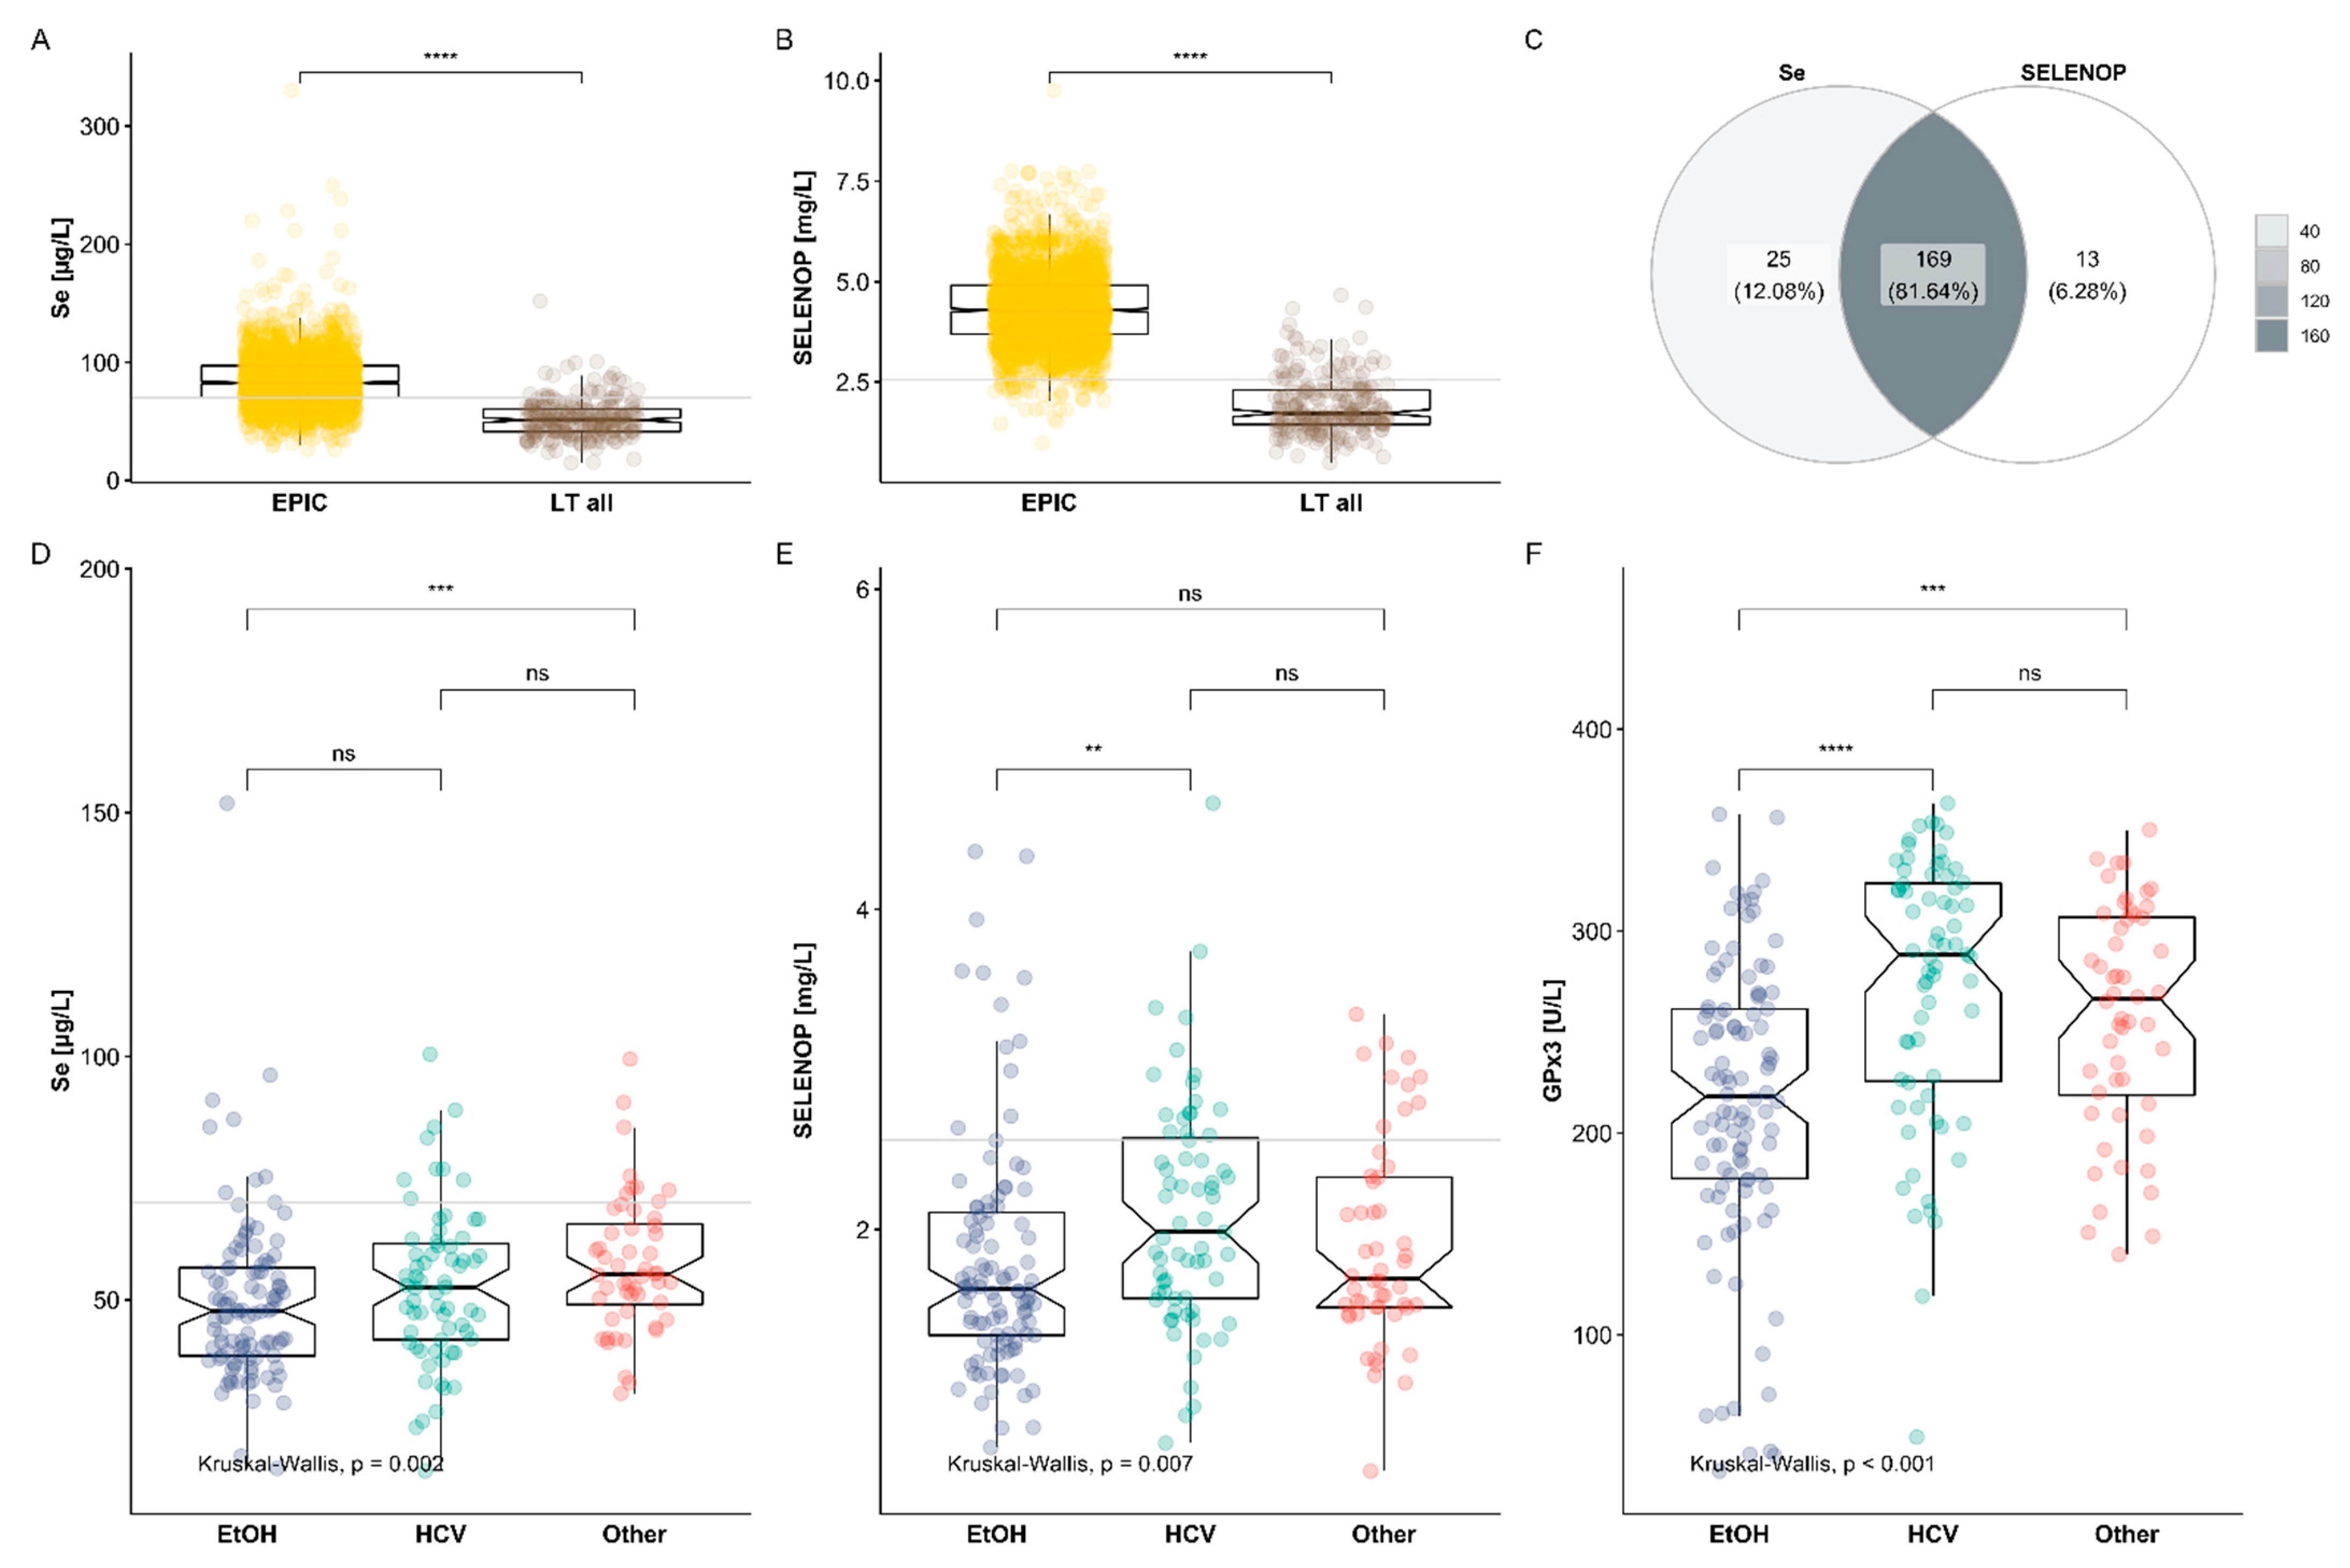
3.1. Selenium Status
3.2. Comparison of Se Status in Relation to Reference Ranges and HCC Etiology
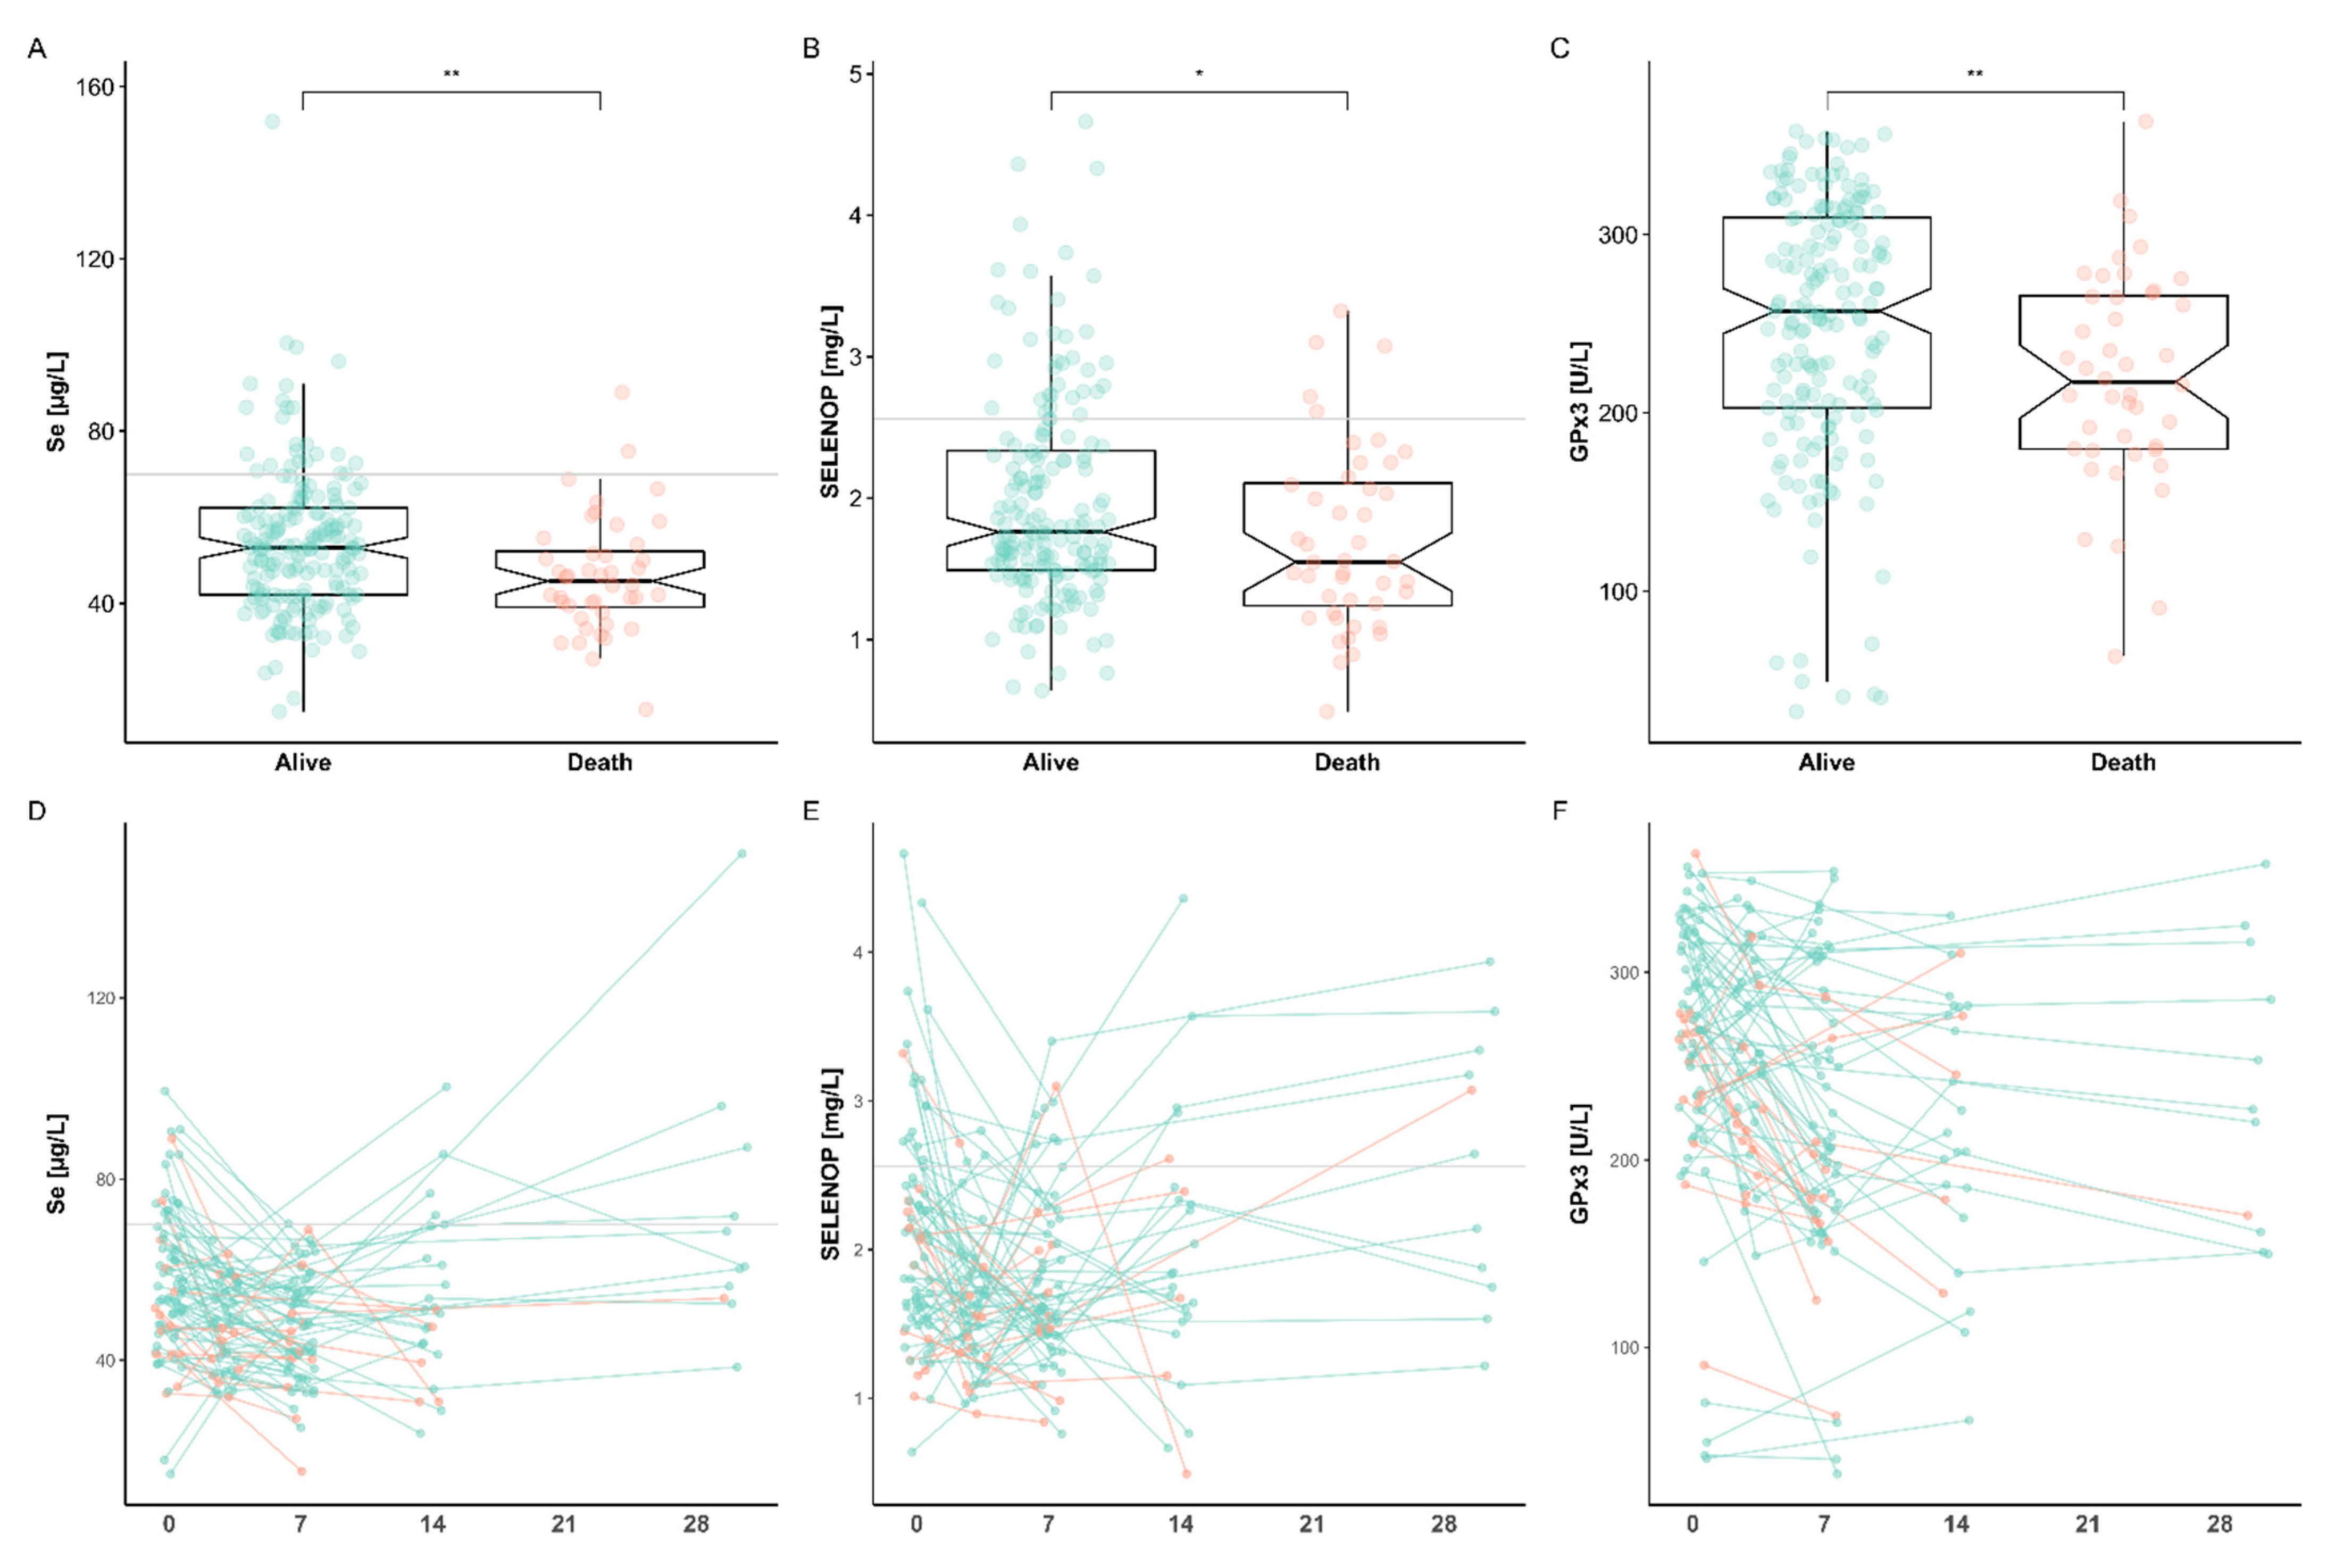
3.3. Se Status Biomarkers in Relation to Survival
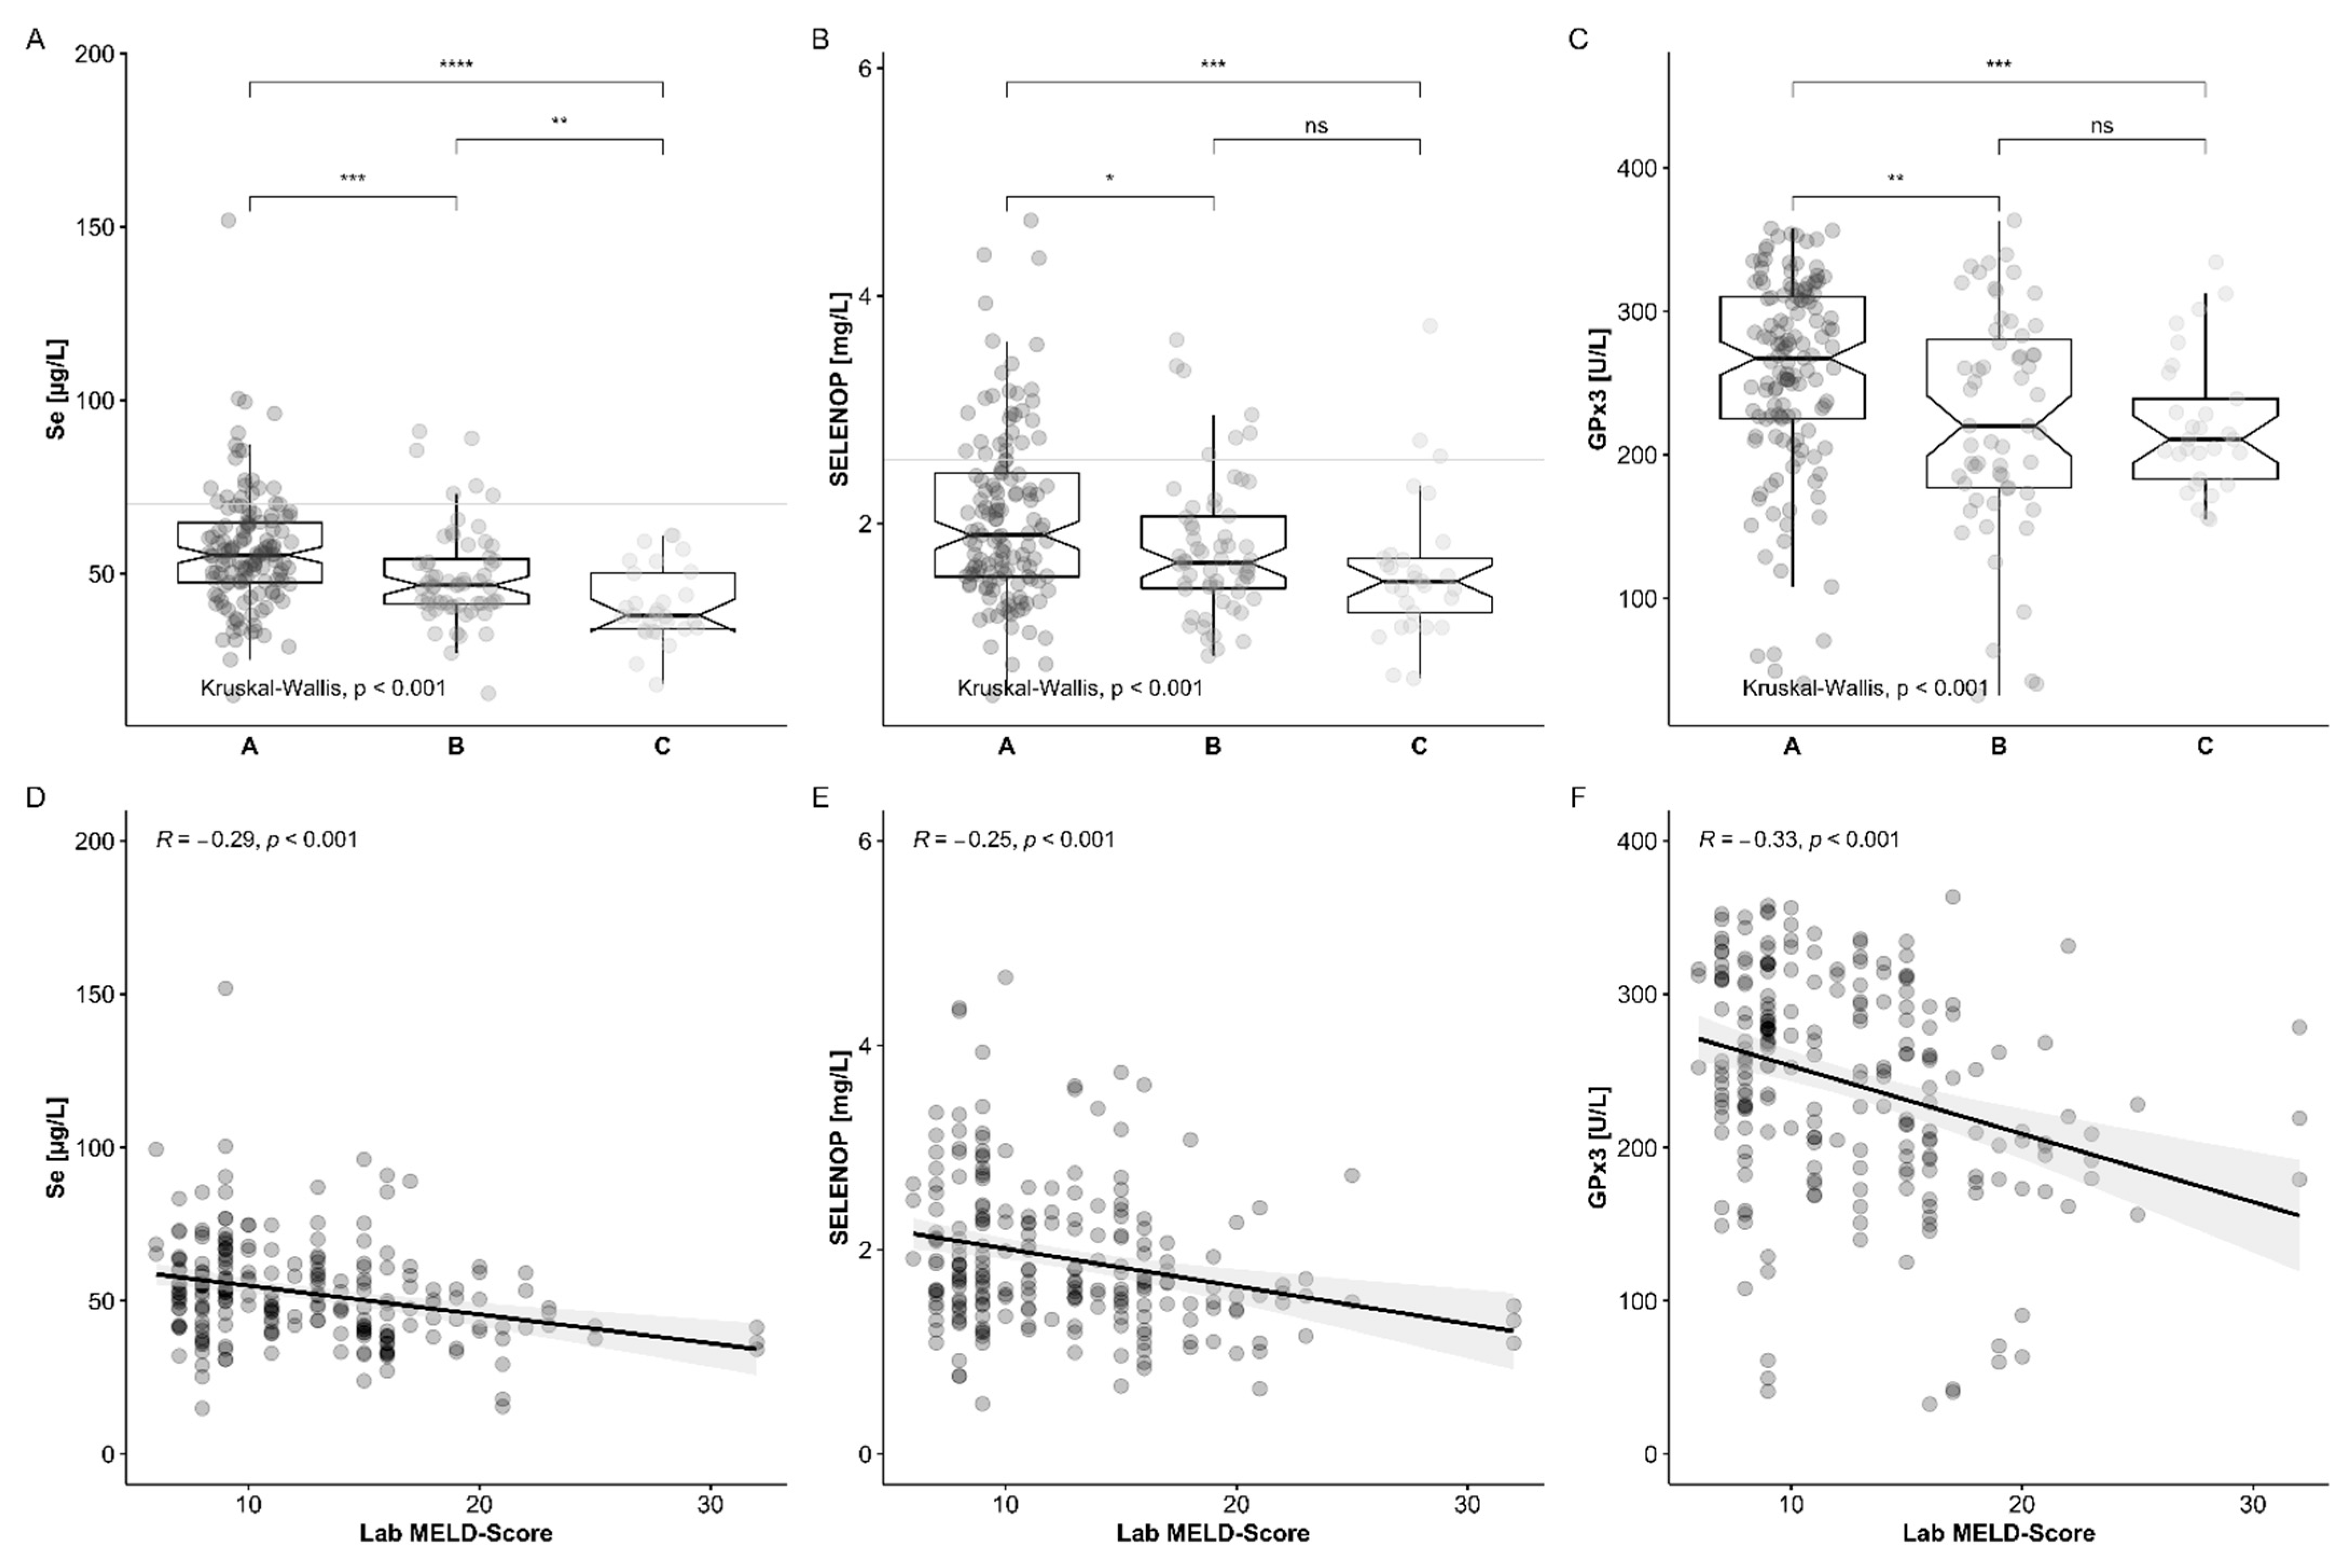
3.4. Comparison of Se Status Biomarkers with Established Indices of Chronic Liver Disease
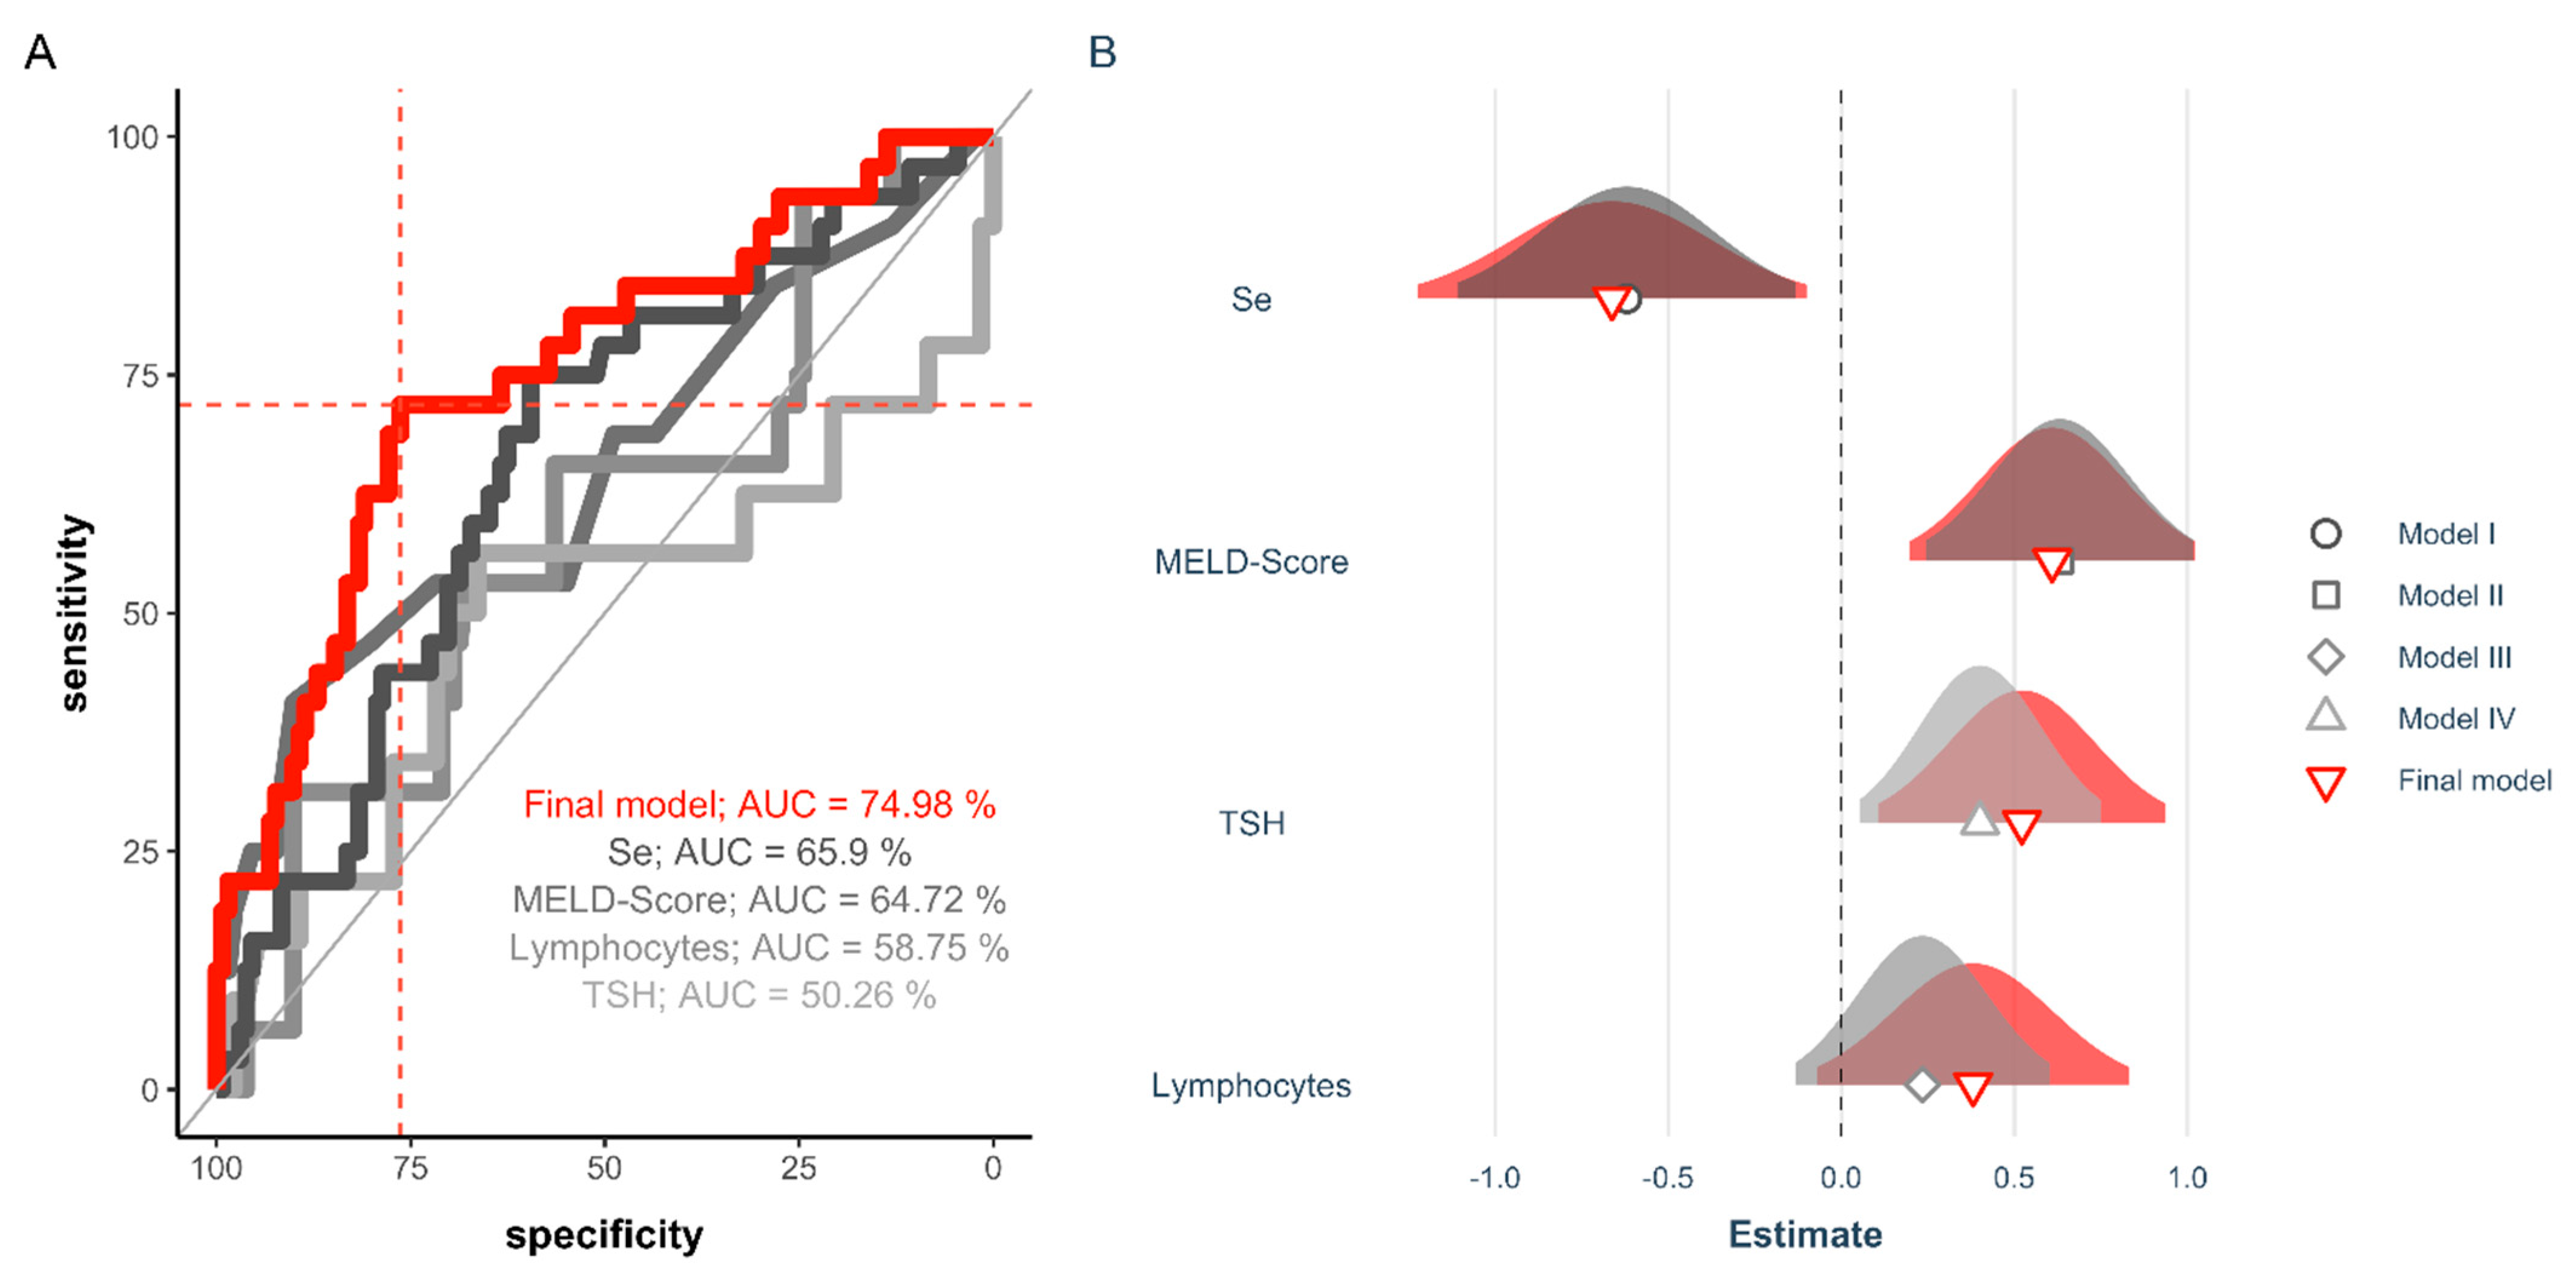
3.5. Diagnostic Value of Se Status for Predicting Survival after Liver Transplantation
4. Discussion
5. Conclusions
Supplementary Materials
Author Contributions
Funding
Institutional Review Board Statement
Informed Consent Statement
Data Availability Statement
Acknowledgments
Conflicts of Interest
References
- Himoto, T.; Masaki, T. Current Trends of Essential Trace Elements in Patients with Chronic Liver Diseases. Nutrients 2020, 12, 2084. [Google Scholar] [CrossRef]
- Kozeniecki, M.; Ludke, R.; Kerner, J.; Patterson, B. Micronutrients in Liver Disease: Roles, Risk Factors for Deficiency, and Recommendations for Supplementation. Nutr. Clin. Pract. 2020, 35, 50–62. [Google Scholar] [CrossRef] [PubMed] [Green Version]
- Haase, H.; Schomburg, L. You’d Better Zinc-Trace Element Homeostasis in Infection and Inflammation. Nutrients 2019, 11, 2078. [Google Scholar] [CrossRef] [Green Version]
- Sattar, N.; Eatock, F.; Fell, G.S.; O’Reilly, D. Selenium: an acute-phase reactant? Ann. Clin. Biochem. 1997, 34, 437–439. [Google Scholar] [CrossRef] [Green Version]
- Renko, K.; Hofmann, P.J.; Stoedter, M.; Hollenbach, B.; Behrends, T.; Kohrle, J.; Schweizer, U.; Schomburg, L. Down-regulation of the hepatic selenoprotein biosynthesis machinery impairs selenium metabolism during the acute phase response in mice. FASEB J. 2009, 23, 1758–1765. [Google Scholar] [CrossRef]
- Hill, K.E.; Wu, S.; Motley, A.K.; Stevenson, T.D.; Winfrey, V.P.; Capecchi, M.R.; Atkins, J.F.; Burk, R.F. Production of Selenoprotein P (Sepp1) by Hepatocytes Is Central to Selenium Homeostasis. J. Biol. Chem. 2012, 287, 40414–40424. [Google Scholar] [CrossRef] [Green Version]
- Short, S.P.; Pilat, J.M.; Williams, C.S. Roles for selenium and selenoprotein P in the development, progression, and prevention of intestinal disease. Free Radic. Biol. Med. 2018, 127, 26–35. [Google Scholar] [CrossRef] [PubMed]
- Stoedter, M.; Renko, K.; Hog, A.; Schomburg, L. Selenium controls the sex-specific immune response and selenoprotein expression during the acute-phase response in mice. Biochem. J. 2010, 429, 43–51. [Google Scholar] [CrossRef] [PubMed] [Green Version]
- Addinsall, A.B.; Wright, C.R.; Andrikopoulos, S.; van der Poel, C.; Stupka, N. Emerging roles of endoplasmic reticulum-resident selenoproteins in the regulation of cellular stress responses and the implications for metabolic disease. Biochem. J. 2018, 475, 1037–1057. [Google Scholar] [CrossRef] [PubMed]
- Sherlock, L.G.; Sjostrom, K.; Sian, L.; Delaney, C.; Tipple, T.E.; Krebs, N.F.; Nozik-Grayck, E.; Wright, C.J. Hepatic-Specific Decrease in the Expression of Selenoenzymes and Factors Essential for Selenium Processing After Endotoxemia. Front. Immunol. 2020, 11, 595282. [Google Scholar] [CrossRef]
- Fradejas-Villar, N. Consequences of mutations and inborn errors of selenoprotein biosynthesis and functions. Free Radic. Biol. Med. 2018, 127, 206–214. [Google Scholar] [CrossRef]
- Forceville, X.; Vitoux, D.; Gauzit, R.; Combes, A.; Lahilaire, P.; Chappuis, P. Selenium, systemic immune response syndrome, sepsis, and outcome in critically ill patients. Crit. Care Med. 1998, 26, 1536–1544. [Google Scholar] [CrossRef]
- Braunstein, M.; Kusmenkov, T.; Zuck, C.; Angstwurm, M.; Becker, N.P.; Bocker, W.; Schomburg, L.; Bogner-Flatz, V. Selenium and Selenoprotein P Deficiency Correlates With Complications and Adverse Outcome After Major Trauma. Shock 2020, 53, 63–70. [Google Scholar] [CrossRef] [PubMed]
- Maehira, F.; Luyo, G.A.; Miyagi, I.; Oshiro, M.; Yamane, N.; Kuba, M.; Nakazato, Y. Alterations of serum selenium concentrations in the acute phase of pathological conditions. Clin. Chim. Acta 2002, 316, 137–146. [Google Scholar] [CrossRef]
- Moghaddam, A.; Heller, R.A.; Sun, Q.; Seelig, J.; Cherkezov, A.; Seibert, L.; Hackler, J.; Seemann, P.; Diegmann, J.; Pilz, M.; et al. Selenium Deficiency Is Associated with Mortality Risk from COVID-19. Nutrients 2020, 12, 2098. [Google Scholar] [CrossRef] [PubMed]
- Burk, R.F.; Early, D.S.; Hill, K.E.; Palmer, I.S.; Boeglin, M.E. Plasma selenium in patients with cirrhosis. Hepatology 1998, 27, 794–798. [Google Scholar] [CrossRef] [PubMed]
- Gupta, S.; Read, S.A.; Shackel, N.A.; Hebbard, L.; George, J.; Ahlenstiel, G. The Role of Micronutrients in the Infection and Subsequent Response to Hepatitis C Virus. Cells 2019, 8, 603. [Google Scholar] [CrossRef] [Green Version]
- Rizk, N.I.; Sallam, A.M.; El-Ansary, A.R.; El-Mesallamy, H.O. HMGB1 and SEPP1 as predictors of hepatocellular carcinoma in patients with viral C hepatitis: Effect of DAAs. Clin. Biochem. 2019, 70, 8–13. [Google Scholar] [CrossRef]
- Polyzos, S.A.; Kountouras, J.; Goulas, A.; Duntas, L. Selenium and selenoprotein P in nonalcoholic fatty liver disease. Hormones 2020, 19, 61–72. [Google Scholar] [CrossRef]
- Schwarz, K.; Foltz, C.M. Factor 3 activity of selenium compounds. J. Biol. Chem. 1958, 233, 245–251. [Google Scholar] [CrossRef]
- Flohe, L. The labour pains of biochemical selenology: The history of selenoprotein biosynthesis. Biochim. Biophys. Acta 2009, 1790, 1389–1403. [Google Scholar] [CrossRef]
- Conrad, M.; Pratt, D.A. The chemical basis of ferroptosis. Nat. Chem. Biol. 2019, 15, 1137–1147. [Google Scholar] [CrossRef]
- Hirschhorn, T.; Stockwell, B.R. The development of the concept of ferroptosis. Free Radic. Biol. Med. 2019, 133, 130–143. [Google Scholar] [CrossRef] [PubMed]
- Costantini, S.; Lepore, M.G.; Castello, G.; Colonna, G. Has Selenium a Chemopreventive Effect on Hepatocellular Carcinoma? Mini-Rev. Med. Chem. 2011, 11, 599–610. [Google Scholar] [CrossRef]
- Darvesh, A.S.; Bishayee, A. Selenium in the prevention and treatment of hepatocellular carcinoma. Anticancer Agents Med. Chem. 2010, 10, 338–345. [Google Scholar] [CrossRef]
- Schomburg, L.; Hughes, D.J. The missing link? The potential role of selenium in the development of liver cancer and significance for the general population. Expert Rev. Gastroenterol. Hepatol. 2017, 11, 707–709. [Google Scholar] [CrossRef]
- Hughes, D.J.; Duarte-Salles, T.; Hybsier, S.; Trichopoulou, A.; Stepien, M.; Aleksandrova, K.; Overvad, K.; Tjonneland, A.; Olsen, A.; Affret, A.; et al. Prediagnostic selenium status and hepatobiliary cancer risk in the European Prospective Investigation into Cancer and Nutrition cohort. Am. J. Clin. Nutr. 2016, 104, 406–414. [Google Scholar] [CrossRef]
- Steinbrenner, H.; Al-Quraishy, S.; Dkhil, M.A.; Wunderlich, F.; Sies, H. Dietary selenium in adjuvant therapy of viral and bacterial infections. Adv. Nutr. 2015, 6, 73–82. [Google Scholar] [CrossRef] [PubMed] [Green Version]
- Guillin, O.M.; Vindry, C.; Ohlmann, T.; Chavatte, L. Selenium, Selenoproteins and Viral Infection. Nutrients 2019, 11, 2101. [Google Scholar] [CrossRef] [PubMed] [Green Version]
- Zhang, J.; Saad, R.; Taylor, E.W.; Rayman, M.P. Selenium and selenoproteins in viral infection with potential relevance to COVID-19. Redox Biol. 2020, 37, 101715. [Google Scholar] [CrossRef] [PubMed]
- Palioura, S.; Herkel, J.; Simonovic, M.; Lohse, A.W.; Soll, D. Human SepSecS or SLA/LP: selenocysteine formation and autoimmune hepatitis. Biol. Chem. 2010, 391, 771–776. [Google Scholar] [CrossRef]
- Bogdanos, D.P.; Mieli-Vergani, G.; Vergani, D. Autoantibodies and their Antigens in Autoimmune Hepatitis. Semin. Liver Dis. 2009, 29, 241–253. [Google Scholar] [CrossRef]
- Baeres, M.; Herkel, J.; Czaja, A.J.; Wies, I.; Kanzler, S.; Cancado, E.L.R.; Porta, G.; Nishioka, M.; Simon, T.; Daehnrich, C.; et al. Establishment of standardised SLA/LP immunoassays: specificity for autoimmune hepatitis, worldwide occurrence, and clinical characteristics. Gut 2002, 51, 259–264. [Google Scholar] [CrossRef] [PubMed]
- Unlu, S.; Lachmann, N.; Jara, M.; Ritschl, P.V.; Wiering, L.; Eurich, D.; Denecke, C.; Biebl, M.; Chopra, S.; Gul-Klein, S.; et al. Treatment of Anti-HLA Donor-Specific Antibodies Results in Increased Infectious Complications and Impairs Survival after Liver Transplantation. J. Clin. Med. 2020, 9, 3986. [Google Scholar] [CrossRef] [PubMed]
- Sun, Q.; Hackler, J.; Hilger, J.; Gluschke, H.; Muric, A.; Simmons, S.; Schomburg, L.; Siegert, E. Selenium and Copper as Biomarkers for Pulmonary Arterial Hypertension in Systemic Sclerosis. Nutrients 2020, 12, 1894. [Google Scholar] [CrossRef]
- Flohe, L.; Gunzler, W.A. Assays of Glutathione-Peroxidase. Methods Enzymol. 1984, 105, 114–121. [Google Scholar]
- Robin, X.; Turck, N.; Hainard, A.; Tiberti, N.; Lisacek, F.; Sanchez, J.C.; Muller, M. pROC: An open-source package for R and S+ to analyze and compare ROC curves. BMC Bioinform. 2011, 12, 77. [Google Scholar] [CrossRef] [PubMed]
- Wickham, H. ggplot2: Elegant Graphics for Data Analysis; Springer: New York, NY, USA, 2009. [Google Scholar]
- Zhang, Z. Variable selection with stepwise and best subset approaches. Ann. Transl. Med. 2016, 4, 136. [Google Scholar] [CrossRef] [Green Version]
- Akaike, H. Likelihood of a model and information criteria. J. Econom. 1981, 16, 3–14. [Google Scholar] [CrossRef]
- DeLong, E.R.; DeLong, D.M.; Clarke-Pearson, D.L. Comparing the areas under two or more correlated receiver operating characteristic curves: A nonparametric approach. Biometrics 1988, 44, 837–845. [Google Scholar] [CrossRef]
- Hughes, D.J.; Fedirko, V.; Jenab, M.; Schomburg, L.; Meplan, C.; Freisling, H.; Bueno-de-Mesquita, H.B.; Hybsier, S.; Becker, N.P.; Czuban, M.; et al. Selenium status is associated with colorectal cancer risk in the European prospective investigation of cancer and nutrition cohort. Int. J. Cancer 2015, 136, 1149–1161. [Google Scholar] [CrossRef]
- Heller, R.A.; Sun, Q.; Hackler, J.; Seelig, J.; Seibert, L.; Cherkezov, A.; Minich, W.B.; Seemann, P.; Diegmann, J.; Pilz, M.; et al. Prediction of survival odds in COVID-19 by zinc, age and selenoprotein P as composite biomarker. Redox Biol. 2021, 38, 101764. [Google Scholar] [CrossRef]
- Youden, W.J. Index for rating diagnostic tests. Cancer 1950, 3, 32–35. [Google Scholar] [CrossRef]
- Burk, R.F.; Hill, K.E. Regulation of Selenium Metabolism and Transport. Annu. Rev. Nutr. 2015, 35, 109–134. [Google Scholar] [CrossRef] [PubMed]
- Schomburg, L.; Schweizer, U.; Holtmann, B.; Flohe, L.; Sendtner, M.; Kohrle, J. Gene disruption discloses role of selenoprotein P in selenium delivery to target tissues. Biochem. J. 2003, 370, 397–402. [Google Scholar] [CrossRef] [Green Version]
- Nakayama, A.; Hill, K.E.; Austin, L.M.; Motley, A.K.; Burk, R.F. All regions of mouse brain are dependent on selenoprotein P for maintenance of selenium. J. Nutr. 2007, 137, 690–693. [Google Scholar] [CrossRef] [PubMed]
- Wirth, E.K.; Conrad, M.; Winterer, J.; Wozny, C.; Carlson, B.A.; Roth, S.; Schmitz, D.; Bornkamm, G.W.; Coppola, V.; Tessarollo, L.; et al. Neuronal selenoprotein expression is required for interneuron development and prevents seizures and neurodegeneration. FASEB J. 2010, 24, 844–852. [Google Scholar] [CrossRef] [Green Version]
- Seeher, S.; Carlson, B.A.; Miniard, A.C.; Wirth, E.K.; Mahdi, Y.; Hatfield, D.L.; Driscoll, D.M.; Schweizer, U. Impaired selenoprotein expression in brain triggers striatal neuronal loss leading to co-ordination defects in mice. Biochem. J. 2014, 462, 67–75. [Google Scholar] [CrossRef] [Green Version]
- Renko, K.; Werner, M.; Renner-Muller, I.; Cooper, T.G.; Yeung, C.H.; Hollenbach, B.; Scharpf, M.; Kohrle, J.; Schomburg, L.; Schweizer, U. Hepatic selenoprotein P (SePP) expression restores selenium transport and prevents infertility and motor-incoordination in Sepp-knockout mice. Biochem. J. 2008, 409, 741–749. [Google Scholar] [CrossRef] [Green Version]
- Johansson, U.; Johnsson, F.; Joelsson, B.; Berglund, M.; Akesson, B. Selenium status in patients with liver cirrhosis and alcoholism. Br. J. Nutr. 1986, 55, 227–233. [Google Scholar] [CrossRef] [Green Version]
- Bettinger, D.; Schultheiss, M.; Hennecke, N.; Panther, E.; Knuppel, E.; Blum, H.E.; Thimme, R.; Spangenberg, H.C. Selenium levels in patients with hepatitis C virus-related chronic hepatitis, liver cirrhosis, and hepatocellular carcinoma: A pilot study. Hepatology 2013, 57, 2543–2544. [Google Scholar] [CrossRef]
- Prystupa, A.; Kicinski, P.; Luchowska-Kocot, D.; Blazewicz, A.; Niedzialek, J.; Mizerski, G.; Jojczuk, M.; Ochal, A.; Sak, J.J.; Zaluska, W. Association between Serum Selenium Concentrations and Levels of Proinflammatory and Profibrotic Cytokines-Interleukin-6 and Growth Differentiation Factor-15, in Patients with Alcoholic Liver Cirrhosis. Int. J. Environ. Res. Public Health 2017, 14, 437. [Google Scholar] [CrossRef]
- Gong, Y.; Dong, F.; Geng, Y.; Zhuang, H.; Ma, Z.; Zhou, Z.; Huang, B.; Sun, Z.; Hou, B. Selenium concentration, dietary intake and risk of hepatocellular carcinoma - A systematic review with meta-analysis. Nutr. Hosp. 2019, 36, 1430–1437. [Google Scholar] [CrossRef] [PubMed]
- Thomson, C.D. Assessment of requirements for selenium and adequacy of selenium status: A review. Eur. J. Clin. Nutr. 2004, 58, 391–402. [Google Scholar] [CrossRef] [PubMed] [Green Version]
- Hurst, R.; Armah, C.N.; Dainty, J.R.; Hart, D.J.; Teucher, B.; Goldson, A.J.; Broadley, M.R.; Motley, A.K.; Fairweather-Tait, S.J. Establishing optimal selenium status: results of a randomized, double-blind, placebo-controlled trial. Am. J. Clin. Nutr. 2010, 91, 923–931. [Google Scholar] [CrossRef] [PubMed] [Green Version]
- Kipp, A.P.; Strohm, D.; Brigelius-Flohe, R.; Schomburg, L.; Bechthold, A.; Leschik-Bonnet, E.; Heseker, H.; German Nutrition, S. Revised reference values for selenium intake. J. Trace Elem. Med. Biol. 2015, 32, 195–199. [Google Scholar] [CrossRef] [Green Version]
- Zhang, N.; Jin, W.D.; Zhou, S.N.; Yang, J.D.; Harmsen, W.S.; Giama, N.H.; Wongjarupong, N.; Heimbach, J.K.; Watt, K.D.; Malhi, H.; et al. Hypothyroidism is associated with worse outcomes of hepatocellular carcinoma patients after liver transplantation. Cancer Med. Us 2018, 7, 5870–5878. [Google Scholar] [CrossRef] [PubMed]
- Zheng, J.; Cai, J.; Li, H.; Zeng, K.; He, L.; Fu, H.; Zhang, J.; Chen, L.; Yao, J.; Zhang, Y.; et al. Neutrophil to Lymphocyte Ratio and Platelet to Lymphocyte Ratio as Prognostic Predictors for Hepatocellular Carcinoma Patients with Various Treatments: A Meta-Analysis and Systematic Review. Cell Physiol. Biochem. 2017, 44, 967–981. [Google Scholar] [CrossRef]
- Templeton, A.J.; McNamara, M.G.; Seruga, B.; Vera-Badillo, F.E.; Aneja, P.; Ocana, A.; Leibowitz-Amit, R.; Sonpavde, G.; Knox, J.J.; Tran, B.; et al. Prognostic role of neutrophil-to-lymphocyte ratio in solid tumors: A systematic review and meta-analysis. J. Natl. Cancer Inst. 2014, 106, dju124. [Google Scholar] [CrossRef] [Green Version]
- Malinouski, M.; Kehr, S.; Finney, L.; Vogt, S.; Carlson, B.A.; Seravalli, J.; Jin, R.; Handy, D.E.; Park, T.J.; Loscalzo, J.; et al. High-Resolution Imaging of Selenium in Kidneys: A Localized Selenium Pool Associated with Glutathione Peroxidase 3. Antioxid. Redox Signal. 2012, 16, 185–192. [Google Scholar] [CrossRef] [PubMed]
- Olson, G.E.; Winfrey, V.P.; Hill, K.E.; Burk, R.F. Megalin mediates selenoprotein P uptake by kidney proximal tubule epithelial cells. J. Biol. Chem. 2008, 283, 6854–6860. [Google Scholar] [CrossRef] [Green Version]
- Chiu-Ugalde, J.; Theilig, F.; Behrends, T.; Drebes, J.; Sieland, C.; Subbarayal, P.; Kohrle, J.; Hammes, A.; Schomburg, L.; Schweizer, U. Mutation of megalin leads to urinary loss of selenoprotein P and selenium deficiency in serum, liver, kidneys and brain. Biochem. J. 2010, 431, 103–111. [Google Scholar] [CrossRef] [PubMed] [Green Version]
- Papp, L.V.; Holmgren, A.; Khanna, K.K. Selenium and Selenoproteins in Health and Disease. Antioxid Redox Sign 2010, 12, 793–795. [Google Scholar] [CrossRef]
- Schomburg, L. The other view: the trace element selenium as a micronutrient in thyroid disease, diabetes, and beyond. Hormones 2020, 19, 15–24. [Google Scholar] [CrossRef] [PubMed]
- Bermano, G.; Meplan, C.; Mercer, D.K.; Hesketh, J.E. Selenium and viral infection: Are there lessons for COVID-19? Br. J. Nutr. 2020. [Google Scholar] [CrossRef]
- Marciel, M.P.; Hoffmann, P.R. Molecular Mechanisms by Which Selenoprotein K Regulates Immunity and Cancer. Biol. Trace Elem. Res. 2019, 192, 60–68. [Google Scholar] [CrossRef] [PubMed]
- Duntas, L.H.; Benvenga, S. Selenium: an element for life. Endocrine 2015, 48, 756–775. [Google Scholar] [CrossRef] [PubMed]
- Brodin, O.; Eksborg, S.; Wallenberg, M.; Asker-Hagelberg, C.; Larsen, E.H.; Mohlkert, D.; Lenneby-Helleday, C.; Jacobsson, H.; Linder, S.; Misra, S.; et al. Pharmacokinetics and Toxicity of Sodium Selenite in the Treatment of Patients with Carcinoma in a Phase I Clinical Trial: The SECAR Study. Nutrients 2015, 7, 4978–4994. [Google Scholar] [CrossRef] [Green Version]


| Alive (N = 63) | Death (N = 16) | Total (N = 79) | p value | |
|---|---|---|---|---|
| Sex | 0.39 | |||
| female | 10 (15.9%) | 4 (25.0%) | 14 (17.7%) | |
| male | 53 (84.1%) | 12 (75.0%) | 65 (82.3%) | |
| Age | 0.79 | |||
| Median (IQR) | 59 (31, 70) | 60 (51, 72) | 59 (31, 72) | |
| BMI | 0.88 | |||
| Median (IQR) | 27 (18, 39) | 27.0 (22, 43) | 27 (18.0, 43) | |
| MELD Score * | 0.24 | |||
| Median (IQR) | 11 (6, 25) | 13 (7, 32) | 11 (6, 32) | |
| Child–Pugh Score | 0.26 | |||
| A | 40 (63.5%) | 8 (50.0%) | 48 (60.8%) | |
| B | 15 (23.8%) | 7 (43.7%) | 22 (27.8%) | |
| C | 8 (12.7%) | 1 (6.3%) | 9 (11.4%) | |
| Transplantation indication | 0.80 | |||
| EtOH | 29 (46.0%) | 8 (50.0%) | 37 (46.8%) | |
| HCV | 21 (33.3%) | 4 (25.0%) | 25 (31.7%) | |
| other ** | 13 (20.6%) | 4 (25.0%) | 17 (21.5%) | |
| Pre-OP Neutrophiles | 0.33 | |||
| Median (IQR) | 2.8 (1.3, 22.3) | 3.3 (1.5, 16.2) | 3.0 (1.3, 22.3) | |
| Pre-OP Lymphocytes | 0.63 | |||
| Median (IQR) | 1.1 (0.3, 3.1) | 1.1 (0.6, 2.4) | 1.1 (0.3, 3.1) | |
| Pre-OP NLR *** | 0.69 | |||
| Median (IQR) | 2.9 (0.5, 30.2) | 3.2 (1.3, 12.4) | 3.0 (0.5, 30.2) | |
| TSH | 0.63 | |||
| Median (IQR) | 1.90 (0.04, 6.76) | 1.47 (0.09, 10.76) | 1.90 (0.04, 10.76) | |
| Pre-OP Se | 0.10 | |||
| Median (IQR) | 56.6 (14.9, 99.5) | 48.8 (32.7, 89.0) | 55.4 (14.9, 99.5) | |
| Pre-OP SELENOP | 0.18 | |||
| Median (IQR) | 2.07 (0.64, 4.66) | 1.98 (1.01, 3.32) | 2.06 (0.64, 4.66) | |
| Pre-OP GPx3 | 0.15 | |||
| Median (IQR) | 276.0 (40.7, 356.3) | 258.5 (90.5, 363.3) | 269.3 (40.7, 363.3) |
| Model I | Model II | Model III | Model IV | Final Model | |
|---|---|---|---|---|---|
| Lymphocytes | 0.23 | 0.38 | |||
| [−0.13, 0.60] | [−0.07, 0.83] | ||||
| TSH | 0.40 * | 0.52 * | |||
| [0.05, 0.75] | [0.11, 0.94] | ||||
| MELD Score | 0.63 ** | 0.61 ** | |||
| [0.25, 1.02] | [0.20, 1.02] | ||||
| Se | −0.62 * | −0.66 * | |||
| [−1.11, −0.13] | [−1.22, −0.10] | ||||
| AIC | 158.3 | 154.4 | 163.9 | 160.4 | 146.4 |
| Pseudo R2 | 0.07 | 0.10 | 0.01 | 0.05 | 0.23 |
Publisher’s Note: MDPI stays neutral with regard to jurisdictional claims in published maps and institutional affiliations. |
© 2021 by the authors. Licensee MDPI, Basel, Switzerland. This article is an open access article distributed under the terms and conditions of the Creative Commons Attribution (CC BY) license (http://creativecommons.org/licenses/by/4.0/).
Share and Cite
Gül-Klein, S.; Haxhiraj, D.; Seelig, J.; Kästner, A.; Hackler, J.; Sun, Q.; Heller, R.A.; Lachmann, N.; Pratschke, J.; Schmelzle, M.; et al. Serum Selenium Status as a Diagnostic Marker for the Prognosis of Liver Transplantation. Nutrients 2021, 13, 619. https://0-doi-org.brum.beds.ac.uk/10.3390/nu13020619
Gül-Klein S, Haxhiraj D, Seelig J, Kästner A, Hackler J, Sun Q, Heller RA, Lachmann N, Pratschke J, Schmelzle M, et al. Serum Selenium Status as a Diagnostic Marker for the Prognosis of Liver Transplantation. Nutrients. 2021; 13(2):619. https://0-doi-org.brum.beds.ac.uk/10.3390/nu13020619
Chicago/Turabian StyleGül-Klein, Safak, Deana Haxhiraj, Julian Seelig, Anika Kästner, Julian Hackler, Qian Sun, Raban Arved Heller, Nils Lachmann, Johann Pratschke, Moritz Schmelzle, and et al. 2021. "Serum Selenium Status as a Diagnostic Marker for the Prognosis of Liver Transplantation" Nutrients 13, no. 2: 619. https://0-doi-org.brum.beds.ac.uk/10.3390/nu13020619