
25-Hydroxyvitamin D and Cardiorespiratory Fitness in Prepubertal Overweight and Obese Children

 ,
, 
 , and
, and
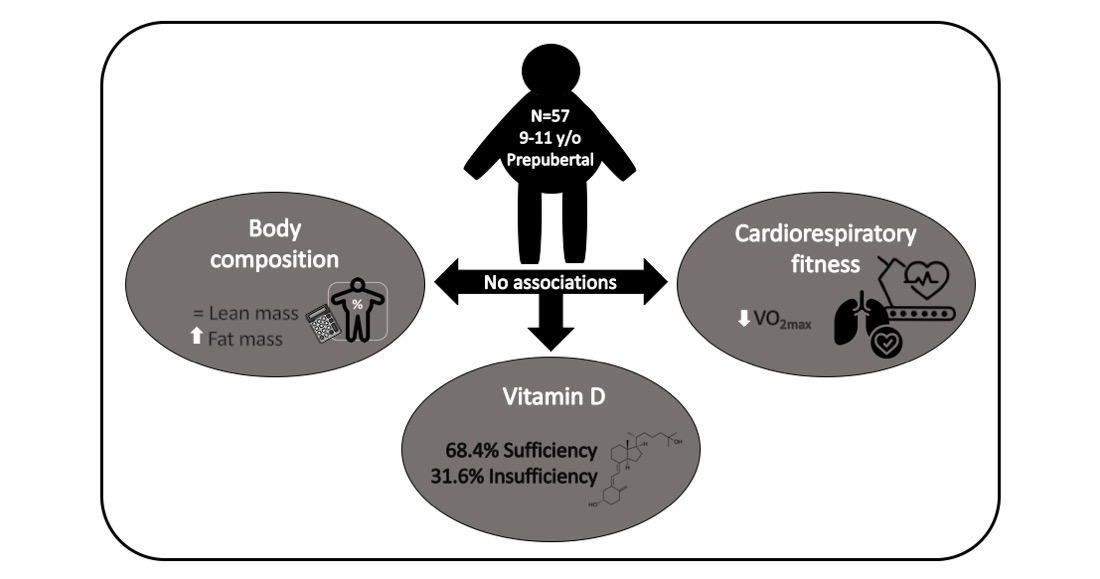
Abstract
:
1. Introduction
2. Materials and Methods
2.1. Participants
2.2. Anthropometry
2.3. Blood Sampling
Vitamin D
2.4. Cardiorespiratory Fitness
2.5. Fat and Lean Mass
2.6. Statistical Analyses
3. Results
4. Discussion
5. Conclusions
Author Contributions
Funding
Institutional Review Board Statement
Informed Consent Statement
Data Availability Statement
Acknowledgments
Conflicts of Interest
References
- Katzmarzyk, P.T.; Chaput, J.P.; Fogelholm, M.; Hu, G.; Maher, C.; Maia, J.; Olds, T.; Sarmiento, O.L.; Standage, M.; Tremblay, M.S.; et al. International Study of Childhood Obesity, Lifestyle and the Environment (ISCOLE): Contributions to Understanding the Global Obesity Epidemic. Nutrients 2019, 11, 848. [Google Scholar] [CrossRef] [Green Version]
- World Health Organization. Consideration of the Evidence on Childhood Obesity for the Commission on Ending Childhood Obesity: Report of the Ad Hoc Working Group on Science and Evidence for Ending Childhood Obesity; World Health Organization: Geneva, Switzerland, 2016. [Google Scholar]
- NCD Risk Factor Collaboration (NCD-RisC). Worldwide trends in body-mass index, underweight, overweight, and obesity from 1975 to 2016: A pooled analysis of 2416 population-based measurement studies in 128·9 million children, adolescents, and adults. Lancet 2017, 390, 2627–2642. [Google Scholar] [CrossRef] [Green Version]
- Garrido-Miguel, M.; Cavero-Redondo, I.; Álvarez-Bueno, C.; Rodríguez-Artalejo, F.; Moreno, L.A.; Ruiz, J.R.; Ahrens, W.; Martínez-Vizcaíno, V. Prevalence and Trends of Overweight and Obesity in European Children From 1999 to 2016: A Systematic Review and Meta-analysis. JAMA Pediatr. 2019, 173. [Google Scholar] [CrossRef] [PubMed]
- Umer, A.; Kelley, G.A.; Cottrell, L.E.; Giacobbi, P.; Innes, K.E.; Lilly, C.L. Childhood obesity and adult cardiovascular disease risk factors: A systematic review with meta-analysis. BMC Public Health 2017, 17, 683. [Google Scholar] [CrossRef] [PubMed] [Green Version]
- Guthold, R.; Stevens, G.A.; Riley, L.M.; Bull, F.C. Global trends in insufficient physical activity among adolescents: A pooled analysis of 298 population-based surveys with 1·6 million participants. Lancet Child. Adolesc. Health 2020, 4, 23–35. [Google Scholar] [CrossRef]
- Bull, F.C.; Al-Ansari, S.S.; Biddle, S.; Borodulin, K.; Buman, M.P.; Cardon, G.; Carty, C.; Chaput, J.P.; Chastin, S.; Chou, R.; et al. World Health Organization 2020 guidelines on physical activity and sedentary behaviour. Br. J. Sports Med. 2020, 54, 1451–1462. [Google Scholar] [CrossRef] [PubMed]
- Viana Pires, L.; González-Gil, E.M.; Anguita-Ruiz, A.; Bueno, G.; Gil-Campos, M.; Vázquez-Cobela, R.; Moreno, L.A.; Gil, A.; Aguilera, C.M.; Leis, R. Serum 25-hydroxyvitamin D levels and its relationship with sex hormones, puberty and obesity degree in children and adolescents. Child Adolesc. Obes. 2020, 3, 150–169. [Google Scholar] [CrossRef]
- Migliaccio, S.; Di Nisio, A.; Mele, C.; Scappaticcio, L.; Savastano, S.; Colao, A. Obesity Programs of nutrition, Education, Research and Assessment (OPERA) Group. Obesity and hypovitaminosis D: Causality or casualty? Int. J. Obes. Suppl. 2019, 9, 20–31. [Google Scholar] [CrossRef] [PubMed]
- Holick, M.F.; Binkley, N.C.; Bischoff-Ferrari, H.A.; Gordon, C.M.; Hanley, D.A.; Heaney, R.P.; Murad, M.H.; Weaver, C.M. Evaluation, treatment, and prevention of vitamin D deficiency: An Endocrine Society clinical practice guideline. J. Clin. Endocrinol. Metab. 2011, 96, 1911–1930. [Google Scholar] [CrossRef] [Green Version]
- Ardestani, A.; Parker, B.; Mathur, S.; Clarkson, P.; Pescatello, L.S.; Hoffman, H.J.; Polk, D.M.; Thompson, P.D. Relation of vitamin D level to maximal oxygen uptake in adults. Am. J. Cardiol. 2011, 107, 1246–1249. [Google Scholar] [CrossRef] [Green Version]
- Carson, E.L.; Pourshahidi, L.K.; Hill, T.R.; Cashman, K.D.; Strain, J.J.; Boreham, C.A.; Mulhern, M.S. Vitamin D, Muscle Function, and Cardiorespiratory Fitness in Adolescents From the Young Hearts Study. J. Clin. Endocrinol. Metab. 2015, 100, 4621–4628. [Google Scholar] [CrossRef] [PubMed] [Green Version]
- Jiménez-Pavón, D.; Sesé, M.A.; Valtueña, J.; Cuenca-García, M.; González-Gross, M.; Gottrand, F.; Kafatos, A.; Manios, Y.; Widhalm, K.; de Henauw, S.; et al. Leptin, vitamin D, and cardiorespiratory fitness as risk factors for insulin resistance in European adolescents: Gender differences in the HELENA Study. Appl. Physiol. Nutr. Metab. Physiol. Appl. Nutr. Metab. 2014, 39, 530–537. [Google Scholar] [CrossRef]
- Valtueña, J.; Gracia-Marco, L.; Huybrechts, I.; Breidenassel, C.; Ferrari, M.; Gottrand, F.; Dallongeville, J.; Sioen, I.; Gutierrez, A.; Kersting, M.; et al. Cardiorespiratory fitness in males, and upper limbs muscular strength in females, are positively related with 25-hydroxyvitamin D plasma concentrations in European adolescents: The HELENA study. QJM Mon. J. Assoc. Physicians 2013, 106, 809–821. [Google Scholar] [CrossRef] [Green Version]
- Bjarnadottir, A.; Kristjansdottir, A.G.; Hrafnkelsson, H.; Johannsson, E.; Magnusson, K.T.; Thorsdottir, I. Insufficient autumn vitamin D intake and low vitamin D status in 7-year-old Icelandic children. Public Health Nutr. 2015, 18, 208–217. [Google Scholar] [CrossRef] [PubMed] [Green Version]
- World Medical Association (WMA). WMA Declaration of Helsinki–Ethical Principles for Medical Research Involving Human Subjects. Available online: https://www.wma.net/policies-post/wma-declaration-of-helsinki-ethical-principles-for-medical-research-involvin (accessed on 11 March 2021).
- World Medical Association (WMA). WMA Declaration of Taipei on Ethical Considerations Regarding Health Databases and Biobanks. Available online: https://www.wma.net/policies-post/wma-declaration-of-taipei-on-ethical-considerations-regarding-health-databa (accessed on 11 March 2021).
- Cole, T.J.; Lobstein, T. Extended international (IOTF) body mass index cut-offs for thinness, overweight and obesity. Pediatr. Obes. 2012, 7, 284–294. [Google Scholar] [CrossRef]
- Holick, M.F. The vitamin D deficiency pandemic: Approaches for diagnosis, treatment and prevention. Rev. Endocr. Metab. Disord. 2017, 18, 153–165. [Google Scholar] [CrossRef] [PubMed]
- Munns, C.F.; Shaw, N.; Kiely, M.; Specker, B.L.; Thacher, T.D.; Ozono, K.; Michigami, T.; Tiosano, D.; Mughal, M.Z.; Mäkitie, O.; et al. Global Consensus Recommendations on Prevention and Management of Nutritional Rickets. Horm. Res. Paediatr. 2016, 85, 83–106. [Google Scholar] [CrossRef] [Green Version]
- Johansson, L.; Brissman, M.; Morinder, G.; Westerståhl, M.; Marcus, C. Reference values and secular trends for cardiorespiratory fitness in children and adolescents with obesity. Acta Paediatr. 2020, 109, 1665–1671. [Google Scholar] [CrossRef] [PubMed] [Green Version]
- Gracia-Marco, L.; Ortega, F.B.; Jimenez-Pavon, D.; Rodriguez, G.; Castillo, M.J.; Vicente-Rodriguez, G.; Moreno, L.A. Adiposity and bone health in Spanish adolescents. The HELENA study. Osteoporos. Int. 2012, 23, 937–947. [Google Scholar] [CrossRef]
- Weber, D.R.; Moore, R.H.; Leonard, M.B.; Zemel, B.S. Fat and lean BMI reference curves in children and adolescents and their utility in identifying excess adiposity compared with BMI and percentage body fat. Am. J. Clin. Nutr. 2013, 98, 49–56. [Google Scholar] [CrossRef]
- Machado, F.A.; Dendai, B.S. Validity of maximum heart rate prediction equations for children and adolescents. Arq. Bras. Cardiol. 2011, 97, 136–140. [Google Scholar] [CrossRef] [Green Version]
- Lintu, N.; Viitasalo, A.; Tompuri, T.; Veijalainen, A.; Hakulinen, M.; Laitinen, T.; Savonen, K.; Lakka, T.A. Cardiorespiratory fitness, respiratory function and hemodynamic responses to maximal cycle ergometer exercise test in girls and boys aged 9-11 years: The PANIC Study. Eur. J. Appl. Physiol. 2015, 115, 235–243. [Google Scholar] [CrossRef] [PubMed]
- Dencker, M.; Thorsson, O.; Karlsson, M.K.; Lindén, C.; Eiber, S.; Wollmer, P.; Andersen, L.B. Gender differences and determinants of aerobic fitness in children aged 8-11 years. Eur. J. Appl. Physiol. 2007, 99, 19–26. [Google Scholar] [CrossRef] [Green Version]
- Comeras-Chueca, C.; Villalba-Heredia, L.; Pérez-Llera, M.; Lozano-Berges, G.; Marín-Puyalto, J.; Vicente-Rodríguez, G.; Matute-Llorente, Á.; Casajús, J.A.; González-Agüero, A. Assessment of Active Video Games Energy Expenditure in Children with Overweight and Obesity and Differences by Gender. Int. J. Environ. Res. Public Health 2020, 17, 6714. [Google Scholar] [CrossRef] [PubMed]
- Cashman, K.D.; Dowling, K.G.; Skrabakova, Z.; Gonzalez-Gross, M.; Valtuena, J.; De Henauw, S.; Moreno, L.; Damsgaard, C.T.; Michaelsen, K.F.; Molgaard, C.; et al. Vitamin D deficiency in Europe: Pandemic? Am. J. Clin. Nutr. 2016, 103, 1033–1044. [Google Scholar] [CrossRef] [Green Version]
- Roth, D.E.; Abrams, S.A.; Aloia, J.; Bergeron, G.; Bourassa, M.W.; Brown, K.H.; Calvo, M.S.; Cashman, K.D.; Combs, G.; De-Regil, L.M.; et al. Global prevalence and disease burden of vitamin D deficiency: A roadmap for action in low- and middle-income countries. Ann. N. Y. Acad. Sci. 2018, 1430, 44–79. [Google Scholar] [CrossRef] [PubMed] [Green Version]
- Turer, C.B.; Lin, H.; Flores, G. Prevalence of vitamin D deficiency among overweight and obese US children. Pediatrics 2013, 131, 152–161. [Google Scholar] [CrossRef] [Green Version]
- Durá-Travé, T.; Gallinas-Victoriano, F.; Chueca-Guindulain, M.J.; Berrade-Zubiri, S.; Moreno-Gónzalez, P.; Malumbres-Chacón, M. Prevalence of hypovitaminosis D and associated factors in Spanish population of school children and adolescents. Aten. Primaria 2018, 50, 422–429. [Google Scholar] [CrossRef]
- Holick, M.F. Vitamin D status: Measurement, interpretation, and clinical application. Ann. Epidemiol. 2009, 19, 73–78. [Google Scholar] [CrossRef] [PubMed] [Green Version]
- Park, J.; Gong, J.; Hong, H.; Ha, C.; Kang, H. Serum Vitamin D status and its relations to body fatness and fitness and risk factors in young adults. J. Exerc. Nutr. Biochem. 2013, 17, 143–150. [Google Scholar] [CrossRef] [PubMed] [Green Version]
- Savonen, K.; Krachler, B.; Hassinen, M.; Komulainen, P.; Kiviniemi, V.; Lakka, T.A.; Rauramaa, R. The current standard measure of cardiorespiratory fitness introduces confounding by body mass: The DR’s EXTRA study. Int. J. Obes. 2012, 36, 1135–1140. [Google Scholar] [CrossRef] [PubMed] [Green Version]
- Mana, I. Growth Development and Maturity in Children and Adolescent: Relation to Sports and Physical Activity. Am. J. Sports Sci. Med. 2014, 2, 48–50. [Google Scholar] [CrossRef] [Green Version]
- Rowland, T.; Goff, D.; Martel, L.; Ferrone, L. Influence of cardiac functional capacity on gender differences in maximal oxygen uptake in children. Chest 2000, 117, 629–635. [Google Scholar] [CrossRef] [PubMed]

| Sex | Vit D | |||||
|---|---|---|---|---|---|---|
| Male (n = 30) | Female (n = 27) | p-Value | Insufficiency (n = 18) | Sufficiency (n = 39) | p-Value | |
| Age (years) | 10.1 (0.8) | 9.9 (0.8) | 0.401 | 10.0 (0.8) | 10.0 (0.8) | 0.845 |
| Weight (kg) | 57.5 (11.5) | 50.0 (7.1) | 0.005 | 52.4 (9.0) | 54.7 (10.9) | 0.437 |
| Height (cm) | 147.3 (7.1) | 142.3 (7.8) | 0.013 | 143.9 (7.6) | 145.4 (8.0) | 0.512 |
| BMI (kg/m2) † | 26.2 (3.4) | 24.6 (2.2) | 0.039 | 25.0 (4.7) | 25.8 (3.6) | 0.571 |
| BMI Z-score 1 | 2.1 (0.3) | 1.8 (0.3) | 0.009 | 1.9 (0.4) | 2.0 (0.3) | 0.477 |
| LM (kg) | 33.3 (5.0) | 29.1 (4.6) | 0.002 | 30.1 (4.7) | 31.8 (5.5) | 0.244 |
| LMI (kg/m2) 1,* | 14.4 (1.8) | 13.7 (2.0) | 0.006 | 13.8 (1.1) | 14.4 (1.4) | 0.155 |
| LMI Z-score 1 | 0.66 (0.71) | 0.45 (0.59) | 0.253 | 0.38 (0.62) | 0.65 (0.67) | 0.148 |
| FM (kg) † | 23.5 (7.1) | 20.2 (3.1) | 0.024 | 21.9 (6.5) | 21.7 (7.0) | 0.834 |
| FMI (kg/m2) 1,† | 10.7 (2.6) | 10.0 (1.4) | 0.205 | 10.3 (2.7) | 10.3 (2.3) | 0.945 |
| FMI Z-score 1 | 1.54 (0.30) | 1.33 (0.30) | 0.017 | 1.45 (0.33) | 1.44 (0.31) | 0.894 |
| Calcium (mg/dL) | 10.02 (0.35) | 9.99 (0.34) | 0.765 | 10.04 (0.37) | 10.00 (0.32) | 0.578 |
| Phosphorus (mg/dL) | 5.03 (0.57) | 4.91 (0.58) | 0.439 | 5.10 (0.40) | 4.90 (0.63) | 0.238 |
| Alkaline phosphatase (IU/L) | 116.4 (20.5) | 130.1 (39.4) | 0.115 | 124.9 (27.2) | 122.0 (33.4) | 0.750 |
| 25(OH)D (nmol/L) | 56.64 (18.27) | 62.61 (19.21) | 0.235 | 39.33 (8.64) | 68.76 (14.38) | <0.001 |
| Categories vitamin D status % (n) | ||||||
| Deficiency | 13.3 (4) | 0.0 (0) | 0.156 | - | - | - |
| Insufficiency | 16.7 (5) | 33.3 (9) | - | - | - | |
| Sufficient for bone health | 46.7 (14) | 44.4 (12) | - | - | - | |
| Optimal | 23.3 (7) | 22.2 (6) | - | - | - | |
| Resting SBP (mmHg) | 110 (8) | 104 (8) | 0.005 | 108 (9) | 107 (9) | 0.955 |
| Resting DBP (mmHg) | 69 (7) | 70 (9) | 0.523 | 71 (8) | 69 (8) | 0.956 |
| Resting HR (beats/min) | 77 (10) | 84 (9) | 0.010 | 80 (10) | 80 (10) | 0.974 |
| HRmax(beats/min) | 194 (10) | 200 (9) | 0.020 | 200 (11) | 195 (9) | 0.125 |
| Predicted HR 2 (beats/min) | 201 (1) | 201 (1) | 0.401 | 201 (1) | 201 (1) | 0.845 |
| Percentage of predicted HRmax (%) | 96.5 (4.8) | 99.4 (4.6) | 0.023 | 99.4 (5.5) | 97.2 (4.5) | 0.121 |
| VO2max (L/min) | 1.9 (0.3) | 1.6 (0.3) | 0.002 | 1.7 (0.3) | 1.8 (0.4) | 0.468 |
| VO2max (mL/kgweight/min) | 33.3 (6.1) | 32.2 (4.6) | 0.454 | 32.9 (5.6) | 32.6 (5.4) | 0.878 |
| Categories VO2 3 % (n) | ||||||
| Low CRF | 33.3 (10) | 37.0 (10) | 0.770 | 44.4 (8) | 30.8 (12) | 0.315 |
| High CRF | 66.7 (20) | 63.0 (17) | 55.6 (10) | 69.2 (27) | ||
| VO2max (mL/kgleanmass/min) | 56.8 (7.7) | 55.4 (7.1) | 0.523 | 56.8 (6.3) | 55.7 (7.9) | 0.608 |
| RER | 1.17 (0.1) | 1.24 (0.1) | 0.005 | 1.21 (0.1) | 1.20 (0.1) | 0.592 |
| Percentage of RER 4 | 112.3 (7.8) | 118.9 (9.3) | 0.005 | 116.4 (8.1) | 115.0 (9.6) | 0.592 |
| All (n = 57) | Boys (n = 30) | Girls (n = 27) | Insufficiency (n = 18) | Sufficiency (n = 39) | |
|---|---|---|---|---|---|
| BMI (kg/m2) | −0.086 (0.525) | 0.034 (0.860) | −0.178 (0.374) | 0.001 (0.996) | −0.266 (0.101) |
| LM (kg) | −0.056 (0.679) | 0.052 (0.784) | −0.041 (0.840) | 0.117 (0.644) | −0.344 (0.032) |
| LMI (kg/m2) 1,* | −0.054 (0.688) | 0.083 (0.662) | −0.085 (0.672) | −0.027 (0.916) | −0.355 (0.027) |
| FM (kg) | −0.077 (0.571) | 0.016 (0.932) | −0.157 (0.434) | 0.073 (0.772) | −0.213 (0.193) |
| FMI (kg/m2) 1 | −0.091 (0.500) | −0.012 (0.949) | −0.180 (0.369) | 0.012 (0.961) | −0.169 (0.304) |
| Calcium (mg/dL) | −0.082 (0.546) | −0.014 (0.942) | −0.144 (0.474) | −0.050 (0.844) | −0.038 (0.819) |
| Phosphorus (mg/dL) | −0.132 (0.329) | −0.101 (0.595) | −0.134 (0.507) | −0.191 (0.448) | 0.006 (0.971) |
| Alkaline phosphatase (IU/L) | 0.017 (0.901) | −0.081 (0.670) | 0.014 (0.943) | 0.362 (0.140) | 0.009 (0.957) |
| HRmax (beats/min) | 0.010 (0.944) | 0.170 (0.371) | −0.276 (0.164) | 0.182 (0.470) | 0.277 (0.087) |
| VO2max (L/min) | −0.088 (0.513) | 0.088 (0.642) | −0.142 (0.480) | −0.130 (0.606) | −0.258 (0.113) |
| VO2max (mL/kgweight/min) | −0.017 (0.900) | 0.084 (0.659) | −0.119 (0.556) | −0.250 (0.316) | 0.066 (0.689) |
| VO2max (mL/kgleanmass/min) | −0.071 (0.600) | 0.050 (0.793) | −0.182 (0.364) | −0.339 (0.168) | 0.037 (0.825) |
| RER | 0.063 (0.641) | 0.120 (0.527) | −0.098 (0.627) | 0.399 (0.101) | 0.122 (0.459) |
Publisher’s Note: MDPI stays neutral with regard to jurisdictional claims in published maps and institutional affiliations. |
© 2021 by the authors. Licensee MDPI, Basel, Switzerland. This article is an open access article distributed under the terms and conditions of the Creative Commons Attribution (CC BY) license (https://creativecommons.org/licenses/by/4.0/).
Share and Cite
Villalba-Heredia, L.; Comeras-Chueca, C.; González-Agüero, A.; Domingo-del-Val, D.; Calmarza, P.; Vicente-Rodríguez, G.; Casajús, J.A.; Matute-Llorente, Á. 25-Hydroxyvitamin D and Cardiorespiratory Fitness in Prepubertal Overweight and Obese Children. Nutrients 2021, 13, 1597. https://0-doi-org.brum.beds.ac.uk/10.3390/nu13051597
Villalba-Heredia L, Comeras-Chueca C, González-Agüero A, Domingo-del-Val D, Calmarza P, Vicente-Rodríguez G, Casajús JA, Matute-Llorente Á. 25-Hydroxyvitamin D and Cardiorespiratory Fitness in Prepubertal Overweight and Obese Children. Nutrients. 2021; 13(5):1597. https://0-doi-org.brum.beds.ac.uk/10.3390/nu13051597
Chicago/Turabian StyleVillalba-Heredia, Lorena, Cristina Comeras-Chueca, Alejandro González-Agüero, Daniel Domingo-del-Val, Pilar Calmarza, Germán Vicente-Rodríguez, José A. Casajús, and Ángel Matute-Llorente. 2021. "25-Hydroxyvitamin D and Cardiorespiratory Fitness in Prepubertal Overweight and Obese Children" Nutrients 13, no. 5: 1597. https://0-doi-org.brum.beds.ac.uk/10.3390/nu13051597