
Lifetime Weight Course as a Phenotypic Marker of Severity and Therapeutic Response in Patients with Eating Disorders

 ,
,  , , , and
Abstract
:1. Introduction
2. Materials and Methods
2.1. Participants
2.2. Assessment
2.3. Treatment
2.4. Statistical Analyses
3. Results
3.1. Comparison between the Groups for Sociodemographics, BMI, and Motivational Measures
3.2. Comparison between the Groups for Clinical Measures
3.3. Comparison between the Groups for Impulsive Behaviors
3.4. Association between Age of Onset of ED and Age of Maximum BMI
3.5. Comparison of the CBT Outcomes between the BMI Profiles
4. Discussion
Limitations and Strengths
5. Conclusions
Supplementary Materials
Author Contributions
Funding
Institutional Review Board Statement
Informed Consent Statement
Data Availability Statement
Conflicts of Interest
References
- Ortega, F.J.; Agüera, Z.; Sabater, M.; Moreno-Navarrete, J.M.; Alonso-Ledesma, I.; Xifra, G.; Botas, P.; Delgado, E.; Jimenez-Murcia, S.; Fernández-García, J.C.; et al. Genetic variations of the bitter taste receptor TAS2R38 are associated with obesity and impact on single immune traits. Mol. Nutr. Food Res. 2016, 60, 1673–1683. [Google Scholar] [CrossRef]
- Fagundo, A.; de la Torre, R.; Jimenez-Murcia, S.; Agüera, Z.; Granero, R.; Tárrega, S.; Botella, C.; Baños, R.; Fernández-Real, J.; Rodríguez, R.; et al. Executive functions profile in extreme eating/weight conditions: From anorexia nervosa to obesity. PLoS ONE 2012, 7, e43382. [Google Scholar] [CrossRef] [PubMed] [Green Version]
- Marcus, M.D.; Wildes, J.E. Obesity: Is it a mental disorder? Int. J. Eat. Disord. 2009, 42, 739–753. [Google Scholar] [CrossRef] [PubMed]
- Haines, J.; Neumark-Sztainer, D. Prevention of obesity and eating disorders: A consideration of shared risk factors. Health Educ. Res. 2006, 21, 770–782. [Google Scholar] [CrossRef] [PubMed] [Green Version]
- Neumark-Sztainer, D. The interface between the eating disorders and obesity fields: Moving toward a model of shared knowledge and collaboration. Eat. Weight Disord. 2009, 14, 51–58. [Google Scholar] [CrossRef] [PubMed]
- Rancourt, D.; McCullough, M.B. Overlap in Eating Disorders and Obesity in Adolescence. Curr. Diabetes Rep. 2015, 15, 1–9. [Google Scholar] [CrossRef]
- Abdulkadir, M.; Herle, M.; De Stavola, B.L.; Hübel, C.; Santos Ferreira, D.L.; Loos, R.J.F.; Bryant-Waugh, R.; Bulik, C.M.; Micali, N. Polygenic Score for Body Mass Index Is Associated with Disordered Eating in a General Population Cohort. J. Clin. Med. 2020, 9, 1187. [Google Scholar] [CrossRef]
- American Psychiatric Association. Diagnostic and Statistical Manual of Mental Disorders: DSM-5, 5th ed.; American Psychiatric Association: Washington, DC, USA, 2013. [Google Scholar]
- De Zwaan, M. Binge eating disorder and obesity. Int. J. Obes. Relat. Metab. Disord. 2001, 25 (Suppl. 1), S51–S55. [Google Scholar] [CrossRef] [PubMed] [Green Version]
- Agüera, Z.; Lozano-Madrid, M.; Mallorquí-Bagué, N.; Jimenez-Murcia, S.; Menchón, J.; Fernández-Aranda, F. A review of binge eating disorder and obesity. Neuropsychiatrie 2020, 1–11. [Google Scholar] [CrossRef]
- Villarejo, C.; Fernández-Aranda, F.; Jimenez-Murcia, S.; Peñas-Lledó, E.; Granero, R.; Penelo, E.; Tinahones, F.; Sancho, C.; Vilarrasa, N.; Montserrat-Gil De Bernabe, M.; et al. Lifetime obesity in patients with eating disorders: Increasing prevalence, clinical and personality correlates. Eur. Eat. Disord. Rev. 2012, 20, 250–254. [Google Scholar] [CrossRef] [PubMed] [Green Version]
- Villarejo, C.; Jimenez-Murcia, S.; Álvarez-Moya, E.M.; Granero, R.; Penelo, E.; Treasure, J.; Vilarrasa, N.; Gil-Montserrat de Bernabé, M.M.; Casanueva, F.F.; Tinahones, F.J.; et al. Loss of control over eating: A description of the eating disorder/obesity spectrum in women. Eur. Eat. Disord. Rev. 2014, 22, 25–31. [Google Scholar] [CrossRef] [Green Version]
- Davis, C.; Levitan, R.D.; Carter, J.; Kaplan, A.S.; Reid, C.; Curtis, C.; Patte, K.; Kennedy, J.L. Personality and eating behaviors: A case-control study of binge eating disorder. Int. J. Eat. Disord. 2008, 41, 243–250. [Google Scholar] [CrossRef]
- Peterson, C.B.; Thuras, P.; Ackard, D.M.; Mitchell, J.E.; Berg, K.; Sandager, N.; Wonderlich, S.A.; Pederson, M.W.; Crow, S.J. Personality dimensions in bulimia nervosa, binge eating disorder, and obesity. Compr. Psychiatry 2010, 51, 31–36. [Google Scholar] [CrossRef] [Green Version]
- Gerlach, G.; Herpertz, S.; Loeber, S. Personality traits and obesity: A systematic review. Obes. Rev. 2015, 16, 32–63. [Google Scholar] [CrossRef]
- Stemann Larsen, P.; Nybo Andersen, A.M.; Olsen, E.M.; Kragh Andersen, P.; Micali, N.; Strandberg-Larsen, K. Weight trajectories and disordered eating behaviours in 11- to 12-year-olds: A longitudinal study within the Danish National Birth Cohort. Eur. Eat. Disord. Rev. 2019, 27, 436–444. [Google Scholar] [CrossRef] [PubMed]
- Gorrell, S.; Reilly, E.E.; Schaumberg, K.; Anderson, L.M.; Donahue, J.M. Weight suppression and its relation to eating disorder and weight outcomes: A narrative review. Eat. Disord. 2019, 27, 52–81. [Google Scholar] [CrossRef] [PubMed]
- Thomas, J.G.; Butryn, M.L.; Stice, E.; Lowe, M.R. A prospective test of the relation between weight change and risk for bulimia nervosa. Int. J. Eat. Disord. 2011, 44, 295–303. [Google Scholar] [CrossRef] [PubMed] [Green Version]
- Lowe, M.R.; Feig, E.H.; Winter, S.R.; Stice, E. Short-term variability in body weight predicts long-term weight gain. Am. J. Clin. Nutr. 2015, 102, 995–999. [Google Scholar] [CrossRef] [Green Version]
- Lowe, M.R.; Davis, W.; Lucks, D.; Annunziato, R.; Butryn, M. Weight suppression predicts weight gain during inpatient treatment of bulimia nervosa. Physiol. Behav. 2006, 87, 487–492. [Google Scholar] [CrossRef] [PubMed]
- Herzog, D.B.; Thomas, J.G.; Kass, A.E.; Eddy, K.T.; Franko, D.L.; Lowe, M.R. Weight suppression predicts weight change over 5years in bulimia nervosa. Psychiatry Res. 2010, 177, 330–334. [Google Scholar] [CrossRef] [Green Version]
- Lowe, M.R.; Berner, L.A.; Swanson, S.A.; Clark, V.L.; Eddy, K.T.; Franko, D.L.; Shaw, J.A.; Ross, S.; Herzog, D.B. Weight suppression predicts time to remission from bulimia nervosa. J. Consult. Clin. Psychol. 2011, 79, 772–776. [Google Scholar] [CrossRef] [PubMed] [Green Version]
- Striegel-Moore, R.H.; Franko, D.L.; Thompson, D.; Barton, B.; Schreiber, G.B.; Daniels, S.R. Changes in weight and body image over time in women with eating disorders. Int. J. Eat. Disord. 2004, 36, 315–327. [Google Scholar] [CrossRef]
- Ivezaj, V.; Kalebjian, R.; Grilo, C.M.; Barnes, R.D. Comparing weight gain in the year prior to treatment for overweight and obese patients with and without binge eating disorder in primary care. J. Psychosom. Res. 2014, 77, 151–154. [Google Scholar] [CrossRef] [PubMed] [Green Version]
- Barnes, R.D.; Blomquist, K.K.; Grilo, C.M. Exploring pretreatment weight trajectories in obese patients with binge eating disorder. Compr. Psychiatry 2011, 52, 312–318. [Google Scholar] [CrossRef] [PubMed] [Green Version]
- Masheb, R.M.; White, M.A.; Grilo, C.M. Substantial weight gains are common prior to treatment-seeking in obese patients with binge eating disorder. Compr. Psychiatry 2013, 54, 880–884. [Google Scholar] [CrossRef] [PubMed] [Green Version]
- Keller, C.; Siegrist, M. Ambivalence toward palatable food and emotional eating predict weight fluctuations. Results of a longitudinal study with four waves. Appetite 2015, 85, 138–145. [Google Scholar] [CrossRef]
- Kjærbye-Thygesen, A.; Munk, C.; Ottesen, B.; Kjær, S.K. Why Do Slim Women Consider Themselves Too Heavy? A Characterization of Adult Women Considering Their Body Weight as Too Heavy. Int. J. Eat. Disord. 2004, 35, 275–285. [Google Scholar] [CrossRef]
- Swenne, I. Changes in body weight and body mass index (BMI) in teenage girls prior to the onset and diagnosis of an eating disorder. Acta Paediatr. Int. J. Paediatr. 2001, 90, 677–681. [Google Scholar] [CrossRef]
- De Zwaan, M.; Engeli, S.; Müller, A. Temperamental factors in severe weight cycling. A cross-sectional study. Appetite 2015, 91, 336–342. [Google Scholar] [CrossRef] [PubMed]
- Van Son, G.E.; van der Meer, P.A.M.; Van Furth, E.F. Correlates and associations between weight suppression and binge eating symptomatology in a population-based sample. Eat. Behav. 2013, 14, 102–106. [Google Scholar] [CrossRef]
- Zunker, C.; Crosby, R.D.; Mitchell, J.E.; Wonderlich, S.A.; Peterson, C.B.; Crow, S.J. Weight suppression as a predictor variable in treatment trials of bulimia nervosa and binge eating disorder. Int. J. Eat. Disord. 2011, 44, 727–730. [Google Scholar] [CrossRef] [PubMed]
- Berner, L.A.; Shaw, J.A.; Witt, A.A.; Lowe, M.R. The Relation of Weight Suppression and Body Mass Index to Symptomatology and Treatment Response in Anorexia Nervosa. J. Abnorm. Psychol. 2013, 122, 694. [Google Scholar] [CrossRef] [PubMed] [Green Version]
- Jenkins, P.E.; Lebow, J.; Rienecke, R.D. Weight suppression as a predictor variable in the treatment of eating disorders: A systematic review. J. Psychiatr. Ment. Health Nurs. 2018, 25, 297–306. [Google Scholar] [CrossRef] [PubMed]
- Lavender, J.M.; Shaw, J.A.; Crosby, R.D.; Feig, E.H.; Mitchell, J.E.; Crow, S.J.; Hill, L.; Le Grange, D.; Powers, P.; Lowe, M.R. Associations between weight suppression and dimensions of eating disorder psychopathology in a multisite sample. J. Psychiatr. Res. 2015, 69, 87–93. [Google Scholar] [CrossRef] [PubMed] [Green Version]
- American Psychiatric Association. Diagnostic and Statistical Manual of Mental Disorders: DSM-IV-TR; American Psychiatric Association: Arlington, VA, USA, 2000; Volume 4, ISBN 0890420254. [Google Scholar]
- First, M.; Williams, J.; Karg, R.; Spitzer, R. Structured Clinical Interview for DSM-5—Research Version (SCID-5 for DSM-5, Research Version SCID-5-RV); American Psychiatric Association: Arlington, VA, USA, 2015. [Google Scholar]
- Gómez-Expósito, A.; Wolz, I.; Fagundo, A.B.; Granero, R.; Steward, T.; Jimenez-Murcia, S.; Agüera, Z.; Fernández-Aranda, F. Correlates of non-suicidal self-injury and suicide attempts in bulimic spectrum disorders. Front. Psychol. 2016, 7. [Google Scholar] [CrossRef] [PubMed] [Green Version]
- Lozano-Madrid, M.; Bryan, D.C.; Sánchez, I.; Riesco, N.; Mallorquí-Bagué, N.; Jimenez-Murcia, S.; Treasure, J.; Fernández-Aranda, F. Impulsivity, Emotional Dysregulation and Executive Function Deficits Could Be Associated with Alcohol and Drug Abuse in Eating Disorders. J. Clin. Med. 2020, 9, 1936. [Google Scholar] [CrossRef]
- Garner, D. Eating Disorder Inventory-2; Psychological Assessment Resources: Odessa, Ukraine, 1991. [Google Scholar]
- Garner, D. Inventario de Trastornos de la Conducta Alimentaria (EDI-2); TEA Ediciones: Madrid, Spain, 1998. [Google Scholar]
- Derogatis, L.R. SCL-90-R. Administration, Scoring and Procedures Manual; Clinical Psychometric Research: Baltimore, MD, USA, 1990. [Google Scholar]
- Derogatis, L.R. SCL-90-R. Cuestionario de 90 Síntomas-Manual; TEA Editorial: Madrid, Spain, 2002. [Google Scholar]
- Cloninger, C.R. The Temperament and Character Inventory–Revised; Center for Psychobiology of Personality, Washington University: St. Louis, MO, USA, 1999. [Google Scholar]
- Gutiérrez-Zotes, J.A.; Bayón, C.; Montserrat, C.; Valero, J.; Labad, A.; Cloninger, C.R.; Fernández-Aranda, F. Temperament and Character Inventory—Revised (TCI-R). Standardization and normative data in a general population sample. ACTAS Esp. Psiquiatr. 2004, 32, 8–15. [Google Scholar] [PubMed]
- Casanovas, C.; Fernández-Aranda, F.; Granero, R.; Krug, I.; Jimenez-Murcia, S.; Bulik, C.M.; Vallejo-Ruiloba, J. Motivation to change in eating disorders: Clinical and therapeutic implications. Eur. Eat. Disord. Rev. 2007, 15, 449–456. [Google Scholar] [CrossRef]
- Fernández-Aranda, F.; Turón, V. Trastornos Alimentarios. Guia Basica de Tratamiento en Anorexia y Bulimia; Masson: Barcelona, Spain, 1998. [Google Scholar]
- Agüera, Z.; Riesco, N.; Jimenez-Murcia, S.; Islam, M.A.; Granero, R.; Vicente, E.; Peñas-Lledó, E.; Arcelus, J.; Sánchez, I.; Menchon, J.M.; et al. Cognitive behaviour therapy response and dropout rate across purging and nonpurging bulimia nervosa and binge eating disorder: DSM-5 implications. BMC Psychiatry 2013, 13, 285. [Google Scholar] [CrossRef] [Green Version]
- Riesco, N.; Agüera, Z.; Granero, R.; Jimenez-Murcia, S.; Menchón, J.M.; Fernández-Aranda, F. Other Specified Feeding or Eating Disorders (OSFED): Clinical heterogeneity and cognitive-behavioral therapy outcome. Eur. Psychiatry 2018, 54, 109–116. [Google Scholar] [CrossRef] [Green Version]
- Agüera, Z.; Sánchez, I.; Granero, R.; Riesco, N.; Steward, T.; Martín-Romera, V.; Jimenez-Murcia, S.; Romero, X.; Caroleo, M.; Segura-García, C.; et al. Short-Term Treatment Outcomes and Dropout Risk in Men and Women with Eating Disorders. Eur. Eat. Disord. Rev. 2017, 25. [Google Scholar] [CrossRef]
- Fernández-Aranda, F.; Treasure, J.; Paslakis, G.; Agüera, Z.; Giménez, M.; Granero, R.; Sánchez, I.; Serrano-Troncoso, E.; Gorwood, P.; Herpertz-Dahlmann, B.; et al. The impact of duration of illness on treatment nonresponse and drop-out: Exploring the relevance of enduring eating disorder concept. Eur. Eat. Disord. Rev. 2021, 29. [Google Scholar] [CrossRef]
- Agüera, Z.; Romero, X.; Arcelus, J.; Sánchez, I.; Riesco, N.; Jimenez-Murcia, S. Changes in Body Composition in Anorexia Nervosa: Predictors of Recovery and Treatment Outcome. PLoS ONE 2015, 10, 143012. [Google Scholar] [CrossRef] [Green Version]
- Custal, N.; Arcelus, J.; Agüera, Z.; Bove, F.I.; Wales, J.; Granero, R.; Jimenez-Murcia, S.; Sánchez, I.; Riesco, N.; Alonso, P.; et al. Treatment outcome of patients with comorbid type 1 diabetes and eating disorders. BMC Psychiatry 2014, 14. [Google Scholar] [CrossRef] [Green Version]
- Romero, X.; Agüera, Z.; Granero, R.; Sánchez, I.; Riesco, N.; Jimenez-Murcia, S.; Gisbert-Rodriguez, M.; Sánchez-González, J.; Casalé, G.; Baenas, I.; et al. Is food addiction a predictor of treatment outcome among patients with eating disorder? Eur. Eat. Disord. Rev. 2019, 27, 700–711. [Google Scholar] [CrossRef]
- StataCorp. Stata Statistical Software: Release 16; StataCorp LLC: College Station, TX, USA, 2019; Available online: https://www.stata.com/company/ (accessed on 2 April 2021).
- Kelley, K.; Preacher, K. On effect size. Psychol. Methods 2012, 17, 137–152. [Google Scholar] [CrossRef] [PubMed]
- Cohen, J. Statistical Power Analysis for the Behavioral Sciences, 2nd ed.; Lawrence Earlbaum Associates: Hillsdale, NJ, USA, 1988. [Google Scholar]
- Finner, H.; Roters, M. On the False Discovery Rate and Expected Type I Errors. Biom. J. 2001, 43, 985. [Google Scholar] [CrossRef]
- Razzoli, M.; Pearson, C.; Crow, S.; Bartolomucci, A. Stress, overeating, and obesity: Insights from human studies and preclinical models Graphical abstract HHS Public Access. Neurosci. Biobehav. Rev. 2017, 76, 154–162. [Google Scholar] [CrossRef] [PubMed] [Green Version]
- Vancampfort, D.; De Herdt, A.; Vanderlinden, J.; Lannoo, M.; Adriaens, A.; De Hert, M.; Stubbs, B.; Soundy, A.; Probst, M. The functional exercise capacity and its correlates in obese treatment-seeking people with binge eating disorder: An exploratory study. Disabil. Rehabil. 2015, 37, 777–782. [Google Scholar] [CrossRef] [PubMed]
- Agüera, Z.; Riesco, N.; Valenciano-Mendoza, E.; Granero, R.; Sánchez, I.; Andreu, A.; Jimenez-Murcia, S.; Fernández-Aranda, F. Illness perception in patients with eating disorders: Clinical, personality, and food addiction correlates. Eat. Weight Disord. 2021. [Google Scholar] [CrossRef] [PubMed]
- Rafiei, N.; Gill, T. Identification of factors contributing to successful self-directed weight loss: A qualitative study. J. Hum. Nutr. Diet. 2018, 31, 329–336. [Google Scholar] [CrossRef] [PubMed]
- Dalle Grave, R.; Calugi, S.; Compare, A.; El Ghoch, M.; Petroni, M.L.; Colombari, S.; Minniti, A.; Marchesini, G. Personality, attrition and weight loss in treatment seeking women with obesity. Clin. Obes. 2015, 5, 266–272. [Google Scholar] [CrossRef] [PubMed]
- Schag, K.; Leehr, E.J.; Martus, P.; Bethge, W.; Becker, S.; Zipfel, S.; Giel, K.E. Impulsivity-focused group intervention to reduce binge eating episodes in patients with binge eating disorder: Study protocol of the randomised controlled IMPULS trial. MJOpen 2015, e009445. [Google Scholar] [CrossRef]
- Gonçalves, S.; Machado, B.; Silva, C.; Crosby, R.D.; Lavender, J.M.; Cao, L.; Machado, P.P.P. The Moderating Role of Purging Behaviour in the Relationship Between Sexual/Physical Abuse and Nonsuicidal Self-Injury in Eating Disorder Patients. Eur. Eat. Disord. Rev. 2016, 24, 164–168. [Google Scholar] [CrossRef]
- Fouladi, F.; Mitchell, J.E.; Crosby, R.D.; Engel, S.G.; Crow, S.; Hill, L.; Le Grange, D.; Powers, P.; Steffen, K.J. Prevalence of alcohol and other substance use in patients with eating disorders. Eur. Eat. Disord. Rev. 2015, 23, 531–536. [Google Scholar] [CrossRef]
- Bahji, A.; Mazhar, M.N.; Hudson, C.C.; Nadkarni, P.; MacNeil, B.A.; Hawken, E. Prevalence of substance use disorder comorbidity among individuals with eating disorders: A systematic review and meta-analysis. Psychiatry Res. 2019, 273, 58–66. [Google Scholar] [CrossRef] [PubMed]


| OB-OB n = 74 | OB-NW n = 156 | NW-NW n = 756 | NW-OB n = 314 | OB-OB vs OB-NW | OB-OB vs NW-NW | OB-OB vs NW-OB | OB-NW vs NW-NW | OB-NW vs NW-OB | NW-NW vs NW-OB | |||||||||||
|---|---|---|---|---|---|---|---|---|---|---|---|---|---|---|---|---|---|---|---|---|
| n | % | n | % | n | % | n | % | p | |h| | p | |h| | p | |h| | p | |h| | p | |h| | p | |h| | |
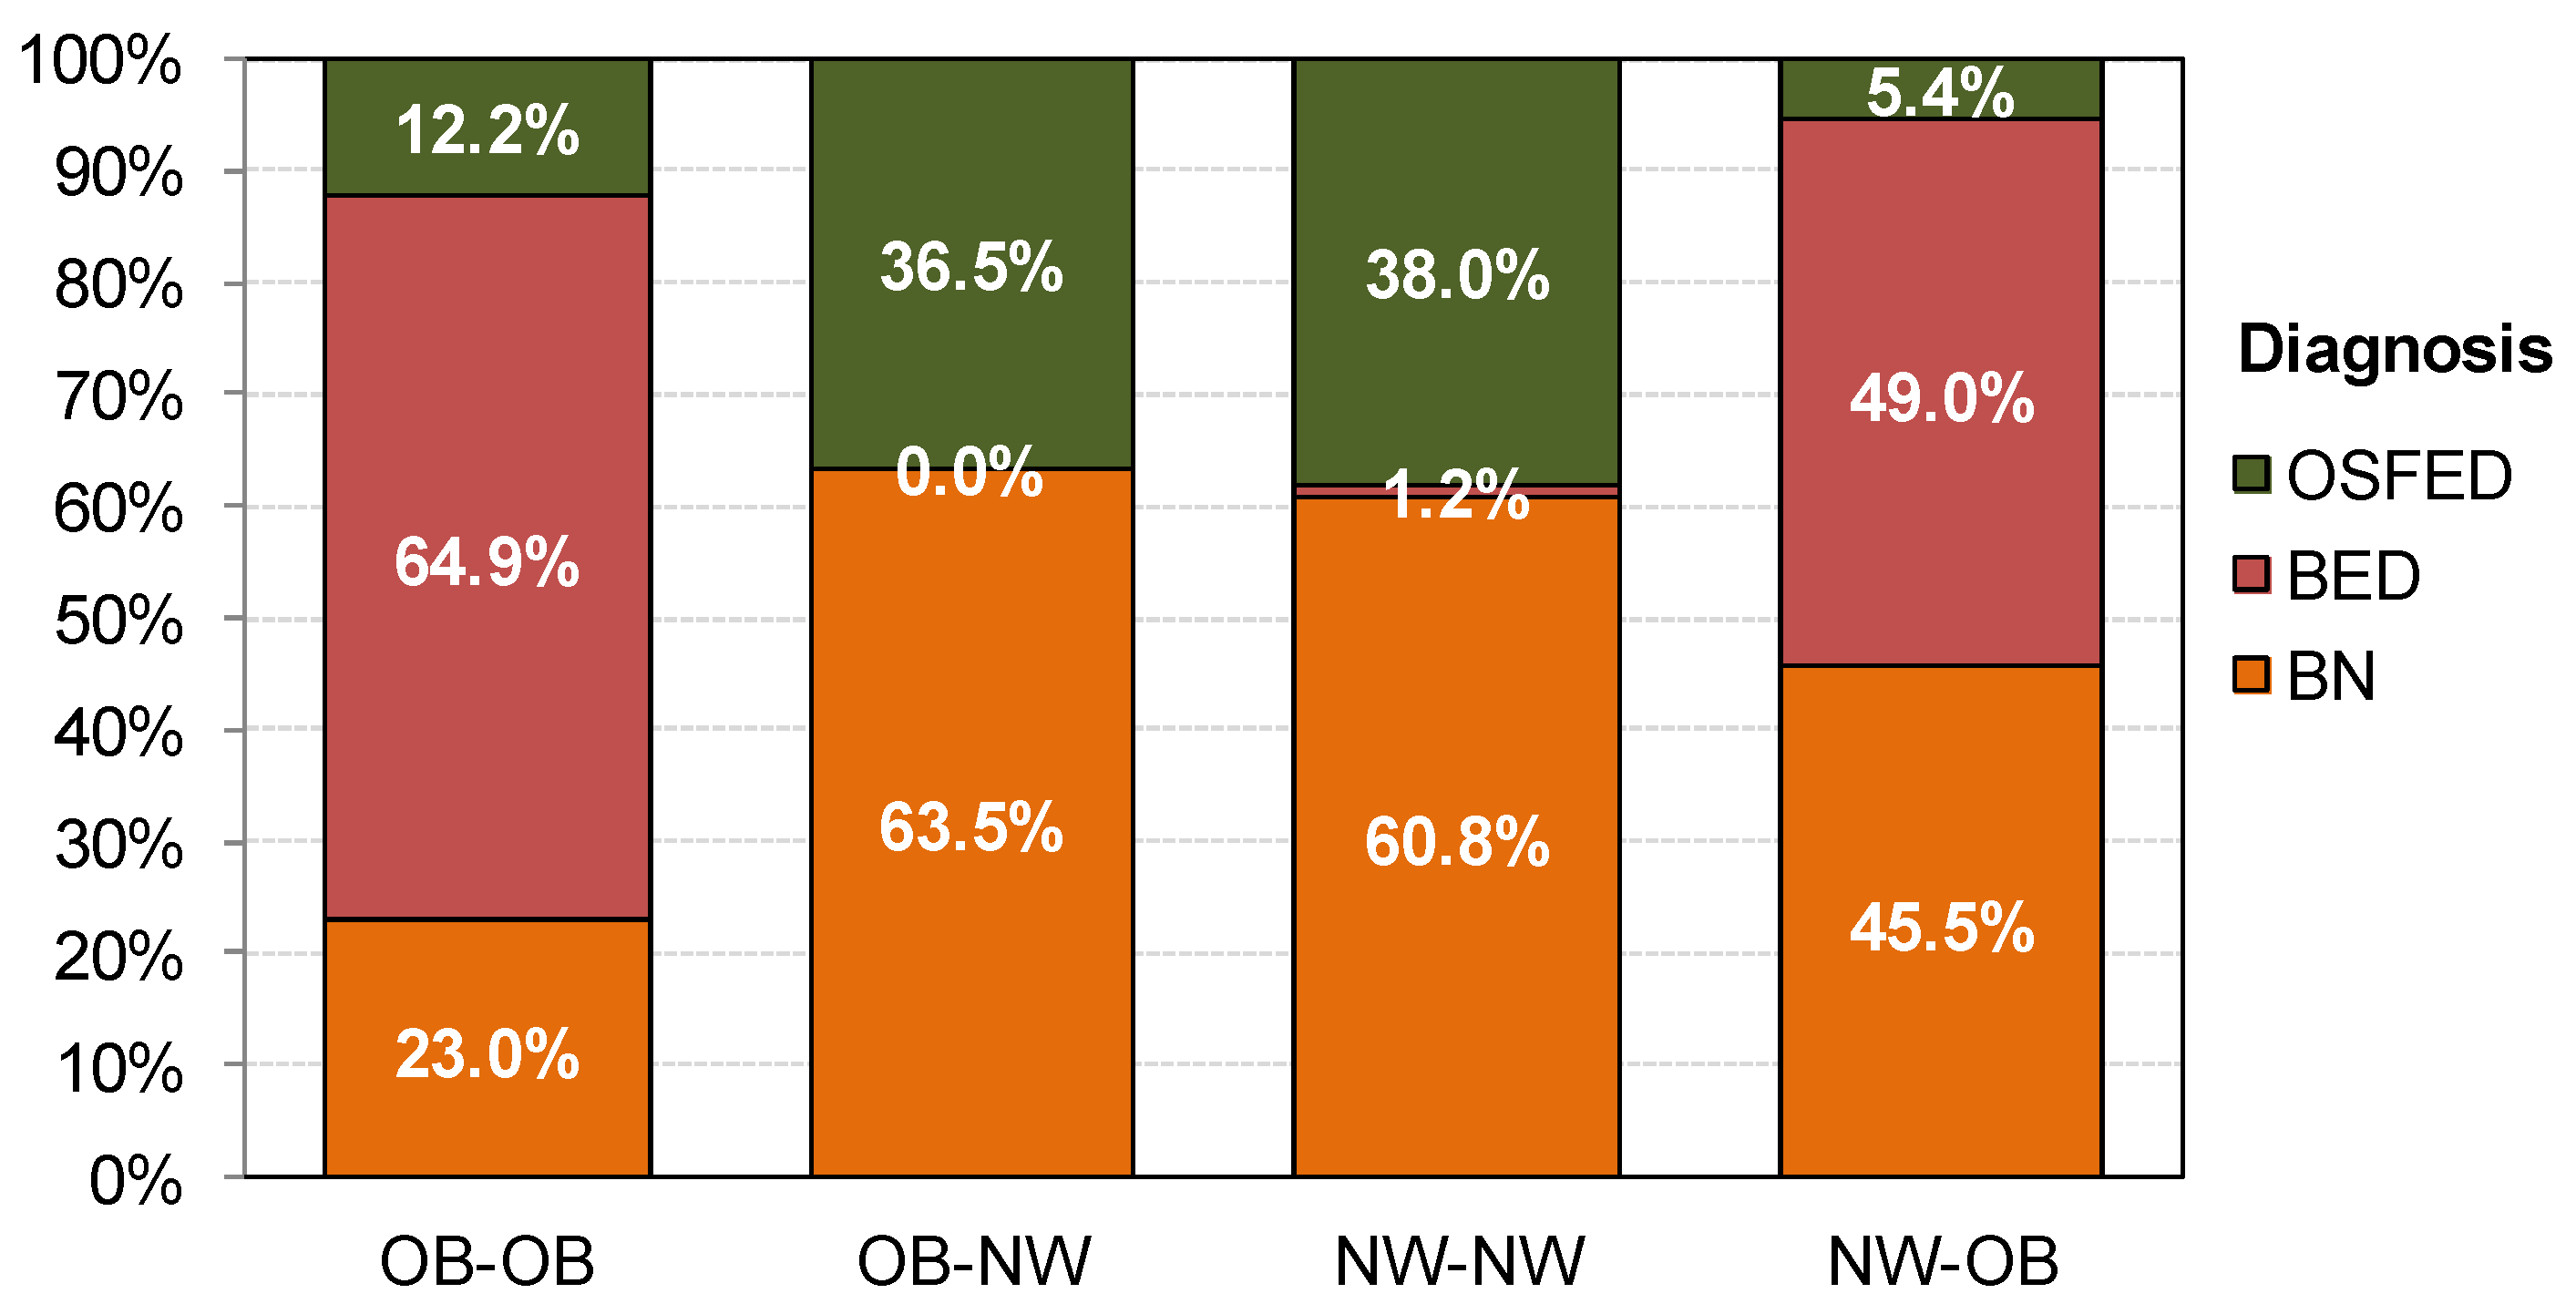
| Diagnosis BN | 17 | 23.0% | 99 | 63.5% | 460 | 60.8% | 143 | 45.5% | <0.001 | 0.90† | <0.001 | 0.83 † | 0.001 | 0.52 † | 0.355 | 0.05 | <0.001 | 0.37 | <0.001 | 0.31 |
| BED | 48 | 64.9% | 0 | 0.0% | 9 | 1.2% | 154 | 49.0% | 1.92† | 1.84 † | 0.32 | 0.16 | 1.39† | 1.32 † | ||||||
| OSFED | 9 | 12.2% | 57 | 36.5% | 287 | 38.0% | 17 | 5.4% | 0.59† | 0.62 † | 0.24 | 0.03 | 0.83† | 0.86† | ||||||
| Gender Female | 64 | 86.5% | 124 | 79.5% | 734 | 97.1% | 296 | 94.3% | 0.199 | 0.19 | <0.001 | 0.39 | 0.020 | 0.27 | <0.001 | 0.57† | <0.001 | 0.45 | 0.027 | 0.14 |
| Male | 10 | 13.5% | 32 | 20.5% | 22 | 2.9% | 18 | 5.7% | ||||||||||||
| Education Primary | 42 | 56.8% | 89 | 57.1% | 294 | 38.9% | 156 | 49.7% | 0.969 | 0.01 | 0.009 | 0.36 | 0.209 | 0.14 | <0.001 | 0.37 | 0.041 | 0.15 | 0.002 | 0.22 |
| Secondary | 26 | 35.1% | 53 | 34.0% | 344 | 45.5% | 108 | 34.4% | 0.02 | 0.21 | 0.02 | 0.24 | 0.01 | 0.23 | ||||||
| University | 6 | 8.1% | 14 | 9.0% | 118 | 15.6% | 50 | 15.9% | 0.03 | 0.23 | 0.24 | 0.20 | 0.21 | 0.01 | ||||||
| Civil status Single | 42 | 56.8% | 111 | 71.2% | 654 | 86.5% | 125 | 39.8% | 0.003 * | 0.30 | <0.001 | 0.70† | 0.026 | 0.34 | <0.001 | 0.38 | <0.001 | 0.66† | <0.001 | 1.11† |
| Partner | 27 | 36.5% | 26 | 16.7% | 68 | 9.0% | 151 | 48.1% | 0.51† | 0.69 † | 0.24 | 0.23 | 0.71 † | 0.96 † | ||||||
| separated | 5 | 6.8% | 19 | 12.2% | 34 | 4.5% | 38 | 12.1% | 0.19 | 0.10 | 0.18 | 0.28 | 0.00 | 0.28 | ||||||
| Unemployed | 25 | 33.8% | 63 | 40.4% | 202 | 26.7% | 160 | 51.0% | 0.341 | 0.14 | <0.001 | 0.15 | <0.001 | 0.35 | <0.001 | 0.29 | <0.001 | 0.21 | <0.001 | 0.51 † |
| Student | 18 | 24.3% | 43 | 27.6% | 385 | 50.9% | 24 | 7.6% | 0.07 | 0.57 † | 0.51 † | 0.52 † | 0.54 † | 1.08 † | ||||||
| Employed | 31 | 41.9% | 50 | 32.1% | 169 | 22.4% | 130 | 41.4% | 0.20 | 0.43 | 0.01 | 0.22 | 0.19 | 0.42 | ||||||
| BMI measures | Mean | SD | Mean | SD | Mean | SD | Mean | SD | p | |d| | p | |d| | p | |d| | p | |d| | p | |d| | p | |d| |
| BMI current | 44.95 | 9.46 | 22.16 | 1.74 | 20.81 | 1.66 | 36.54 | 5.25 | <0.001 | 3.35 † | <0.001 | 3.55 † | <0.001 | 1.10 † | <0.001 | 0.80 † | <0.001 | 3.67 † | <0.001 | 4.04 † |
| BMI max. | 48.45 | 9.50 | 34.72 | 4.94 | 22.76 | 1.43 | 38.48 | 5.79 | <0.001 | 1.81 † | <0.001 | 3.78 † | <0.001 | 1.27 † | <0.001 | 3.29 † | <0.001 | 0.70 † | <0.001 | 3.73 † |
| BMI min. | 33.41 | 3.17 | 19.92 | 2.55 | 17.99 | 1.88 | 21.89 | 2.17 | <0.001 | 4.69 † | <0.001 | 5.92 † | <0.001 | 4.24 † | <0.001 | 0.86 † | <0.001 | 0.83 † | <0.001 | 1.92 † |
| Motivation: Intensity | 6.14 | 1.62 | 5.64 | 2.17 | 5.12 | 1.97 | 6.24 | 1.75 | 0.069 | 0.26 | <0.001 | 0.56 † | 0.667 | 0.06 | 0.002 | 0.25 | 0.001 | 0.31 | <0.001 | 0.60 † |
| Need treatment | 6.74 | 1.48 | 5.87 | 2.28 | 5.71 | 2.18 | 6.74 | 1.66 | 0.003 | 0.52 † | <0.001 | 0.56 † | 0.987 | 0.00 | 0.361 | 0.07 | <0.001 | 0.44 | <0.001 | 0.53 † |
| Social impairment | 5.18 | 2.56 | 4.90 | 2.55 | 4.69 | 2.36 | 5.32 | 2.36 | 0.410 | 0.11 | 0.099 | 0.20 | 0.630 | 0.06 | 0.335 | 0.08 | 0.069 | 0.17 | <0.001 | 0.27 |
| Self-concern | 7.00 | 1.09 | 6.15 | 2.18 | 6.13 | 2.14 | 6.96 | 1.59 | 0.003 | 0.51 † | <0.001 | 0.51 † | 0.881 | 0.03 | 0.871 | 0.01 | <0.001 | 0.42 | <0.001 | 0.44 |
| Family concern | 6.09 | 2.32 | 6.57 | 2.09 | 6.68 | 2.00 | 5.95 | 2.36 | 0.112 | 0.22 | 0.023 | 0.27 | 0.595 | 0.06 | 0.553 | 0.05 | 0.003 | 0.28 | <0.001 | 0.33 |
| OB-OB n = 74 | OB-NW n = 156 | NW-NW n = 756 | NW-OB n = 314 | OB-OB vs OB-NW | OB-OB vs NW-NW | OB-OB vs NW-OB | OB-NW vs NW-NW | OB-NW vs NW-OB | NW-NW vs NW-OB | |||||||||||
|---|---|---|---|---|---|---|---|---|---|---|---|---|---|---|---|---|---|---|---|---|
| Mean | SD | Mean | SD | Mean | SD | Mean | SD | p | |d| | p | |d| | p | |d| | p | |d| | p | |d| | p | |d| | |
| Age (years-old) | 32.70 | 10.56 | 29.12 | 9.01 | 24.91 | 7.60 | 37.61 | 10.77 | 0.004 * | 0.36 | 0.001 * | 0.85 † | 0.001 * | 0.51 † | 0.001 * | 0.51 † | 0.001 * | 0.86 † | 0.001 * | 1.36 † |
| Onset of ED | 19.91 | 8.84 | 20.88 | 8.74 | 17.76 | 4.88 | 25.28 | 10.82 | 0.356 | 0.11 | 0.018 | 0.30 | 0.001 * | 0.54 † | 0.001 * | 0.44 | 0.001 * | 0.45 | 0.001 * | 0.90 † |
| Duration of ED | 12.80 | 8.62 | 8.27 | 7.21 | 7.19 | 6.95 | 12.41 | 10.01 | 0.001 * | 0.57 † | 0.001 * | 0.72 † | 0.708 | 0.04 | 0.122 | 0.15 | 0.001 * | 0.51 † | 0.001 * | 0.61 † |
| Binges/week | 3.98 | 4.94 | 3.97 | 6.13 | 4.11 | 5.77 | 6.16 | 5.59 | 0.988 | 0.00 | 0.850 | 0.02 | 0.003 * | 0.41 | 0.775 | 0.02 | 0.001 * | 0.37 | 0.001 * | 0.36 |
| Vomits/week | 1.63 | 4.67 | 7.04 | 9.40 | 5.16 | 7.38 | 2.46 | 6.14 | 0.001 * | 0.73 † | 0.001 * | 0.57 † | 0.376 | 0.15 | 0.003 * | 0.22 | 0.001 * | 0.58 † | 0.001 * | 0.40 |
| EDI-2: Total score | 113.26 | 38.67 | 109.56 | 45.35 | 100.72 | 40.28 | 111.45 | 38.26 | 0.517 | 0.09 | 0.011 * | 0.32 | 0.729 | 0.05 | 0.013 | 0.21 | 0.633 | 0.05 | 0.001 * | 0.27 |
| SCL-90R GSI | 1.73 | 0.73 | 1.87 | 0.75 | 1.72 | 0.70 | 1.91 | 0.73 | 0.161 | 0.19 | 0.875 | 0.02 | 0.059 | 0.24 | 0.014 * | 0.21 | 0.638 | 0.04 | 0.001 * | 0.26 |
| SCL-90R PST | 62.12 | 16.26 | 65.42 | 18.65 | 64.78 | 17.00 | 66.32 | 15.82 | 0.167 | 0.19 | 0.196 | 0.16 | 0.054 | 0.26 | 0.669 | 0.04 | 0.583 | 0.05 | 0.174 | 0.09 |
| SCL-90R PSDI | 2.44 | 0.55 | 2.49 | 0.60 | 2.29 | 0.53 | 2.52 | 0.56 | 0.484 | 0.09 | 0.032 * | 0.27 | 0.252 | 0.15 | 0.001 * | 0.35 | 0.615 | 0.05 | 0.001 * | 0.41 |
| Novelty seeking | 101.88 | 15.70 | 99.28 | 17.08 | 104.22 | 15.38 | 101.97 | 15.76 | 0.242 | 0.16 | 0.222 | 0.15 | 0.965 | 0.01 | 0.001 * | 0.30 | 0.081 | 0.16 | 0.033 * | 0.14 |
| Harm avoidance | 121.05 | 18.82 | 116.81 | 20.07 | 114.81 | 19.27 | 122.98 | 18.02 | 0.115 | 0.22 | 0.007 * | 0.33 | 0.434 | 0.10 | 0.232 | 0.10 | 0.001 * | 0.32 | 0.001 * | 0.44 |
| Reward dependence | 104.08 | 17.36 | 99.02 | 14.53 | 102.35 | 14.85 | 102.31 | 15.68 | 0.018 * | 0.32 | 0.348 | 0.11 | 0.366 | 0.11 | 0.013 * | 0.23 | 0.027 * | 0.22 | 0.969 | 0.00 |
| Persistence | 103.64 | 17.22 | 106.80 | 21.26 | 110.63 | 19.65 | 104.18 | 20.87 | 0.263 | 0.16 | 0.004 * | 0.38 | 0.833 | 0.03 | 0.030 * | 0.19 | 0.182 | 0.12 | 0.001 * | 0.32 |
| Self-directedness | 114.07 | 19.96 | 113.45 | 19.45 | 115.94 | 19.61 | 111.05 | 20.23 | 0.824 | 0.03 | 0.436 | 0.09 | 0.238 | 0.15 | 0.151 | 0.13 | 0.216 | 0.12 | 0.001 * | 0.25 |
| Cooperativeness | 132.88 | 18.23 | 130.37 | 16.32 | 133.36 | 15.23 | 132.57 | 16.65 | 0.264 | 0.14 | 0.803 | 0.03 | 0.881 | 0.02 | 0.033 * | 0.19 | 0.158 | 0.13 | 0.458 | 0.05 |
| Self-transcendence | 68.95 | 15.31 | 64.28 | 14.21 | 64.98 | 14.20 | 66.58 | 15.82 | 0.024 * | 0.32 | 0.027 * | 0.27 | 0.213 | 0.15 | 0.585 | 0.05 | 0.109 | 0.15 | 0.104 | 0.11 |
| OB-OB G1; n = 74 | OB-NW G2; n = 156 | NW-NW G3; n = 756 | NW-OB G4; n = 314 | G1 vs G2 | G1 vs G3 | G1 vs G4 | G2 vs G3 | G2 vs G4 | G3 vs G4 | |||||||||||
|---|---|---|---|---|---|---|---|---|---|---|---|---|---|---|---|---|---|---|---|---|
| n | % | n | % | n | % | n | % | p | |h| | p | |h| | p | |h| | p | |h| | p | |h| | p | |h| | |
| NSSI | 18 | 24.3% | 60 | 38.5% | 257 | 34.0% | 90 | 28.7% | 0.034 * | 0.31 | 0.092 | 0.21 | 0.454 | 0.10 | 0.286 | 0.09 | 0.032 * | 0.21 | 0.090 | 0.12 |
| Suicidal ideation | 37 | 50.0% | 85 | 54.5% | 367 | 48.5% | 181 | 57.6% | 0.524 | 0.09 | 0.811 | 0.03 | 0.233 | 0.15 | 0.177 | 0.12 | 0.516 | 0.06 | 0.007 * | 0.18 |
| Suicidal attempts | 16 | 21.6% | 39 | 25.0% | 147 | 19.4% | 80 | 25.5% | 0.575 | 0.08 | 0.653 | 0.05 | 0.489 | 0.09 | 0.117 | 0.13 | 0.911 | 0.01 | 0.028 * | 0.14 |
| Alcohol abuse | 1 | 1.4% | 16 | 10.3% | 77 | 10.2% | 24 | 7.6% | 0.016 * | 0.39 | 0.013 * | 0.39 | 0.047 * | 0.31 | 0.979 | 0.00 | 0.339 | 0.09 | 0.195 | 0.09 |
| Drugs abuse | 8 | 10.8% | 28 | 17.9% | 157 | 20.8% | 41 | 13.1% | 0.164 | 0.20 | 0.041 * | 0.28 | 0.601 | 0.07 | 0.425 | 0.07 | 0.158 | 0.14 | 0.003 * | 0.21 |
| OB-OB G1; n = 69 | OB-NW G2; n = 125 | NW-NW G3; n = 558 | NW-OB G4; n = 260 | G1 vs G2 | G1 vs G3 | G1 vs G4 | G2 vs G3 | G2 vs G4 | G3 vs G4 | |||||||||||
|---|---|---|---|---|---|---|---|---|---|---|---|---|---|---|---|---|---|---|---|---|
| Maximum BMI | n | % | n | % | n | % | n | % | p | |h| | p | |h| | p | |h| | p | |h| | p | |h| | p | |h| |
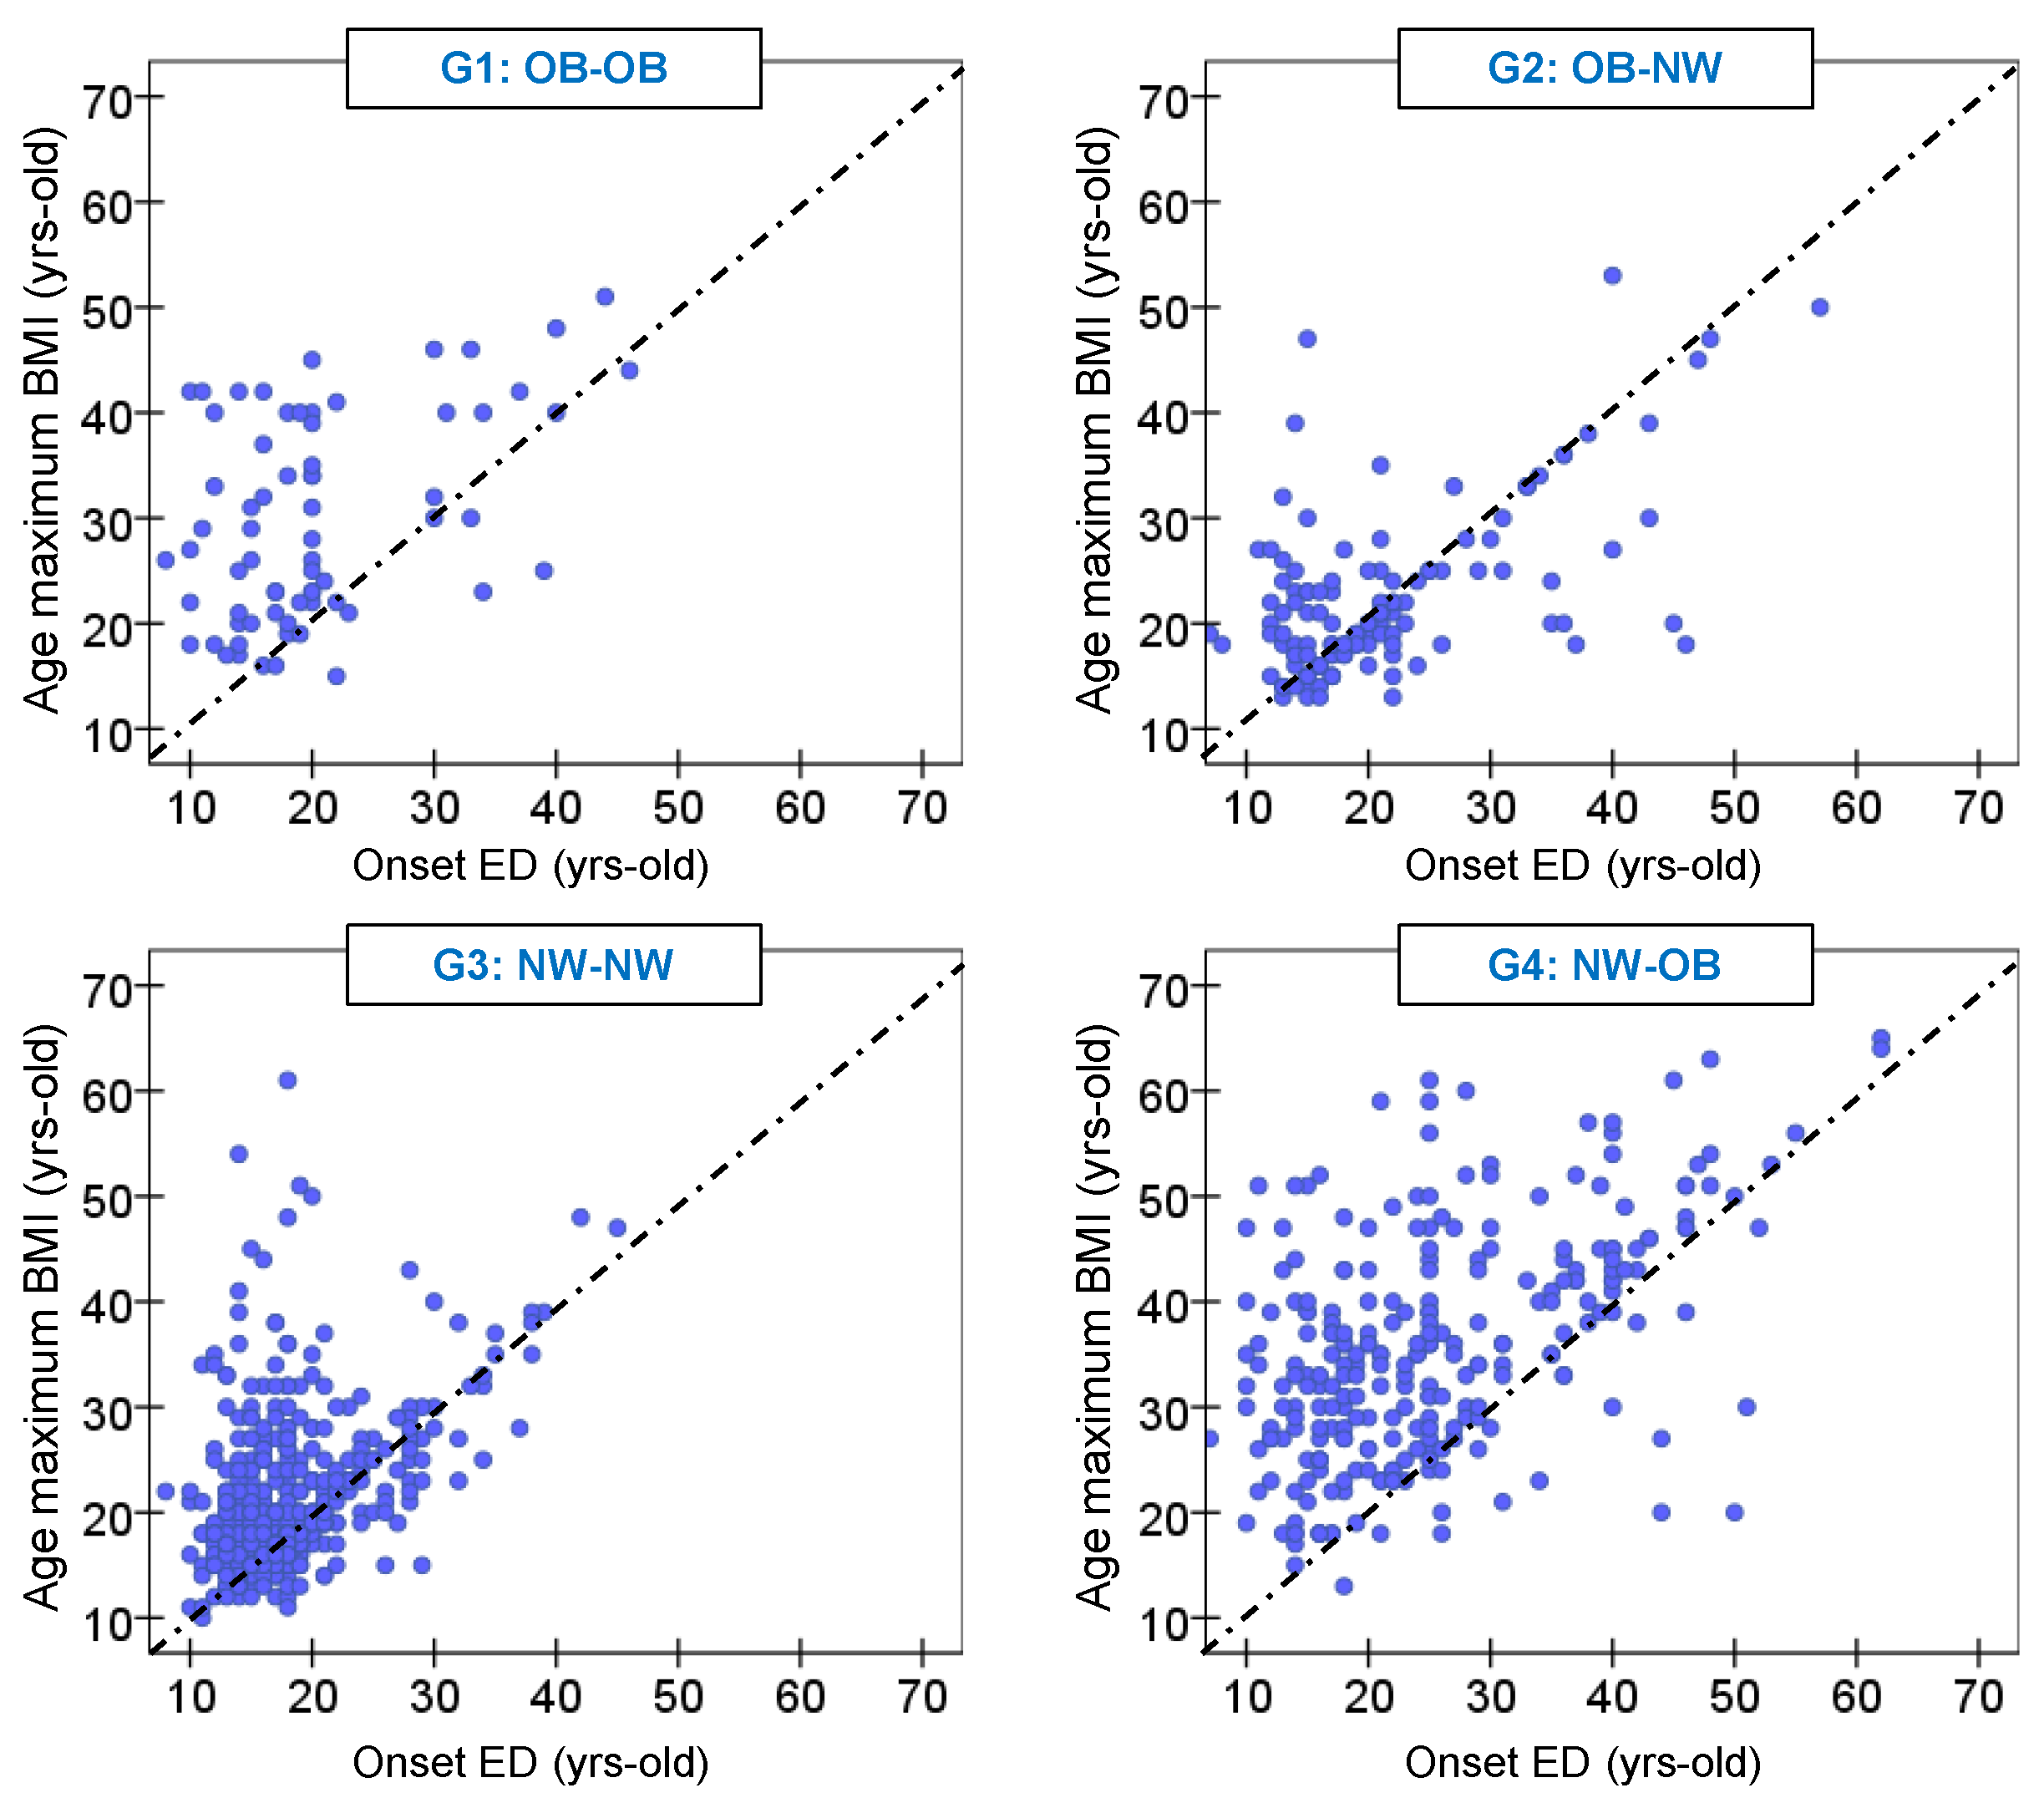
| Previous onset ED | 7 | 10.1% | 44 | 35.2% | 137 | 24.6% | 21 | 8.1% | 0.001 * | 0.63 † | 0.001 * | 0.39 | 0.564 | 0.07 | 0.008 * | 0.23 | 0.001 * | 0.70 † | 0.001 * | 0.51 † |
| Coincides onset ED | 5 | 7.2% | 34 | 27.2% | 128 | 22.9% | 12 | 4.6% | 0.55 † | 0.51 † | 0.11 | 0.10 | 0.65 † | 0.55 † | ||||||
| Posterior onset ED | 57 | 82.6% | 47 | 37.6% | 293 | 52.5% | 227 | 87.3% | 1.03 † | 0.68 † | 0.13 | 0.30 | 1.20 † | 0.82 † | ||||||
| OB-OB G1; n = 29 | OB-NW G2; n = 60 | NW-NW G3; n = 282 | NW-OB G4; n = 129 | G1 vs G2 | G1 vs G3 | G1 vs G4 | G2 vs G3 | G2 vsG4 | G3 vs G4 | |||||||||||
|---|---|---|---|---|---|---|---|---|---|---|---|---|---|---|---|---|---|---|---|---|
| n | % | n | % | n | % | n | % | p | |h| | p | |h| | p | |h| | p | |h| | p | |h| | p | |h| | |
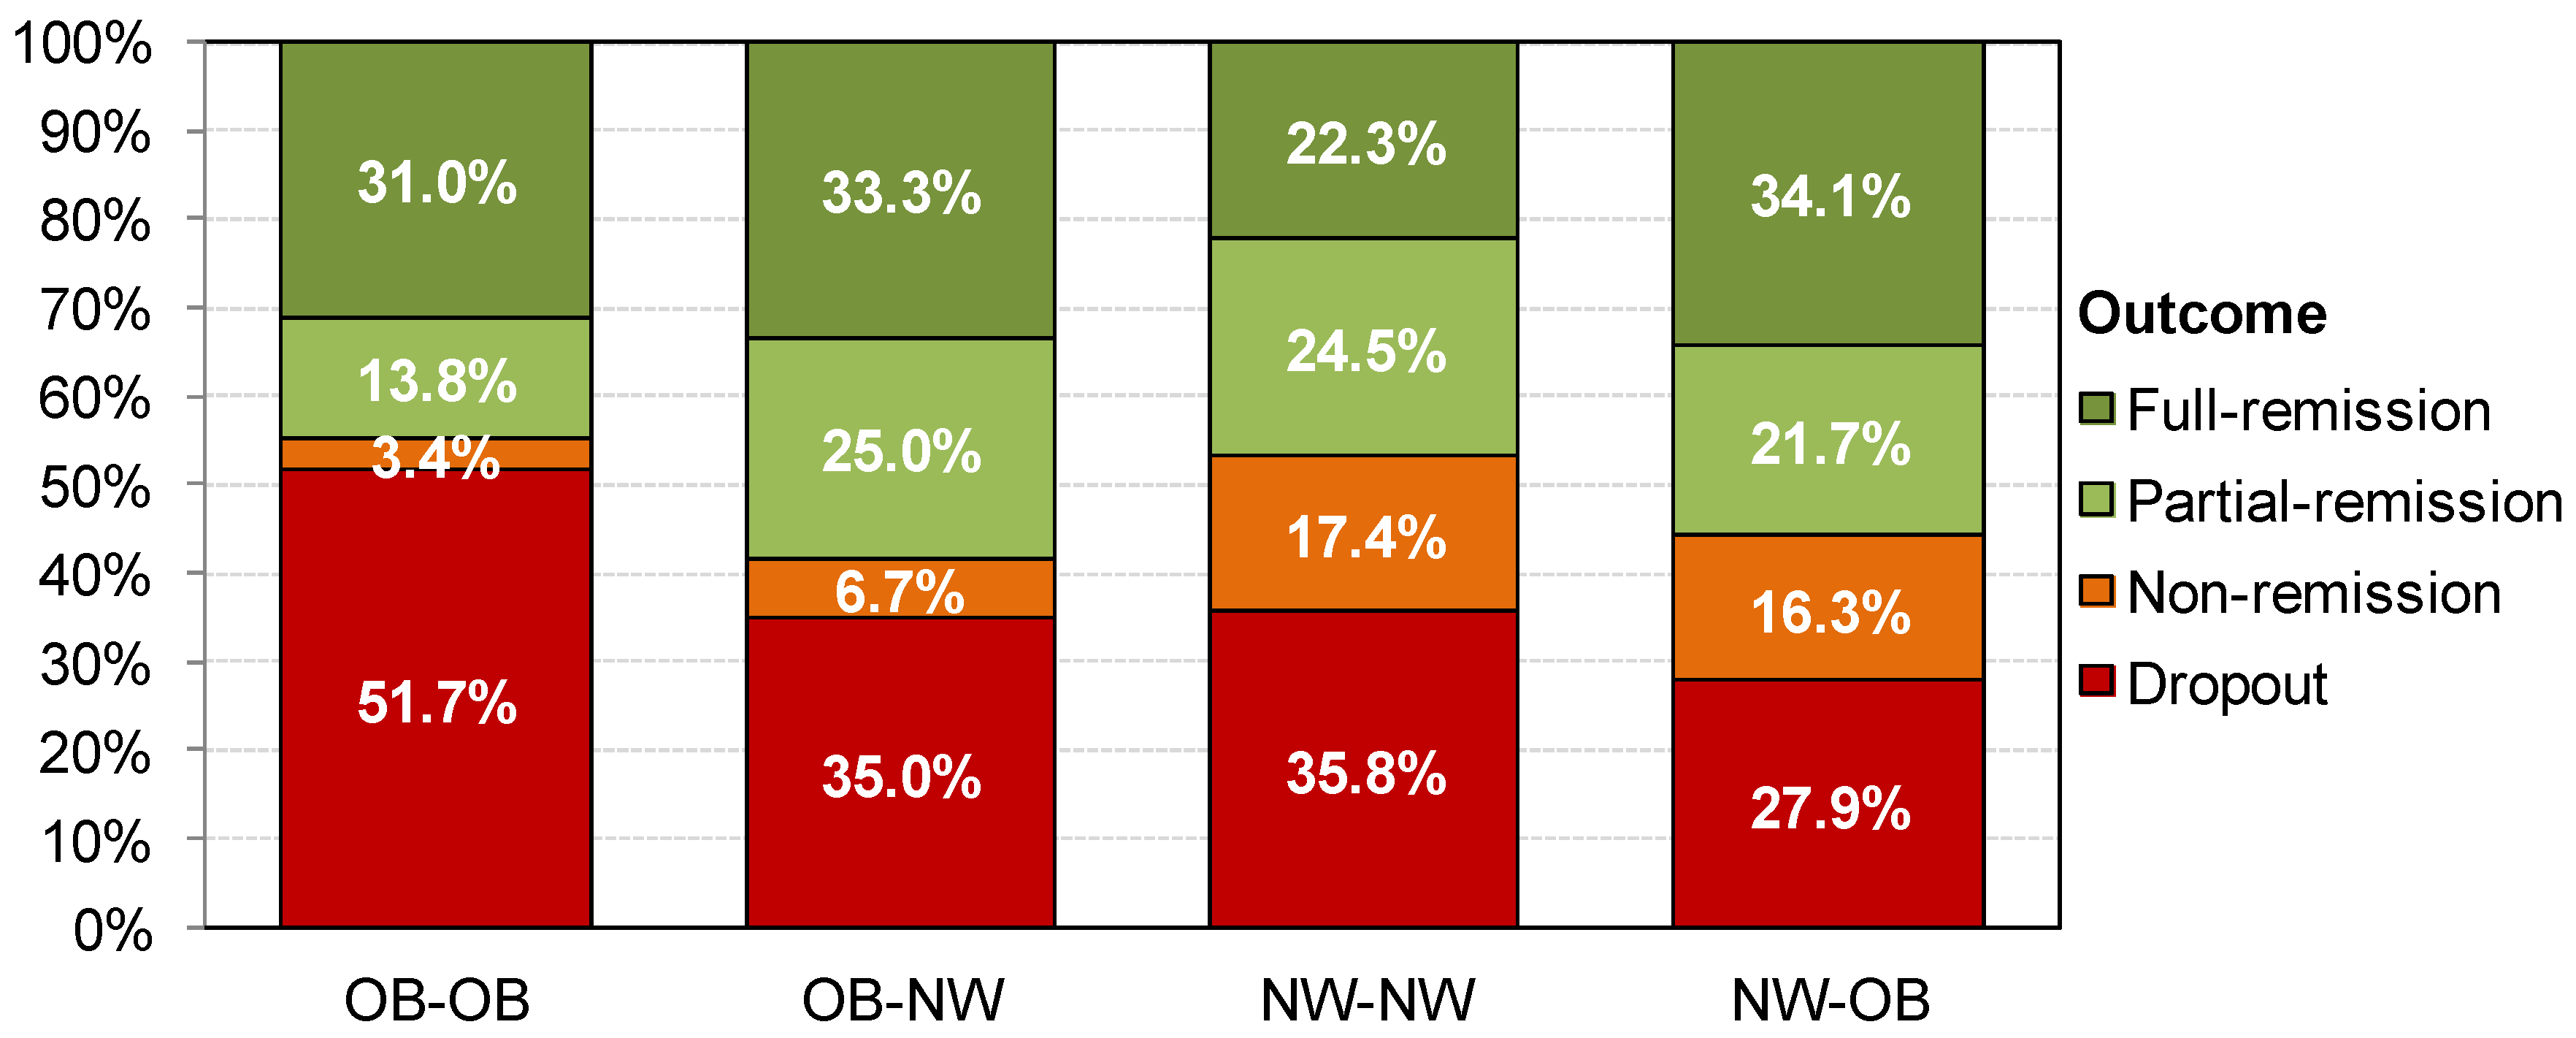
| Drop out | 15 | 51.7% | 21 | 35.0% | 101 | 35.8% | 36 | 27.9% | 0.408 | 0.34 | 0.038 * | 0.32 | 0.040 * | 0.51 † | 0.105 | 0.02 | 0.290 | 0.15 | 0.081 | 0.17 |
| Non-remission | 1 | 3.4% | 4 | 6.7% | 49 | 17.4% | 21 | 16.3% | 0.15 | 0.50 † | 0.44 | 0.33 | 0.31 | 0.03 | ||||||
| Partial-remission | 4 | 13.8% | 15 | 25.0% | 69 | 24.5% | 28 | 21.7% | 0.29 | 0.27 | 0.21 | 0.01 | 0.08 | 0.07 | ||||||
| Full-remission | 9 | 31.0% | 20 | 33.3% | 63 | 22.3% | 44 | 34.1% | 0.05 | 0.20 | 0.07 | 0.25 | 0.02 | 0.26 | ||||||
Publisher’s Note: MDPI stays neutral with regard to jurisdictional claims in published maps and institutional affiliations. |
© 2021 by the authors. Licensee MDPI, Basel, Switzerland. This article is an open access article distributed under the terms and conditions of the Creative Commons Attribution (CC BY) license (https://creativecommons.org/licenses/by/4.0/).
Share and Cite
Agüera, Z.; Vintró-Alcaraz, C.; Baenas, I.; Granero, R.; Sánchez, I.; Sánchez-González, J.; Menchón, J.M.; Jiménez-Murcia, S.; Treasure, J.; Fernández-Aranda, F. Lifetime Weight Course as a Phenotypic Marker of Severity and Therapeutic Response in Patients with Eating Disorders. Nutrients 2021, 13, 2034. https://0-doi-org.brum.beds.ac.uk/10.3390/nu13062034
Agüera Z, Vintró-Alcaraz C, Baenas I, Granero R, Sánchez I, Sánchez-González J, Menchón JM, Jiménez-Murcia S, Treasure J, Fernández-Aranda F. Lifetime Weight Course as a Phenotypic Marker of Severity and Therapeutic Response in Patients with Eating Disorders. Nutrients. 2021; 13(6):2034. https://0-doi-org.brum.beds.ac.uk/10.3390/nu13062034
Chicago/Turabian StyleAgüera, Zaida, Cristina Vintró-Alcaraz, Isabel Baenas, Roser Granero, Isabel Sánchez, Jéssica Sánchez-González, José M. Menchón, Susana Jiménez-Murcia, Janet Treasure, and Fernando Fernández-Aranda. 2021. "Lifetime Weight Course as a Phenotypic Marker of Severity and Therapeutic Response in Patients with Eating Disorders" Nutrients 13, no. 6: 2034. https://0-doi-org.brum.beds.ac.uk/10.3390/nu13062034