
Longitudinal Plasma Metabolomics Profile in Pregnancy—A Study in an Ethnically Diverse U.S. Pregnancy Cohort


 , ,
, ,
Abstract
:1. Introduction
2. Materials and Methods
2.1. Quantification of Metabolites
2.2. Covariate Measurement
2.3. Statistical Analysis
2.4. Linear Trajectories
2.5. Flexible Non-Linear Trajectories
2.6. Grouping Flexible Trajectories
2.7. Sensitivity Analyses
3. Results
3.1. Metabolite Concentrations over Time
3.2. Trajectory Variation by BMI, Fetal Sex, Race/Ethnicity
3.3. Grouping Flexible Components
3.4. Sensitivity Analyses
4. Discussion
5. Conclusions
Supplementary Materials
Author Contributions
Funding
Institutional Review Board Statement
Informed Consent Statement
Data Availability Statement
Acknowledgments
Conflicts of Interest
References
- Sadovsky, Y.; Mesiano, S.; Burton, G.J.; Lampl, M.; Murray, J.C.; Freathy, R.M.; Mahadevan-Jansen, A.; Moffett, A.; Price, N.D.; Wise, P.H.; et al. Advancing human health in the decade ahead: Pregnancy as a key window for discovery. Am. J. Obstet. Gynecol. 2020, 223, 312–321. [Google Scholar] [CrossRef]
- Chen, Q.; Francis, E.; Hu, G.; Chen, L. Metabolomic profiling of women with gestational diabetes mellitus and their offspring: Review of metabolomics studies. J. Diabetes Its Complicat. 2018, 32, 512–523. [Google Scholar] [CrossRef] [Green Version]
- Zhu, Y.; Li, M.; Rahman, M.L.; Hinkle, S.N.; Wu, J.; Weir, N.L.; Lin, Y.; Yang, H.; Tsai, M.Y.; Ferrara, A.; et al. Plasma phospholipid n-3 and n-6 polyunsaturated fatty acids in relation to cardiometabolic markers and gestational diabetes: A longitudinal study within the prospective NICHD Fetal Growth Studies. PLoS Med. 2019, 16, e1002910. [Google Scholar] [CrossRef] [PubMed]
- Zhu, Y.; Tsai, M.Y.; Sun, Q.; Hinkle, S.N.; Rawal, S.; Mendola, P.; Ferrara, A.; Albert, P.S.; Zhang, C. A prospective and longitudinal study of plasma phospholipid saturated fatty acid profile in relation to cardiometabolic biomarkers and the risk of gestational diabetes. Am. J. Clin. Nutr. 2018, 107, 1017–1026. [Google Scholar] [CrossRef] [PubMed] [Green Version]
- Tobias, D.K.; Clish, C.; Mora, S.; Li, J.; Liang, L.; Hu, F.B.; Manson, J.E.; Zhang, C. Dieary intakes and circulating concentrations of branched-chain amino acids in relation to incident type 2 diabetes risk among high-risk women with a history of gestational diabetes mellitus. Clin. Chem. 2018, 64, 1203–1210. [Google Scholar] [CrossRef] [PubMed]
- Lin, Y.; Wu, J.; Zhu, Y.; Hinkle, S.N.; Rawal, S.; Liang, L.; Weir, N.L.; Tsai, M.Y.; Zhang, C. A longitudinal study of plasma acylcarnitines throughout pregnancy and associations with risk of gestational diabetes mellitus. Clin. Nutr. 2021, 40, 4863–4870. [Google Scholar] [CrossRef] [PubMed]
- Liu, Q.; Yin, A.; Wen, S.; Shi, X.; Fang, L.; Rao, T.; Liang, J.; Wu, J. Analysis of amino acids and acylcarnitines profiles in small, appropriate, and large for gestational age neonates. J. Matern. Fetal Neonatal Med. 2020, 9, 1–8. [Google Scholar] [CrossRef] [PubMed]
- Lindsay, K.L.; Hellmuth, C.; Uhl, O.; Buss, C.; Wadhwa, P.D.; Koletzko, B.; Entringer, S. Longitudinal metabolomic profiling of amino acids and lipids across healthy pregnancy. PLoS ONE 2015, 10, e0145794. [Google Scholar] [CrossRef]
- Ryckman, K.K.; Donovan, B.M.; Fleener, D.K.; Bedell, B.; Borowski, K.S. Pregnancy-related changes of amino acid and acylcarnitine concentrations: The impact of obesity. AJP Rep. 2016, 6, e329–e336. [Google Scholar]
- Walejko, J.M.; Chelliah, A.; Keller-Wood, M.; Wasserfall, C.; Atkinson, M.; Gregg, A.; Edison, A.S. Diabetes leads to alterations in normal metabolic transitions of pregnancy as revealed by time-course metabolomics. Metabolites 2020, 10, 350. [Google Scholar] [CrossRef]
- Orczyk-Pawilowicz, M.; Jawien, E.; Deja, S.; Hirnle, L.; Zabek, A.; Mlynarz, P. Metabolomics of human amniotic fluid and maternal plasma during normal pregnancy. PLoS ONE 2015, 11, e0152740. [Google Scholar] [CrossRef] [PubMed] [Green Version]
- Luan, H.; Meng, N.; Liu, P.; Feng, Q.; Lin, S.; Fu, J.; Davidson, R.; Chen, X.; Rao, W.; Chen, F.; et al. Pregnancy-induced metabolic phenotype variations in maternal plasma. J. Proteome Res. 2014, 13, 1527–1536. [Google Scholar] [CrossRef]
- Pinto, J.; Barros, A.N.S.; Domingues, M.R.M.; Goodfellow, B.J.; Galhano, E.; Pita, C.; Almeida, M.D.C.; Carreira, I.M.; Gil, A.M. Following healthy pregnancy by NMR metabolomics of plasma and correlation to urine. J. Proteome Res. 2014, 14, 1263–1274. [Google Scholar] [CrossRef]
- Di Giulio, A.M.; Carelli, S.; Castoldi, R.E.; Gorio, A.; Taricco, E.; Cetin, I. Plasma amino acid concentrations throughout normal pregnancy and early stages of intrauterine growth restricted pregnancy. J. Matern. Fetal Neonatal Med. 2004, 15, 356–362. [Google Scholar] [CrossRef]
- Hellmuth, C.; Lindsay, K.L.; Uhl, O.; Buss, C.; Wadhwa, P.D.; Koletzko, B.; Entringer, S. Association of maternal prepregnancy BMI with metabolomic profile across gestation. Int. J. Obes. 2016, 2017, 159–169. [Google Scholar] [CrossRef] [PubMed] [Green Version]
- Shokry, E.; Marchioro, L.; Uhl, O.; Bermudez, M.G.; Garcia-Santos, J.A.; Segura, M.T.; Campoy, C.; Koletzko, B. Impact of maternal BMI and gestational diabetes mellitus on maternal and cord blood metabolome: Results from the PREOBE cohort study. Acta Diabetol. 2019, 56, 421–430. [Google Scholar] [CrossRef]
- Sandler, V.; Reisetter, A.C.; Bain, J.R.; Muehlbauer, M.J.; Nodzenski, M.; Stevens, R.D.; Ilkayeva, O.; Lowe, L.P.; Metzger, B.E.; Newgard, C.B.; et al. Associations of maternal BMI and insulin resistance with the maternal metabolome and newborn outcomes. Diabetologia 2016, 60, 518–530. [Google Scholar] [CrossRef]
- Vidakovic, A.J.; Jaddoe, V.W.; Gishti, O.; Felix, J.F.; Williams, M.A.; Hofman, A.; Demmelmair, H.; Koletzko, B.; Tiemeier, H.; Gaillard, R. Body mass index, gestational weight gain and fatty acid concentrations during pregnancy: The Generation R Study. Eur. J. Epidemiol. 2015, 30, 1175–1185. [Google Scholar] [CrossRef] [Green Version]
- Tomedi, L.E.; Chang, C.-C.H.; Newby, P.K.; Evans, R.W.; Luther, J.F.; Wisner, K.L.; Bodnar, L.M. Pre-pregnancy obesity and maternal nutritional biomarker status during pregnancy: A factor analysis. Public Health Nutr. 2013, 16, 1414–1418. [Google Scholar] [CrossRef] [Green Version]
- Gong, S.; Sovio, U.; Aye, I.L.M.H.; Gaccioli, F.; Dopierala, J.; Johnson, M.D.; Wood, A.M.; Cook, E.; Jenkins, B.J.; Koulman, A.; et al. Placental polyamine metabolism differs by fetal sex, fetal growth restriction, and preeclampsia. JCI Insight 2018, 3, e120723. [Google Scholar] [CrossRef] [PubMed] [Green Version]
- O’Neill, K.; Alexander, J.; Azuma, R.; Xiao, R.; Snyder, N.W.; Mesaros, C.A.; Blair, I.A.; Pinney, S.E. Gestational diabetes alters the metabolomic profile in 2nd trimester amniotic fluid in a sex-specific manner. Int. J. Mol. Sci. 2018, 19, 2696. [Google Scholar] [CrossRef] [PubMed] [Green Version]
- Grewal, J.; Grantz, K.L.; Zhang, C.; Sciscione, A.; Wing, D.A.; Grobman, W.A.; Newman, R.B.; Wapner, R.; D’Alton, M.E.; Skupski, D.; et al. Cohort profile: NICHD Fetal Growth Studies— Singletons and Twins. Int. J. Epidemiol. 2018, 47, 25–25l. [Google Scholar] [CrossRef] [PubMed] [Green Version]
- Townsend, M.K.; Bao, Y.; Poole, E.M.; Bertrand, K.A.; Kraft, P.; Wolpin, B.M.; Clish, C.B.; Tworoger, S.S. Impact of pre-analytic blood sample collection factors on metabolomics. Cancer Epidemiol. Prev. Biomark. 2017, 25, 823–829. [Google Scholar] [CrossRef] [PubMed] [Green Version]
- Smith, E.H.; Matern, D. Acylcarnitine analysis by tandem mass spectrometry. Curr. Protoc. Hum. Genet. 2010, 64, 17.8.1–17.8.20. [Google Scholar] [CrossRef] [PubMed]
- Cao, J.; Schwichtenberg, K.A.; Hanson, N.Q.; Tsai, M.Y. Incorporation and clearance of omega-3 fatty acids in erythrocyte membranes and plasma phospholipids. Clin. Chem. 2006, 52, 2265–2272. [Google Scholar] [CrossRef] [Green Version]
- Wei, R.; Wang, J.; Su, M.; Jia, E.; Chen, S.; Chen, T.; Ni, Y. Missing value imputation approach for mass spectrometry-based metabolomics data. Sci. Rep. 2018, 8, 663. [Google Scholar] [CrossRef] [Green Version]
- Hinkle, S.N.; Rawal, S.; Liu, D.; Chen, J.; Tsai, M.Y.; Zhang, C. Maternal adipokines longitudinally measured across pregnancy and their associations with neonatal size, length, and adiposity. Int. J. Obes. 2019, 43, 1422–1434. [Google Scholar] [CrossRef]
- Benjamini, Y.; Hochberg, Y. Controlling the false discovery rate: A practical and powerful approach to multiple testing. J. R. Stat. Soc. Ser. B Methodol. 1995, 57, 289–300. [Google Scholar] [CrossRef]
- Romero, R.; Erez, O.; Maymon, E.; Chaemsaithong, P.; Xu, Z.; Pacora, P.; Chaiworapongsa, T.; Done, B.; Hassan, S.S.; Tarca, A.L. The maternal plasma proteome changes as a function of gestational age in normal pregnancy: A longitudinal study. Am. J. Obstet. Gynecol. 2017, 217, 67.e1–67.e21. [Google Scholar] [CrossRef]
- Genolini, C.; Falissard, B. KmL: A package to cluster longitudinal data. Comput. Methods Programs Biomed. 2011, 104, e112–e121. [Google Scholar] [CrossRef]
- Nakano, C.; Takashima, S.; Takeshita, K. Carnitine concentrations during the development of human tissues. Early Hum. Dev. 1989, 19, 21–27. [Google Scholar] [CrossRef]
- Manta-Vogli, P.D.; Schulpis, K.H.; Dotsikas, Y.; Loukas, Y.L. The significant role of carnitine and fatty acids during pregnancy, lactation, and the perinatal period. Nutritional support in specific groups of pregnant women. Clin. Nutr. 2020, 39, 2337–2346. [Google Scholar] [CrossRef]
- Arenas, J.; Rubio, J.C.; Martín, M.A.; Campos, Y. Biological roles of L-carnitine in perinatal metabolism. Early Hum. Dev. 1998, 53, S43–S50. [Google Scholar] [CrossRef]
- Cho, S.-W.; Cha, Y.-S. Pregnnacy increases urinary loss of carnitine and reduces plasma carnitine in Korean women. Br. J. Nutr. 2005, 93, 685–691. [Google Scholar] [CrossRef] [Green Version]
- Haggarty, P. Placental regulation of fatty acid delivery and its effect on fetal growth—A review. Placenta 2002, 23, S28–S38. [Google Scholar] [CrossRef]
- Martinez, M. Tissue levels of polyunsaturated fatty acids during early human development. J. Pediatrics 1992, 120, S129–S138. [Google Scholar] [CrossRef]
- Crocker, I.; Lawson, N.; Daniels, I.; Baker, P.; Fletcher, J. Significance of fatty acids in pregnancy-induced immunosuppression. Clin. Diagn. Lab. Immunol. 1999, 6, 587–593. [Google Scholar] [CrossRef] [PubMed] [Green Version]
- Jones, H.N.; Powell, T.L.; Jansson, T. Regulation of placental nutrient transport—A review. Placenta 2007, 28, 763–774. [Google Scholar] [CrossRef]
- Cleal, J.K.; Lewis, R.M. The mechanisms and regulation of placental amino acid transport to the human foetus. J. Neuroendocrinol. 2008, 20, 419–426. [Google Scholar] [CrossRef]
- Cetin, I.; Ronzoni, S.; Marconi, A.M.; Perugino, G.; Corbetta, C.; Battaglia, F.C.; Pardi, G. Maternal concentrations and fetal-maternal concentration differences of plasma amino acids in normal and interuterine growth-restricted pregnancies. Am. J. Obstet. Gynecol. 1996, 174, 1575–1583. [Google Scholar] [CrossRef]
- Jansson, T.; Ekstrand, Y.; Björn, C.; Wennergren, M.; Powell, T.L. Altertions in the activity of placental amino acid transporters in pregnancies complicated by diabetes. Pathophysiology 2002, 51, 2214–2219. [Google Scholar]
- Cetin, I.; Nobile de Santis, M.S.; Taricco, E.; Radaelli, T.; Teng, C.; Ronzoni, S.; Spada, E.; Milani, S.; Pardi, G. Maternal and fetal amino acid concentrations in normal pregnancies and in pregnancies with gestational diabetes mellitus. Am. J. Obstet. Gynecol. 2005, 192, 610–617. [Google Scholar] [CrossRef] [PubMed]


| Characteristics | n1 (%) |
|---|---|
| Maternal age (years) | |
| 18–24 | 65 (30.5) |
| 25–29 | 64 (29.9) |
| 30–34 | 55 (25.6) |
| 35–40 | 30 (14.0) |
| Race/ethnicity | |
| Non-Hispanic White | 67 (31.3) |
| Non-Hispanic Black | 51 (23.7) |
| Hispanic | 57 (26.8) |
| Asian/Pacific Islander | 39 (18.3) |
| Pre-pregnancy BMI (kg/m2) | |
| <25 | 112 (52.4) |
| 25–29.9 | 71 (33.0) |
| 30 | 31 (14.6) |
| Married or living with partner | 155 (72.3) |
| Maternal education | |
| Some high school | 22 (10.4) |
| High school diploma | 31 (14.5) |
| Some college | 75 (34.8) |
| Bachelor’s degree | 51 (23.9) |
| Graduate degree | 35 (16.5) |
| Annual household income | |
| <$30,000 | 52 (24.3) |
| $30,000–$49,999 | 37 (17.1) |
| $50,000–$99,999 | 43 (20.0) |
| $100,000 | 50 (23.4) |
| Missing | 32 (15.1) |
| Infant Sex | |
| Male | 110 (51.3) |
| Female | 103 (48.2) |
| Missing | 1 (0.5) |
| Class | Positive Trajectory | Negative Trajectory | No Significant Change |
|---|---|---|---|
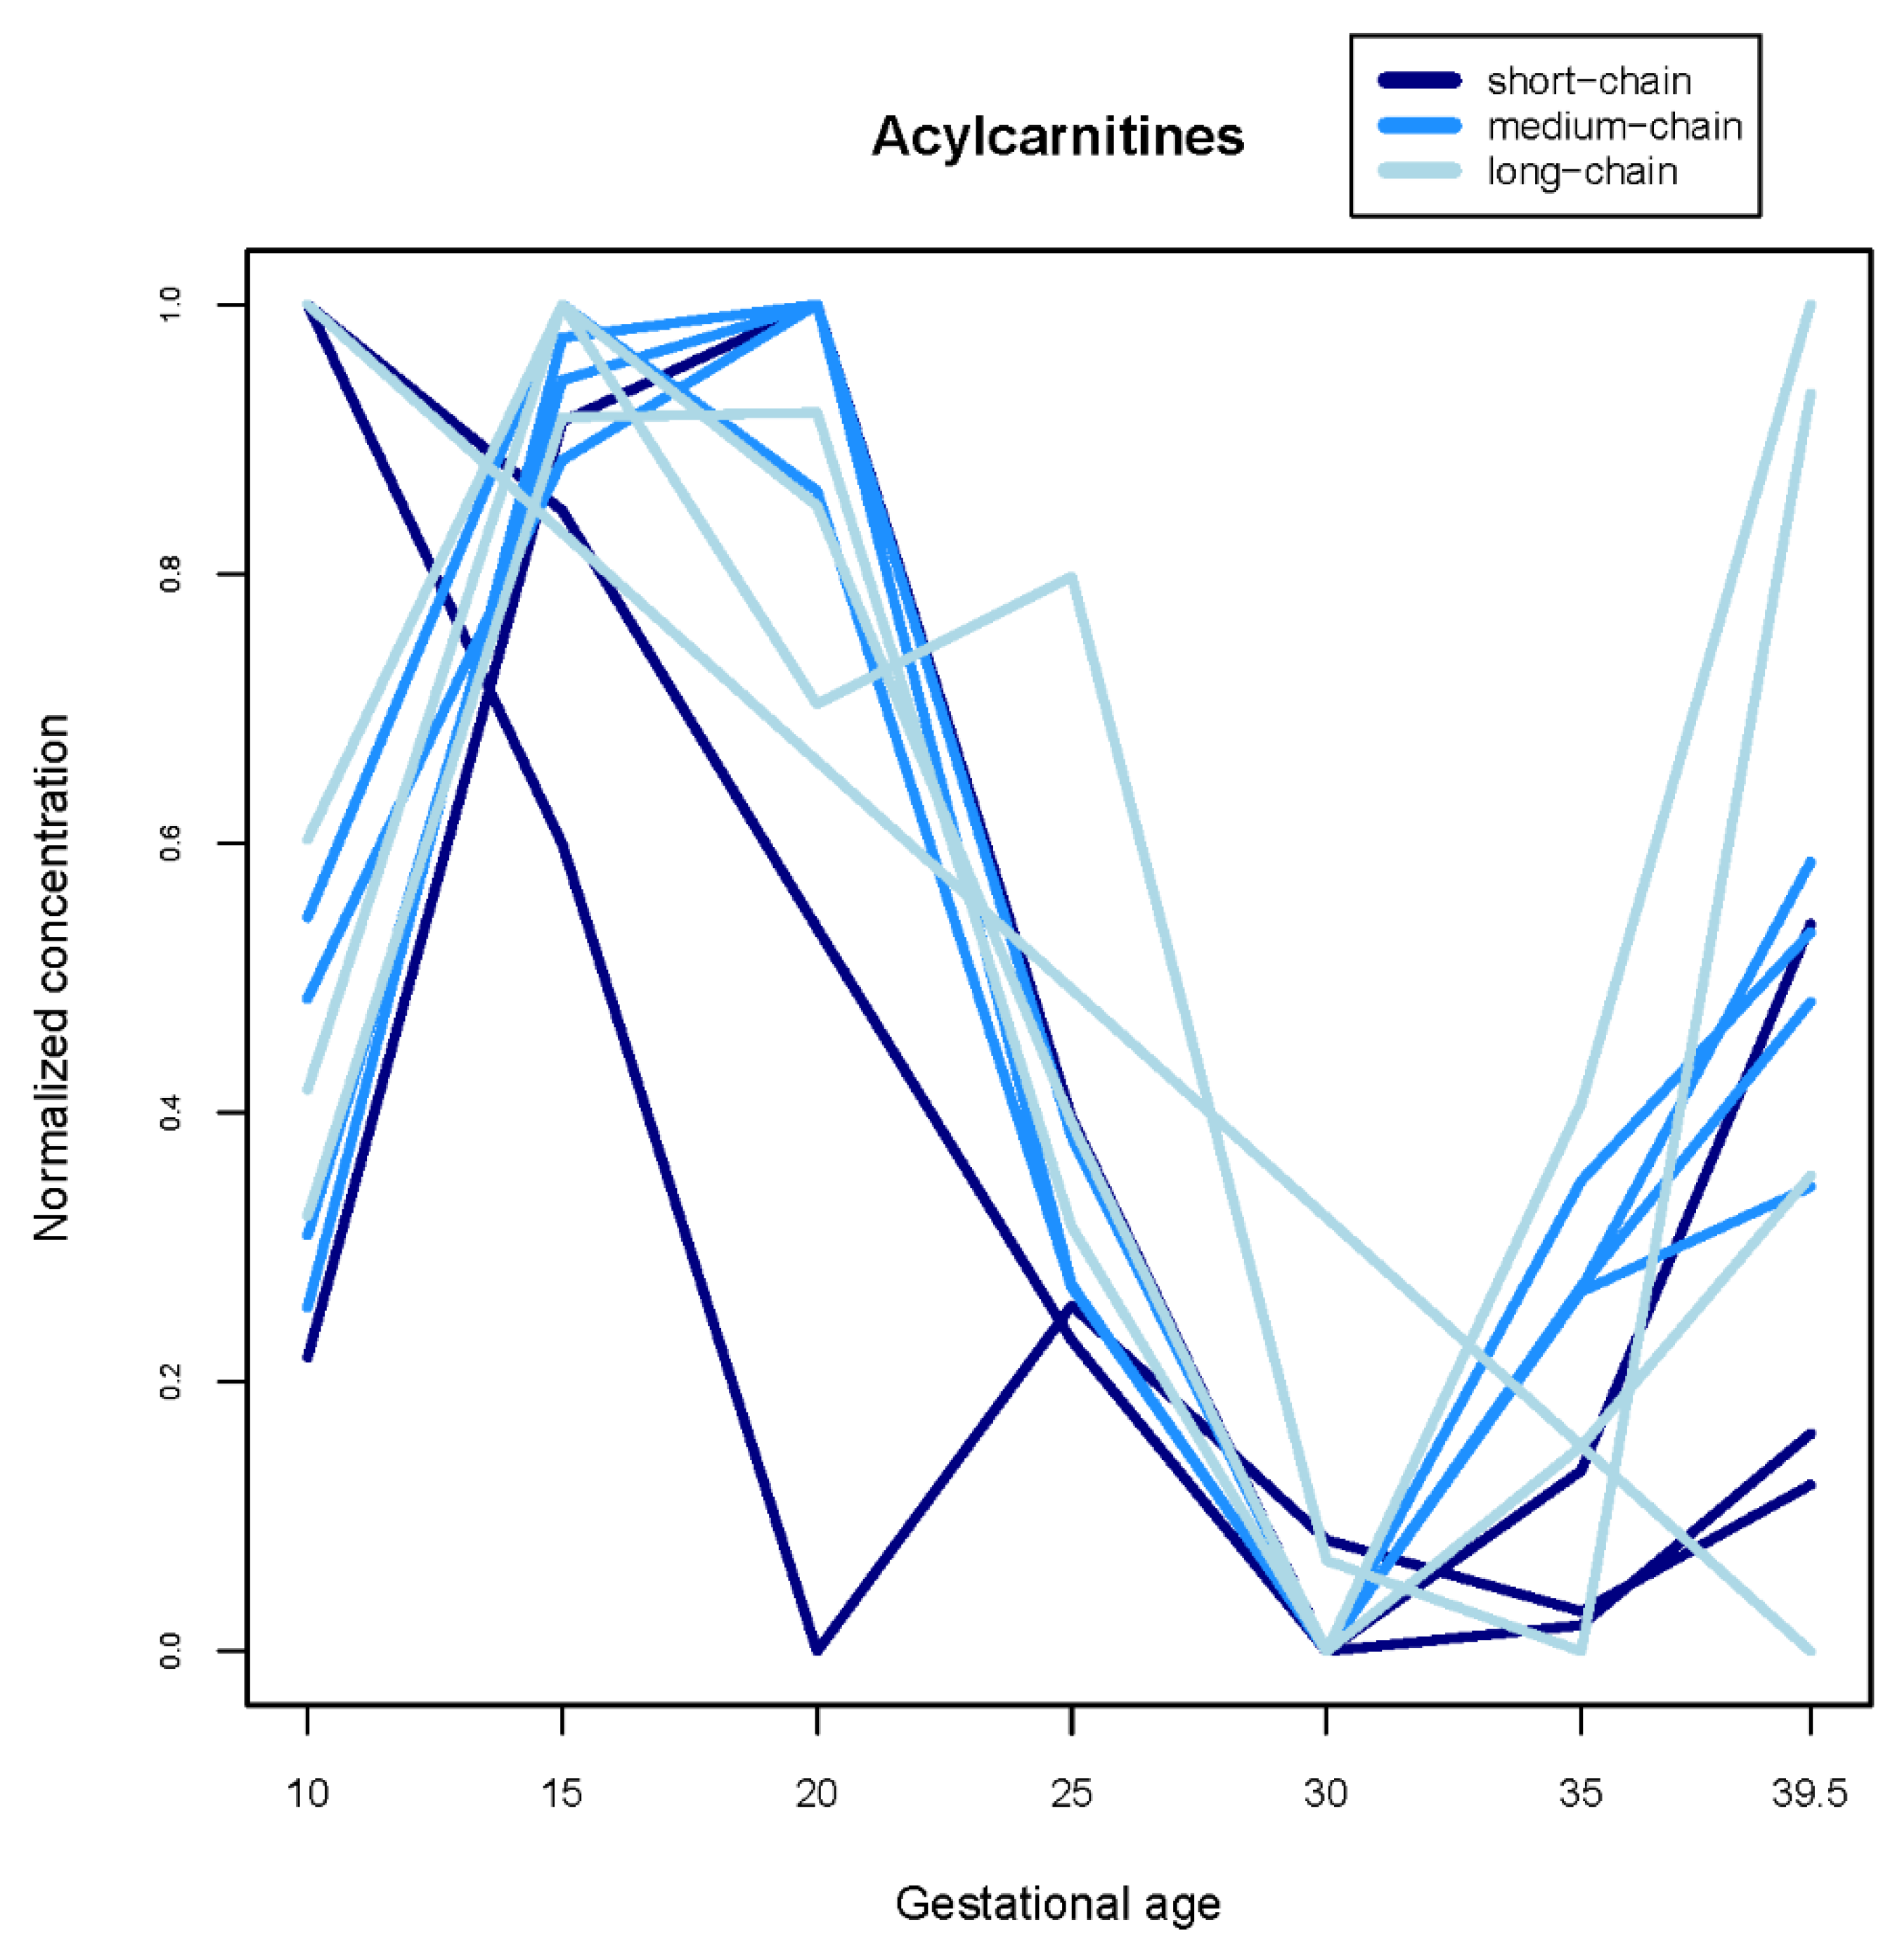
| Acylcarnitines | -- | Acetylcarnitine, Propionylcarnitine, Decenoylcarnitine, Decanoylcarnitine, Glutarylcarnitine, Dodecenoylcarnitine, Dodecanoylcarnitine, Tetradecenoylcarnitine, Hexadecenoylcarnitine, Hexadecanoylcarnitine, Linoleylcarnitine, Oleylcarnitine, Stearoylcarnitine | Octenoylcarnitine, Tetradecanoylcarnitine |
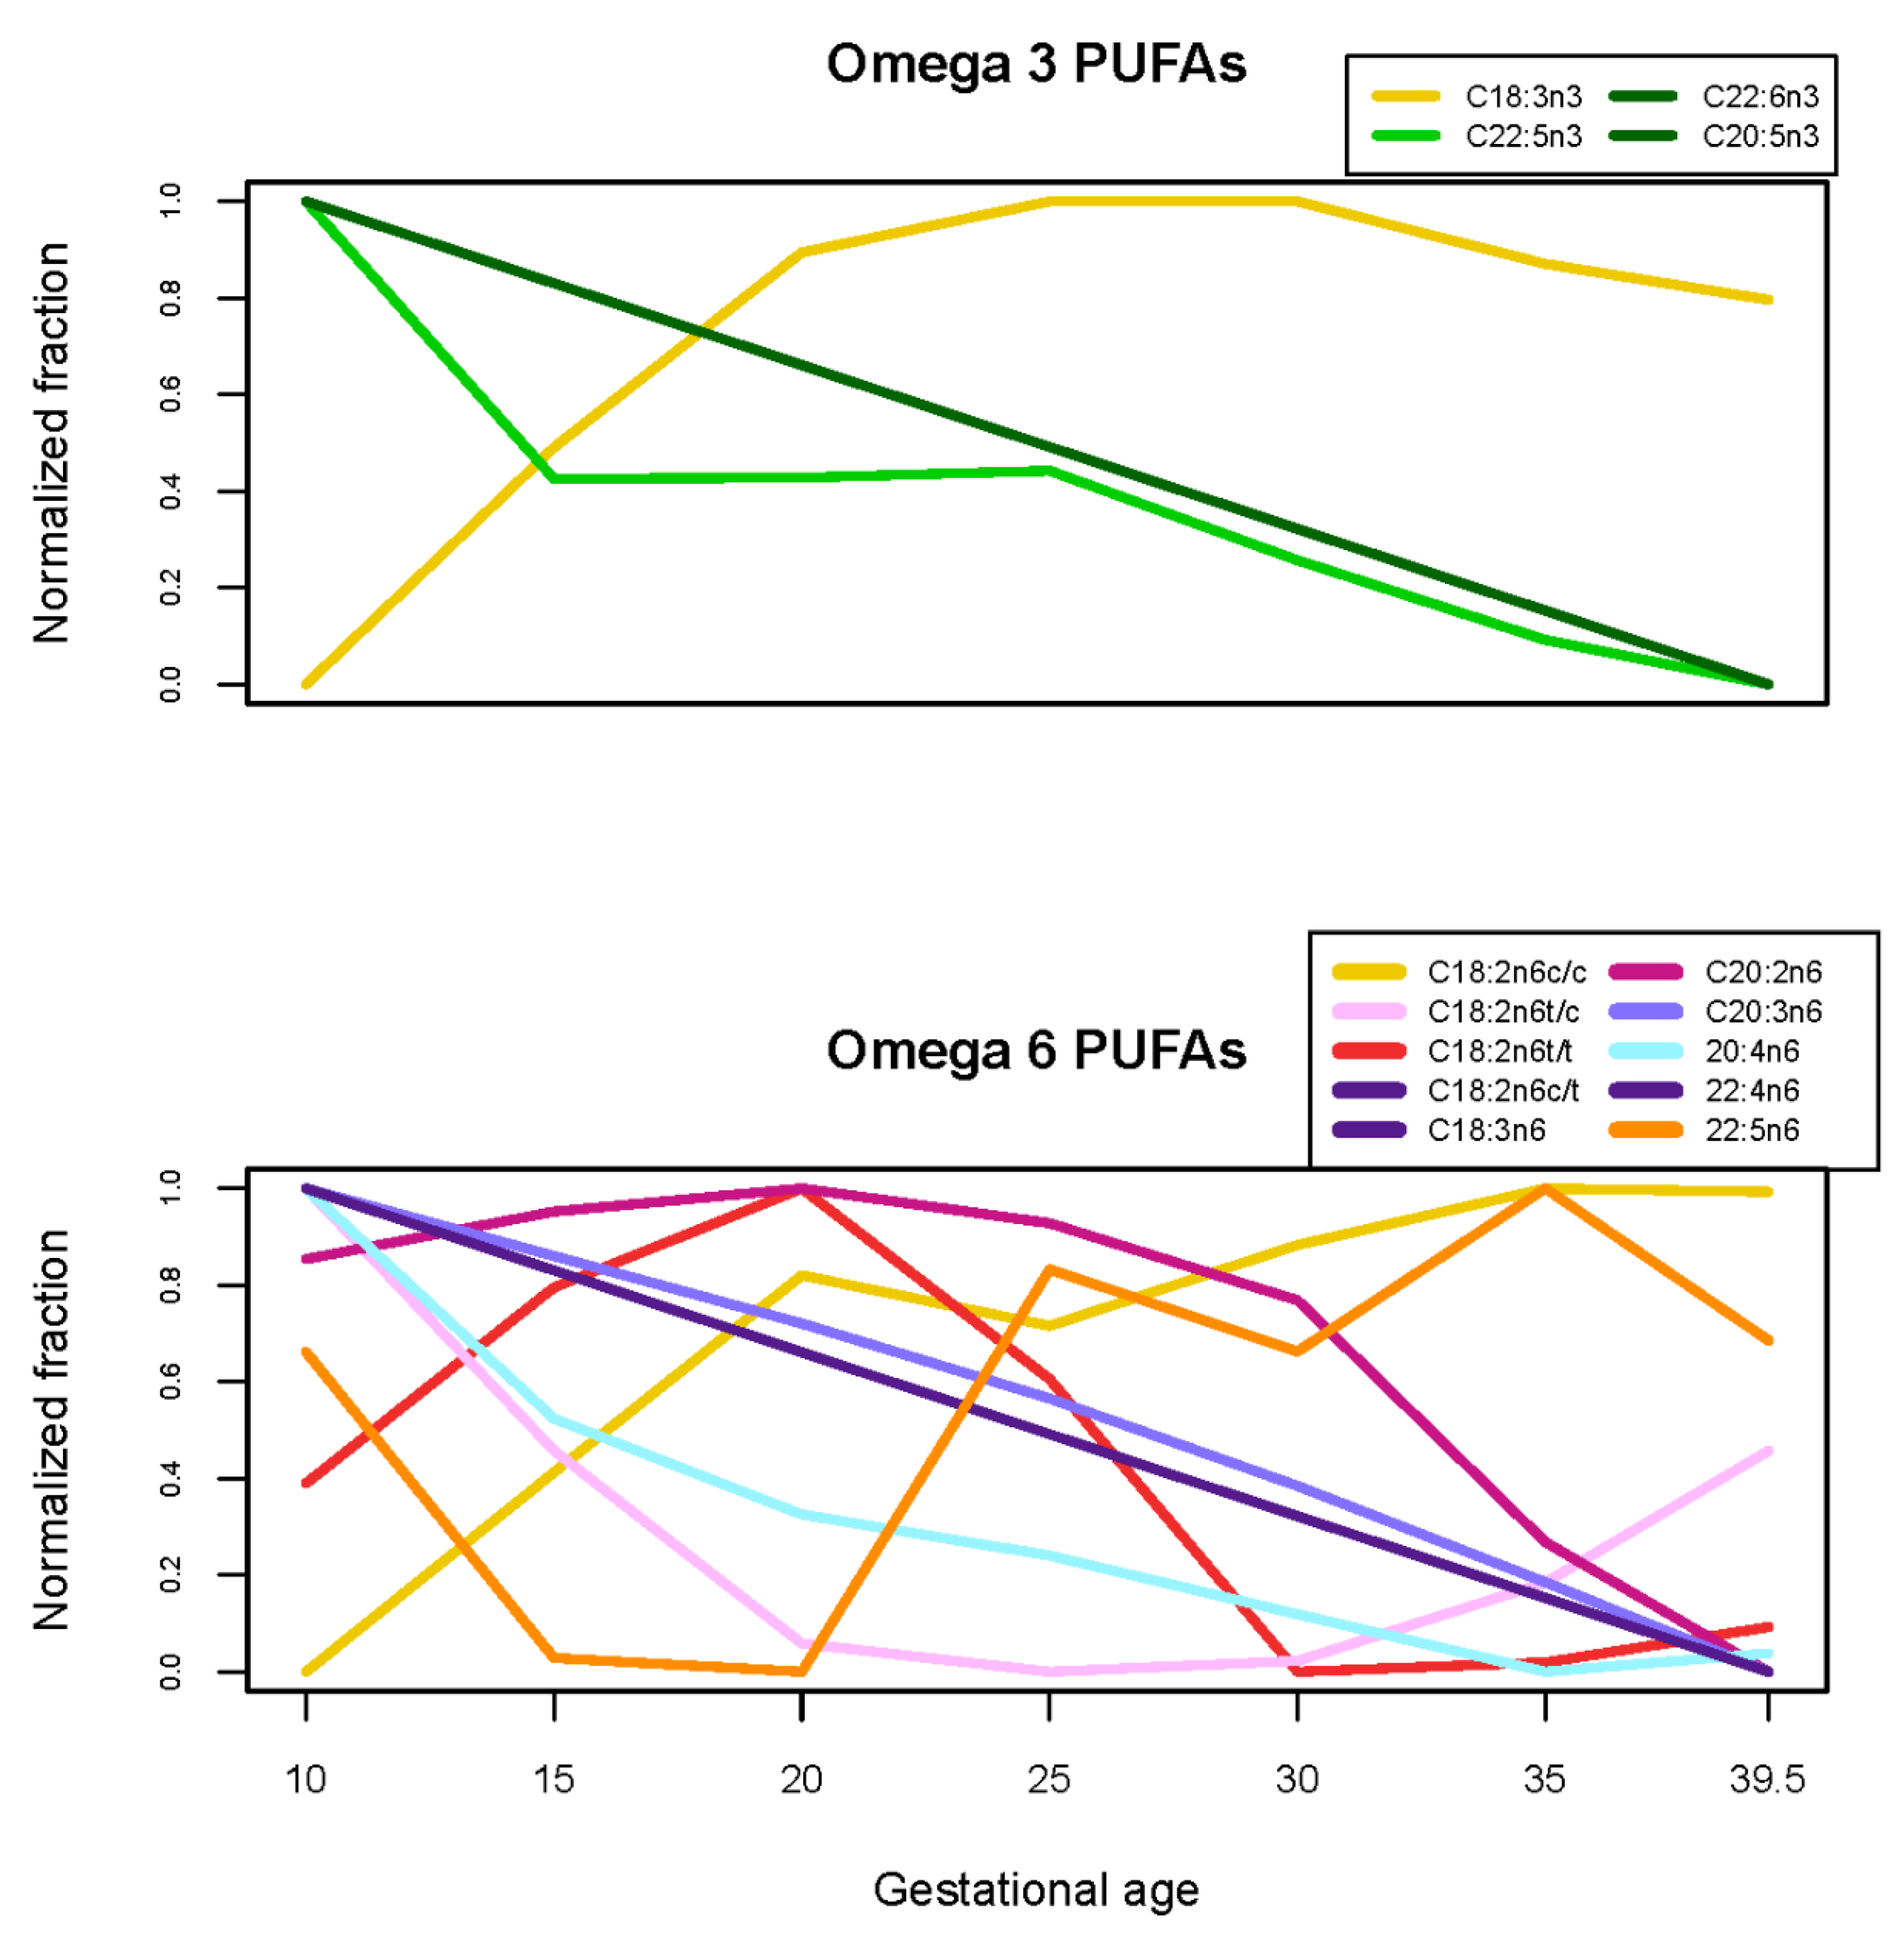
| Fatty acids | C16:0, C16:1n7c, C18:1n9c, C18:2n6c/c, C18:3n3, C22:0, C22:5n6, C24:1n9, C18:1 cis fatty acids), cis fatty acids) | C15:0, C17:0, C18:0, C18:1n6-9t, C18:1n6c, C18:1n7c, C18:2n6c/t, C18:2n6t/t, C20:1n9, C20:2n6, C20:4n6, C22:5n3, C22:6n3, C24:0, (trans fatty acids), EPA, DHA), AA/DHA, AA/EPA, DHA) | C14:0, C18:2n6t/c, C18:3n6, C20:0, C20:3n6, C20:5n3, C22:4n6, AA/EPA, C18:2 trans fatty acids) |
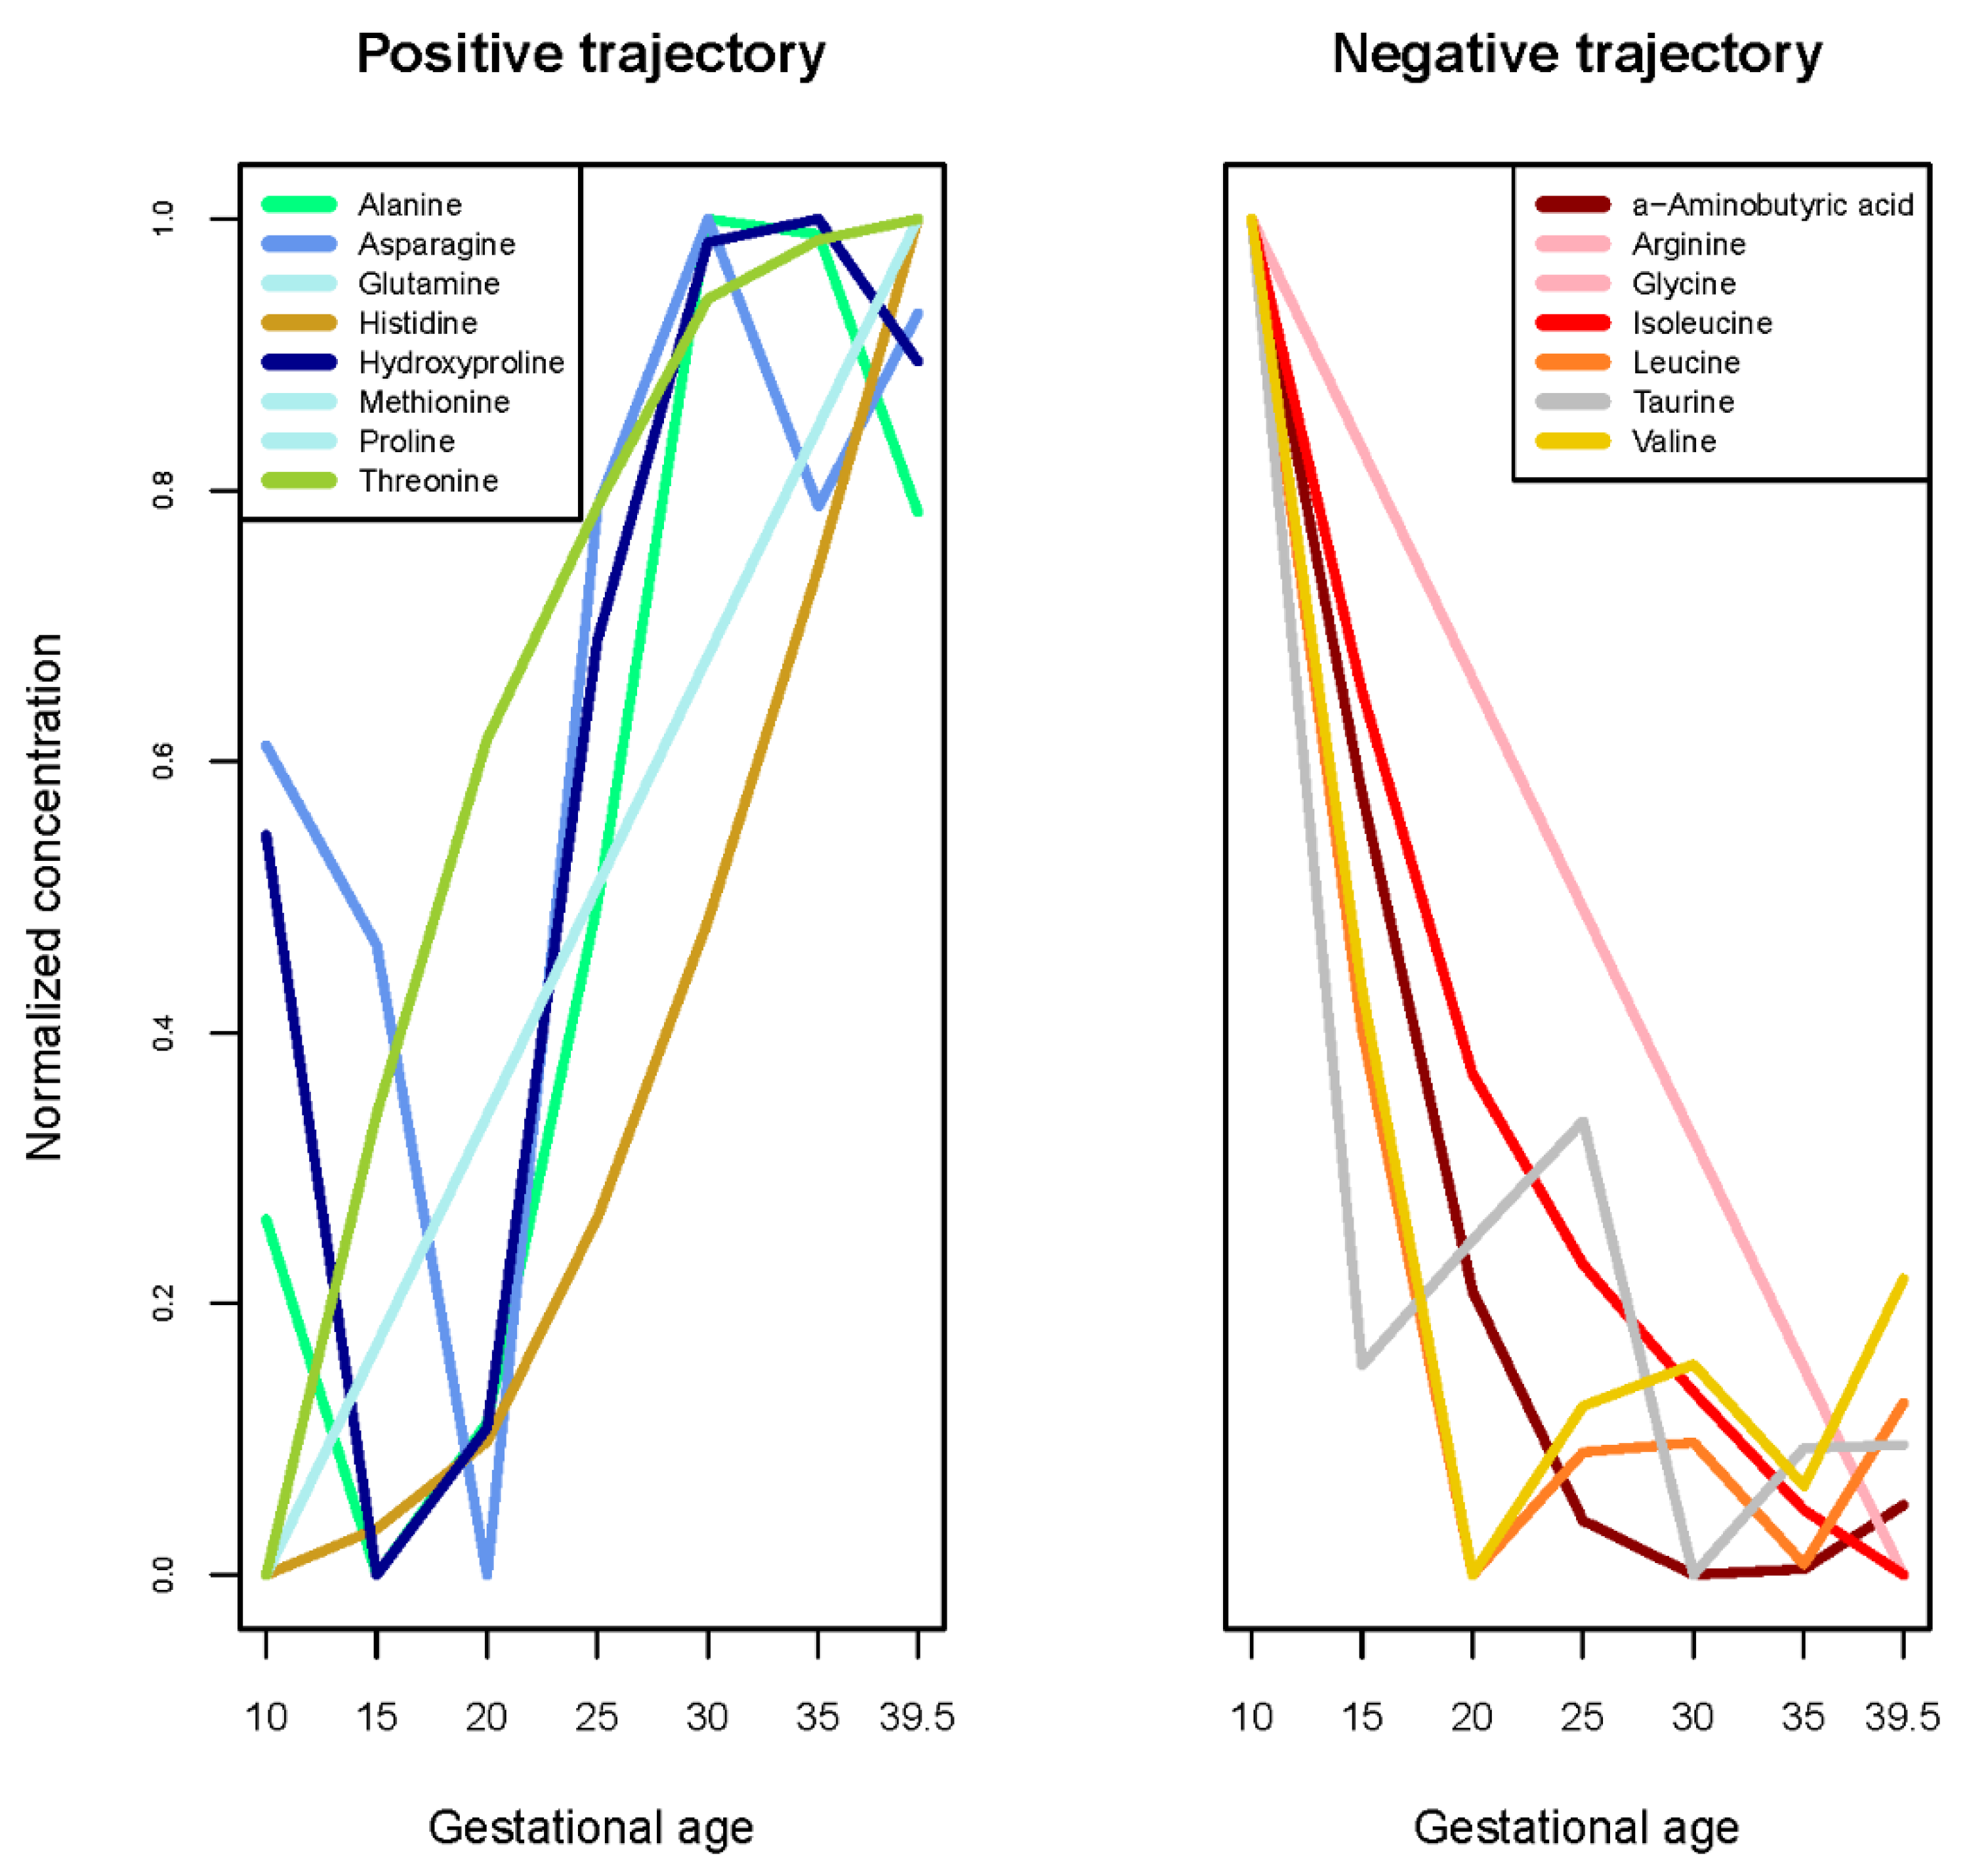
| Amino acids | Alanine, Asparagine, Glutamine, Histidine, Hydroxyproline, Methionine, Proline, Threonine | -aminobutyric acid, Arginine, Glycine, Isoleucine, Leucine, Taurine, Valine | Aspartic acid, Citrulline, Cystine, Glutamic acid, Glutamic acid, Glutamine), Lysine, Ornithine, Phenylalanine, Serine, Tyrosine |
Publisher’s Note: MDPI stays neutral with regard to jurisdictional claims in published maps and institutional affiliations. |
© 2021 by the authors. Licensee MDPI, Basel, Switzerland. This article is an open access article distributed under the terms and conditions of the Creative Commons Attribution (CC BY) license (https://creativecommons.org/licenses/by/4.0/).
Share and Cite
Mitro, S.D.; Wu, J.; Rahman, M.L.; Cao, Y.; Zhu, Y.; Chen, Z.; Chen, L.; Li, M.; Hinkle, S.N.; Bremer, A.A.; et al. Longitudinal Plasma Metabolomics Profile in Pregnancy—A Study in an Ethnically Diverse U.S. Pregnancy Cohort. Nutrients 2021, 13, 3080. https://0-doi-org.brum.beds.ac.uk/10.3390/nu13093080
Mitro SD, Wu J, Rahman ML, Cao Y, Zhu Y, Chen Z, Chen L, Li M, Hinkle SN, Bremer AA, et al. Longitudinal Plasma Metabolomics Profile in Pregnancy—A Study in an Ethnically Diverse U.S. Pregnancy Cohort. Nutrients. 2021; 13(9):3080. https://0-doi-org.brum.beds.ac.uk/10.3390/nu13093080
Chicago/Turabian StyleMitro, Susanna D., Jing Wu, Mohammad L. Rahman, Yaqi Cao, Yeyi Zhu, Zhen Chen, Liwei Chen, Mengying Li, Stefanie N. Hinkle, Andrew A. Bremer, and et al. 2021. "Longitudinal Plasma Metabolomics Profile in Pregnancy—A Study in an Ethnically Diverse U.S. Pregnancy Cohort" Nutrients 13, no. 9: 3080. https://0-doi-org.brum.beds.ac.uk/10.3390/nu13093080