
Clinical Use of the Edmonton Obesity Staging System for the Assessment of Weight Management Outcomes in People with Class 3 Obesity


 , , ,
, , ,
Abstract
:1. Introduction
2. Methods
2.1. Study Design
2.2. Data Collection
2.3. Data Analysis
2.4. Ethics
3. Results
3.1. Baseline Characteristics
3.2. Weight Loss and Impact on Metabolic Outcomes in EOSS-2 and 3
3.3. Comparing Weight Loss and Metabolic Outcomes in EOSS-2 vs. EOSS-3
4. Discussion
5. Conclusions
Author Contributions
Funding
Institutional Review Board Statement
Informed Consent Statement
Data Availability Statement
Acknowledgments
Conflicts of Interest
References
- Bhaskaran, K.; dos-Santos-Silva, I.; Leon, D.A.; Douglas, I.J.; Smeeth, L. Association of BMI with overall and cause-specific mortality: A population-based cohort study of 3.6 million adults in the UK. Lancet Diabetes Endocrinol. 2018, 6, 944–953. [Google Scholar] [CrossRef] [Green Version]
- Di Angelantonio, E.; Bhupathiraju, S.N.; Wormser, D.; Gao, P.; Kaptoge, S.; de Gonzalez, A.B.; Cairns, B.J.; Huxley, R.; Jackson, C.L.; Joshy, G. Body-mass index and all-cause mortality: Individual-participant-data meta-analysis of 239 prospective studies in four continents. Lancet 2016, 388, 776–786. [Google Scholar] [CrossRef] [Green Version]
- Katzmarzyk, P.T.; Mason, C. Prevalence of class I, II and III obesity in Canada. CMAJ 2006, 174, 156–157. [Google Scholar] [CrossRef] [PubMed] [Green Version]
- American Diabetes Association. Classification and Diagnosis of Diabetes: Standards of Medical Care in Diabetes—2019. Diabetes Care 2019, 42, S13–S28. [Google Scholar] [CrossRef] [Green Version]
- Ejima, K.; Xavier, N.A.; Mehta, T. Comparing the Ability of Two Comprehensive Clinical Staging Systems to Predict Mortality: EOSS and CMDS. Obesity 2020, 28, 353–361. [Google Scholar] [CrossRef]
- Atlantis, E.; Fahey, P.; Williams, K.; Edwards, S.; Samaras, K.; Dugdale, P.; Shi, Z.; Sharma, A.M. Comparing the predictive ability of the Edmonton Obesity Staging System with the body mass index for use of health services and pharmacotherapies in Australian adults: A nationally representative cross-sectional study. Clin. Obes. 2020, 10, e12368. [Google Scholar] [CrossRef]
- Janssen, I.; Katzmarzyk, P.T.; Ross, R. Waist circumference and not body mass index explains obesity-related health risk. Am. J. Clin. Nutr. 2004, 79, 379–384. [Google Scholar] [CrossRef] [Green Version]
- Janssen, I.; Katzmarzyk, P.T.; Ross, R. Body mass index, waist circumference, and health risk: Evidence in support of current National Institutes of Health guidelines. Arch. Intern. Med. 2002, 162, 2074–2079. [Google Scholar] [CrossRef] [Green Version]
- Padwal, R.S.; Pajewski, N.M.; Allison, D.B.; Sharma, A.M. Using the Edmonton obesity staging system to predict mortality in a population-representative cohort of people with overweight and obesity. CMAJ 2011, 183, E1059–E1066. [Google Scholar] [CrossRef] [Green Version]
- Whyte, M.; Velusamy, S.; Aylwin, S. Disease severity and staging of obesity: A rational approach to patient selection. Curr. Atheroscler. Rep. 2014, 16, 456. [Google Scholar] [CrossRef]
- Sharma, A.M.; Kushner, R.F. A proposed clinical staging system for obesity. Int. J. Obes. 2009, 33, 289. [Google Scholar] [CrossRef] [PubMed] [Green Version]
- Canning, K.L.; Brown, R.E.; Wharton, S.; Sharma, A.M.; Kuk, J.L. Edmonton obesity staging system prevalence and association with weight loss in a publicly funded referral-based obesity clinic. J. Obes. 2015, 2015, 619734. [Google Scholar] [CrossRef] [PubMed] [Green Version]
- Atlantis, E.; Sahebolamri, M.; Cheema, B.S.; Williams, K. Usefulness of the Edmonton Obesity Staging System for stratifying the presence and severity of weight-related health problems in clinical and community settings: A rapid review of observational studies. Obes. Rev. 2020, 21, e13120. [Google Scholar] [CrossRef] [PubMed]
- Ollendorf, D.A.; Shore, K.K.; Cameron, C.; Weissberg, J.; Loos, A.M.; Synnott, P.; Pearson, S.D. Controversies in Obesity Management: A Technology Assessment; Institute for Clinical and Economic Review: Boston, MA, USA, 2015. [Google Scholar]
- Atlantis, E.; Kormas, N.; Samaras, K.; Fahey, P.; Sumithran, P.; Glastras, S.; Wittert, G.; Fusco, K.; Bishay, R.; Markovic, T. Clinical obesity services in public hospitals in Australia: A position statement based on expert consensus. Clin. Obes. 2018, 8, 203–210. [Google Scholar] [CrossRef]
- Borisenko, O.; Colpan, Z.; Dillemans, B.; Funch-Jensen, P.; Hedenbro, J.; Ahmed, A.R. Clinical indications, utilization, and funding of bariatric surgery in Europe. Obes. Surg. 2015, 25, 1408–1416. [Google Scholar] [CrossRef] [Green Version]
- Sharman, M.J.; Breslin, M.C.; Kuzminov, A.; Palmer, A.J.; Blizzard, L.; Hensher, M.; Venn, A.J. Population estimates and characteristics of Australians potentially eligible for bariatric surgery: Findings from the 2011–13 Australian Health Survey. Aust. Health Rev. 2018, 42, 429–437. [Google Scholar] [CrossRef]
- Bariatric Surgery Registry. Bariatric Surgery Registry 2018/19 Report; Monash University: Melbourne, Australia, 2019. [Google Scholar]
- Mechanick, J.I.; Youdim, A.; Jones, D.B.; Garvey, W.T.; Hurley, D.L.; McMahon, M.M.; Heinberg, L.J.; Kushner, R.; Adams, T.D.; Shikora, S.; et al. Clinical practice guidelines for the perioperative nutritional, metabolic, and nonsurgical support of the bariatric surgery patient-2013 update: Cosponsored by american association of clinical endocrinologists, The obesity society, and american society fo. Obesity 2013, 21, S1–S27. [Google Scholar] [CrossRef]
- Garvey, W.T.; Mechanick, J.I.; Brett, E.M.; Garber, A.J.; Hurley, D.L.; Jastreboff, A.M.; Nadolsky, K.; Pessah-Pollack, R.; Plodkowski, R. American Association of Clinical Endocrinologists and American College of Endocrinology Comprehensive Clinical Practice Guidelines Formedical Care of Patients with Obesity. Endocr. Pract. 2016, 22, 1–203. [Google Scholar] [CrossRef] [Green Version]
- Ogassavara, N.C.; Magalhães Dias, J.G.; Pajecki, D.; de Oliveira Siqueira, J.; Santo, M.A.; Tess, B.H. The Edmonton Obesity Staging System: Assessing a potential tool to improve the management of obesity surgery in the Brazilian public health services. Surg. Obes. Relat. Dis. 2020, 16, 40–47. [Google Scholar] [CrossRef] [Green Version]
- Sjöström, L. Review of the key results from the Swedish Obese Subjects (SOS) trial—A prospective controlled intervention study of bariatric surgery. J. Intern. Med. 2013, 273, 219–234. [Google Scholar] [CrossRef]
- Segal-Lieberman, G.; Segal, P.; Dicker, D. Revisiting the Role of BMI in the Guidelines for Bariatric Surgery. Diabetes Care 2016, 39, S268–S273. [Google Scholar] [CrossRef] [PubMed] [Green Version]
- Kuk, J.L.; Ardern, C.I.; Church, T.S.; Sharma, A.M.; Padwal, R.; Sui, X.; Blair, S.N. Edmonton Obesity Staging System: Association with weight history and mortality risk. Appl. Physiol. Nutr. Metab. 2011, 36, 570–576. [Google Scholar] [CrossRef] [PubMed]
- Gill, R.S.; Karmali, S.; Sharma, A.M. The Potential Role of the Edmonton Obesity Staging System in Determining Indications for Bariatric Surgery. Obes. Surg. 2011, 21, 1947–1949. [Google Scholar] [CrossRef] [PubMed] [Green Version]
- Chiappetta, S.; Stier, C.; Weiner, R.A. The Edmonton Obesity Staging System Predicts Perioperative Complications and Procedure Choice in Obesity and Metabolic Surgery—a German Nationwide Register-Based Cohort Study (StuDoQ|MBE). Obes. Surg. 2019, 29, 3791–3799. [Google Scholar] [CrossRef] [PubMed]
- Skulsky, S.L.; Dang, J.T.; Battiston, A.; Switzer, N.J.; Birch, D.W.; Sharma, A.M.; Karmali, S. Higher Edmonton Obesity Staging System scores are associated with complications following laparoscopic Roux-en-Y gastric bypass. Surg. Endosc. 2020, 34, 3102–3109. [Google Scholar] [CrossRef]
- Atlantis, E.; Langford, K.; Piya, M.; Ho, V.; Skelsey, K.; Rickards, L.; Edwards, S.; Kormas, N. Physical capacity outcomes in patients with severe obesity after 12 months of physician-led multidisciplinary team care: A case series from a public hospital clinical obesity service. Clin. Obes. 2019, 9, e12337. [Google Scholar] [CrossRef]
- Piya, M.K.; Chimoriya, R.; Yu, W.; Grudzinskas, K.; Myint, K.P.; Skelsey, K.; Kormas, N.; Hay, P. Improvement in Eating Disorder Risk and Psychological Health in People with Class 3 Obesity: Effects of a Multidisciplinary Weight Management Program. Nutrients 2021, 13, 1425. [Google Scholar] [CrossRef]
- Kobuch, S.; Tsang, F.; Chimoriya, R.; Gossayn, D.; O’Brien, S.; Jamal, J.; Laks, L.; Tahrani, A.; Kormas, N.; Piya, M.K. Obstructive sleep apnoea and 12-month weight loss in adults with class 3 obesity attending a multidisciplinary weight management program. BMC Endocr. Disord. 2021, 21, 227. [Google Scholar] [CrossRef]
- Medveczky, D.M.; Kodsi, R.; Skelsey, K.; Grudzinskas, K.; Bueno, F.; Ho, V.; Kormas, N.; Piya, M.K. Class 3 Obesity in a Multidisciplinary Metabolic Weight Management Program: The Effect of Preexisting Type 2 Diabetes on 6-Month Weight Loss. J. Diabetes Res. 2020, 2020, 9327910. [Google Scholar] [CrossRef]
- Sarlio-Lähteenkorva, S.; Lahelma, E. The association of body mass index with social and economic disadvantage in women and men. Int. J. Epidemiol. 1999, 28, 445–449. [Google Scholar] [CrossRef]
- Heraclides, A.; Brunner, E. Social mobility and social accumulation across the life course in relation to adult overweight and obesity: The Whitehall II study. J. Epidemiol. Community Health 2010, 64, 714–719. [Google Scholar] [CrossRef] [PubMed]
- Gómez, J.C.; Lorido, J.A.; Huelgas, R.G.; Vidal, M.S.; Tembra, M.S.; Aguilar, J.V.; Voces, I.M.; Pérez, E.F.; Rodríguez, J.F.; Muñoz, J.E. Prevalence of obesity according to Edmonton staging in the Internal Medicine consultations. Results of the OBEMI study. Rev. Clin. Esp. 2017, 217, 71–78. [Google Scholar] [CrossRef] [PubMed]
- Cardenas, J.; Pelegrina, B.; Roldan, M.; Calvo, I.; Vázquez, C.; Pallardo, L. Obesity associated risk using Edmonton staging in bariatric surgery. Nutr. Hosp. 2014, 31, 196–202. [Google Scholar]
- Lean; E. J.M.; Leslie, W.S.; Barnes, A.C.; Brosnahan, N.; Thom, G.; McCombie, L.; Peters, C.; Zhyzhneuskaya, S.; Al-Mrabeh, A.; et al. Primary care-led weight management for remission of type 2 diabetes (DiRECT): An open-label, cluster-randomised trial. Lancet 2018, 391, 541–551. [Google Scholar] [CrossRef] [Green Version]
- Look AHEAD Research Group. Association of the magnitude of weight loss and changes in physical fitness with long-term cardiovascular disease outcomes in overweight or obese people with type 2 diabetes: A post-hoc analysis of the Look AHEAD randomised clinical trial. Lancet Diabetes Endocrinol. 2016, 4, 913–921. [Google Scholar] [CrossRef] [Green Version]
- Finkler, E.; Heymsfield, S.B.; St-Onge, M.-P. Rate of weight loss can be predicted by patient characteristics and intervention strategies. J. Acad. Nutr. Diet. 2012, 112, 75–80. [Google Scholar] [CrossRef] [Green Version]
- Svetkey, L.P.; Clark, J.M.; Funk, K.; Corsino, L.; Batch, B.C.; Hollis, J.F.; Appel, L.J.; Brantley, P.J.; Loria, C.M.; Champagne, C.M.; et al. Greater weight loss with increasing age in the weight loss maintenance trial. Obesity 2014, 22, 39–44. [Google Scholar] [CrossRef] [Green Version]
- Look AHEAD Research Group. Eight-year weight losses with an intensive lifestyle intervention: The look AHEAD study. Obesity 2014, 22, 5–13. [Google Scholar] [CrossRef] [Green Version]
- Fabricatore, A.N.; Wadden, T.A.; Moore, R.H.; Butryn, M.L.; Heymsfield, S.B.; Nguyen, A.M. Predictors of attrition and weight loss success: Results from a randomized controlled trial. Behav. Res. 2009, 47, 685–691. [Google Scholar] [CrossRef] [Green Version]
- Thakur, A.; Sharma, D.; Gupta, B.; Kramadhari, N.; Rajagopal, R.; Simmons, D.; Piya, M.K. Severe obesity in a specialist type 2 diabetes outpatient clinic: An Australian retrospective cohort study. BMC Endocr. Disord. 2021, 21, 55. [Google Scholar] [CrossRef]
- Stevenson, D.W.; Darga, L.L.; Spafford, T.R.; Ahmad, N.; Lucas, C.P. Variable effects of weight loss on serum lipids and lipoproteins in obese patients. Int. J. Obes. 1988, 12, 495–502. [Google Scholar] [PubMed]
- Van Driel, M.L.; Morledge, M.D.; Ulep, R.; Shaffer, J.P.; Davies, P.; Deichmann, R. Interventions to improve adherence to lipid-lowering medication. Cochrane Database Syst. Rev. 2016, 12, CD004371. [Google Scholar] [CrossRef]
- Deichmann, R.E.; Morledge, M.D.; Ulep, R.; Shaffer, J.P.; Davies, P.; van Driel, M.L. A Metaanalysis of Interventions to Improve Adherence to Lipid-Lowering Medication. Ochsner. J. 2016, 16, 230–237. [Google Scholar] [PubMed]
- D’Souza, C.; Hay, P.; Touyz, S.; Piya, M.K. Bariatric and Cosmetic Surgery in People with Eating Disorders. Nutrients 2020, 12, 2861. [Google Scholar] [CrossRef]
- Hazlehurst, J.M.; Logue, J.; Parretti, H.M.; Abbott, S.; Brown, A.; Pournaras, D.J.; Tahrani, A.A. Developing Integrated Clinical Pathways for the Management of Clinically Severe Adult Obesity: A Critique of NHS England Policy. Curr. Obes. Rep. 2020, 9, 530–543. [Google Scholar] [CrossRef] [PubMed]


| EOSS Stage | Stage Conceptual Description | Study Definition |
|---|---|---|
| 0 | No apparent obesity-related risk factors, physical symptoms, psychopathology, functional limitations and/or impairments of well-being. | No EOSS factors are reported. |
| 1 | Presence of obesity-related subclinical risk factors, mild physical symptoms, mild psychopathology, mild functional limitations and/or impairment of well-being. | Any of the following:
|
| 2 | Presence of established obesity-related chronic disease, moderate limitations in activities of daily living and/or well-being. | Any of the following:
|
| 3 | Established end-organ damage, significant psychopathology, significant functional limitations and/or impairment of well-being. | Any of the following:
|
| 4 | Severe (potentially end-stage) disabilities from obesity-related chronic diseases, disabling psychopathology, functional limitations and/or impairment of well-being. | No data on these factors are available to evaluate this stage. |
| EOSS-2 (n = 101) | EOSS-3 (n = 71) | p-Value | |
|---|---|---|---|
| Age (years) | 46.5 ± 13.9 | 56.0 ± 11.6 | <0.001 * |
| Sex (n, % Female) | 77 (76.2%) | 46 (64.8%) | 0.101 |
| Employed (n, %) | 39 (38.6%) | 16 (22.5%) | 0.026 * |
| Weight (in kg) | 141.2 ± 32.4 | 143.5 ± 28.4 | 0.471 |
| BMI | 50.4 ± 9.1 | 52.3 ± 8.6 | 0.065 |
| Desiring bariatric surgery (n, % yes) | 57 (56.4%) | 41 (57.7%) | 0.864 |
| T2DM Outcomes (Patients with T2DM at baseline only) | |||
| Number with T2DM (n, %) | 50 (49.5%) | 46 (64.8%) | 0.047 * |
| Duration of diabetes | 7.2 ± 7.0 | 11.7 ± 8.1 | <0.001 * |
| HbA1c (%) | 7.6 ± 1.7 | 7.6 ± 1.6 | 0.794 |
| Patients with HbA1c < 7% (n, %) | 21 (41.7%) | 21 (45.6%) | 0.848 |
| Number of non-insulin agents | 1.5 ± 0.9 | 1.5 ± 0.9 | 0.648 |
| Patients requiring insulin (n, %) | 11 (22.0%) | 20 (43.5%) | 0.025 * |
| Daily dose of insulin (units) | 160.0 ± 134.4 | 122.5 ± 72.3 | 0.649 |
| Hypertension | |||
| Number with hypertension (n, %) | 69 (68.3%) | 59 (83.1%) | 0.029 * |
| Number of blood pressure medications | 1.0 ± 1.2 | 2.0 ± 1.4 | <0.001 * |
| Systolic blood pressure (mmHg) | 130.4 ± 15.1 | 132.6 ± 18.0 | 0.512 |
| Dyslipidaemia | |||
| Number with dyslipidaemia (n, %) | 45 (44.6%) | 47 (66.2%) | 0.005 * |
| Number of cholesterol-lowering agents | 0.4 ± 0.5 | 0.8 ± 0.7 | <0.001 * |
| Total cholesterol (mmol/L) | 4.4 ± 1.1 | 4.5 ± 1.0 | 0.568 |
| LDL (mmol/L) | 2.5 ± 1.0 | 2.3 ± 0.9 | 0.527 |
| Triglycerides (mmol/L) | 2.0 ± 1.3 | 1.8 ± 0.8 | 0.886 |
| HDL (mmol/L) | 1.1 ± 0.3 | 1.2 ± 0.3 | 0.160 |
| Micronutrients | |||
| Adjusted Calcium (mmol/L) | 2.4 ± 0.1 | 2.4 ± 0.1 | 0.348 |
| Magnesium (mmol/L) | 0.8 ± 0.1 | 0.8 ± 0.1 | 0.434 |
| Phosphate (mmol/L) | 1.1 ± 0.2 | 1.1 ± 0.2 | 0.842 |
| Iron (μmol/L) | 12.5 ± 3.8 | 12.8 ± 4.3 | 0.766 |
| Vitamin B12 (pmol/L) | 296.1 ± 154.6 | 352.1 ± 230.4 | 0.158 |
| Folate (nmol/L) | 25.6 ± 8.8 | 25.6 ± 10.0 | 0.874 |
| Vitamin D (nmol/L) | 51.6 ± 24.7 | 58.4 ± 20.3 | 0.127 |
| EOSS-2 (n = 63) | EOSS-3 (n = 45) | |||||
|---|---|---|---|---|---|---|
| Initial | 12 Months | p-Value | Initial | 12 Months | p-Value | |
| Weight (in kg) | 139.4 ± 31.8 | 131.8 ± 31.8 | <0.001 * | 141.4 ± 24.2 | 129.8 ± 24.3 | <0.001 * |
| BMI | 50.3 ± 9.3 | 47.5 ± 9.4 | <0.001 * | 51.4 ± 8.1 | 47.2 ± 8.3 | <0.001 * |
| T2DM (Patients with T2DM at baseline only) | ||||||
| Number of patients with T2DM (n, %) | 36 (57.1%) | 32 (50.8%) | 0.474 | 34 (75.6%) | 32 (71.1%) | 0.726 |
| HbA1c (T2DM patients only) (%) | 7.8 ± 1.8 | 7.2 ± 1.5 | 0.034 * | 7.9 ± 1.6 | 7.4 ± 1.3 | 0.086 |
| Percentage with HbA1c < 7% (n, %) | 15 (41.7%) | 17 (47.2%) | 0.635 | 13 (38.2%) | 14 (41.1%) | 0.804 |
| Number of non-insulin agents (T2DM patients only) | 1.6 ± 0.9 | 1.7 ± 1.0 | 0.710 | 1.5 ± 1.0 | 1.6 ± 0.8 | 0.553 |
| Percentage requiring insulin (T2DM patients only) (n, %) | 9 (25.0%) | 9 (25.0%) | 1.000 | 17 (50.0%) | 17 (50.0%) | 1.000 |
| Daily dose of insulin (T2DM patients only) (units) | 161.1 ± 145.5 | 66.4 ± 40.3 | 0.037 * | 111.8 ± 82.7 | 71.0 ± 66.6 | 0.007 * |
| Hypertension | ||||||
| Percentage with hypertension (n, %) | 49 (77.8%) | 45 (71.4%) | 0.412 | 38 (84.4%) | 39 (86.7%) | 0.764 |
| Number of blood pressure medications | 1.2 ± 1.2 | 1.1 ± 1.2 | 0.112 | 2.0 ± 1.3 | 1.9 ± 1.3 | 0.434 |
| Systolic blood pressure (mmHg) | 131.2 ± 15.9 | 133.0 ± 17.6 | 0.561 | 134.8 ± 18.6 | 128.6 ± 18.7 | 0.049 * |
| Dyslipidaemia | ||||||
| Percentage with dyslipidaemia (n, %) | 31 (49.2%) | 32 (50.8%) | 0.858 | 33 (73.3%) | 35 (77.8%) | 0.623 |
| Number of cholesterol-lowering agents | 0.5 ± 0.6 | 0.5 ± 0.6 | 0.414 | 0.9 ± 0.8 | 1.0 ± 0.7 | 0.157 |
| Total cholesterol (mmol/L) | 4.3 ± 1.0 | 4.4 ± 1.1 | 0.635 | 4.6 ± 1.0 | 3.8 ± 0.8 | <0.001 * |
| LDL (mmol/L) | 2.3 ± 0.9 | 2.3 ± 0.6 | 0.640 | 2.4 ± 0.9 | 1.8 ± 0.8 | 0.006 * |
| Triglycerides (mmol/L) | 1.9 ± 1.4 | 1.9 ± 1.9 | 0.945 | 1.8 ± 0.8 | 2.1 ± 1.2 | 0.275 |
| HDL (mmol/L) | 1.1 ± 0.3 | 1.1 ± 0.3 | 0.904 | 1.2 ± 0.3 | 1.1 ± 0.2 | 0.099 |
| EOSS-2 | EOSS-3 | p-Value | |
|---|---|---|---|
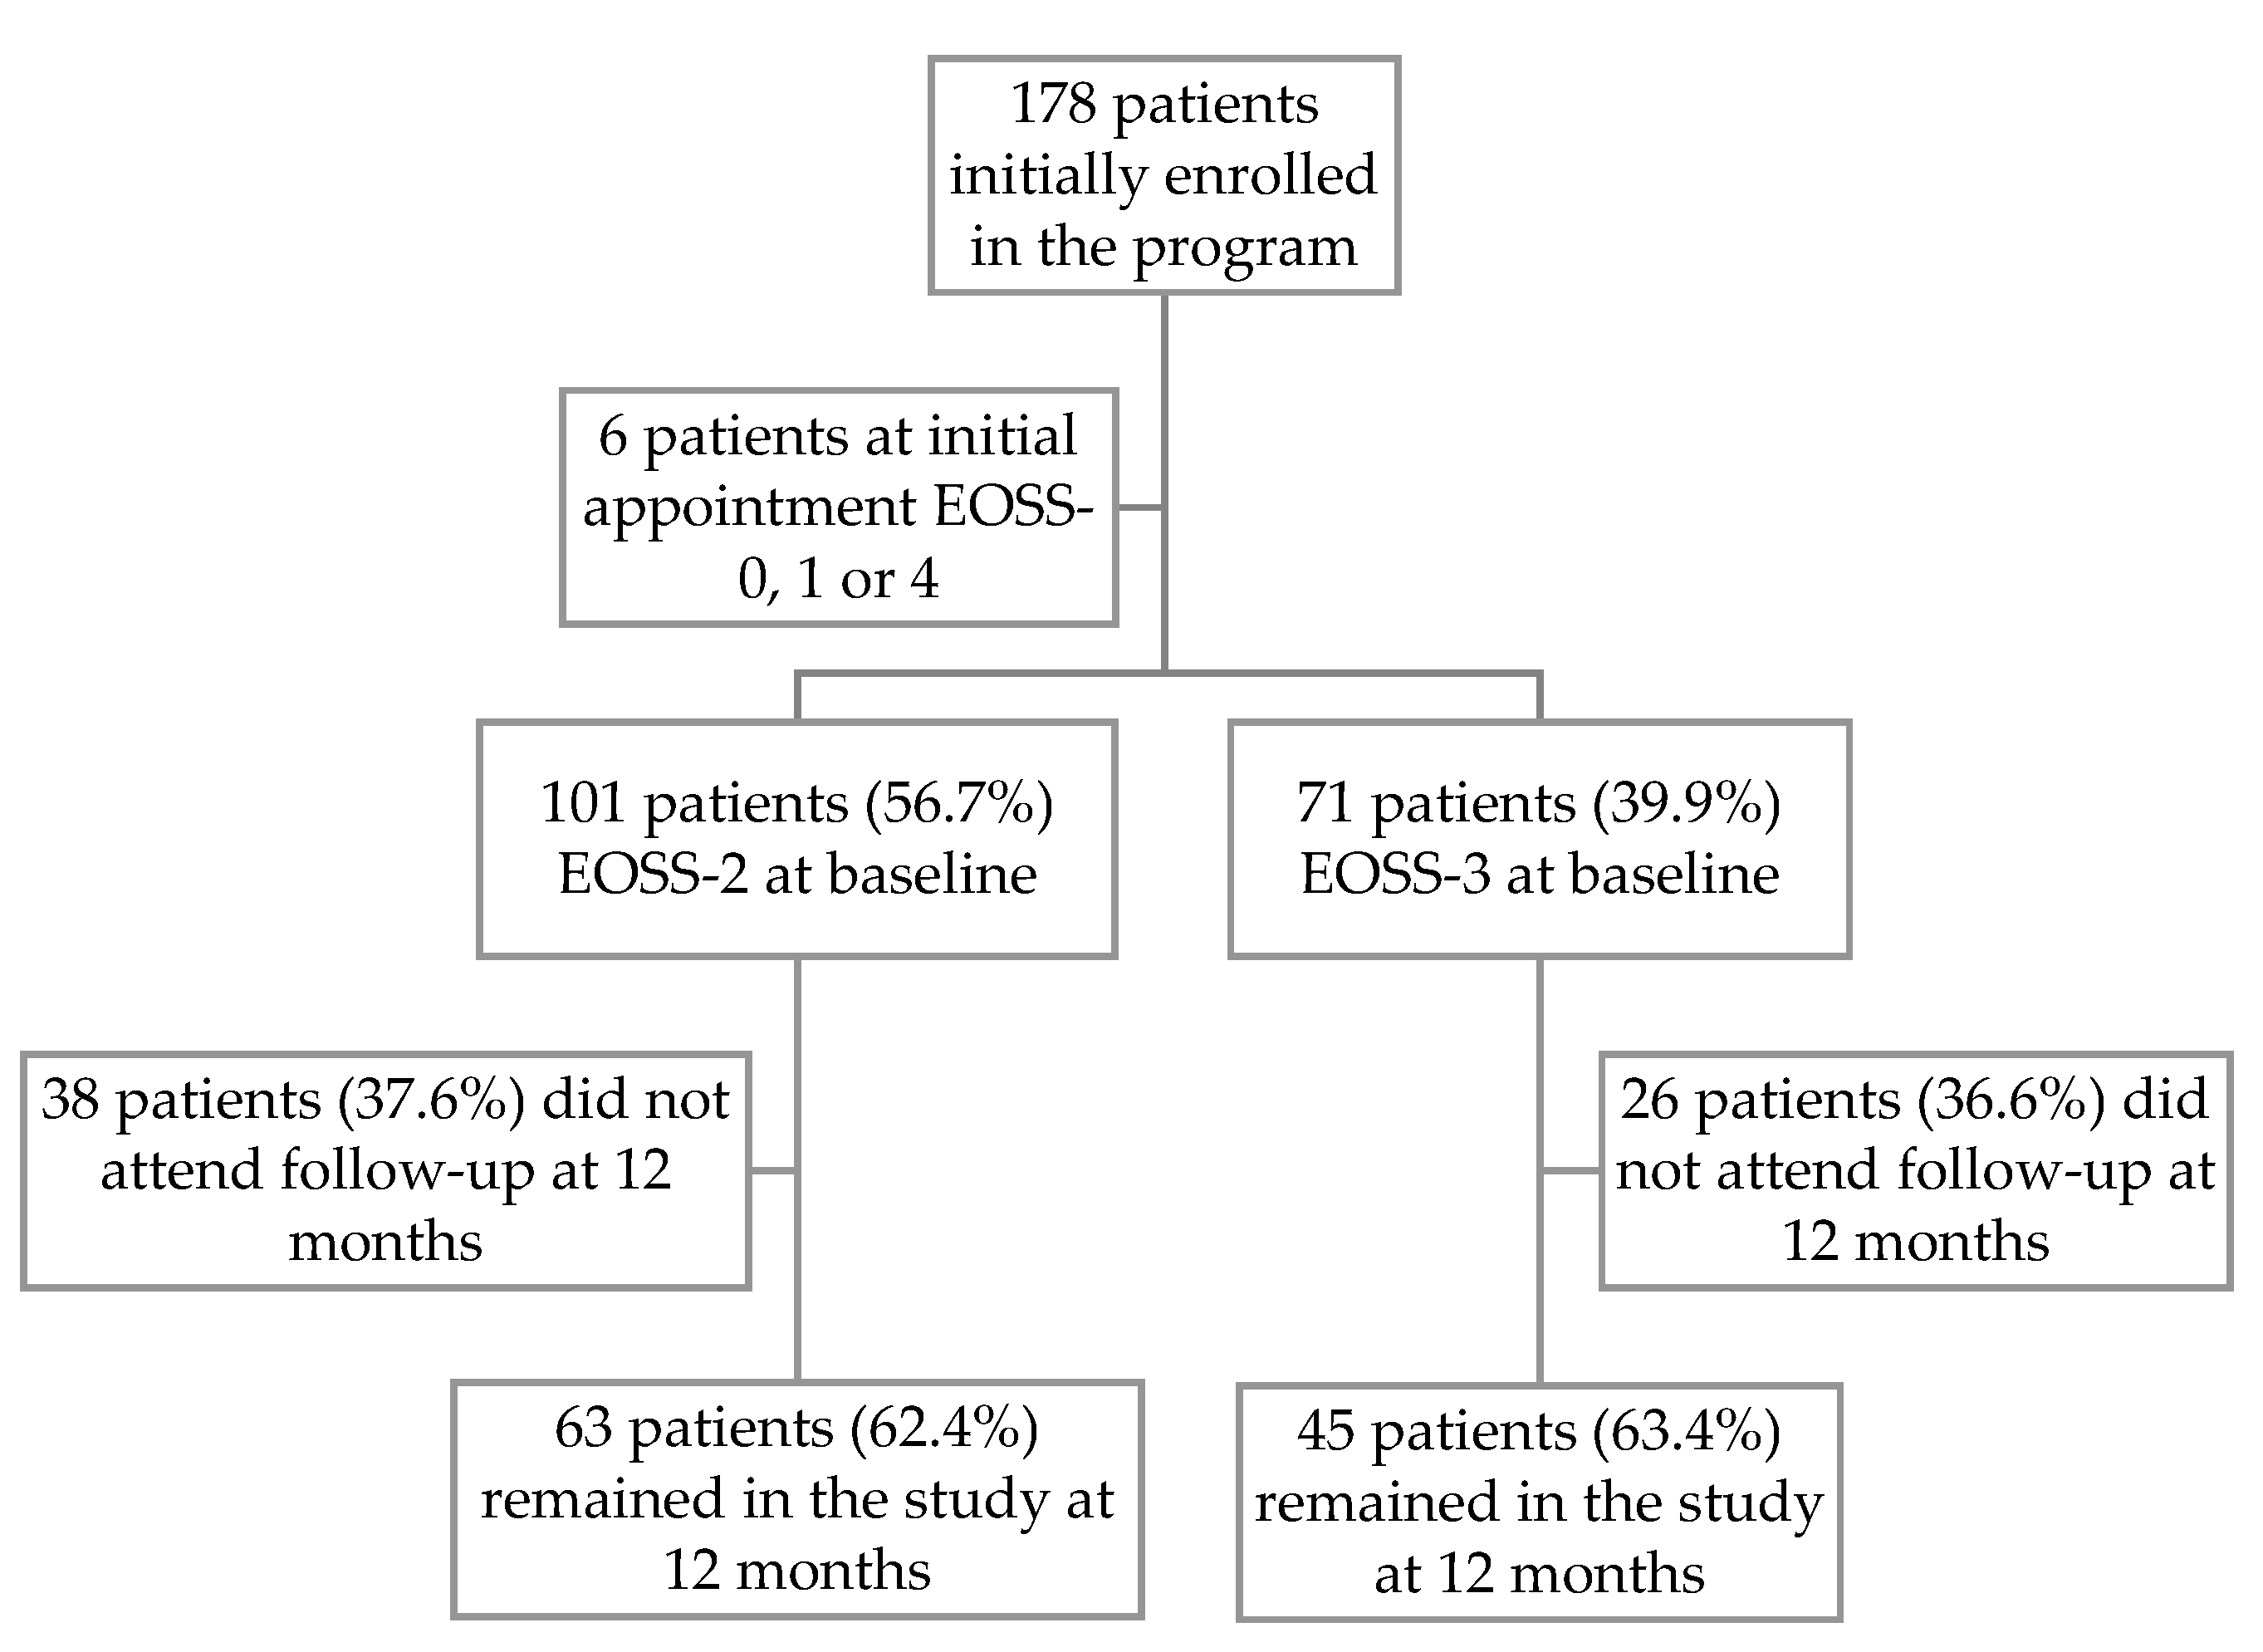
| Number of patients with 12-month follow-up (n, %) | 63 (62.4%) | 45 (63.4%) | 0.893 |
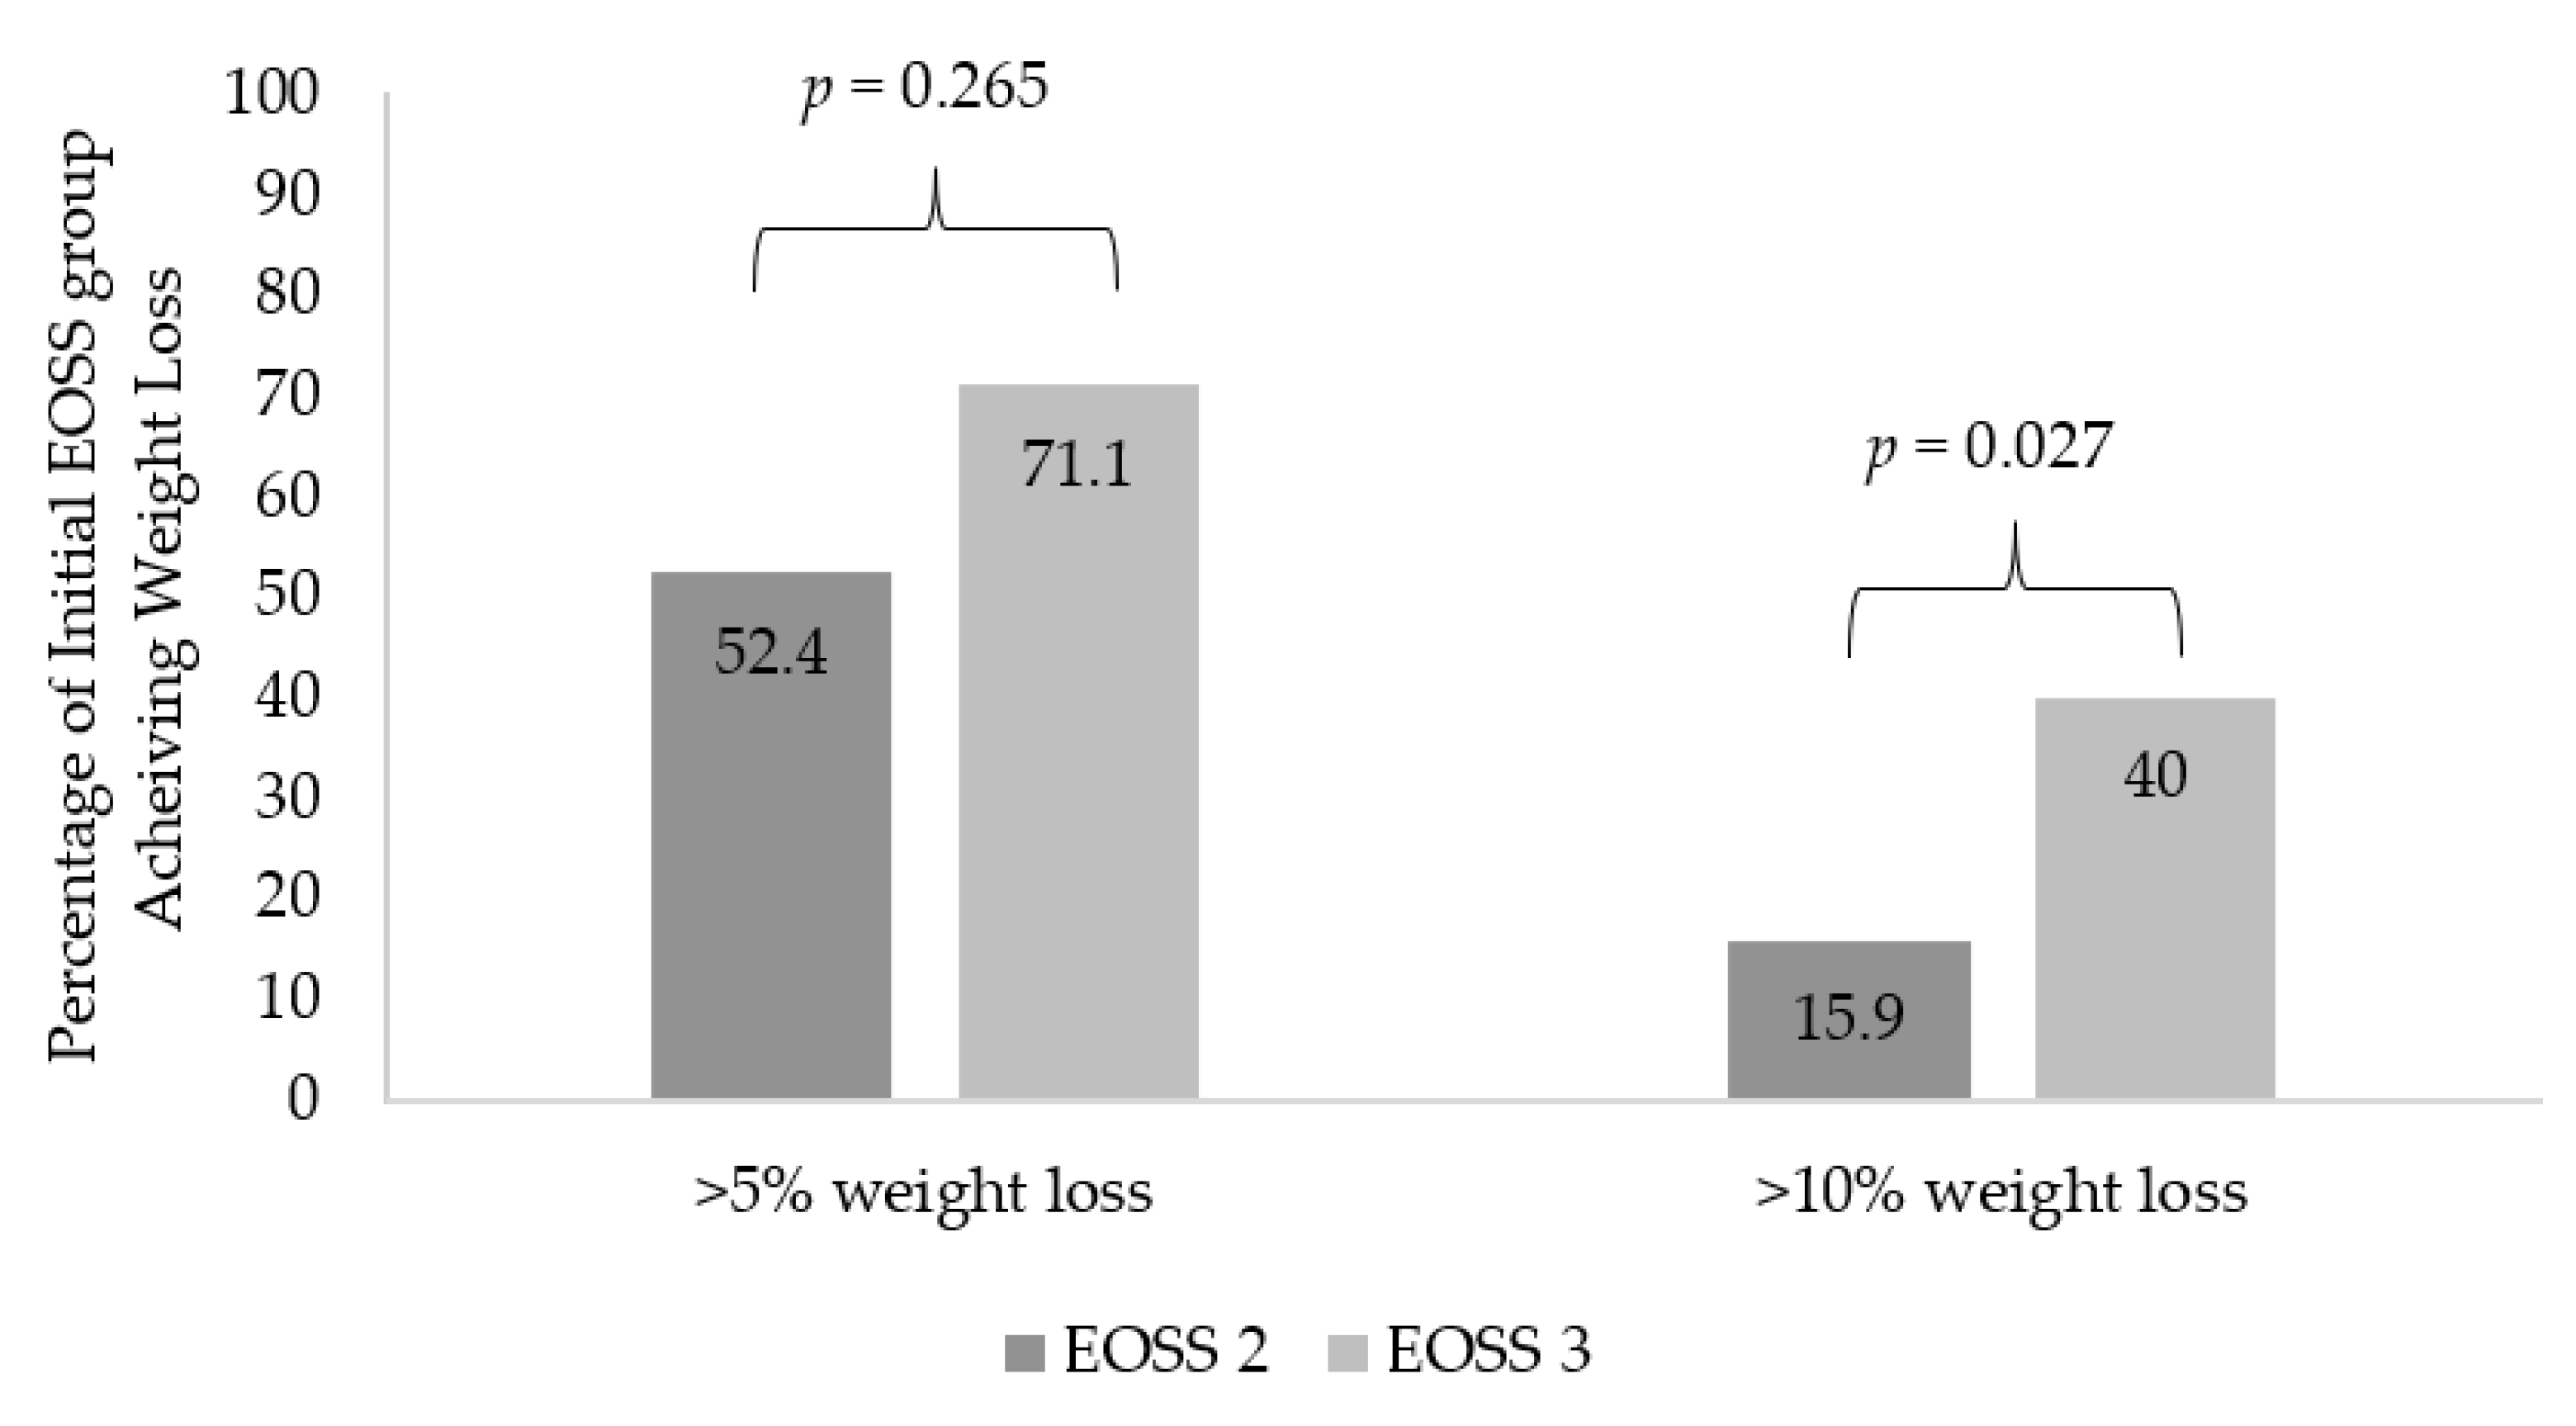
| Weight loss (%) | 5.7 ± 5.3 | 8.2 ± 7.3 | 0.047 * |
| Percentage who lost >5% weight (n, %) | 33 (52.4%) | 32 (71.1%) | 0.050 |
| Percentage who lost >10% weight (n, %) | 10 (15.9%) | 18 (40.0%) | 0.005 * |
| T2DM Outcomes (Patients with T2DM at baseline only) | |||
| Number with T2DM follow-up at 12 months (n, %) | 32 (50.8%) | 32 (71.1%) | 0.034 * |
| Weight loss (%) | 5.7 ± 6.0 | 7.7 ± 6.1 | 0.184 |
| HbA1c at 12 months (%) | 7.2 ± 1.5 | 7.4 ± 1.3 | 0.329 |
| Percentage with HbA1c < 7% (n, %) | 17 (47.2%) | 14 (41.2%) | 0.610 |
| Change in HbA1c (in %) | 0.6 ± 1.4 | 0.5 ± 1.4 | 0.917 |
| Number of patients with remission of T2DM (n, %) | 4 (11.1%) | 2 (5.9%) | 0.434 |
| Number of non-insulin agents | 1.7 ± 1.0 | 1.6 ± 0.8 | 0.980 |
| Number requiring insulin (n, %) | 9 (25%) | 17 (50.0%) | 0.030 * |
| Percentage of those initially on insulin who ceased insulin (n, %) | 1 (11.1%) | 1 (5.8%) | 0.634 |
| Daily dose of insulin (units) | 66.4 ± 40.3 | 71.0 ± 66.6 | 0.619 |
| Reduction in insulin dose (units) | 94.7 ± 123.1 | 40.8 ± 55.8 | 0.234 |
| Hypertension | |||
| Number with hypertension (n, %) | 45 (71.4%) | 39 (86.7%) | 0.060 |
| Number of anti-hypertensives | 1.1 ± 1.2 | 1.9 ± 1.3 | <0.001 * |
| Systolic blood pressure (mmHg) | 133.0 ± 17.6 | 128.6 ± 18.7 | 0.873 |
| Dyslipidaemia | |||
| Number with dyslipidaemia (n, %) | 32 (50.8%) | 35 (77.8%) | 0.004 * |
| Number of cholesterol-lowering agents | 0.5 ± 0.6 | 1.0 ± 0.7 | 0.001 * |
| Total cholesterol (mmol/L) | 4.4 ± 1.1 | 3.8 ± 0.8 | 0.006 * |
| Change in cholesterol (mmol/L) | 0.2 ± 1.4 | -0.8 ± 1.1 | 0.001 * |
| LDL (mmol/L) | 2.3 ± 0.6 | 1.8 ± 0.8 | 0.027 * |
| Triglycerides (mmol/L) | 1.9 ± 1.8 | 2.1 ± 1.2 | 0.234 |
| HDL (mmol/L) | 1.1 ± 0.3 | 1.1 ± 0.2 | 0.266 |
Publisher’s Note: MDPI stays neutral with regard to jurisdictional claims in published maps and institutional affiliations. |
© 2022 by the authors. Licensee MDPI, Basel, Switzerland. This article is an open access article distributed under the terms and conditions of the Creative Commons Attribution (CC BY) license (https://creativecommons.org/licenses/by/4.0/).
Share and Cite
Kodsi, R.; Chimoriya, R.; Medveczky, D.; Grudzinskas, K.; Atlantis, E.; Tahrani, A.A.; Kormas, N.; Piya, M.K. Clinical Use of the Edmonton Obesity Staging System for the Assessment of Weight Management Outcomes in People with Class 3 Obesity. Nutrients 2022, 14, 967. https://0-doi-org.brum.beds.ac.uk/10.3390/nu14050967
Kodsi R, Chimoriya R, Medveczky D, Grudzinskas K, Atlantis E, Tahrani AA, Kormas N, Piya MK. Clinical Use of the Edmonton Obesity Staging System for the Assessment of Weight Management Outcomes in People with Class 3 Obesity. Nutrients. 2022; 14(5):967. https://0-doi-org.brum.beds.ac.uk/10.3390/nu14050967
Chicago/Turabian StyleKodsi, Raymond, Ritesh Chimoriya, David Medveczky, Kathy Grudzinskas, Evan Atlantis, Abd A. Tahrani, Nic Kormas, and Milan K. Piya. 2022. "Clinical Use of the Edmonton Obesity Staging System for the Assessment of Weight Management Outcomes in People with Class 3 Obesity" Nutrients 14, no. 5: 967. https://0-doi-org.brum.beds.ac.uk/10.3390/nu14050967