
Dietary Branched-Chain Amino Acids (BCAAs) and Risk of Dyslipidemia in a Chinese Population


1
National Institute for Nutrition and Health, Chinese Center for Disease Control and Prevention, Beijing 100050, China
2
NHC Key Laboratory of Trace Element Nutrition, National Institute for Nutrition and Health, Chinese Center for Disease Control and Prevention, Beijing 100050, China
*
Author to whom correspondence should be addressed.
Nutrients 2022, 14(9), 1824; https://0-doi-org.brum.beds.ac.uk/10.3390/nu14091824
Submission received: 8 March 2022
/
Revised: 24 April 2022
/
Accepted: 25 April 2022
/
Published: 27 April 2022
(This article belongs to the Special Issue Nutritional Surveillance and Nutritional Cohort Study in China)
Abstract
:This study aimed to explore the association between dietary BCAAs, blood lipid levels and risk of dyslipidemia. In this case–control study, a total of 9541 subjects with normal blood lipids were included as a control group, and 9792 patients with dyslipidemia were included as a case group. Dietary BCAA intake data were measured using 3-day 24 h meal recalls and household condiment weighing. All samples were from China Nutrition and Health Surveillance (2015). Generalized linear model, logistic regression, and restricted cubic spline (RCS) were used to evaluate the relationship between dietary BCAAs, blood lipids and dyslipidemia. After adjusting for confounding factors, dietary BCAAs were positively correlated with TC and LDL-C (p < 0.05). Higher dietary BCAAs were associated with higher OR for Hypercholesteremia (Q4 vs. Q1, OR = 1.29, 95% CI: 1.05–1.58, p-trend = 0.034). The ORs of Hyper-LDL-cholesterolemia showed inverted U-shaped with increasing dietary BCAAs (Q3 vs. Q1, OR = 1.20, 95% CI: 1.03–1.39; Q2 vs. Q1, OR = 1.05, 95% CI: 1.01–1.31). The relationship between dietary BCAAs and the risk of Hypercholesteremia and Hyper-LDL-cholesterolemia were both nonlinear (p nonlinearity = 0.0059, 0.0198). Our study reveals that dietary BCAAs are associated with specific types of lipids and risk of dyslipidemia, some of which may be non-linear.
1. Instruction
Dyslipidemia is characterized by elevated total cholesterol (TC) or triglycerides (TG) or low-density lipoprotein cholesterol (LDL-C), or decreased high-density lipoprotein cholesterol (HDL-C) [1]. The overall prevalence of dyslipidemia in Chinese adults was 34.0% (2007–2010) [2], The prevalence of Hypercholesteremia, Hyper-LDL-choles terolemia, Hypo-HDL-cholesterolemia and Hypertriglyceridemia were 6.9%, 8.1%, 20.4% and 13.8%, respectively, in China (2013–2014) [3]. Unfortunately, dyslipidemia is the key risk factor for atherosclerosis and cardiovascular disease (CVD) [4,5]. Currently, the worldwide prevalence of dyslipidemia has become a public health problem worthy of attention [6,7,8], which has also caused a huge economic burden [9]. Fortunately, previous studies have shown that there is a close relationship between dyslipidemia and diet [10,11,12], and dyslipidemia can be prevented and improved through diet [13]. Therefore, exploring the risk factors of dyslipidemia among dietary factors is of great significance for the prevention of CVD.
Branched-chain amino acids (BCAAs) are an important component of dietary protein, including leucine, isoleucine and valine. They are all essential amino acids [14]. Since BCAAs cannot be synthesized in the human body, the BCAAs must be obtained from food [15]. Past studies have shown that BCAA supplementation has a positive effect on preventing muscle loss and improving muscle function [16,17]. However, a large number of studies in recent years have found that high levels of dietary or serum BCAAs are risk factors for certain chronic diseases, such as obesity, insulin resistance and diabetes [18,19,20]. Meanwhile, studies have shown that restricting the intake of BCAAs can prolong lifespan [21]. In addition, serum BCAAs have been shown to be a biomarker for dyslipidemia [22,23]. A study from Finland [24] demonstrated that high concentrations of BCAAs in circle blood were significantly associated with lipid metabolism.
However, the current research about the effects of dietary BCAAs on blood lipids and dyslipidemia is very limited. The clarification of this relationship has important implications for the prevention of dyslipidemia through diet. Therefore, we conducted this case–control study in a Chinese population to explore the relationship between dietary BCAAs, dyslipidemia risk and lipid levels.
2. Research Design and Methods
2.1. Study Population and Data Collection
A total of 19,333 participants were included in this study: 9541 subjects with normolipidemia as a control group, 9792 subjects with dyslipidemia as a case group, including 2539 subjects with Hypercholesteremia, 4523 subjects with Hypertriglyceridemia, 5461 subjects with Hypo-HDL-cholesterolemia and 2700 subjects with Hyper-LDL-cholesterolemia. Among the dyslipidemia patients, 179 subjects had 4 kinds of dyslipidemia simultaneously; 204 subjects had Hypercholesteremia, Hypertriglyceridemia and Hypo-HDL-cholesterolemia; 450 subjects had Hypercholesteremia, Hypertriglyceridemia and Hyper-LDL-cholesterolemia; 144 subjects had Hypercholesteremia and Hypertriglyceridemia; 47 subjects had Hypercholesteremia, Hypo-HDL-cholesterolemia and Hyper-LDL-cholesterolemia; 19 subjects had Hypercholesteremia and Hypo-HDL-cholesterolemia; 1192 subjects had Hypercholesteremia and Hyper-LDL-cholesterolemia; 112 subjects had Hypertriglyceridemia, Hypo-HDL-cholesterolemia and Hyper- LDL-cholesterolemia; 1753 subjects had Hypertriglyceridemia and Hypo-HDL-cholesterolemia; 148 subjects had Hypertriglyceridemia and Hyper-LDL-cholesterolemia; 69 subjects had Hypo-HDL-cholesterolemia and Hyper-LDL-cholesterolemia (Figure 1). All cases were from China Nutrition and Health Surveillance (2015) (CHNS 2015). This survey is a nationwide monitoring of residents’ nutritional status conducted by the Chinese Center for Disease Control and Prevention (China CDC), aiming to evaluate residents’ nutritional status, health and disease conditions and living habits. This project covered 31 provinces in China, including a total of 302 monitoring districts and counties. The specific details of this project are described in the previous literature [25]. In this case–control study, cases with dyslipidemia were frequency-matched with control subjects based on sex, age (±2 years) and BMI (±3 kg/m2). Inclusion criteria for all subjects were Age ≥ 30 years old, BMI < 40 kg/m2. The inclusion criteria of control group were no history of dyslipidemia diagnosis, and normal lipid level in clinical examination and blood tests during this survey. All subjects suffering from hypertension, diabetes, coronary heart disease, stroke, chronic obstructive pulmonary disease, asthma, bone and joint disease, neck and shoulder disease, chronic digestive system disease, chronic urinary system disease, tumor and other diseases were excluded from the study.
The diagnostic criteria for dyslipidemia refer to the “Guidelines for the Prevention and Treatment of Dyslipidemia in Chinese Adults (Revised 2016)” [26], that is, Hypercholesteremia: TC ≥ 6.20 mmol/L; Hypercholesteremia: TG ≥ 2.30 mmol/L; Hyper-LDL-cholesterolemia: LDL-C ≥ 4.10 mmol/L; Hypo-HDL-cholesterolemia: HDL-C < 1.00 mmol/L, any type of them was called dyslipidemia. Basic characteristics, including age, gender, body mass index (BMI), blood pressure, metabolic equivalent (MET-h/d), smoking status, drinking status and education level, were obtained through standardized questionnaires designed by national survey groups. Anthropometric measurements, such as weight (kg) and height (cm), were conducted by uniformly trained staff of district/county CDC. All subjects underwent physical examination in the early morning after an overnight fast, and subjects were instructed to remove their shoes and heavy clothing and untie their hair buns during the measurement. BMI was calculated after the survey, and the formula was weight (kg)/square of height (m2). At the same time, the equipment used for body measurement were the unified model, electronic weight scale (TANITA HD-390) and electronic blood pressure monitor (OMRON HBP1300), and the measurement accuracy is 0.1 cm, 0.1 kg and 1 mmHg, respectively. This project and study were approved by the Ethics Committee of the Chinese Center for Disease Control and Prevention (approval number: 201519-B). At the same time, all participants signed an informed consent form before participating in the project.
2.2. Dietary BCAAs Assessment
Dietary data were collected using the 24 h retrospective food recall method to investigate the diet of each subject for three days (including two weekdays and one weekend), while the intake of condiments such as oil and salt was measured using a three-day household weighing method. Investigators are staff from district/county CDCs and community hospitals, who have received strict and uniform training on dietary surveys, and are trained by the national and provincial CDCs. During the investigation, subjects were asked to maintain their previous eating and living habits. Dietary energy, carbohydrate, protein, fat, and BCAAs intakes were calculated by combining dietary data with Chinese food composition tables [27,28].
2.3. Laboratory Measurement
Blood samples drawn from the antecubital vein were collected from all subjects, and the blood samples were separated into plasma within 1 h, sent to the laboratory through the cold chain and frozen at −80 °C for later use. Fasting plasma glucose (FPG), serum uric acid (SUA), total cholesterol, triglycerides, LDL-C, HDL-C were detected using Hitachi Autoanalyzer 7600 (Hitachi, Tokyo, Japan). All measurements are performed by professional laboratory personnel, while strict quality control is carried out in the laboratory.
2.4. Statistical Analysis
Basic characteristics of the case and control groups were compared using Student’s t-test (continuous variable) and χ2 test (categorical variable). Generalized linear models were used to estimate the association between blood lipids and dietary BCAAs. Multiple logistic regression analysis was used to estimate the association between dietary BCAAs and risk of dyslipidemia. To estimate the odds ratios (ORs) for different types of dyslipidemia, dietary BCAAs are grouped by quartile: quartile 1 (Q1), <7.03 g/day; quartile 2 (Q2), 7.03 to <9.64 g/day; quartile 3 (Q3), 9.64 to <13.09; quartile 4 (Q4), ≥13.09. Regression models were adjusted for potential confounders, including age, sex, region, BMI, protein intake (g/day), carbohydrate intake (g/day), fat intake (g/day), current smoking status (yes/no), current alcohol consumption (yes/no), metabolic equivalents (MET-h/day) and education level (none or primary, middle, high school or college). Since the overall sample size is close to 20,000, according to the central limit theorem, the distributions of various variables were close to the normal distribution. In terms of sensitivity analysis, we performed stratified analysis by gender, age, region, BMI, smoking, alcohol consumption and metabolic equivalent. Meanwhile, interaction analysis was performed to evaluate the effect of stratification factors on the relationship between BCAAs and risk of dyslipidemia. We further explored the nonlinear relationship between dietary BCAAs and ORs of dyslipidemia using Restricted cubic splines (RCS) and selected 3 nodes for curve fitting according to the AIC optimality principle. Statistical analysis was performed using R 4.1.2. p < 0.05 (two-tailed) was considered to be significant.
3. Results
Table 1 presents the demographic and clinical characteristics of dyslipidemia and control groups. Compared with the control group, the systolic blood pressure (SBP), diastolic blood pressure (DBP) and dietary BCAAs intakes, levels of education, smoking rate and alcohol consumption rate in dyslipidemia group was significantly higher (p < 0.05). In addition, the dyslipidemia group had lower energy intake, fat intake, metabolic equivalents. As expected, FPG, SUA, TC, TG, LDL-C were higher and HDL-C was lower in dyslipidemia cases compared with controls (p < 0.001). The radar chart in Figure 2 visualizes the differences in blood parameters between the case group and the control group, which is consistent with the results in Table 1. The histogram in Figure 3 shows the distribution of dietary BCAAs in different genders of the two groups. The red dotted line represents the respective medians. It can be seen that the intake of dietary BCAAs in males was significantly higher than that in females (t = 27.54, p < 0.0001). Meanwhile, a total of 546 subjects in the case group were taking lipid-lowering medication.
Table 2 explores the linear relationship between dietary BCAAs and blood lipids in different groups. In the case and control groups, dietary BCAAs were positively correlated with TC and LDL-C (p < 0.05). However, TG was negatively correlated with dietary BCAAs in the control group (p = 0.0029), but not in the case group (p > 0.05). Additionally, HDL-C fluctuated with dietary BCAAs in each group (p < 0.05).
Table 3 presents the logistic regression results for association between dietary BCAAs and risk of all types of dyslipidemia. After the model was adjusted for confounding factors, such as age, sex and BMI, region, current smoking status, current alcohol consumption, metabolic equivalents (MET-h/d), carbohydrate intake, protein intake, fat intake and educational level, ORs (95% CI) were statistically significant for Hypercholesteremia and Hyper-LDL-cholesterolemia. Higher dietary BCAAs were associated with higher ORs of Hypercholesteremia. The OR (95% CI) for Hypercholesteremia was 1.29 (1.05, 1.58), comparing the highest and lowest quartiles of dietary BCAAs intake. The ORs (95% CI) of Hyper-LDL-cholesterolemia were only statistically significant in the Q2 and Q3 segments, which were 1.15 (1.01, 1.31) and 1.20 (1.03, 1.39), respectively.
We focused sensitivity analysis on Hypercholesteremia in Table 4. The results showed that the positive association of dietary BCAAs with risk of Hypercholesteremia was almost consistent across all stratified analyses. The association appeared to be more stable in subjects in the lower age group or the lower energy intake group. In addition, age had an interactive effect on this relationship (p = 0.0047).
Table 5 shows dietary sources of dietary BCAAs in dyslipidemia and normolipemic groups. The top six categories of foods that contribute to dietary BCAAs were cereals, red meat, vegetables, fish and seafoods, beans and eggs.
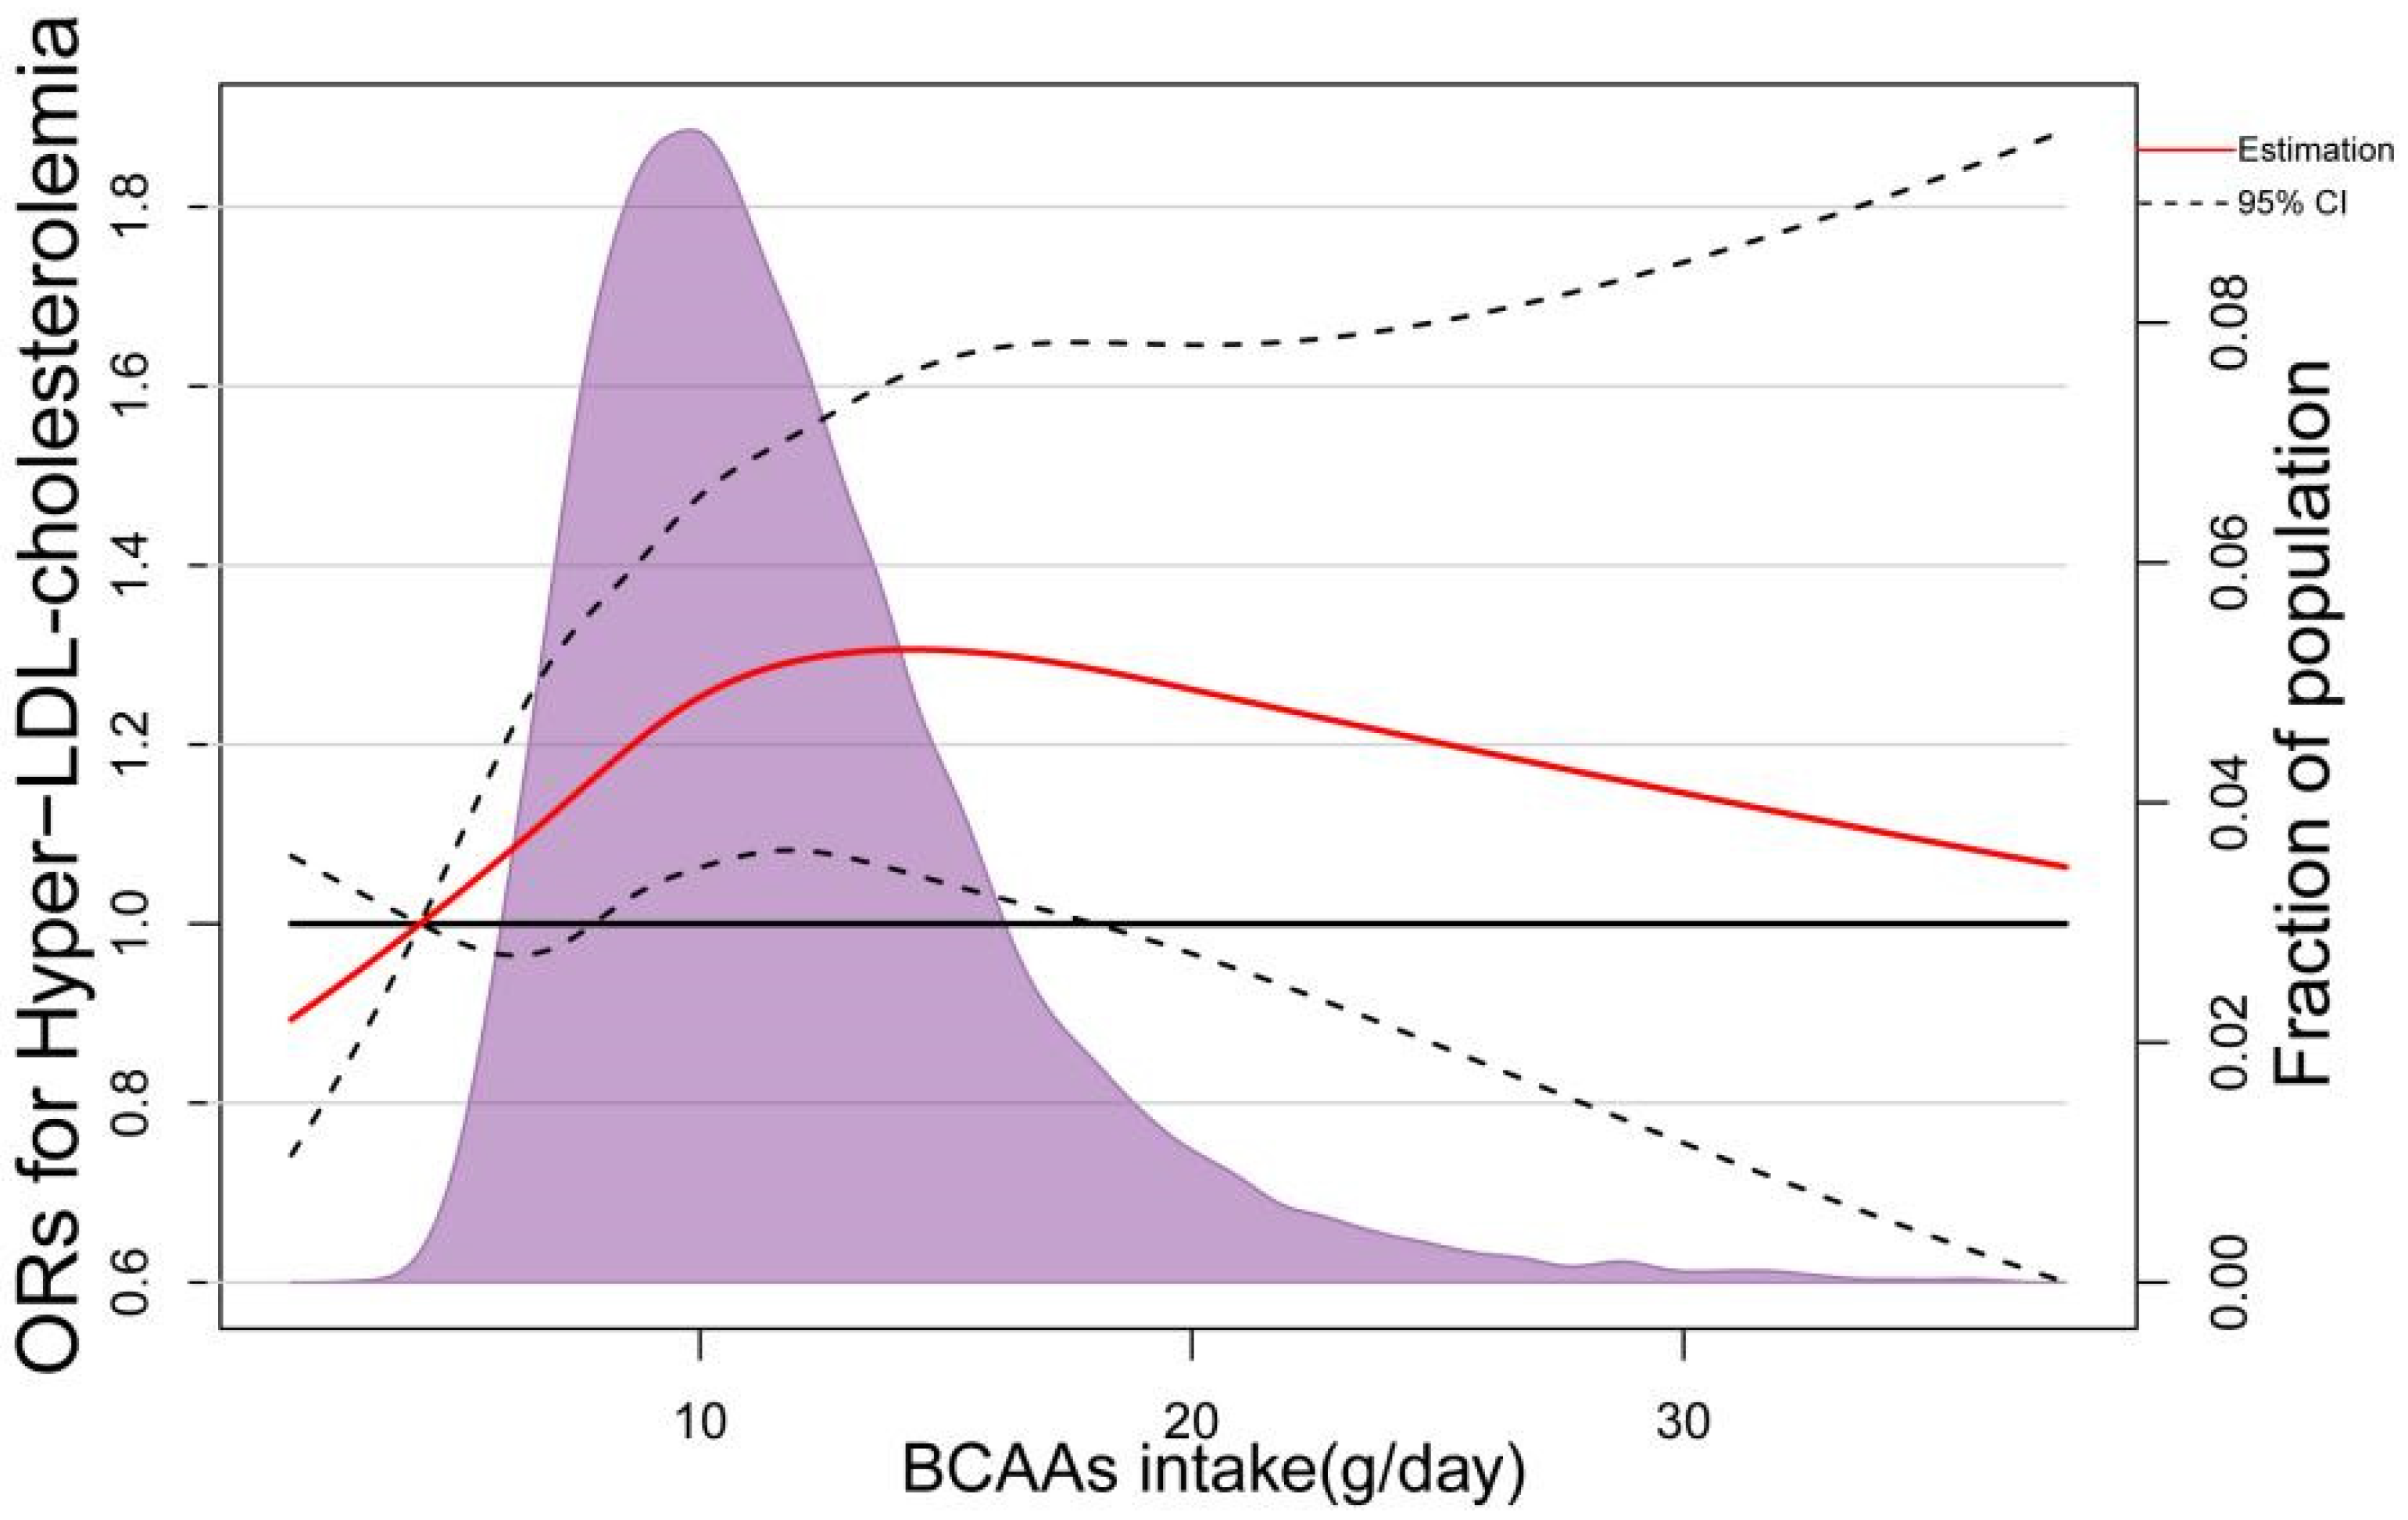
In the RCS based on logistic regression model, the ORs of Hypercholesteremia increased significantly with dietary BCAAS when dietary BCAAs were below 10 g/day, followed by a slower rate of increase (Figure 4). The nonlinear spline test was statistically significant (p nonlinearity = 0.0059), indicating a potential nonlinear relationship between dietary BCAAs and risk of Hypercholesteremia. The same phenomenon was observed in 3 BCAAs (Ile, Leu and Val) separately (Figure 5). In addition, with the increasing of dietary BCAAs, the ORs of Hyper-LDL-cholesterolemia followed an inverted U-shaped trend (Figure 6), but the ORs were statistically significant in the range of dietary BCAAs 8–18 g/day. The nonlinear spline test is also statistically significant (p nonlinearity = 0.0198), which is consistent with the trend of the results in Table 3.
4. Discussion
To the best of our knowledge, this is the first large-scale population-based study for the association between dietary BCAAs and risk of various types of dyslipidemia. In our study, dietary BCAAs were found to be positively correlated with TC and LDL-C. Meanwhile, higher dietary BCAAs were associated with higher ORs of Hypercholesteremia. Dietary BCAAs (range Q2 to Q3) were risk factors for Hyper-LDL-cholesterolemia (OR > 1, p < 0.05). These results were relatively stable after adjustment for potential confounders. In addition, the relationships between dietary BCAAs and the risk of Hypercholesteremia and Hyper-LDL-cholesterolemia were non-linear.
Our study is the first to verify the association between dietary BCAAs and blood lipids in a population-based sample. In both case and control groups, dietary BCAAs were positively correlated with TC and LDL-C. TG was negatively associated with dietary BCAAs in the control group, but not statistically associated in the case group. In addition, HDL-C fluctuated with dietary BCAAs. Previous limited studies have shown that restriction of dietary BCAAs can effectively reduce TG storage in the heart of Zucker fat rats [29]. To date, there were only studies on the relationship between plasma BCAAs and lipid metabolism. In a cross-sectional study of Chinese population, plasma BCAA levels were positively correlated with small dense low-density lipoprotein cholesterol (sdLDL-C), remnant-like particle cholesterol (RLP-C), and TG levels, but negatively correlated with HDL-C [30]. In a study of United States, women with higher plasma BCAAs had lower HDL-C (49.0 vs. 55.0 mg/dL) and higher TG (143 vs. 114 mg/dL), LDL-C (133 vs. 124 mg/dL). All types of BCAAs (isoleucine, leucine, and valine) were similarly associated with these indicators [31]. In addition, several cross-sectional studies have confirmed that there is a correlation between visceral fat content and plasma BCAAs in obese subjects [32,33]. In healthy subjects, there was a positive correlation between plasma BCAAs and both visceral and subcutaneous fat [34]. In study of gene regulation, it was observed that BCAAs degradation is a biological pathway for serum HDL-C-related transcripts [35]. Considering the evidence from these previous studies, there was physiological basis on the association between dietary BCAAs and lipid.
Our findings suggest that dietary BCAAs intake is positively associated with the risk of Hypercholesteremia. This relationship remained very stable after confounder adjustments, stratified analyses, and nonlinear model exploration. This finding extends the relationship between BCAAs and disease at the dietary level. At present, limited studies can be used for reference and analogy, focusing on plasma BCAAs. In Feng-Hua Wang’s study [30], the highest tertile of plasma BCAAs compared with the lowest tertile, the OR of sdLDL-C was 2.33 (95% CI: 1.35, 4.03), 3.63 (95% CI: 1.69, 7.80) for RLP-C and 3.10 (95% CI: 1.66, 5.80) for TG. Studies have also shown that serum BCAAs levels are not only associated with obesity and impaired glucose tolerance, but also with dyslipidemia [23,36], which are characterized by elevated serum TG and decreased HDL-C [37]. As the consensus of the medical community, dyslipidemia is a risk factor for cardiovascular disease (CVD) [38,39], whereas high serum BCAA levels have been proved to be predictors or markers for dyslipidemia [22,23]. These findings suggest that plasma BCAAs are risk factors for atherosclerosis. Coincidentally, catabolites of BCAAs have been shown to be independently associated with coronary artery disease [40]. On the basis of previous studies, our findings seem to construct a complete chain that dietary BCAAs can directly or indirectly (through BCAAs in plasma) affect the occurrence of blood lipids or dyslipidemia. Our study demonstrates that dietary BCAAs have the same potential to cause dyslipidemia as plasma BCAAs.
In the present study, sensitivity analysis showed that the positive association of dietary BCAAs with risk of Hypercholesteremia was almost consistent across all stratified analyses. Meanwhile, age has an interactive effect on this relationship. It indicated that the effect of dietary BCAAs on lipid metabolism is closely related to the individual’s physiological state. The reasons for this phenomenon are multifaceted, among which the possible reasons include gene expression pathways, the activities of metabolic enzymes, and the balance restriction of energy metabolism. We found from the scarce literature that low carbohydrate and calorie restriction diets resulted in lower BCAA biosynthesis in intestinal flora [41]. Taken together with our results, low calorie intake may have contributed to a greater sensitivity to relationship between dietary BCAAs and Hypercholesteremia.
The ORs of Hypercholesteremia in nonlinear exploration increased rapidly with increasing dietary BCAAs and then slowed down. The ORs of Hyper-LDL-cholesterolemia showed an inverted U-shaped relationship. One possible reason could be that the dietary BCAAs and circulating BCAAs might also be non-linear with a “plateau effect”, like dietary cholesterol and blood cholesterol [42]. Meanwhile, various indications implied that dietary BCAAs had a complex intertwined relationship with blood lipids and dyslipidemia. Regarding this mechanism, a study from Finland proposed a hypothesis that the catabolism of BCAA is intertwined with the tricarboxylic acid (TCA) cycle and lipid metabolism [24], and this hypothesis has been validated in older Finnish men. This partly proved that the reason for the nonlinear relationship was the intertwined relationship between serum BCAAs levels and lipid metabolism.
Our study has several strengths. First, we used stricter matching principles than general studies, namely sex, age (±2 years), and BMI (±3 kg/m2). Considering that BMI is a key factor affecting blood lipids [43,44], we added the BMI as matching variable. Second, we developed extremely stringent inclusion criteria to ensure that observations were not interfered by other diseases. All subjects suffering from hypertension, diabetes, coronary heart disease, stroke, chronic obstructive pulmonary disease, asthma, bone and joint disease, neck and shoulder disease, chronic digestive system disease, chronic urinary system disease, tumor and other diseases were excluded from the study. Third, strict quality control procedures. We have developed unified work manual and experimental manual and conducted unified training for all investigators. Meanwhile, national and provincial quality control groups have been formed to track and control each link. Fourth, we performed stratified analysis, interaction analysis and nonlinear analysis. Using these statistical methods, the dose–response relationship and stability of dietary BCAAs and blood lipids were greatly validated.
There are still several limitations in our research. First, our study was based on a case–control study design, so causal relationship cannot be established. Second, measurement errors are unavoidable due to using our dietary recall method: 24 h retrospective method. The 24 h retrospective method is based on subjects’ recall and therefore suffers from recall bias. Third, dietary cholesterol data are lacking in our study, which will be further refined in future studies.
5. Conclusions
Our study observed a positive correlation between dietary BCAAs and TC and LDL-C. Meanwhile, higher dietary BCAAs were associated with higher ORs of Hypercholesteremia. The relationship between dietary BCAAs and risk of Hypercholesteremia is non-linear. The causal relationship requires further validation in experimental studies or prospective cohorts.
Author Contributions
Conceptualization, L.Y. and J.Z.; formal analysis, L.Y. and Q.Z.; investigation, L.Y., Y.L. and Q.Z.; methodology, L.Y., Q.Z. and P.S.; validation, L.Y. and P.S.; writing—original draft preparation, L.Y.; writing—review and editing, P.S. and J.Z. All authors have read and agreed to the published version of the manuscript.
Funding
This study was supported by the National Health Commission of the People’s Republic of China Medical Reform Major Program: China National Chronic Diseases and Nutrition Surveillance of Adults (2015–2017) and funded by the National Institute for Nutrition and Health, China CDC project: Research on Dietary and Nutritional Status of Chinese Elderly [No. 150052]. The study was also financed by investigation on frailty and risk factors of the elderly in the community and discussion on the path of nutrition improvement.
Institutional Review Board Statement
The study was conducted in accordance with the Declaration of Helsinki and approved by the Ethics Committee of Nation Institute for Nutrition and Health, Chinese Center for Disease Control and Prevention (protocol code: 201519-B; date of approval: June 2015).
Informed Consent Statement
Informed consent was obtained from all subjects involved in the study.
Data Availability Statement
The data are not allowed to be disclosed according to the National Institute for Nutrition and Health, Chinese Center for Disease Control and Prevention.
Acknowledgments
We thank all CDC staff who worked hard to complete China Nutrition and Health Surveillance (2015).
Conflicts of Interest
The authors have no potentially relevant conflict of interest to disclose.
References
- Liu, H.H.; Li, J.J. Aging and dyslipidemia: A review of potential mechanisms. Ageing Res. Rev. 2015, 19, 43–52. [Google Scholar] [CrossRef] [PubMed]
- Pan, L.; Yang, Z.; Wu, Y.; Yin, R.X.; Liao, Y.; Wang, J.; Gao, B.; Zhang, L. The prevalence, awareness, treatment and control of dyslipidemia among adults in China. Atherosclerosis 2016, 248, 2–9. [Google Scholar] [CrossRef] [PubMed]
- Zhang, M.; Deng, Q.; Wang, L.; Huang, Z.; Zhou, M.; Li, Y.; Zhao, Z.; Zhang, Y.; Wang, L. Prevalence of dyslipidemia and achievement of low-density lipoprotein cholesterol targets in Chinese adults: A nationally representative survey of 163,641 adults. Int. J. Cardiol. 2018, 260, 196–203. [Google Scholar] [CrossRef]
- Sarwar, N.; Danesh, J.; Eiriksdottir, G.; Sigurdsson, G.; Wareham, N.; Bingham, S.; Boekholdt, S.M.; Khaw, K.T.; Gudnason, V. Triglycerides and the risk of coronary heart disease: 10,158 incident cases among 262,525 participants in 29 Western prospective studies. Circulation 2007, 115, 450–458. [Google Scholar] [CrossRef] [PubMed]
- Lees, J.S.; Welsh, C.E.; Celis-Morales, C.A.; Mackay, D.; Lewsey, J.; Gray, S.R.; Lyall, D.M.; Cleland, J.G.; Gill, J.; Jhund, P.S.; et al. Glomerular filtration rate by differing measures, albuminuria and prediction of cardiovascular disease, mortality and end-stage kidney disease. Nat. Med. 2019, 25, 1753–1760. [Google Scholar] [CrossRef]
- Farzadfar, F.; Finucane, M.M.; Danaei, G.; Pelizzari, P.M.; Cowan, M.J.; Paciorek, C.J.; Singh, G.M.; Lin, J.K.; Stevens, G.A.; Riley, L.M.; et al. National, regional, and global trends in serum total cholesterol since 1980: Systematic analysis of health examination surveys and epidemiological studies with 321 country-years and 3·0 million participants. Lancet 2011, 377, 578–586. [Google Scholar] [CrossRef]
- GBD 2017 Risk Factor Collaborators. Global, regional, and national comparative risk assessment of 84 behavioural, environmental and occupational, and metabolic risks or clusters of risks for 195 countries and territories, 1990–2017: A systematic analysis for the Global Burden of Disease Study 2017. Lancet 2018, 392, 1923–1994. [Google Scholar]
- Yan, Y.; Bazzano, L.A.; Juonala, M.; Raitakari, O.T.; Viikari, J.; Prineas, R.; Dwyer, T.; Sinaiko, A.; Burns, T.L.; Daniels, S.R.; et al. Long-Term Burden of Increased Body Mass Index from Childhood on Adult Dyslipidemia: The i3C Consortium Study. J. Clin. Med. 2019, 8, 1725. [Google Scholar] [CrossRef]
- Stevens, W.; Peneva, D.; Li, J.Z.; Liu, L.Z.; Liu, G.; Gao, R.; Lakdawalla, D.N. Estimating the future burden of cardiovascular disease and the value of lipid and blood pressure control therapies in China. BMC Health Serv. Res. 2016, 16, 175. [Google Scholar] [CrossRef] [Green Version]
- Bloomgarden, Z.T. Insulin resistance, dyslipidemia, and cardiovascular disease. Diabetes Care. 2007, 30, 2164–2170. [Google Scholar] [CrossRef] [Green Version]
- Uzhova, I.; Fuster, V.; Fernández-Ortiz, A.; Ordovás, J.M.; Sanz, J.; Fernández-Friera, L.; López-Melgar, B.; Mendiguren, J.M.; Ibáñez, B.; Bueno, H.; et al. The Importance of Breakfast in Atherosclerosis Disease: Insights From the PESA Study. J. Am. Coll. Cardiol. 2017, 70, 1833–1842. [Google Scholar] [CrossRef] [PubMed]
- Steinberger, J.; Daniels, S.R.; Hagberg, N.; Isasi, C.R.; Kelly, A.S.; Lloyd-Jones, D.; Pate, R.R.; Pratt, C.; Shay, C.M.; Towbin, J.A.; et al. Cardiovascular Health Promotion in Children: Challenges and Opportunities for 2020 and Beyond: A Scientific Statement From the American Heart Association. Circulation 2016, 134, e236–e255. [Google Scholar] [CrossRef] [PubMed] [Green Version]
- Bray, G.A.; Wilson, J.F. In the clinic. Obesity. Ann. Intern. Med. 2008, 149, ITC4-1–ITC4-15; quiz ITC4-16. [Google Scholar]
- Li, T.; Zhang, Z.; Kolwicz, S.J.; Abell, L.; Roe, N.D.; Kim, M.; Zhou, B.; Cao, Y.; Ritterhoff, J.; Gu, H.; et al. Defective Branched-Chain Amino Acid Catabolism Disrupts Glucose Metabolism and Sensitizes the Heart to Ischemia-Reperfusion Injury. Cell Metab. 2017, 25, 374–385. [Google Scholar] [CrossRef] [Green Version]
- Hilt, Z.T.; Morrell, C.N. Essential Amino Acids-Essential in Arterial Thrombosis. Circulation. 2020, 142, 65–67. [Google Scholar] [CrossRef]
- Rahimi, M.H.; Shab-Bidar, S.; Mollahosseini, M.; Djafarian, K. Branched-chain amino acid supplementation and exercise-induced muscle damage in exercise recovery: A meta-analysis of randomized clinical trials. Nutrition 2017, 42, 30–36. [Google Scholar] [CrossRef]
- Bai, G.H.; Tsai, M.C.; Tsai, H.W.; Chang, C.C.; Hou, W.H. Effects of branched-chain amino acid-rich supplementation on EWGSOP2 criteria for sarcopenia in older adults: A systematic review and meta-analysis. Eur. J. Nutr. 2022, 61, 637–651. [Google Scholar] [CrossRef]
- Neinast, M.D.; Jang, C.; Hui, S.; Murashige, D.S.; Chu, Q.; Morscher, R.J.; Li, X.; Zhan, L.; White, E.; Anthony, T.G.; et al. Quantitative Analysis of the Whole-Body Metabolic Fate of Branched-Chain Amino Acids. Cell Metab. 2019, 29, 417–429. [Google Scholar] [CrossRef] [Green Version]
- Okekunle, A.P.; Wu, X.; Duan, W.; Feng, R.; Li, Y.; Sun, C. Dietary Intakes of Branched-Chained Amino Acid and Risk for Type 2 Diabetes in Adults: The Harbin Cohort Study on Diet, Nutrition and Chronic Non-Communicable Diseases Study. Can. J. Diabetes. 2018, 42, 484–492. [Google Scholar] [CrossRef]
- McCormack, S.E.; Shaham, O.; McCarthy, M.A.; Deik, A.A.; Wang, T.J.; Gerszten, R.E.; Clish, C.B.; Mootha, V.K.; Grinspoon, S.K.; Fleischman, A. Circulating branched-chain amino acid concentrations are associated with obesity and future insulin resistance in children and adolescents. Pediatr. Obes. 2013, 8, 52–61. [Google Scholar] [CrossRef] [Green Version]
- Le Couteur, D.G.; Solon-Biet, S.M.; Cogger, V.C.; Ribeiro, R.; de Cabo, R.; Raubenheimer, D.; Cooney, G.J.; Simpson, S.J. Branched chain amino acids, aging and age-related health. Ageing Res. Rev. 2020, 64, 101198. [Google Scholar] [CrossRef] [PubMed]
- Yang, R.; Dong, J.; Zhao, H.; Li, H.; Guo, H.; Wang, S.; Zhang, C.; Wang, S.; Wang, M.; Yu, S.; et al. Association of branched-chain amino acids with carotid intima-media thickness and coronary artery disease risk factors. PLoS ONE 2014, 9, e99598. [Google Scholar] [CrossRef] [PubMed] [Green Version]
- Yang, R.; Dong, J.; Guo, H.; Li, H.; Wang, S.; Zhao, H.; Zhou, W.; Yu, S.; Wang, M.; Chen, W. Rapid and precise measurement of serum branched-chain and aromatic amino acids by isotope dilution liquid chromatography tandem mass spectrometry. PLoS ONE 2013, 8, e81144. [Google Scholar]
- Kujala, U.M.; Peltonen, M.; Laine, M.K.; Kaprio, J.; Heinonen, O.J.; Sundvall, J.; Eriksson, J.G.; Jula, A.; Sarna, S.; Kainulainen, H. Branched-Chain Amino Acid Levels Are Related with Surrogates of Disturbed Lipid Metabolism among Older Men. Front. Med. 2016, 3, 57. [Google Scholar] [CrossRef] [PubMed]
- Yu, D.; Zhao, L.; Zhang, J.; Yang, Z.; Yang, L.; Huang, J.; Fang, H.; Guo, Q.; Xu, X.; Ju, L.; et al. China Nutrition and Health Surveys (1982−2017). China CDC Wkly. 2021, 3, 193–195. [Google Scholar] [CrossRef]
- JCfDCGoPaToDi, A. Guidelines for the Prevention and Treatment of Dyslipids in Chinese Adults (Revised 2016). Zhongguo Xun Huan Za Zhi 2016, 31, 937–953. [Google Scholar]
- Yang, Y. Institute for Nutrition and Food Safety of the Chinese Center for Disease Control and Prevention. In China Food Compositiontable 2018; Peking University Medical Press: Beijing, China, 2018. [Google Scholar]
- Yang, Y. Institute for Nutrition and Food Safety of the Chinese Center for Disease Control and Prevention. In China Food Compositiontable 2019; Peking University Medical Press: Beijing, China, 2019. [Google Scholar]
- McGarrah, R.W.; Zhang, G.F.; Christopher, B.A.; Deleye, Y.; Walejko, J.M.; Page, S.; Ilkayeva, O.; White, P.J.; Newgard, C.B. Dietary branched-chain amino acid restriction alters fuel selection and reduces triglyceride stores in hearts of Zucker fatty rats. Am. J. Physiol. Endocrinol. Metab. 2020, 318, E216–E223. [Google Scholar] [CrossRef]
- Wang, F.H.; Liu, J.; Deng, Q.J.; Qi, Y.; Wang, M.; Wang, Y.; Zhang, X.G.; Zhao, D. Association between plasma essential amino acids and atherogenic lipid profile in a Chinese population: A cross-sectional study. Atherosclerosis 2019, 286, 7–13. [Google Scholar] [CrossRef]
- Hamaya, R.; Mora, S.; Lawler, P.R.; Cook, N.R.; Ridker, P.M.; Buring, J.E.; Lee, I.M.; Manson, J.E.; Tobias, D.K. Association of Plasma Branched-Chain Amino Acid With Biomarkers of Inflammation and Lipid Metabolism in Women. Circ. Genom Precis Med. 2021, 14, e3330. [Google Scholar] [CrossRef]
- Yamakado, M.; Tanaka, T.; Nagao, K.; Ishizaka, Y.; Mitushima, T.; Tani, M.; Toda, A.; Toda, E.; Okada, M.; Miyano, H.; et al. Plasma amino acid profile is associated with visceral fat accumulation in obese Japanese subjects. Clin. Obes. 2012, 2, 29–40. [Google Scholar] [CrossRef]
- Green, C.R.; Wallace, M.; Divakaruni, A.S.; Phillips, S.A.; Murphy, A.N.; Ciaraldi, T.P.; Metallo, C.M. Branched-chain amino acid catabolism fuels adipocyte differentiation and lipogenesis. Nat. Chem. Biol. 2016, 12, 15–21. [Google Scholar] [CrossRef] [PubMed] [Green Version]
- Otto, L.; Budde, K.; Kastenmüller, G.; Kaul, A.; Völker, U.; Völzke, H.; Adamski, J.; Kühn, J.P.; Krumsiek, J.; Artati, A.; et al. Associations between adipose tissue volume and small molecules in plasma and urine among asymptomatic subjects from the general population. Sci Rep. 2020, 10, 1487. [Google Scholar] [CrossRef] [PubMed] [Green Version]
- Sajuthi, S.P.; Sharma, N.K.; Comeau, M.E.; Chou, J.W.; Bowden, D.W.; Freedman, B.I.; Langefeld, C.D.; Parks, J.S.; Das, S.K. Genetic regulation of adipose tissue transcript expression is involved in modulating serum triglyceride and HDL-cholesterol. Gene 2017, 632, 50–58. [Google Scholar] [CrossRef] [PubMed]
- Cheng, S.; Rhee, E.P.; Larson, M.G.; Lewis, G.D.; McCabe, E.L.; Shen, D.; Palma, M.J.; Roberts, L.D.; Dejam, A.; Souza, A.L.; et al. Metabolite profiling identifies pathways associated with metabolic risk in humans. Circulation 2012, 125, 2222–2231. [Google Scholar] [CrossRef] [PubMed] [Green Version]
- National Cholesterol Education Program (NCEP) Expert Panel. Third Report of the National Cholesterol Education Program (NCEP) Expert Panel on Detection, Evaluation, and Treatment of High Blood Cholesterol in Adults (Adult Treatment Panel III) final report. Circulation 2002, 106, 3143–3421. [Google Scholar] [CrossRef]
- Kim, H.K.; Kim, C.H.; Kim, E.H.; Bae, S.J.; Choe, J.; Park, J.Y.; Park, S.W.; Yun, Y.D.; Baek, S.J.; Mok, Y.; et al. Impaired fasting glucose and risk of cardiovascular disease in Korean men and women: The Korean Heart Study. Diabetes Care 2013, 36, 328–335. [Google Scholar] [CrossRef] [Green Version]
- Verbeek, R.; Hoogeveen, R.M.; Langsted, A.; Stiekema, L.; Verweij, S.L.; Hovingh, G.K.; Wareham, N.J.; Khaw, K.T.; Boekholdt, S.M.; Nordestgaard, B.G.; et al. Cardiovascular disease risk associated with elevated lipoprotein(a) attenuates at low low-density lipoprotein cholesterol levels in a primary prevention setting. Eur. Heart J. 2018, 39, 2589–2596. [Google Scholar] [CrossRef]
- Bhattacharya, S.; Granger, C.B.; Craig, D.; Haynes, C.; Bain, J.; Stevens, R.D.; Hauser, E.R.; Newgard, C.B.; Kraus, W.E.; Newby, L.K.; et al. Validation of the association between a branched chain amino acid metabolite profile and extremes of coronary artery disease in patients referred for cardiac catheterization. Atherosclerosis 2014, 232, 191–196. [Google Scholar] [CrossRef] [Green Version]
- Ma, Y.; Sun, Y.; Sun, L.; Liu, X.; Zeng, R.; Lin, X.; Li, Y. Effects of gut microbiota and fatty acid metabolism on dyslipidemia following weight-loss diets in women: Results from a randomized controlled trial. Clin. Nutr. 2021, 40, 5511–5520. [Google Scholar] [CrossRef]
- Mente, A.; Dehghan, M.; Rangarajan, S.; McQueen, M.; Dagenais, G.; Wielgosz, A.; Lear, S.; Li, W.; Chen, H.; Yi, S.; et al. Association of dietary nutrients with blood lipids and blood pressure in 18 countries: A cross-sectional analysis from the PURE study. Lancet Diabetes Endocrinol. 2017, 5, 774–787. [Google Scholar] [CrossRef] [Green Version]
- Kuwabara, M.; Kuwabara, R.; Niwa, K.; Hisatome, I.; Smits, G.; Roncal-Jimenez, C.A.; MacLean, P.S.; Yracheta, J.M.; Ohno, M.; Lanaspa, M.A.; et al. Different Risk for Hypertension, Diabetes, Dyslipidemia, and Hyperuricemia According to Level of Body Mass Index in Japanese and American Subjects. Nutrients 2018, 10, 1011. [Google Scholar] [CrossRef] [PubMed] [Green Version]
- Van Hemelrijck, M.; Ulmer, H.; Nagel, G.; Peter, R.S.; Fritz, J.; Myte, R.; van Guelpen, B.; Föger, B.; Concin, H.; Häggström, C.; et al. Longitudinal study of body mass index, dyslipidemia, hyperglycemia, and hypertension in 60,000 men and women in Sweden and Austria. PLoS ONE 2018, 13, e197830. [Google Scholar] [CrossRef] [PubMed] [Green Version]
Figure 1.
Venn diagram of sample distribution of four types of dyslipidemia subjects.

Figure 2.
Radar plot of FPG and blood lipids in case group and control group.

Figure 3.
Distribution of dietary BCAAs consumption of different genders in case and control groups.
Figure 3.
Distribution of dietary BCAAs consumption of different genders in case and control groups.

Figure 4.
Representation of restricted cubic spline logistic regression models for dietary BCAAs and risk of Hypercholesteremia. Red Solid line, OR as a function of dietary BCAAs adjusted for age, sex and BMI, region, current smoking status, current alcohol consumption, metabolic equivalents (MET-h/day), carbohydrate intake, protein intake, fat intake and educational level; dashed lines, 95% CIs.

Figure 5.
Representation of restricted cubic spline logistic regression models for three dietary BCAAs (Ile, Leu and Val) and risk of Hypercholesteremia. Red Solid line, OR as a function of specific BCAA adjusted for age, sex and BMI, region, current smoking status, current alcohol consumption, metabolic equivalents (MET-h/d), carbohydrate intake, protein intake, fat intake and educational level; dashed lines, 95% CIs. (A) RCS logistic regression models for dietary Ile and ORs of hypercholesterolemia. (B) RCS logistic regression models for dietary Leu and ORs of hypercholesterolemia. (C) RCS logistic regression models for dietary Val and ORs of hypercholesterolemia.

Figure 6.
Representation of restricted cubic spline logistic regression models for dietary BCAAs and risk of Hyper-LDL-cholesterolemia. Red Solid line, OR as a function of dietary BCAAs adjusted for age, sex and BMI, region, current smoking status, current alcohol consumption, metabolic equivalents (MET-h/d), carbohydrate intake, protein intake, fat intake and educational level; dashed lines, 95% CIs.


Table 1.
Demographic and clinical characteristics of dyslipidemia and control groups.
| Hypercholesteremia (n = 2539) | Hypertriglyceridemia (n = 4523) | Hypo-HDL-Cholesterolemia (n = 5461) | Hyper-LDL-Cholesterolemia (n = 2700) | Dyslipidemia (n = 9792) | Normolipemic (n = 9541) | p Value | |
|---|---|---|---|---|---|---|---|
| Dyslipidemia vs. Normolipemic | |||||||
| Age (years) | 55.51 (11.78) | 51.61 (11.69) | 51.01 (12.56) | 55.24 (11.89) | 52.45 (12.35) | 52.69 (12.14) | 0.181 |
| Male, n (%) | 1239 (48.8) | 2700 (59.69) | 3314 (60.68) | 1352 (50.07) | 5522 (56.39) | 5284 (55.38) | 0.157 |
| BMI (kg/m2) | 24.36 (22.87) | 25.16 (29.53) | 24.97 (26.93) | 24.64 (22.18) | 24.73 (25.96) | 24.6 (12.04) | 0.646 |
| Fasting plasma glucose (mmol/L) | 5.8 (1.98) | 5.83 (2.04) | 5.53 (1.67) | 5.71 (1.83) | 5.59 (1.73) | 5.3 (1.19) | <0.001 |
| Serum uric acid (μmol/L) | 334.31 (95.36) | 349.84 (95.59) | 329.71 (91.61) | 335.51 (93.13) | 330.86 (92.72) | 303.15 (81.01) | <0.001 |
| Total cholesterol (mmol/L) | 6.7 (3.43) | 5.34 (2.7) | 4.5 (1.07) | 6.52 (0.8) | 5.17 (2.12) | 4.66 (0.69) | <0.001 |
| Triglyceride (mmol/L) | 2.84 (3.85) | 3.89 (3.05) | 2.71 (2.93) | 2.05 (1.27) | 2.53 (2.45) | 1.12 (0.46) | <0.001 |
| HDL cholesterol (mmol/L) | 1.4 (0.43) | 1.03 (0.28) | 0.87 (0.14) | 1.34 (0.38) | 1.09 (0.36) | 1.38 (0.28) | <0.001 |
| LDL cholesterol (mmol/L) | 4.34 (1.03) | 3.32 (0.91) | 2.85 (0.82) | 4.6 (0.63) | 3.35 (1.03) | 2.84 (0.63) | <0.001 |
| Systolic pressure (mmHg) | 140.11 (31.36) | 139.29 (35.98) | 134.3 (28.32) | 139.51 (30.84) | 136.81 (31.79) | 135.15 (30.21) | <0.001 |
| Diastolic pressure (mmHg) | 83.27 (26.78) | 84.87 (33.84) | 81.21 (24.31) | 82.8 (26.19) | 82.38 (28.29) | 80.69 (26.42) | <0.001 |
| Current smoker, n (%) | 719 (28.32) | 1530 (33.83) | 1805 (33.05) | 789 (29.22) | 3071 (31.36) | 2818 (29.54) | 0.006 |
| Current drinker, n (%) | 349 (13.75) | 680 (15.03) | 662 (12.12) | 355 (13.15) | 1268 (12.95) | 1117 (11.71) | 0.009 |
| Educational level | |||||||
| None or elementary school | 1254 (49.39) | 1891 (41.81) | 2162 (39.59) | 1360 (50.37) | 4300 (43.91) | 4630 (48.53) | <0.001 |
| Middle school | 747 (29.42) | 1578 (34.89) | 1936 (35.45) | 825 (30.56) | 3282 (33.52) | 3102 (32.51) | |
| High school | 356 (14.02) | 655 (14.48) | 822 (15.05) | 358 (13.26) | 1394 (14.24) | 1206 (12.64) | |
| College | 182 (7.17) | 399 (8.82) | 541 (9.91) | 157 (5.81) | 816 (8.33) | 603 (6.32) | |
| Energy intake (kcal/day) | 1764.41 (614.1) | 1822.73 (636) | 1808.29 (612.29) | 1757.15 (611.38) | 1798.21 (621.87) | 1822.79 (630.62) | 0.006 |
| Carbohydrate intake (g/day) | 220.68 (88.74) | 233.96 (94.11) | 241.04 (98.02) | 221.8 (89.11) | 233.85 (95.25) | 235.05 (96.56) | 0.387 |
| Protein intake (g/day) | 55.59 (24.44) | 56.36 (24.75) | 56.12 (24.21) | 55.65 (24.58) | 55.77 (24.43) | 54.71 (23.5) | 0.002 |
| Fat intake (g/day) | 74.36 (40.24) | 74.83 (40.89) | 72.07 (38.74) | 73.92 (40) | 73.3 (39.74) | 75.58 (40.77) | <0.001 |
| MET-h/d | 22.61 (17.97) | 22.07 (16.96) | 21.42 (16.74) | 22.71 (17.70) | 21.95 (17.24) | 23.62 (19.09) | <0.001 |
| BCAAs intake (g/day) | 10.83 (5.23) | 10.8 (5.21) | 10.74 (5.17) | 10.76 (5.13) | 10.73 (5.19) | 10.57 (5.15) | 0.029 |
| Ile intake (g/day) | 2.72 (1.31) | 2.71 (1.31) | 2.69 (1.29) | 2.70 (1.29) | 2.69 (1.30) | 2.65 (1.31) | 0.0700 |
| Leu intake (g/day) | 4.89 (2.40) | 4.88 (2.40) | 4.87 (2.38) | 4.86 (2.34) | 4.86 (2.39) | 4.79 (2.39) | 0.0706 |
| Val intake (g/day) | 3.22 (1.53) | 3.20 (1.52) | 3.19 (1.52) | 3.20 (1.50) | 3.18 (1.52) | 3.15 (1.53) | 0.0836 |
Data are given as the mean (SD) or n (%).
Table 2.
Blood lipids according to BCAAs consumption levels and Dyslipidemia status (mean values and standard deviations).
Table 2.
Blood lipids according to BCAAs consumption levels and Dyslipidemia status (mean values and standard deviations).
| Quartile of Dietary BCAAs Intake (g/Day) | |||||
|---|---|---|---|---|---|
| Q1 (Referent), <7.03 | Q2, 7.03 to <9.64 | Q3, 9.64 to <13.09 | Q4, ≥13.09 | p for Trend | |
| Total | |||||
| n (%) | 4833 (25.0) | 4833 (25.0) | 4833 (25.0) | 4834 (25.0) | |
| Total cholesterol (mmol/L) | 4.86 (1.05) | 4.93 (2.62) | 4.93 (1.09) | 4.95 (1.06) | <0.0001 |
| Triglyceride (mmol/L) | 1.78 (1.6) | 1.82 (1.9) | 1.86 (2.15) | 1.88 (1.93) | 0.265 |
| HDL cholesterol (mmol/L) | 1.24 (0.34) | 1.23 (0.35) | 1.23 (0.36) | 1.22 (0.36) | <0.0001 |
| LDL cholesterol (mmol/L) | 3.05 (0.87) | 3.08 (0.89) | 3.10 (0.91) | 3.15 (0.9) | <0.0001 |
| Dyslipidemia Group | |||||
| n (%) | 2403 (24.54) | 2431 (24.83) | 2445 (24.97) | 2513 (25.66) | |
| Total cholesterol (mmol/L) | 5.09 (1.28) | 5.22 (3.61) | 5.17 (1.32) | 5.19 (1.26) | 0.0007 |
| Triglyceride (mmol/L) | 2.43 (2.03) | 2.5 (2.46) | 2.59 (2.8) | 2.6 (2.43) | 0.9536 |
| HDL cholesterol (mmol/L) | 1.10 (0.35) | 1.10 (0.36) | 1.08 (0.35) | 1.09 (0.37) | 0.0014 |
| LDL cholesterol (mmol/L) | 3.31 (1.01) | 3.34 (1.03) | 3.34 (1.06) | 3.39 (1.02) | <0.0001 |
| Control Group | |||||
| n (%) | 2430 (25.47) | 2402 (25.18) | 2388 (25.03) | 2321 (24.33) | |
| Total cholesterol (mmol/L) | 4.63 (0.69) | 4.65 (0.69) | 4.68 (0.7) | 4.69 (0.69) | <0.0001 |
| Triglyceride (mmol/L) | 1.14 (0.45) | 1.13 (0.46) | 1.11 (0.46) | 1.11 (0.46) | 0.0029 |
| HDL cholesterol (mmol/L) | 1.37 (0.27) | 1.37 (0.28) | 1.39 (0.3) | 1.37 (0.29) | <0.0001 |
| LDL cholesterol (mmol/L) | 2.80 (0.62) | 2.83 (0.62) | 2.85 (0.63) | 2.88 (0.64) | 0.0026 |
Data are given as the mean and SD for continuous variables.
Table 3.
ORs (95% CI) of four dyslipidemia types, by quartiles of dietary BCAAs consumption.
| Quartile of Dietary BCAAs Consumption (g/Day) | p for Trend | ||||
|---|---|---|---|---|---|
| Q1 (Referent), <7.03 | Q2, 7.03 to <9.64 | Q3, 9.64 to <13.09 | Q4, ≥13.09 | ||
| Hypercholesteremia vs. Control group | |||||
| Case/control subjects, n | 593/2430 | 623/2402 | 663/2388 | 660/2321 | |
| Crude OR (95% CI) | 1 | 1.06 (0.94, 1.20) | 1.14 (1.01, 1.29) | 1.17 (1.03, 1.33) | 0.0565 |
| Adjusted OR * (95% CI) | 1 | 1.14 (1.01, 1.30) | 1.28 (1.13, 1.45) | 1.39 (1.22, 1.59) | <0.0001 |
| Adjusted OR † (95% CI) | 1 | 1.15 (1.00, 1.32) | 1.25 (1.08, 1.46) | 1.29 (1.05, 1.58) | 0.034 |
| Hypertriglyceridemia vs. Control group | |||||
| Case/control subjects, n | 1097/2430 | 1107/2402 | 1128/2388 | 1191/2321 | |
| Crude OR (95% CI) | 1 | 1.02 (0.92, 1.13) | 1.05 (0.95, 1.16) | 1.14 (1.03, 1.26) | 0.0646 |
| Adjusted OR * (95% CI) | 1 | 0.99 (0.89, 1.10) | 0.99 (0.889, 1.09) | 1.02 (0.92, 1.14) | 0.8894 |
| Adjusted OR † (95% CI) | 1 | 0.95 (0.85, 1.05) | 0.92 (0.81, 1.04) | 0.90 (0.76, 1.06) | 0.5309 |
| Hypo-HDL-cholesterolemia vs. Control group | |||||
| Case/control subjects, n | 1331/2430 | 1351/2402 | 1369/2388 | 1410/2321 | |
| Crude OR (95% CI) | 1 | 1.02 (0.93, 1.12) | 1.05 (0.95, 1.15) | 1.11 (1.01, 1.22) | 0.1528 |
| Adjusted OR * (95% CI) | 1 | 0.98 (0.89, 1.08) | 0.97 (0.88, 1.06) | 0.97 (0.88, 1.07) | 0.9034 |
| Adjusted OR † (95% CI) | 1 | 0.93 (0.84, 1.02) | 0.89 (0.79, 1.00) | 0.87 (0.74, 1.01) | 0.2402 |
| Hyper-LDL-cholesterolemia vs. Control group | |||||
| Case/control subjects, n | 633/2430 | 677/2402 | 698/2388 | 692/2321 | |
| Crude OR (95% CI) | 1 | 1.09 (0.96, 1.23) | 1.13 (1.00, 1.28) | 1.15 (1.02, 1.30) | 0.1145 |
| Adjusted OR * (95% CI) | 1 | 1.16 (1.02, 1.31) | 1.24 (1.09, 1.40) | 1.33 (1.17, 1.51) | 0.0001 |
| Adjusted OR † (95% CI) | 1 | 1.15 (1.01, 1.31) | 1.20 (1.03, 1.39) | 1.18 (0.97, 1.45) | 0.1013 |
| Dyslipidemia vs. Control group | |||||
| Case/control subjects, n | 2403/2430 | 2431/2402 | 2445/2388 | 2513/2321 | |
| Crude OR (95% CI) | 1 | 1.02 (0.94, 1.11) | 1.04 (0.957, 1.12) | 1.10 (1.01, 1.19) | 0.1388 |
| Adjusted OR * (95% CI) | 1 | 1.02 (0.94, 1.10) | 1.02 (0.939, 1.10) | 1.06 (0.98, 1.16) | 0.4982 |
| Adjusted OR † (95% CI) | 1 | 0.98 (0.90, 1.06) | 0.96 (0.87, 1.06) | 0.95 (0.828, 1.08) | 0.8417 |
* Model 1, adjusted for age, sex and BMI. † Model 2, adjusted for Model 1, region, current smoking status, current alcohol consumption, metabolic equivalents (MET-h/d), carbohydrate intake, protein intake, fat intake, physical activity and educational level.
Table 4.
Stratified analyses of Hypercholesteremia risk and dietary BCAAs consumption.
| Quartile of Dietary BCAAs Consumption (g/Day) | p Value for Interaction | ||||
|---|---|---|---|---|---|
| Q1 (Referent), <7.03 | Q2, 7.03 to <9.64 | Q3, 9.64 to <13.09 | Q4, ≥13.09 | ||
| Sex | 0.8826 | ||||
| Male (6523) | 1 | 1.17 (0.95, 1.42) | 1.29 (1.06, 1.56) | 1.35 (1.12, 1.63) | |
| Female (5557) | 1 | 1.14 (0.96, 1.35) | 1.29 (1.08, 1.53) | 1.46 (1.21, 1.76) | |
| Age, years | 0.0047 | ||||
| <55 (6845) | 1 | 1.24 (1.02, 1.51) | 1.50 (1.25, 1.82) | 1.64 (1.36, 1.98) | |
| ≥55 (5235) | 1 | 1.10 (0.93, 1.30) | 1.11 (0.93, 1.32) | 1.18 (0.98, 1.42) | |
| BMI, kg/m2 | 0.0739 | ||||
| <24 (5215) | 1 | 1.33 (1.10, 1.61) | 1.43 (1.18, 1.74) | 1.47 (1.20, 1.81) | |
| ≥24 (6865) | 1 | 1.03 (0.87, 1.22) | 1.20 (1.02, 1.42) | 1.34 (1.13, 1.58) | |
| Current smoking | 0.7721 | ||||
| Yes (3537) | 1 | 1.23 (0.95, 1.59) | 1.21 (0.94, 1.57) | 1.328 (1.04, 1.70) | |
| No (8543) | 1 | 1.12 (0.97, 1.30) | 1.32 (1.14, 1.53) | 1.43 (1.22, 1.67) | |
| Current drinking | 0.4331 | ||||
| Yes (1466) | 1 | 0.89 (0.60, 1.32) | 1.16 (0.80, 1.67) | 1.17 (0.82, 1.66) | |
| No (10,614) | 1 | 1.18 (1.03, 1.35) | 1.29 (1.13, 1.48) | 1.41 (1.23, 1.63) | |
| METs-h/day | 0.3213 | ||||
| <22.77 (7439) | 1 | 1.06 (0.90, 1.24) | 1.10 (0.94, 1.29) | 1.28 (1.09, 1.51) | |
| ≥22.77 (4641) | 1 | 1.35 (1.09, 1.69) | 1.71 (1.37, 2.12) | 1.67 (1.34, 2.08) | |
| Region | 0.4076 | ||||
| urban | 1 | 1.06 (0.86, 1.31) | 1.32 (1.08, 1.62) | 1.44 (1.17, 1.77) | |
| rural | 1 | 1.20 (1.02, 1.41) | 1.24 (1.06, 1.47) | 1.36 (1.15, 1.61) | |
| Energy intake (kcal/day) | 0.2401 | ||||
| <2200 (9325) | 1 | 1.15 (1.01, 1.32) | 1.34 (1.17, 1.54) | 1.47 (1.26, 1.73) | |
| ≥2200 (2755) | 1 | 1.22 (0.62, 2.39) | 1.34 (0.72, 2.48) | 1.62 (0.89, 2.96) | |
Data are OR (95% CI). The multivariate model was adjusted for age, sex and BMI.
Table 5.
Dietary sources of dietary BCAAs in dyslipidemia and normolipemic groups.
| Normolipemic (n = 9541) | Dyslipidemia (n = 9792) | Total (n = 19,333) | |
|---|---|---|---|
| Cereals (g/day) | 3.88 (2.25) | 3.82 (2.23) | 3.85 (2.24) |
| Beans (g/day) | 0.78 (1.36) | 0.75 (1.28) | 0.77 (1.32) |
| Vegetables (g/day) | 0.93 (1.13) | 0.97 (1.15) | 0.95 (1.14) |
| Fruits (g/day) | 0.04 (0.26) | 0.04 (0.25) | 0.04 (0.26) |
| Nuts (g/day) | 0.12 (0.44) | 0.12 (0.46) | 0.12 (0.45) |
| Red meat (g/day) | 1.82 (2.09) | 1.92 (2.20) | 1.87 (2.14) |
| Poultry (g/day) | 0.43 (1.08) | 0.45 (1.12) | 0.44 (1.10) |
| Dairy products (g/day) | 0.13 (0.62) | 0.12 (0.51) | 0.12 (0.56) |
| Eggs (g/day) | 0.55 (0.76) | 0.57 (0.76) | 0.56 (0.76) |
| Fish and seafoods (g/day) | 0.85 (1.85) | 0.98 (1.98) | 0.92 (1.92) |
| Snacks (g/day) | 0.24 (1.25) | 0.2 (1.06) | 0.22 (1.16) |
| Beverage (g/day) | 0.18 (1.64) | 0.18 (1.58) | 0.18 (1.61) |
| Condiments (g/day) | 0.13 (0.36) | 0.14 (0.50) | 0.13 (0.43) |
| Others (g/day) | 0.47 (1.18) | 0.47 (1.14) | 0.47 (1.16) |
Publisher’s Note: MDPI stays neutral with regard to jurisdictional claims in published maps and institutional affiliations. |
© 2022 by the authors. Licensee MDPI, Basel, Switzerland. This article is an open access article distributed under the terms and conditions of the Creative Commons Attribution (CC BY) license (https://creativecommons.org/licenses/by/4.0/).
Share and Cite
MDPI and ACS Style
Yu, L.; Zhu, Q.; Li, Y.; Song, P.; Zhang, J. Dietary Branched-Chain Amino Acids (BCAAs) and Risk of Dyslipidemia in a Chinese Population. Nutrients 2022, 14, 1824. https://0-doi-org.brum.beds.ac.uk/10.3390/nu14091824
AMA Style
Yu L, Zhu Q, Li Y, Song P, Zhang J. Dietary Branched-Chain Amino Acids (BCAAs) and Risk of Dyslipidemia in a Chinese Population. Nutrients. 2022; 14(9):1824. https://0-doi-org.brum.beds.ac.uk/10.3390/nu14091824
Chicago/Turabian StyleYu, Lianlong, Qianrang Zhu, Yuqian Li, Pengkun Song, and Jian Zhang. 2022. "Dietary Branched-Chain Amino Acids (BCAAs) and Risk of Dyslipidemia in a Chinese Population" Nutrients 14, no. 9: 1824. https://0-doi-org.brum.beds.ac.uk/10.3390/nu14091824
Note that from the first issue of 2016, this journal uses article numbers instead of page numbers. See further details here.