
Differences between Four Skinfold Calipers in the Assessment of Adipose Tissue in Young Adult Healthy Population

 ,
,  ,
,  , and
, and
Abstract
:1. Introduction
2. Materials and Methods
2.1. Study Design and Participants
2.2. Procedures
2.3. Statistical Analysis
3. Results
4. Discussion
5. Conclusions
Author Contributions
Funding
Institutional Review Board Statement
Informed Consent Statement
Data Availability Statement
Acknowledgments
Conflicts of Interest
References
- Silva, M.-R.G.; Silva, H.-H.; Capkauskiene, S.; Rosado-Marques, V.; Machado-Rodrigues, A.M.; Nogueira, H.; Padez, C. Cardiovascular and metabolic risk factors in physically active and inactive Portuguese middle-aged adults: A cross-sectional study. Sci. Sports 2020, 35, 91–98. [Google Scholar] [CrossRef]
- Group, D.P.C. Weight-height relationships and body mass index: Some observations from the Diverse Populations Collaboration. Am. J. Phys. Anthropol. 2005, 128, 220–229. [Google Scholar] [CrossRef]
- Madden, A.M.; Smith, S. Body composition and morphological assessment of nutritional status in adults: A review of anthropometric variables. J. Hum. Nutr. Diet. 2016, 29, 7–25. [Google Scholar] [CrossRef] [PubMed]
- Kasper, A.M.; Langan-Evans, C.; Hudson, J.F.; Brownlee, T.E.; Harper, L.D.; Naughton, R.J.; Morton, J.P.; Close, G.L. Come Back Skinfolds, All Is Forgiven: A Narrative Review of the Efficacy of Common Body Composition Methods in Applied Sports Practice. Nutrients 2021, 13, 1075. [Google Scholar] [CrossRef]
- Campa, F.; Toselli, S.; Mazzilli, M.; Gobbo, L.A.; Coratella, G. Assessment of Body Composition in Athletes: A Narrative Review of Available Methods with Special Reference to Quantitative and Qualitative Bioimpedance Analysis. Nutrients 2021, 13, 1620. [Google Scholar] [CrossRef]
- Wang, Z.M.; Pierson, R.N.; Heymsfield, S.B. The five-level model: A new approach to organizing body-composition research. Am. J. Clin. Nutr. 1992, 56, 19–28. [Google Scholar] [CrossRef]
- Silva, A.M. Structural and functional body components in athletic health and performance phenotypes. Eur. J. Clin. Nutr. 2019, 73, 215–224. [Google Scholar] [CrossRef]
- Heymsfield, S.B.; Wang, Z.; Baumgartner, R.N.; Ross, R. Human Body Composition: Advances in Models and Methods. Annu. Rev. Nutr. 1997, 17, 527–558. [Google Scholar] [CrossRef]
- Ellis, K.J. Human Body Composition: In Vivo Methods. Physiol. Rev. 2000, 80, 649–680. [Google Scholar] [CrossRef] [Green Version]
- Amaral, T.F.; Restivo, M.T.; Guerra, R.S.; Marques, E.; Chousal, M.F.; Mota, J. Accuracy of a digital skinfold system for measuring skinfold thickness and estimating body fat. Br. J. Nutr. 2011, 105, 478–484. [Google Scholar] [CrossRef]
- Fernandes Filho, J.; Caniuqueo Vargas, A.; Duarte Rocha, C.C.; Hernández Mosqueira, C.; Roquetti Fernandes, P.; Fernandes da Silva, S.; Ramirez-Campillo, R.; Quiroz Sievers, G. Evaluation and comparison of five skinfold calipers. Nutr. Hosp. 2017, 34, 111–115. [Google Scholar] [CrossRef]
- Vaquero-Cristóbal, R.; Albaladejo-Saura, M.; Luna-Badachi, A.E.; Esparza-Ros, F. Differences in Fat Mass Estimation Formulas in Physically Active Adult Population and Relationship with Sums of Skinfolds. Int. J. Environ. Res. Public Health 2020, 17, 7777. [Google Scholar] [CrossRef]
- Hastuti, J.; Kagawa, M.; Byrne, N.M.; Hills, A.P. Development and validation of anthropometric prediction equations for estimation of body fat in Indonesian men. Asia Pac. J. Clin. Nutr. 2013, 22, 522–529. [Google Scholar]
- Durnin, J.V.G.A.; Womersley, J. Body fat assessed from total body density and its estimation from skinfold thickness: Measurements on 481 men and women aged from 16 to 72 Years. Br. J. Nutr. 1974, 32, 77–97. [Google Scholar] [CrossRef] [Green Version]
- Martin, A.D.; Ross, W.D.; Drinkwater, D.T.; Clarys, J.P. Prediction of body fat by skinfold caliper: Assumptions and cadaver evidence. Int. J. Obes. 1985, 9 (Suppl. 1), 31–39. [Google Scholar]
- Thorland, W.G.; Johnson, G.O.; Tharp, G.D.; Housh, T.J.; Cisar, C.J. Estimation of body density in adolescent athletes. Hum. Biol. 1984, 56, 439–448. [Google Scholar]
- Ross, W.D.; Kerr, D.A. Fraccionamiento de la masa corporal: Un nuevo método para utilizar en nutrición clínica y medicina deportiva. Apunts. Med. Esport. 1991, 18, 175–187. [Google Scholar]
- Wang, Z.; Pi-Sunyer, F.X.; Kotler, D.P.; Wielopolski, L.; Withers, R.T.; Pierson, R.N.; Heymsfield, S.B. Multicomponent methods: Evaluation of new and traditional soft tissue mineral models by in vivo neutron activation analysis. Am. J. Clin. Nutr. 2002, 76, 968–974. [Google Scholar] [CrossRef] [Green Version]
- Esparza-Ros, F.; Vaquero-Cristóbal, R.; Marfell-Jones, M. International Standards for Anthropometric Assessment; International Society for Advancement in Kinanthropometry: Murcia, Spain, 2019. [Google Scholar]
- Silva, V.S.; Vieira, M.F.S. International Society for the Advancement of Kinanthropometry (ISAK) Global: International accreditation scheme of the competent anthropometrist. Rev. Bras. Cineantropometria Desempenho Hum. 2020, 22, e70517. [Google Scholar] [CrossRef]
- Cyrino, E.S.; Okano, A.H.; Glaner, M.F.; Romanzini, M.; Gobbo, L.A.; Makoski, A.; Bruna, N.; de Melo, J.C.; Tassi, G.N. Impact of the use of different skinfold calipers for the analysis of the body composition. Rev. Bras. Med. Esporte 2003, 9, 150–153. [Google Scholar] [CrossRef] [Green Version]
- Norton, K.; Olds, K. Anthropometrica: A Textbook of Body Measurement for Sports and Health Courses; UNSW Press: Sydney, Australia, 1996; p. 413. [Google Scholar]
- Edwards, D.A.; Hammond, W.H.; Healy, M.J.; Tanner, J.M.; Whitehouse, R.H. Design and Accuracy of Calipers for Measuring Subcutaneous Tissue Thickness. Br. J. Nutr. 1955, 9, 133–143. [Google Scholar] [CrossRef] [Green Version]
- Behnke, A.R.; Wilmore, J.H. Evaluation and Regulation of Body Duild and Composition; Prentice Hall: Hoboken, NJ, USA, 1984. [Google Scholar]
- Schmidt, P.K.; Carter, J.E. Static and dynamic differences among five types of skinfold calipers. Hum. Biol. 1990, 62, 369–388. [Google Scholar]
- Jaworski, M.; Kułaga, Z.; Płudowski, P.; Grajda, A.; Gurzkowska, B.; Napieralska, E.; Swiąder, A.; Pan, H.; Litwin, M.; Olaf Study Group. Population-based centile curves for triceps, subscapular, and abdominal skinfold thicknesses in Polish children and adolescents—the OLAF study. Eur. J. Pediatr. 2012, 171, 1215–1221. [Google Scholar] [CrossRef] [Green Version]
- Boughman, J.K.; Masters, M.A.; Morgan, C.A.; Ruden, T.M.; Rochelle, S.G. Assessing the Validity of Bioelectrical Impedance and Skinfold Calipers for Measuring Body Composition in NOLS Backcountry Hikers. Wilderness Environ. Med. 2019, 30, 369–377. [Google Scholar] [CrossRef]
- Guedes, D.P.; Guedes, J.E. Proposed equations for predicting the amount of body fat in young adults. Semina 1991, 12, 61–70. [Google Scholar]
- Talbert, E.E.; Flynn, M.G.; Bell, J.W.; Carrillo, A.E.; Dill, M.D.; Christensen, C.N.; Thompson, C.M. Comparison of Body Composition Measurements Using a New Caliper, Two Established Calipers, Hydrostatic Weighing, and BodPod. Int. J. Exerc. Sci. 2009, 2, 19–27. [Google Scholar]
- Beam, J.R.; Szymanski, D.J. Validity of 2 Skinfold Calipers in Estimating Percent Body Fat of College-Aged Men and Women. J. Strength Cond. Res. 2010, 24, 3448–3456. [Google Scholar] [CrossRef] [PubMed]
- Bini, A.; Amaral, T.F.; Oliveira, B.M.P.M.; Ramos-Carvalho, P.; Teixeira, V.H. Skinfolds compressibility and calliper’s time response in male athletes. Progr. Nutr. 2018, 20, 273–278. [Google Scholar]
- Quintas, M.R.; Andrade, T.F.; Restivo, M.T.; Chouzal, M.F.; Amaral, T.F. LipoWise: A new generation of skinfold calipers. Sens. Transducers 2015, 185, 162–169. [Google Scholar]
- Martin, A.D.; Drinkwater, D.T.; Clarys, J.P.; Daniel, M.; Ross, W.D. Effects of skin thickness and skinfold compressibility on skinfold thickness measurement. Am. J. Hum. Biol. 1992, 4, 453–460. [Google Scholar] [CrossRef] [PubMed]
- Clarys, J.P.; Provyn, S.; Marfell-Jones, M.J. Cadaver studies and their impact on the understanding of human adiposity. Ergonomics 2005, 48, 1445–1461. [Google Scholar] [CrossRef]
- Clarys, J.P.; Martin, A.D.; Drinkwater, D.T.; Marfell-Jones, M.J. The skinfold: Myth and reality. J. Sports Sci. 1987, 5, 3–33. [Google Scholar] [CrossRef]
- Araújo, D.; Teixeira, V.H.; Carvalho, P.; Amaral, T.F. Exercise induced dehydration status and skinfold compressibility in athletes: An intervention study. Asia Pac. J. Clin. Nutr. 2018, 27, 189–194. [Google Scholar]
- Soylu, M.; Şensoy, N.; Doğan, I.; Doğan, N.; Mazıcıoğlu, M.M.; Öztürk, A. Four-site skinfolds thickness percentiles of schoolchildren and adolescents in Turkey. Public Health Nutr. 2021, 24, 5414–5425. [Google Scholar] [CrossRef]
- Torun, S.; Mutluay, Ş. Applicability of calf subcutaneous tissue to subcutaneous injection in young adults. Appl. Nurs. Res. 2017, 34, 66–69. [Google Scholar] [CrossRef]
- Sandhu, J.S.; Gupta, G.; Shenoy, S. Prediction Equation for Calculating Fat Mass in Young Indian Adults. Asian J. Sports Med. 2010, 1, 101–107. [Google Scholar] [CrossRef] [Green Version]
- Catikkas, F.; Kurt, C.; Atalag, O. Kinanthropometric attributes of young male combat sports athletes. Coll. Antropol. 2013, 37, 1365–1368. [Google Scholar]
- Curilem Gatica, C.; Almagià Flores, A.; Yuing Farías, T.; Rodríguez Rodríguez, F. Body composition and heart rate variability in patients with chronic obstructive pulmonary disease pulmonary rehabilitation candidates. Nutr. Hosp. 2014, 30, 179–182. [Google Scholar] [CrossRef]
- Singh, S.; Singh, M.; Rathi, B. Kinanthropometric and performance characteristics of elite and non-elite female softball players. J. Sports Med. Phys. Fit. 2013, 53, 628–634. [Google Scholar]
- Faulkner, J. Physiology of swimming and diving. In Exercise Physiology; Falls, H., Ed.; Academic Press: Baltimore, MD, USA, 1968. [Google Scholar]
- Armstrong, L.E.; Maresh, C.M.; Castellani, J.W.; Bergeron, M.F.; Kenefick, R.W.; Lagasse, K.E.; Riebe, D. Urinary Indices of Hydration Status. Int. J. Sport Nutr. 1994, 4, 265–279. [Google Scholar] [CrossRef]
- McKenzie, A.L.; Armstrong, L.E. Monitoring Body Water Balance in Pregnant and Nursing Women: The Validity of Urine Color. Ann. Nutr. Metab. 2017, 70, 18–22. [Google Scholar] [CrossRef] [PubMed] [Green Version]
- McBride, G. Statistical Calculators; Lin’s Concordance; NIWA: Auckland, New Zealand, 2007. [Google Scholar]
- Coratella, G.; Campa, F.; Matias, C.N.; Toselli, S.; Koury, J.C.; Andreoli, A.; Sardinha, L.S.B.; Silva, A.M. Generalized bioelectric impedance-based equations underestimate body fluids in athletes. Scand. J. Med. Sci. Sports 2021, 31, 2123–2132. [Google Scholar] [CrossRef] [PubMed]
- Marcos-Pardo, P.J.; González-Gálvez, N.; López-Vivancos, A.; Espeso-García, A.; Martínez-Aranda, L.M.; Gea-García, G.M.; Orquín-Castrillón, F.J.; Carbonell-Baeza, A.; Jiménez-García, J.D.; Velázquez-Díaz, D.; et al. Sarcopenia, Diet, Physical Activity and Obesity in European Middle-Aged and Older Adults: The LifeAge Study. Nutrients 2020, 13, 8. [Google Scholar] [CrossRef] [PubMed]
- Lohman, T.G.; Pollock, M.L. Skinfold Measurement: Which Caliper? How Much Training? J. Phys. Ed. Recreat. 1981, 52, 27–29. [Google Scholar] [CrossRef]
- Orphanidou, C.; McCargar, L.; Birmingham, C.L.; Mathieson, J.; Goldner, E. Accuracy of subcutaneous fat measurement: Comparison of skinfold calipers, ultrasound, and computed tomography. J. Am. Diet. Assoc. 1994, 94, 855–858. [Google Scholar] [CrossRef]
- Tanner, J.M.; Whitehouse, R.H. Revised standards for triceps and subscapular skinfolds in British children. Arch. Dis. Child. 1975, 50, 142–145. [Google Scholar] [CrossRef] [PubMed] [Green Version]
- Mayorga-Vega, D.; Merino-Marban, R.; Viciana, J. Criterion-Related Validity of Sit-and-Reach Tests for Estimating Hamstring and Lumbar Extensibility: A Meta-Analysis. J. Sports Sci. Med. 2014, 13, 1–14. [Google Scholar]
- Yumani, D.F.J.; de Jongh, D.; Lafeber, H.N.; van Weissenbruch, M.M. A comparative study using dual-energy X-ray absorptiometry, air displacement plethysmography, and skinfolds to assess fat mass in preterms at term equivalent age. Eur. J. Pediatr. 2021, 180, 919–927. [Google Scholar] [CrossRef]
- Schubert, M.M.; Seay, R.F.; Spain, K.K.; Clarke, H.E.; Taylor, J.K. Reliability and validity of various laboratory methods of body composition assessment in young adults. Clin. Physiol. Funct. Imaging 2019, 39, 150–159. [Google Scholar] [CrossRef]
- Nickerson, B.S.; McLester, C.N.; McLester, J.R.; Kliszczewicz, B.M. Agreement between 2 Segmental Bioimpedance Devices, BOD POD, and DXA in Obese Adults. J. Clin. Densitom. 2020, 23, 138–148. [Google Scholar] [CrossRef]
- Orsso, C.E.; Silva, M.I.B.; Gonzalez, M.C.; Rubin, D.A.; Heymsfield, S.B.; Prado, C.M.; Haqq, A.M. Assessment of body composition in pediatric overweight and obesity: A systematic review of the reliability and validity of common techniques. Obes. Rev. 2020, 21, e13041. [Google Scholar] [CrossRef]
- Zhang, J.; Zhang, N.; Du, S.; Liu, S.; Ma, G. Effects of Water Restriction and Water Replenishment on the Content of Body Water with Bioelectrical Impedance among Young Adults in Baoding, China: A Randomized Controlled Trial (RCT). Nutrients 2021, 13, 553. [Google Scholar] [CrossRef]
- Kerr, A.; Slater, G.J.; Byrne, N. Impact of food and fluid intake on technical and biological measurement error in body composition assessment methods in athletes. Br. J. Nutr. 2017, 117, 591–601. [Google Scholar] [CrossRef]
- Power, M.L.; Schulkin, J. Sex differences in fat storage, fat metabolism, and the health risks from obesity: Possible evolutionary origins. Br. J. Nutr. 2008, 99, 931–940. [Google Scholar] [CrossRef]
- Blaak, E. Gender differences in fat metabolism. Curr. Opin. Clin. Nutr. Metab. Care 2001, 4, 499–502. [Google Scholar] [CrossRef] [Green Version]
- McRae, M.P. Male and female differences in variability with estimating body fat composition using skinfold calipers. J. Chiropr. Med. 2010, 9, 157–161. [Google Scholar] [CrossRef] [Green Version]


| Protocol 1 | Protocol 2 | Protocol 3 | Protocol 4 |
|---|---|---|---|
| Harpenden | Holtain | Slim Guide | Lipowise |
| Holtain | Slim Guide | Lipowise | Harpenden |
| Slim Guide | Lipowise | Harpenden | Holtain |
| Lipowise | Harpenden | Holtain | Slim Guide |
| Variable | Mean ± SD | |
|---|---|---|
| Men (n = 69) | Women (n = 69) | |
| Age (years old) | 21.46 ± 2.52 | 22.19 ± 2.85 |
| Body mass (kg) | 68.73 ± 8.03 | 59.50 ± 6.12 |
| Height (cm) | 175.67 ± 6.73 | 164.91 ± 6.14 |
| BMI (kg/m2) | 22.21 ± 1.61 | 21.85 ± 1.71 |
| Hydration status (score from 1 to 8) | 5.88 ± 1.46 | 5.33 ± 1.75 |
| Variable | MEAN ± SD | ANOVA | ANCOVA | |||||||||||||
|---|---|---|---|---|---|---|---|---|---|---|---|---|---|---|---|---|
| Calipers * Sex | Calipers * BMI | Calipers * Hydration | ||||||||||||||
| Lipowise | Harpenden | Holtain | Slim Guide | F | p | Eta | F | p | Eta | F | p | Eta | F | p | Eta | |
| Triceps sf (mm) | 12.69 ± 5.75 | 12.97 ± 5.82 | 14.07 ± 6.21 | 13.72 ± 6.11 | 0.968 | 0.327 | 0.007 | 7.725 | 0.006 | 0.055 | 0.814 | 0.368 | 0.006 | 0.568 | 0.452 | 0.004 |
| Subscapular sf (mm) | 9.56 ± 3.28 | 9.84 ± 3.26 | 10.58 ± 3.60 | 10.44 ± 3.66 | 0.024 | 0.877 | 0.000 | 0.000 | 0.984 | 0.000 | 0.000 | 0.997 | 0.000 | 3.517 | 0.063 | 0.026 |
| Biceps sf (mm) | 5.07 ± 3.03 | 5.33 ± 2.77 | 5.98 ± 3.24 | 5.79 ± 3.10 | 2.338 | 0.129 | 0.017 | 4.009 | 0.047 | 0.029 | 4.394 | 0.038 | 0.032 | 0.354 | 0.553 | 0.003 |
| Iliac crest sf (mm) | 12.05 ± 5.24 | 12.19 ± 5.22 | 13.30 ± 5.47 | 12.95 ± 5.27 | 3.833 | 0.052 | 0.028 | 0.000 | 0.994 | 0.000 | 2.775 | 0.098 | 0.020 | 0.083 | 0.773 | 0.001 |
| Supraspinale sf (mm) | 8.08 ± 3.78 | 8.28 ± 3.71 | 9.07 ± 4.05 | 8.76 ± 3.88 | 0.864 | 0.354 | 0.006 | 1.107 | 0.295 | 0.008 | 2.090 | 0.151 | 0.015 | 1.797 | 0.182 | 0.013 |
| Abdominal sf (mm) | 14.77 ± 6.94 | 14.85 ± 6.70 | 16.21 ± 7.20 | 14.97 ± 6.65 | 0.319 | 0.573 | 0.002 | 0.246 | 0.621 | 0.002 | 0.461 | 0.498 | 0.003 | 0.000 | 0.987 | 0.000 |
| Thigh sf (mm) | 17.70 ± 8.16 | 17.95 ± 8.33 | 19.56 ± 8.80 | 18.42 ± 8.34 | 0.048 | 0.827 | 0.000 | 0.203 | 0.653 | 0.002 | 0.225 | 0.636 | 0.002 | 0.001 | 0.981 | 0.000 |
| Calf sf (mm) | 10.45 ± 5.67 | 10.76 ± 5.65 | 11.84 ± 6.17 | 11.23 ± 5.83 | 1.888 | 0.172 | 0.014 | 2.148 | 0.145 | 0.016 | 2.561 | 0.112 | 0.019 | 0.483 | 0.488 | 0.004 |
| Σ6 skinfolds (mm) | 73.24 ± 28.71 | 74.66 ± 28.55 | 81.33 ± 30.77 | 77.53 ± 29.42 | 0.125 | 0.724 | 0.001 | 0.967 | 0.327 | 0.007 | 0.319 | 0.573 | 0.002 | 0.259 | 0.612 | 0.002 |
| Σ8 skinfolds (mm) | 90.36 ± 35.46 | 92.17 ± 35.08 | 100.61 ± 37.87 | 96.27 ± 36.21 | 0.032 | 0.858 | 0.000 | 0.675 | 0.413 | 0.005 | 0.008 | 0.928 | 0.000 | 0.436 | 0.510 | 0.003 |
| AT Kerr (%) | 27.59 ± 6.86 | 27.95 ± 6.81 | 29.63 ± 7.34 | 28.68 ± 7.04 | 1.420 | 0.236 | 0.010 | 2.216 | 0.139 | 0.016 | 1.592 | 0.209 | 0.012 | 2.206 | 0.140 | 0.016 |
| AT Kerr (Kg) | 18.29 ± 4.55 | 18.53 ± 4.52 | 19.64 ± 4.87 | 19.01 ± 4.67 | 1.420 | 0.236 | 0.010 | 2.216 | 0.139 | 0.016 | 1.592 | 0.209 | 0.012 | 2.206 | 0.140 | 0.016 |
| FM Durnin and Womersley (%) | 15.85 ± 5.41 | 16.23 ± 5.25 | 17.36 ± 5.32 | 17.06 ± 5.30 | 0.064 | 0.801 | 0.000 | 0.107 | 0.744 | 0.001 | 2.103 | 0.149 | 0.015 | 0.712 | 0.400 | 0.005 |
| FM Durnin and Womersley (Kg) | 10.51 ± 3.59 | 10.76 ± 3.49 | 11.51 ± 3.52 | 10.91 ± 3.55 | 1.172 | 0.281 | 0.009 | 1.362 | 0.245 | 0.010 | 0.043 | 0.837 | 0.000 | 0.811 | 0.369 | 0.006 |
| FM Faulkner (%) | 12.68 ± 2.65 | 12.81 ± 2.59 | 13.42 ± 2.81 | 13.11 ± 2.72 | 0.177 | 0.674 | 0.001 | 0.88′ | 0.350 | 0.007 | 0.048 | 0.826 | 0.000 | 0.093 | 0.761 | 0.001 |
| FM Faulkner (Kg) | 8.24 ± 2.05 | 8.22 ± 2.02 | 8.62 ± 2.16 | 8.41 ± 2.11 | 0.757 | 0.386 | 0.006 | 0.350 | 0.555 | 0.003 | 0.681 | 0.411 | 0.005 | 0.078 | 0.781 | 0.001 |
| Calipers | Variable | Lin’s Concordance Correlation Coefficient | ||
|---|---|---|---|---|
| CCC | ρ | Cb | ||
| Harpenden-Holtain | Triceps skinfold | 0.975 | 0.993 | 0.982 |
| Subscapular skinfold | 0.962 | 0.989 | 0.972 | |
| Biceps skinfold | 0.946 | 0.980 | 0.965 | |
| Iliac crest skinfold | 0.966 | 0.988 | 0.978 | |
| Supraspinale skinfold | 0.963 | 0.987 | 0.976 | |
| Abdominal skinfold | 0.959 | 0.980 | 0.979 | |
| Thigh skinfold | 0.956 | 0.974 | 0.981 | |
| Calf skinfold | 0.972 | 0.992 | 0.980 | |
| Σ6 skinfolds | 0.966 | 0.993 | 0.973 | |
| Σ8 skinfolds | 0.964 | 0.993 | 0.971 | |
| Adipose tissue Kerr (%) | 0.963 | 0.993 | 0.970 | |
| Adipose tissue Kerr (Kg) | 0.963 | 0.993 | 0.970 | |
| Fat mass Durnin and Womersley (%) | 0.972 | 0.994 | 0.978 | |
| Fat mass Durnin and Womersley (Kg) | 0.972 | 0.994 | 0.978 | |
| Fat mass Faulkner (%) | 0.963 | 0.991 | 0.972 | |
| Fat mass Faulkner (Kg) | 0.974 | 0.994 | 0.980 | |
| Harpenden-Slimguide | Triceps skinfold | 0.982 | 0.991 | 0.991 |
| Subscapular skinfold | 0.961 | 0.982 | 0.979 | |
| Biceps skinfold | 0.964 | 0.972 | 0.992 | |
| Iliac crest skinfold | 0.971 | 0.982 | 0.989 | |
| Supraspinale skinfold | 0.974 | 0.983 | 0.990 | |
| Abdominal skinfold | 0.982 | 0.982 | 1.000 | |
| Thigh skinfold | 0.965 | 0.966 | 0.998 | |
| Calf skinfold | 0.984 | 0.988 | 0.996 | |
| Σ6 skinfolds | 0.986 | 0.991 | 0.995 | |
| Σ8 skinfolds | 0.984 | 0.991 | 0.993 | |
| Adipose tissue Kerr (%) | 0.985 | 0.991 | 0.994 | |
| Adipose tissue Kerr (Kg) | 0.985 | 0.991 | 0.994 | |
| Fat mass Durnin and Womersley (%) | 0.976 | 0.990 | 0.986 | |
| Fat mass Durnin and Womersley (Kg) | 0.980 | 0.991 | 0.988 | |
| Fat mass Faulkner (%) | 0.996 | 0.998 | 0.999 | |
| Fat mass Faulkner (Kg) | 0.996 | 0.997 | 0.999 | |
| Harpenden-Lipowise | Triceps skinfold | 0.989 | 0.991 | 0.999 |
| Subscapular skinfold | 0.981 | 0.985 | 0.996 | |
| Biceps skinfold | 0.964 | 0.972 | 0.992 | |
| Iliac crest skinfold | 0.989 | 0.989 | 1.000 | |
| Supraspinale skinfold | 0.986 | 0.988 | 0.998 | |
| Abdominal skinfold | 0.978 | 0.979 | 0.999 | |
| Thigh skinfold | 0.970 | 0.971 | 0.999 | |
| Calf skinfold | 0.989 | 0.990 | 0.998 | |
| Σ6 skinfolds | 0.991 | 0.993 | 0.999 | |
| Σ8 skinfolds | 0.991 | 0.993 | 0.999 | |
| Adipose tissue Kerr (%) | 0.991 | 0.992 | 0.999 | |
| Adipose tissue Kerr (Kg) | 0.991 | 0.992 | 0.999 | |
| Fat mass Durnin and Womersley (%) | 0.989 | 0.993 | 0.996 | |
| Fat mass Durnin and Womersley (Kg) | 0.991 | 0.994 | 0.997 | |
| Fat mass Faulkner (%) | 0.998 | 0.998 | 1.000 | |
| Fat mass Faulkner (Kg) | 0.998 | 0.998 | 1.000 | |
| Holtain-Slimguide | Triceps skinfold | 0.988 | 0.990 | 0.998 |
| Subscapular skinfold | 0.978 | 0.979 | 0.999 | |
| Biceps skinfold | 0.976 | 0.979 | 0.997 | |
| Iliac crest skinfold | 0.981 | 0.984 | 0.997 | |
| Supraspinale skinfold | 0.980 | 0.984 | 0.996 | |
| Abdominal skinfold | 0.960 | 0.979 | 0.981 | |
| Thigh skinfold | 0.981 | 0.991 | 0.990 | |
| Calf skinfold | 0.984 | 0.990 | 0.993 | |
| Σ6 skinfolds | 0.985 | 0.994 | 0.991 | |
| Σ8 skinfolds | 0.986 | 0.994 | 0.992 | |
| Adipose tissue Kerr (%) | 0.983 | 0.993 | 0.990 | |
| Adipose tissue Kerr (Kg) | 0.983 | 0.993 | 0.990 | |
| Fat mass Durnin and Womersley (%) | 0.988 | 0.991 | 0.998 | |
| Fat mass Durnin and Womersley (Kg) | 0.990 | 0.992 | 0.998 | |
| Fat mass Faulkner (%) | 0.996 | 0.998 | 0.998 | |
| Fat mass Faulkner (Kg) | 0.995 | 0.998 | 0.997 | |
| Holtain-Lipowise | Triceps skinfold | 0.960 | 0.988 | 0.971 |
| Subscapular skinfold | 0.935 | 0.981 | 0.953 | |
| Biceps skinfold | 0.940 | 0.982 | 0.957 | |
| Iliac crest skinfold | 0.959 | 0.986 | 0.973 | |
| Supraspinale skinfold | 0.952 | 0.986 | 0.966 | |
| Abdominal skinfold | 0.962 | 0.983 | 0.979 | |
| Thigh skinfold | 0.967 | 0.993 | 0.974 | |
| Calf skinfold | 0.962 | 0.992 | 0.970 | |
| Σ6 skinfolds | 0.957 | 0.995 | 0.962 | |
| Σ8 skinfolds | 0.955 | 0.994 | 0.960 | |
| Adipose tissue Kerr (%) | 0.952 | 0.994 | 0.958 | |
| Adipose tissue Kerr (Kg) | 0.952 | 0.994 | 0.958 | |
| Fat mass Durnin and Womersley (%) | 0.945 | 0.992 | 0.953 | |
| Fat mass Durnin and Womersley (Kg) | 0.954 | 0.992 | 0.962 | |
| Fat mass Faulkner (%) | 0.988 | 0.999 | 0.989 | |
| Fat mass Faulkner (Kg) | 0.987 | 0.999 | 0.988 | |
| Slimguide-Lipowise | Triceps skinfold | 0.971 | 0.988 | 0.983 |
| Subscapular skinfold | 0.937 | 0.973 | 0.963 | |
| Biceps skinfold | 0.953 | 0.980 | 0.972 | |
| Iliac crest skinfold | 0.969 | 0.984 | 0.985 | |
| Supraspinale skinfold | 0.967 | 0.983 | 0.984 | |
| Abdominal skinfold | 0.981 | 0.982 | 0.999 | |
| Thigh skinfold | 0.987 | 0.991 | 0.996 | |
| Calf skinfold | 0.982 | 0.991 | 0.990 | |
| Σ6 skinfolds | 0.983 | 0.994 | 0.989 | |
| Σ8 skinfolds | 0.980 | 0.994 | 0.986 | |
| Adipose tissue Kerr (%) | 0.980 | 0.993 | 0.988 | |
| Adipose tissue Kerr (Kg) | 0.980 | 0.993 | 0.988 | |
| Fat mass Durnin and Womersley (%) | 0.961 | 0.991 | 0.970 | |
| Fat mass Durnin and Womersley (Kg) | 0.967 | 0.991 | 0.976 | |
| Fat mass Faulkner (%) | 0.996 | 0.999 | 0.997 | |
| Fat mass Faulkner (Kg) | 0.995 | 0.998 | 0.997 | |
| Caliper | Pearson’s r (p) | Harpenden—Caliper | ||
|---|---|---|---|---|
| Mean Diff (95% CI) | 95% Limits of Agreement | p | ||
| Triceps skinfold | ||||
| Holtain | r = 0.99; p < 0.001 | −0.74 (−0.93 to −0.55) | −2.71 to 0.53 | <0.000 |
| Slim Guide | r = 0.99; p < 0.001 | −1.09 (−1.27 to −0.92) | −1.27 to 1.84 | <0.000 |
| Lipowise | r = 0.99; p < 0.001 | 0.29 (0.11 to 0.47) | −2.44 to 0.96 | <0.000 |
| Subscapula skinfold | ||||
| Holtain | r = 0.98; p < 0.001 | −0.47 (−0.64 to −0.30) | −1.94 to 0.47 | <0.000 |
| Slim Guide | r = 0.98; p < 0.001 | −0.65 (−0.82 to −0.49) | −0.84 to 1.42 | <0.000 |
| Lipowise | r = 0.98; p < 0.001 | 0.26 (0.10 to 0.42) | −2.11 to 0.92 | <0.000 |
| Biceps skinfold | ||||
| Holtain | r = 0.98; p < 0.001 | −0.47 (−0.63 to −0.30) | −2.14 to 0.83 | <0.000 |
| Slim Guide | r = 0.98; p < 0.001 | −0.65 (−0.81 to −0.49) | −1.17 to 1.69 | 0.007 |
| Lipowise | r = 0.97; p < 0.001 | 0.26 (0.10 to 0.42) | −1.94 to 1.01 | <0.000 |
| Iliac crest skinfold | ||||
| Holtain | r = 0.99; p < 0.001 | −0.77 (−1.00 to −0.54) | −2.80 to 0.58 | <0.000 |
| Slim Guide | r = 0.99; p < 0.001 | −1.11 (−1.30 to −0.92) | −1.39 to 1.65 | <0.000 |
| Lipowise | r = 0.98; p < 0.001 | 0.13 (−0.05 to 0.31) | −2.73 to 1.20 | 0.288 |
| Supraspinale skinfold | ||||
| Holtain | r = 0.99; p < 0.001 | −0.48 (−0.64 to −0.31) | −2.20 to 0.60 | <0.000 |
| Slim Guide | r = 0.99; p < 0.001 | −0.80 (−0.96 to −0.64) | −0.95 to 1.35 | <0.000 |
| Lipowise | r = 0.98; p < 0.001 | 0.20 (0.06 to 0.33) | −1.90 to 0.94 | 0.001 |
| Abdominal skinfold | ||||
| Holtain | r = 0.98; p < 0.001 | −0.12 (−0.41 to 0.18) | −4.27 to 1.55 | 1.000 |
| Slim Guide | r = 0.98; p < 0.001 | −1.36 (−1.70 to −1.02) | −18.18 to 12.47 | <0.000 |
| Lipowise | r = 0.98; p < 0.001 | 0.08 (−0.25 to 0.41) | −2.62 to 2.38 | 1.000 |
| Thigh skinfold | ||||
| Holtain | r = 0.97; p < 0.001 | −0.47 (−0.97 to 0.03) | −5.54 to 2.33 | 0.076 |
| Slim Guide | r = 0.97; p < 0.001 | −1.61 (−2.05 to −1.16) | −3.69 to 4.19 | <0.000 |
| Lipowise | r = 0.96; p < 0.001 | 0.25 (−0.21 to 0.71) | −4.72 to 3.79 | 0.909 |
| Calf skinfold | ||||
| Holtain | r = 0.99; p < 0.001 | −0.47 (−0.68 to −0.26) | −2.85 to 0.70 | <0.000 |
| Slim Guide | r = 0.99; p < 0.001 | −1.07 (−1.26 to −0.89) | −1.24 to 1.87 | <0.000 |
| Lipowise | r = 0.99; p < 0.001 | 0.32 (0.14 to 0.50) | −2.26 to 1.33 | <0.000 |
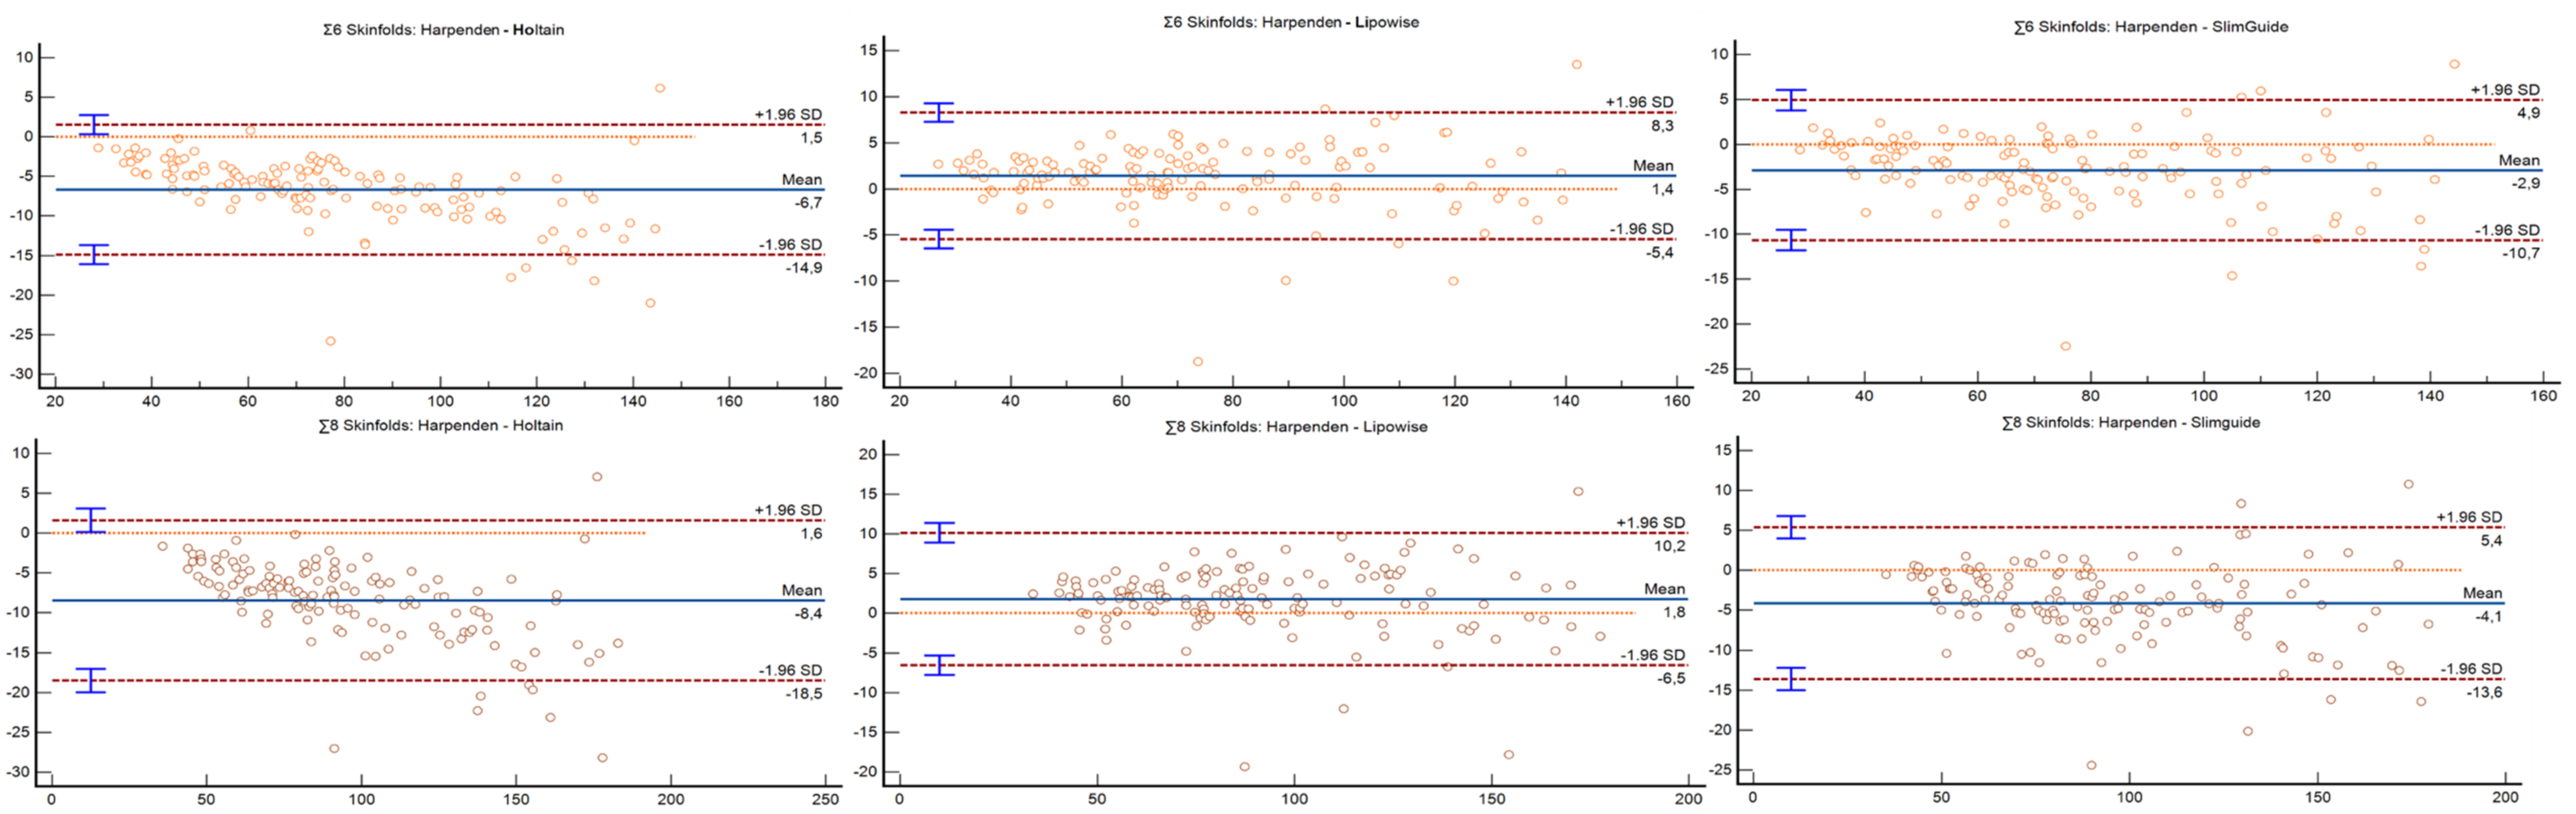
| Σ6 skinfolds | ||||
| Holtain | r = 0.99; p < 0.001 | −6.67 (−7.38 to −5.97) | −14.88 to 1.54 | <0.001 |
| Slim Guide | r = 0.99; p < 0.001 | −2.87 (−3.54 to −2.20) | −10.65 to 4.91 | <0.001 |
| Lipowise | r = 0.99; p < 0.001 | 1.42 (0.83 to 2.01) | −5.44 to 8.28 | <0.001 |
| Σ8 skinfolds | ||||
| Holtain | r = 0.99; p < 0.001 | −8.44 (−9.30 to −7.57) | −18.49 to 1.62 | <0.001 |
| Slim Guide | r = 0.99; p < 0.001 | −4.10 (−4.92 to −3.29) | −13.60 to 5.39 | <0.001 |
| Lipowise | r = 0.99; p < 0.001 | 1.81 (1.10 to 2.53) | −6.54 to 10.16 | <0.001 |
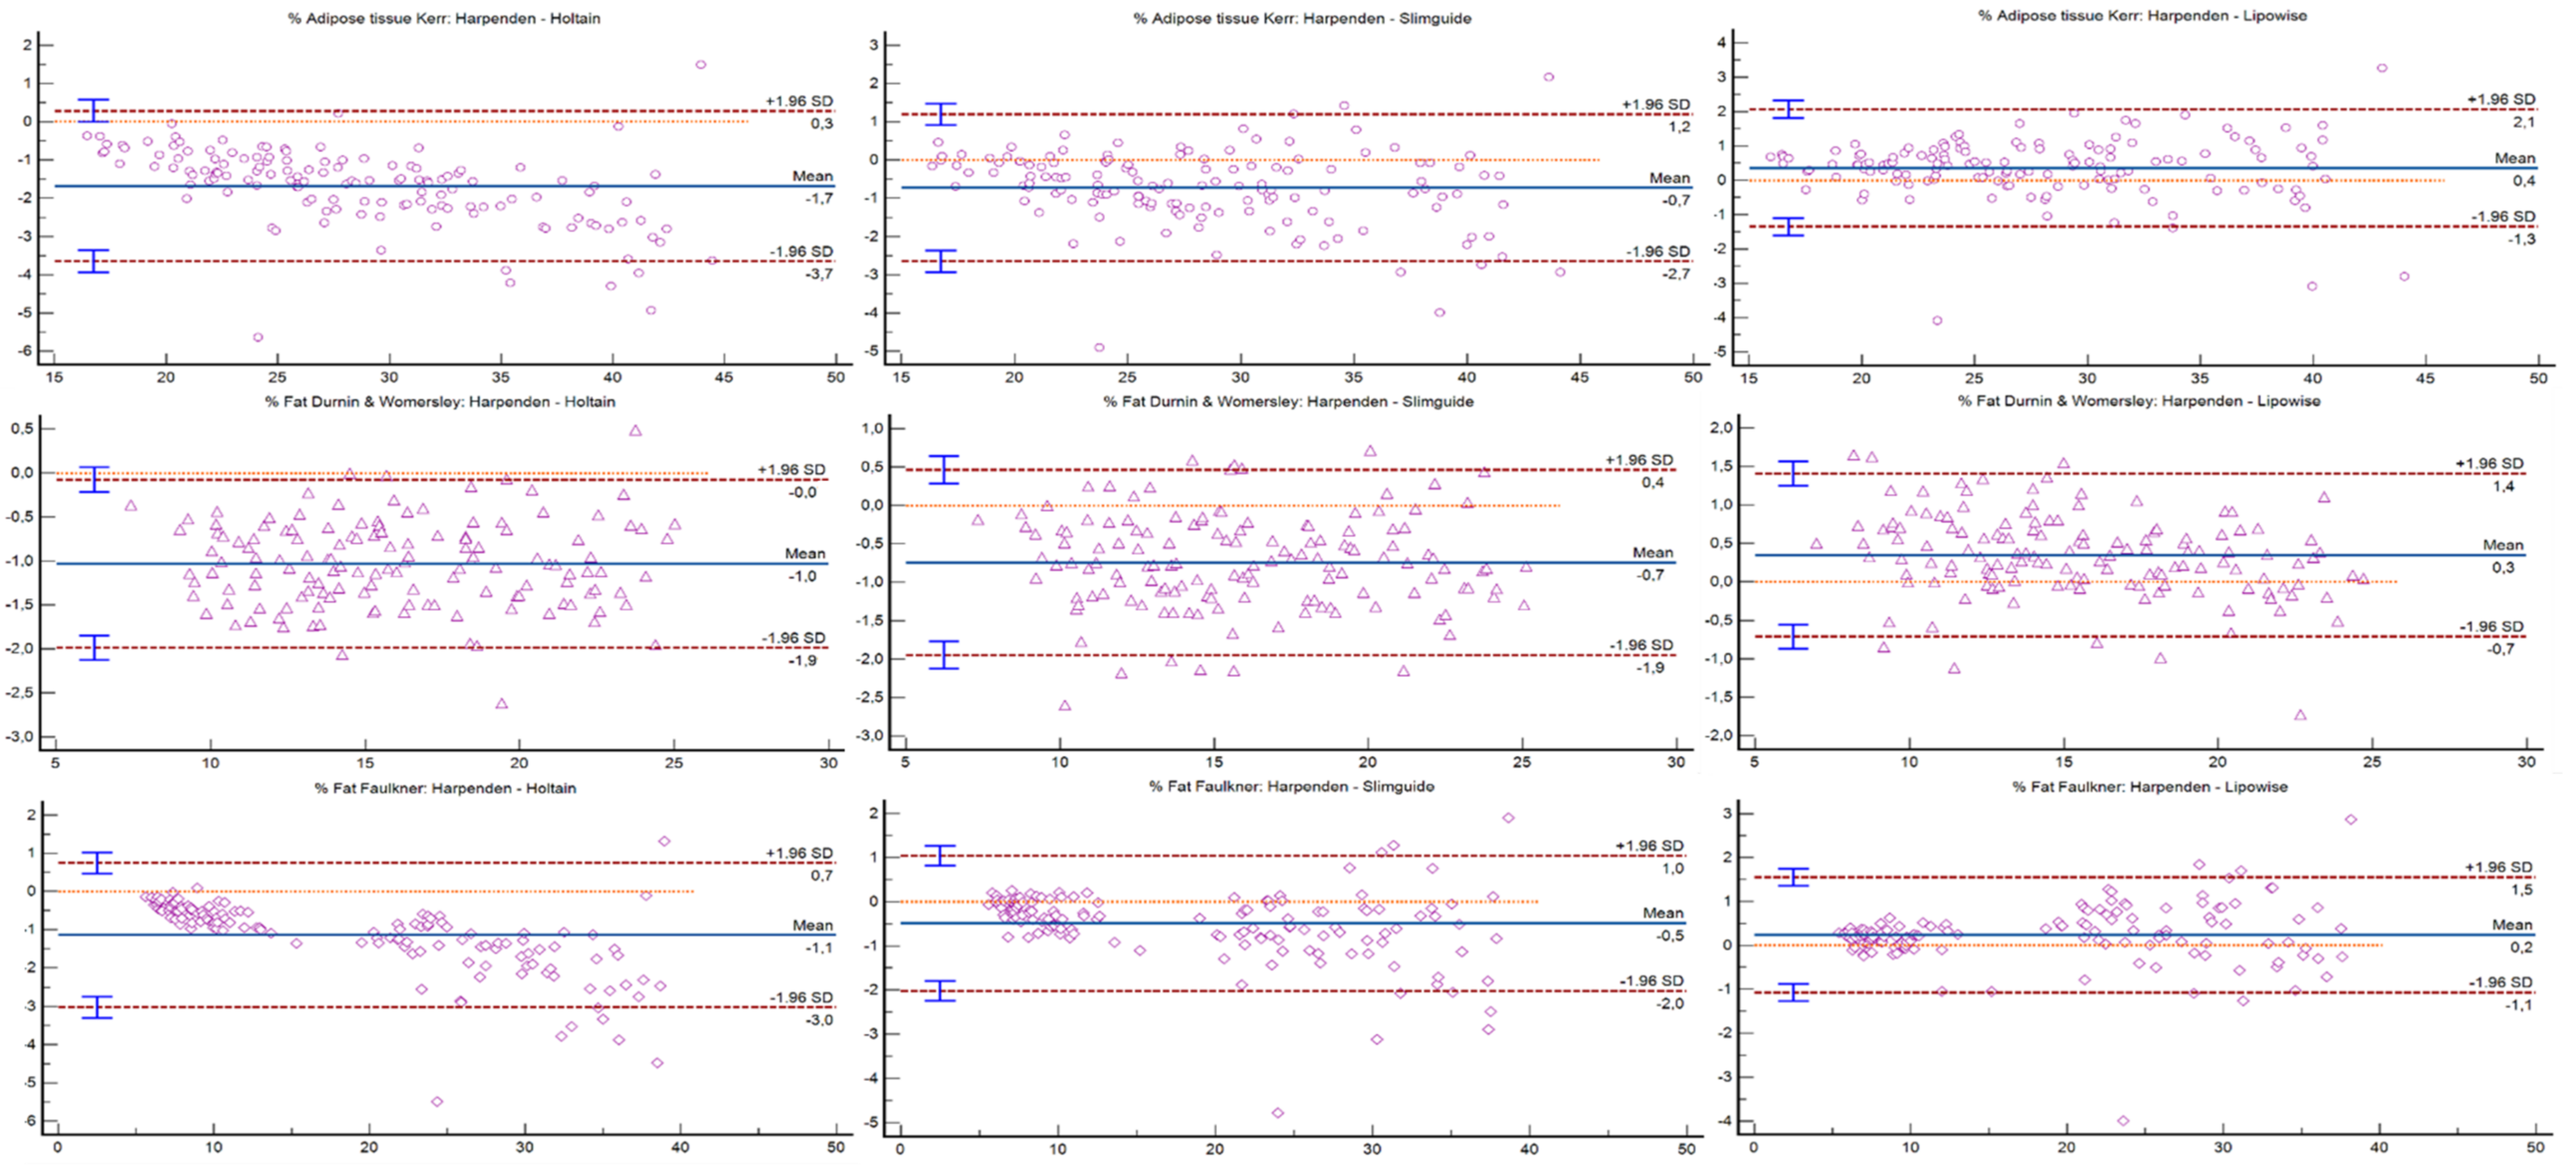
| Adipose tissue Kerr (%) | ||||
| Holtain | r = 0.99; p < 0.001 | −1.68 (−1.85 to −1.51) | −3.65 to 0.29 | <0.001 |
| Slim Guide | r = 0.99; p < 0.001 | −0.73 (−0.89 to −0.56) | −2.65 to 1.20 | <0.001 |
| Lipowise | r = 0.99; p < 0.001 | 0.36 (0.21 to 0.51) | −1.35 to 2.07 | <0.001 |
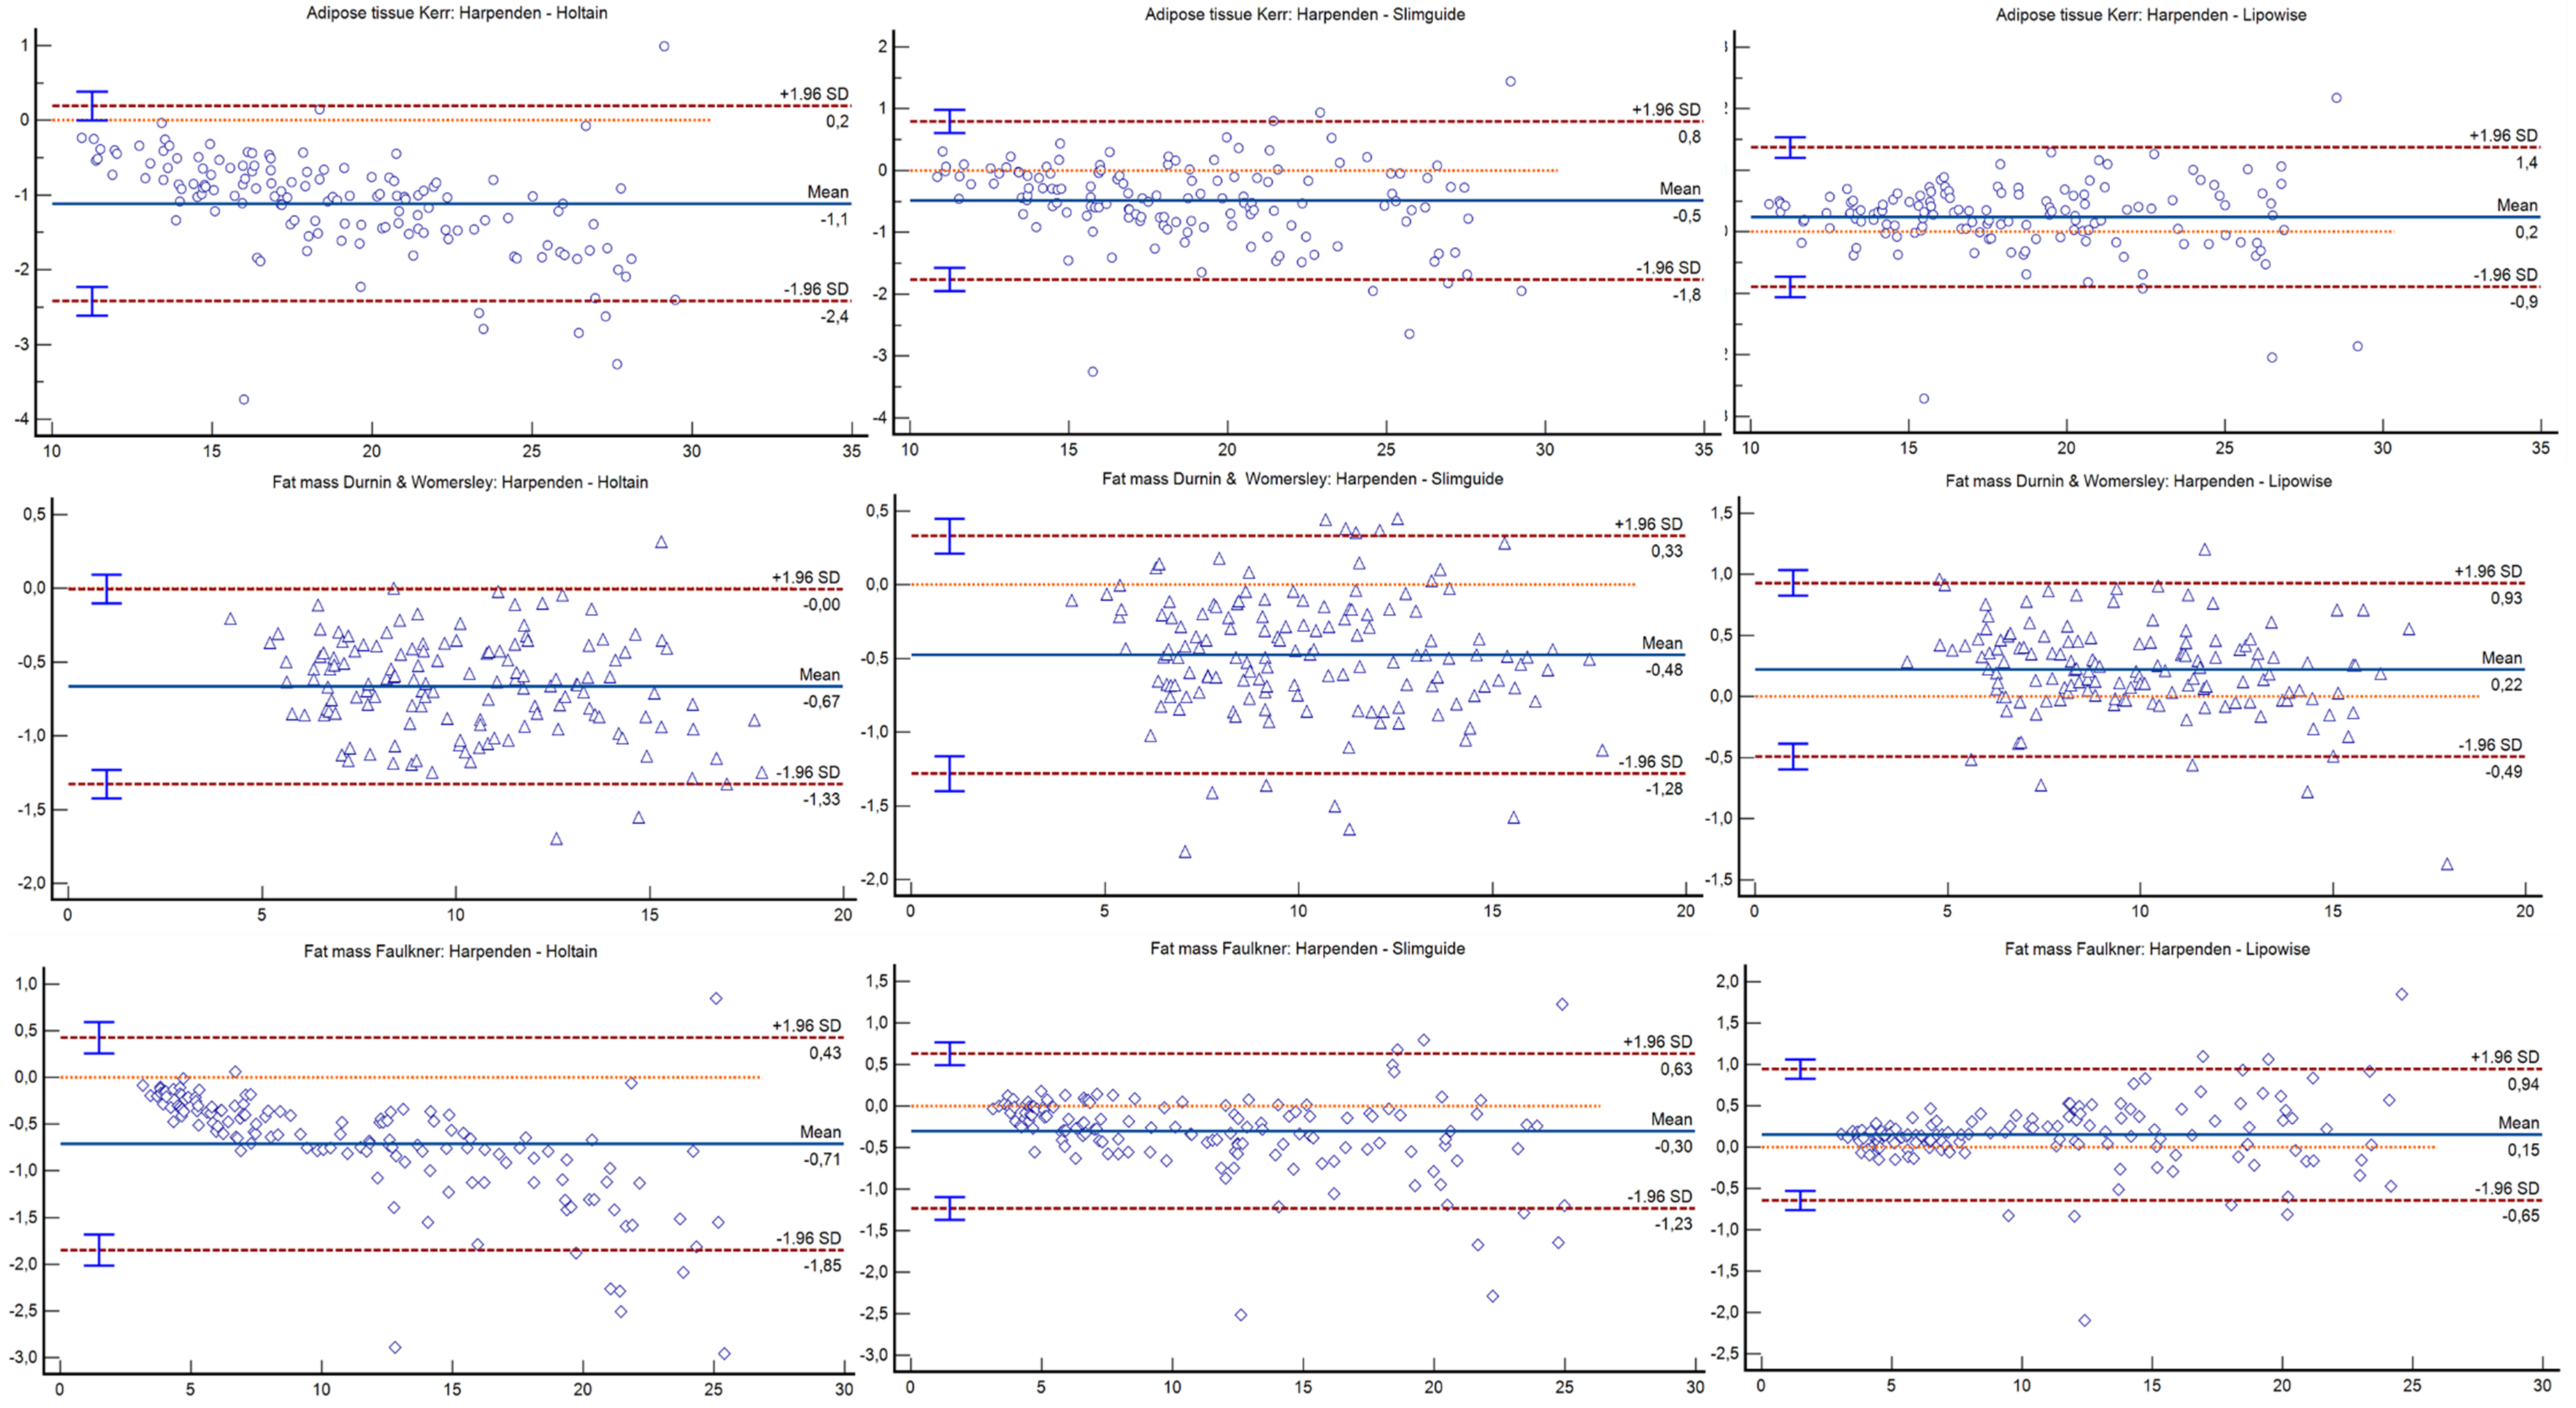
| Adipose tissue Kerr (Kg) | ||||
| Holtain | r = 0.99; p < 0.001 | −1.11 (−1.23 to −1.00) | −2.42 to 0.19 | <0.001 |
| Slim Guide | r = 0.99; p < 0.001 | −0.48 (−0.59 to −0.37) | −1.76 to 0.79 | <0.001 |
| Lipowise | r = 0.99; p < 0.001 | 0.24 (0.14 to 0.34) | −0.89 to 1.37 | <0.001 |
| Fat mass Durnin and Womersley (%) | ||||
| Holtain | r = 0.99; p < 0.001 | −1.03 (−1.11 to −0.95) | −1.99 to −0.07 | <0.001 |
| Slim Guide | r = 0.99; p < 0.001 | −0.74 (−0.84 to −0.64 | −1.95 to 0.46 | <0.001 |
| Lipowise | r = 0.99; p < 0.001 | 0.35 (0.26 to 0.44) | −0.71 to 1.41 | <0.001 |
| Fat mass Durnin and Womersley (Kg) | ||||
| Holtain | r = 0.99; p < 0.001 | −0.67 (−0.72 to −0.61) | −1.32 to −0.01 | <0.001 |
| Slim Guide | r = 0.99; p < 0.001 | −0.47 (−0.54 to −0.41) | −1.28 to 0.33 | <0.001 |
| Lipowise | r = 0.99; p < 0.001 | 0.22 (0.16 to 0.28) | −0.49 to 0.93 | <0.001 |
| Fat mass Faulkner (%) | ||||
| Holtain | r = 0.99; p < 0.001 | −1.14 (−1.30 to −0.98) | −3.02 to 0.75 | <0.001 |
| Slim Guide | r = 0.99; p < 0.001 | −0.48 (−0.62 to −0.35) | −2.01 to 1.04 | <0.001 |
| Lipowise | r = 0.99; p < 0.001 | 0.23 (0.12 to 0.35) | −1.07 to 1.54 | <0.001 |
| Fat mass Faulkner (Kg) | ||||
| Holtain | r = 0.99; p < 0.001 | −0.71 (−0.81 to −0.61) | −1.85 to 0.42 | <0.001 |
| Slim Guide | r = 0.99; p < 0.001 | −0.30 (−0.38 to −0.22) | −1.23 to 0.63 | <0.001 |
| Lipowise | r = 0.99; p < 0.001 | 0.15 (0.08 to 0.22) | −0.65 to 0.94 | <0.001 |
Publisher’s Note: MDPI stays neutral with regard to jurisdictional claims in published maps and institutional affiliations. |
© 2022 by the authors. Licensee MDPI, Basel, Switzerland. This article is an open access article distributed under the terms and conditions of the Creative Commons Attribution (CC BY) license (https://creativecommons.org/licenses/by/4.0/).
Share and Cite
Esparza-Ros, F.; Moreira, A.C.; Vaquero-Cristóbal, R.; Barrigas, C.; Albaladejo-Saura, M.; Vieira, F. Differences between Four Skinfold Calipers in the Assessment of Adipose Tissue in Young Adult Healthy Population. Nutrients 2022, 14, 2085. https://0-doi-org.brum.beds.ac.uk/10.3390/nu14102085
Esparza-Ros F, Moreira AC, Vaquero-Cristóbal R, Barrigas C, Albaladejo-Saura M, Vieira F. Differences between Four Skinfold Calipers in the Assessment of Adipose Tissue in Young Adult Healthy Population. Nutrients. 2022; 14(10):2085. https://0-doi-org.brum.beds.ac.uk/10.3390/nu14102085
Chicago/Turabian StyleEsparza-Ros, Francisco, Ana Catarina Moreira, Raquel Vaquero-Cristóbal, Carlos Barrigas, Mario Albaladejo-Saura, and Filomena Vieira. 2022. "Differences between Four Skinfold Calipers in the Assessment of Adipose Tissue in Young Adult Healthy Population" Nutrients 14, no. 10: 2085. https://0-doi-org.brum.beds.ac.uk/10.3390/nu14102085