Article

Abnormal Micronutrient Intake Is Associated with the Risk of Periodontitis: A Dose–response Association Study Based on NHANES 2009–2014

State Key Laboratory of Oral Diseases, National Clinical Research Center for Oral Diseases, Chinese Academy of Medical Sciences Research Unit of Oral Carcinogenesis and Management, West China Hospital of Stomatology, Sichuan University, Chengdu 610041, China
*
Authors to whom correspondence should be addressed.
Submission received: 9 May 2022 / Revised: 8 June 2022 / Accepted: 13 June 2022 / Published: 14 June 2022
(This article belongs to the Special Issue Interrelationships between Nutrition and the Dental Profession)

Abstract

:
The association between micronutrient intake and the risk of periodontitis has received much attention in recent years. However, most studies focused on the linear relationship between them. This study aimed to explore the dose–response association between micronutrient intake and periodontitis. A total of 8959 participants who underwent a periodontal examination, and reported their micronutrient intake levels were derived from the US National Health and Nutrition Examination Survey (NHANES, 2009–2014) database. Logistic regression was performed to evaluate associations between micronutrient intake and periodontitis after propensity score matching (PSM), and restricted cubic splines (RCS) analysis was conducted to explore the dose–response associations. Following PSM, 5530 participants were included in the RCS analysis. The risk of periodontitis was reduced with sufficient intake of the following micronutrients: vitamin A, vitamin B1, vitamin B2, and vitamin E. In addition, the risk of periodontitis was increased with excessive intake of the following micronutrients: vitamin B1 (1.8 mg/day, males; 1.3 mg/day, females), vitamin C (90 mg/day, males), and copper (1.1 mg/day, combined). In conclusion, a linear association was found between vitamin A, vitamin B2, vitamin C, and copper and periodontitis—namely, a sufficient intake of vitamin A and vitamin B2 might help reduce the prevalence of periodontitis; by contrast, a high intake of vitamin C and copper increased the risk. In addition, a nonlinear dose–response association was found for the incidence of periodontitis with vitamin B1 and vitamin E. When within reasonable limits, supplemental intake helped reduce the prevalence of periodontitis, while excessive intake did not help significantly and might even increase the risk. However, confounding factors, such as health awareness, should still be considered.

1. Introduction

Periodontitis is a common chronic inflammatory condition that affects the tissues surrounding the teeth, leading to pocket formation, movement, bone loss, and eventually tooth loss [1,2,3]. In addition to its impact on periodontal tissues, periodontitis is closely associated with the progression of chronic diseases that pose substantial health and financial burden [4,5,6], including diabetes, hypertension, Alzheimer’s disease, and coronary heart disease [7,8,9,10,11]. Prevention and control of the occurrence and development of periodontitis is a pressing concern [12,13,14]. In addition to common risk factors, such as smoking, alcohol consumption, high blood sugar, and high blood pressure [9,15,16,17,18], the close relationship between diet, sleep, mental health, and periodontitis has become a growing research topic in recent years [19,20,21,22,23,24,25,26].
Dietary intake and nutritional supplements are important means for the body to obtain nutrients and maintain normal functioning. The association between micronutrient intake and disease has received widespread attention [27,28,29,30,31,32,33,34,35,36]. Micronutrients [29,30,32,36], which are essential compounds in human metabolism, play extremely important roles in metabolism, growth, development, and health [37,38,39]. Insufficient intake of certain vitamins or minerals can cause physiological disorders and diseases [40,41,42,43]. A previous cross-sectional study conducted in a US population showed that inadequate dietary intake of some micronutrients was statistically significantly associated with the severity of periodontitis [44]. Another study from the same population showed that inadequate dietary calcium intake was strongly associated with periodontitis risk [45]. Differences were likewise found in a cross-sectional study conducted in Denmark, which demonstrated that inadequate dietary calcium intake was associated with periodontitis (in contrast to vitamin D) [46]. A recent review of nutritional studies has highlighted micronutrient deficiencies as risk factors for periodontitis [47,48].
There is substantial evidence supporting a strong association between periodontitis and micronutrient intake [49,50,51,52,53,54,55]. Varied studies have been conducted in different directions to evaluate the association between periodontitis and micronutrient intake [45,56,57,58,59,60]. Existing studies tend to explore the correlation using linear models, showing that associations between micronutrient intake and some other diseases were complex and nonlinear [61,62,63,64,65,66,67]. Despite these findings, we believe that these studies may have overlooked the potential nonlinear dose–response association between micronutrient intake and periodontitis. Therefore, the aim of this study was to screen for micronutrients associated with periodontitis risk using logistic regression after reducing the effect of covariates using propensity score matching (PSM) [68]. Logistic regression and restricted cubic splines (RCS) were used to explore dose–response associations between screened micronutrient intake levels and periodontitis risk.

2. Materials and Methods

This study was conducted according to the Strengthening the Reporting of Observational Studies in Epidemiology-Nutritional Epidemiology (STROBE) guidelines [69].

2.1. Study Design and Population

The National Health and Nutrition Examination Survey (NHANES) is a cross-sectional study designed to assess the health and nutritional status of adults and children in the United States over time. More specifically, this survey examines a nationally representative sample of approximately 5000 people each year.
The NHANES collects periodontal examination data for those aged >30 years. Herein, we examined subjects with periodontal examination data who participated in three NHANES cycles from 2009–2010 to 2013–2014. Specifically, we included participants who completed a periodontal examination and had two complete records of 24 h dietary intake data during this period. Notably, participants who were pregnant or breastfeeding were excluded [28,29]. Detailed eligibility criteria are shown in the Supplementary Information. The NHANES dataset was reviewed and approved by the Centers for Disease Control (CDC) and the National Center for Health Statistics (NCHS) ethics review committees, and all subjects provided their written informed consent prior to participation (https://www.cdc.gov/nchs/nhanes/irba98.htm). This study was conducted in accordance with the principles of the Declaration of Helsinki and its later amendments. Details of the relevant data collection and extraction processes can be found at https://www.cdc.gov/nchs/nhanes/index.htm.

2.2. Periodontal Examination

A full-mouth periodontal examination was performed on NHANES participants aged ≥30 years between 2009 and 2014. All dental examiners were trained and calibrated by the reference examiner for the survey [70]. Gingival recession and periodontal pocket depths were measured using periodontal probes at six sites on the teeth, and clinical attachment loss was calculated [70]. NHANES researchers referred to the consensus recommendations of the CDC for epidemiological studies and the American Academy of Periodontology Prevention for the diagnosis of periodontitis in conducting this research [71,72].
In the present study, we categorized those with moderate and severe periodontitis into the periodontitis category; those with mild or no periodontitis were grouped into a referent category, to mitigate the risk of bias due to a potentially excessive prevalence of mild periodontitis in the population [73]. Severe/moderate periodontitis was defined as follows:
  • ≥2 Interproximal sites with a clinical attachment loss (CAL) of ≥4 mm;
  • ≥2 Interproximal sites with a periodontal probing depth of ≥5 mm.
Participants who met one or more of the above two criteria were classified as patients with severe/moderate periodontitis. Referring to previous studies, we excluded edentulous patients and those without complete periodontal examinations [16,74,75].

2.3. Micronutrient Intake

The names of the vitamin micronutrients were in a unified format for more convenient statistical analysis and comparison. The vitamins included in the study were vitamin A, vitamin B1 (thiamine), vitamin B2 (riboflavin), vitamin B3 (niacinamide), vitamin B6, vitamin B9 (folic acid), vitamin B12, vitamin C, and vitamin E. The minerals included calcium, copper, iron, magnesium, phosphorus, potassium, selenium, sodium, and zinc.
Micronutrient intake included both dietary intake and dietary supplement intake [30]. Nutritional intake of foods was assessed via 24 h dietary recall at the time of the study interview. Nutritional values were determined using the Food and Micronutrient Database for Dietary Studies (FNDDS, 1.0) [30]. FNDDS provides the nutritional values of each food and beverage reported by NHANES. Calculation of micronutrient intake was based on the type and amount of food consumed.
NHANES participants also reported the dietary supplements they had taken in the past 30 days in an internal interview. For each micronutrient, the daily dose was calculated by combining product information on the frequency of use, ingredients, quantities, and units per serving. The intake of each product was summarized to estimate the total daily dose of each micronutrient for each participant.
The total daily intake of micronutrients was obtained by summing the average of two 24 h dietary data points and the average daily intake of dietary supplements [30]. We also compared our findings to the Dietary Reference Intakes (DRIs), published by the Food and Nutrition Board of the Institute of Medicine in 2006. Inadequate micronutrient intake was defined as a total intake below the recommended dietary allowance (RDA) or adequate intake (AI) levels specified in the DRIs [76]. The classification criteria for inadequate intake are listed in the Supplementary Information (Table S1).

2.4. Covariates

Study covariates were as follows: age, gender, education level, income, physical activity, smoking status, alcohol intake, obesity, diabetes, hypertension (HTN), and hyperlipidemia (HPL) [74]. Education level was divided into the following categories: those not graduating from high school, high school graduates, those with some college education, and college graduates [75,77]. Income was categorized into three levels based on the household income-to-poverty ratio (IPR): ≤1.30, 1.31–3.50, and >3.50 [34]. Physical activity was classified dichotomously (i.e., as performing physical activity or not performing the physical activity) [34]. Smoking status was divided into never, former, and active smoker categories. Drinkers and nondrinkers were classified according to previously reported criteria [78]. We used body mass index (BMI) as a measure of obesity (in kg/m2), according to World Health Organization (WHO) guidelines. Diabetes was defined according to self-reported diabetes (on the study questionnaire) or a glycated hemoglobin level of >6.5%. Patients with systolic blood pressure (SBP) of ≥140 mmHg and/or diastolic blood pressure (DBP) of ≥90 mmHg on physical examination, and/or participants taking antihypertensive medications were considered to have hypertension [79]. Hyperlipidemic patients had a total cholesterol level of ≥240 mg/dL and/or a low-density lipoprotein (LDL) cholesterol level of ≥130 mg/dL. More detailed and additional covariate classifications, along with reference sources, are provided in the Supplementary Information (File S1).

2.5. Statistical Analysis

Participants were screened according to the specified study inclusion criteria. We evaluated differences in covariates between participants with moderate/severe periodontitis and those with mild/no periodontitis using rank-sum tests for continuous variables and chi-square tests for categorical variables. Interpolation of missing data using multivariate interpolation of chained equations (MICE, predicting mean matching) was used for continuous variables, and Bayesian multivariate logistic regression was used for categorical variables [80,81].
Logistic regression was used to estimate the associations between vitamin and mineral intake (and whether or not intake was inadequate) and periodontitis. Propensity score matching (PSM) was used to match the characteristics of the study covariates to avoid unbalanced distributions of covariates that could affect the reliability of our findings [68,82].
Four models were built based on adjustments for the different covariates. Model 0 did not adjust for any covariates; Model 1 was a multifactorial logistic regression model adjusting for all 11 covariates mentioned above; Model 2 used PSM to balance covariates, including smoking, alcohol, and physical activity, with multifactorial logistic regression adjusting for age, gender, educational level, income, BMI, diabetes, HPL, and HTN; and Model 3 used PSM to balance all 11 covariates (see Table S2 for details on the adjusted covariates for each model).
Due to the order of magnitude differences in the intake of each micronutrient, the units of intake were converted and adjusted for easy comparison in a logistic regression of continuous variables, as shown in Table S3. Micronutrients showing statistically significant differences in intake levels (continuous variables) or inadequate intakes (categorical variables) in the PSM-matched single-factor logistic regression were collated, and the stability of the results was tested using multifactorial logistic regression.
More evaluations were conducted on the study data following PSM adjusted for the 11 covariates mentioned above (Model 3). We identified micronutrients with statistically significant differences in intake levels (continuous variables) or inadequate intake (categorical variables) based on PSM-matched single-factor logistic regression. The effect of outliers was excluded using Tukey’s test [83,84]. A multifactorial logistic regression of micronutrient intake was performed and tested for nonlinearity.
In the present study, we used RCS functions to determine the risk points and correlation trends for each micronutrient. An RCS function with adjusted logistic regression was used to analyze dose–response associations between micronutrient intake and periodontitis risk. The results were compared with DRIs, and subgroup analyses were performed according to the reference values provided by the DRIs in reference to different genders or ages.
All data extraction, analysis, and plotting of images were performed using R statistical software (version 4.1.1; The R Project for Statistical Computing, Vienna, Austria). We used the “mice” package to impute the missing values, the “glm” package for logistic regression, the “matching” package for PSM, the “rms” package for RCS, and the “tableone” and “ggplot2” packages for table and graph plotting. Statistical significance was set at an α of <0.05.

3. Results

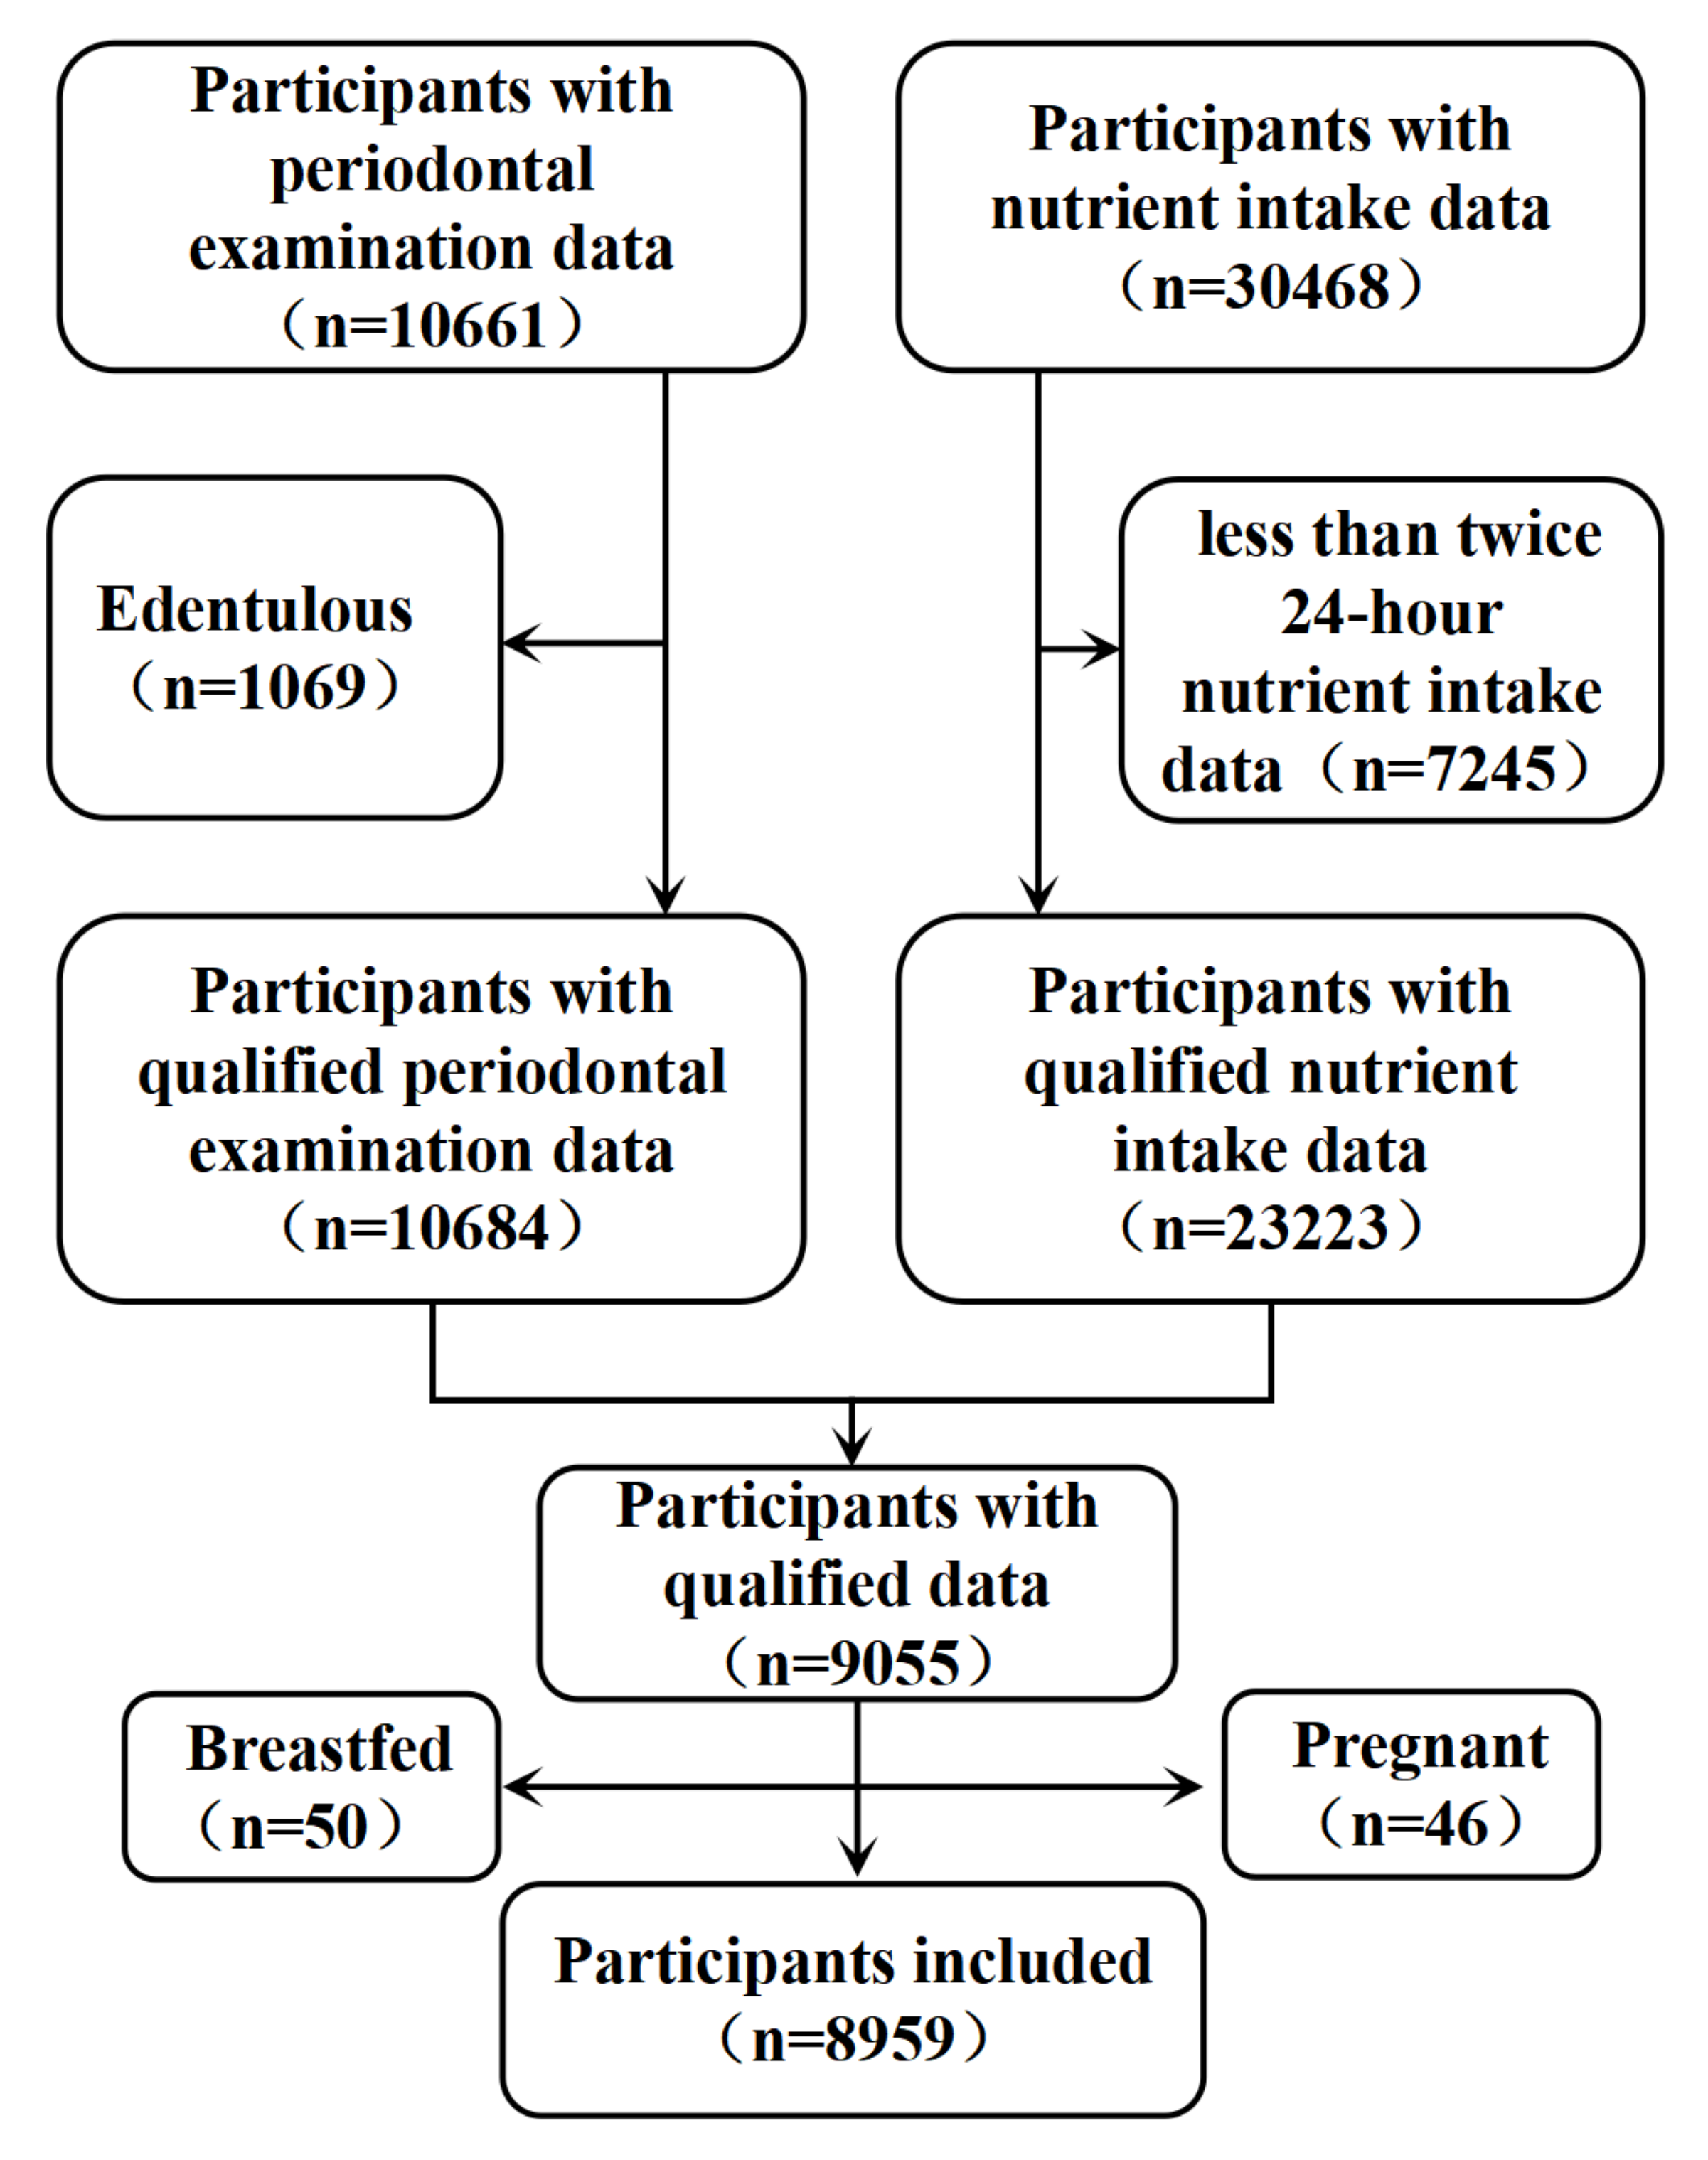
3.1. Data Collection

Figure 1 shows the flowchart of participant inclusion. Between 2009 and 2014, a total of 11,753 patients in the NHANES recorded periodontal examination data. After excluding edentulous patients, 10,684 participants had qualifying periodontal examination data. Moreover, 30,468 patients recorded 24 h diet and dietary supplement interview data, of whom 7245 participants recorded fewer than two 24 h dietary interviews. Therefore, dietary intake and dietary supplement data were ultimately included from only 23,223 participants. Moreover, after integrating participants with both periodontal examinations and dietary/dietary supplement intake information and excluding 46 pregnant and 50 breastfeeding participants, 8959 participants were included in the current study in total.

3.2. Descriptive Characteristics and Periodontal Disease

Table 1 shows a descriptive summary of the medical and demographic characteristics of the 8959 included participants with periodontitis, compared with those without periodontitis. This study enrolled 4965 participants with no or mild periodontitis and 3994 moderate/severe periodontitis patients. After filling the missing values, missing data were identified in 766 patients with no or mild periodontitis and 607 patients with moderate/severe periodontitis. The statistical results showed higher mean ages and BMI values of patients in the periodontitis group, and that periodontitis was more prevalent in men, as well as in people with lower education and income levels. Smoking, hypertension, hyperlipidemia, and diabetes were strongly associated with the development of periodontitis.

3.3. Description of the Four Models Using Logistic Regression and PSM

Statistical analyses were performed separately for each micronutrient intake parameter (continuous variables) and for measures of intake adequacy (categorical variables) according to the four previously designed and described models (Table S2). The bubble plots in Figure 2A summarize the results of the correlations between micronutrient intake and periodontitis for each model, with the size of the circle representing the magnitude of the p-value and the color of the circle representing the odds ratio (OR). Vitamin B1, vitamin B2, vitamin E, and calcium were statistically significantly and negatively correlated with periodontitis risk in all models, and vitamin C was statistically significantly positively correlated with periodontitis risk in Models 2 and 3. The negative associations between vitamin A, vitamin B9, magnesium, phosphorus, and potassium intake and periodontitis became less significant with increasing covariates included in PSM. The results for the categorical variables, reported in Figure 2B, were similar to those for the continuous variables. Associations with vitamin C and calcium intakes were not statistically significant in Model 3, whereas inadequate copper intake was shown to raise the risk of periodontitis.

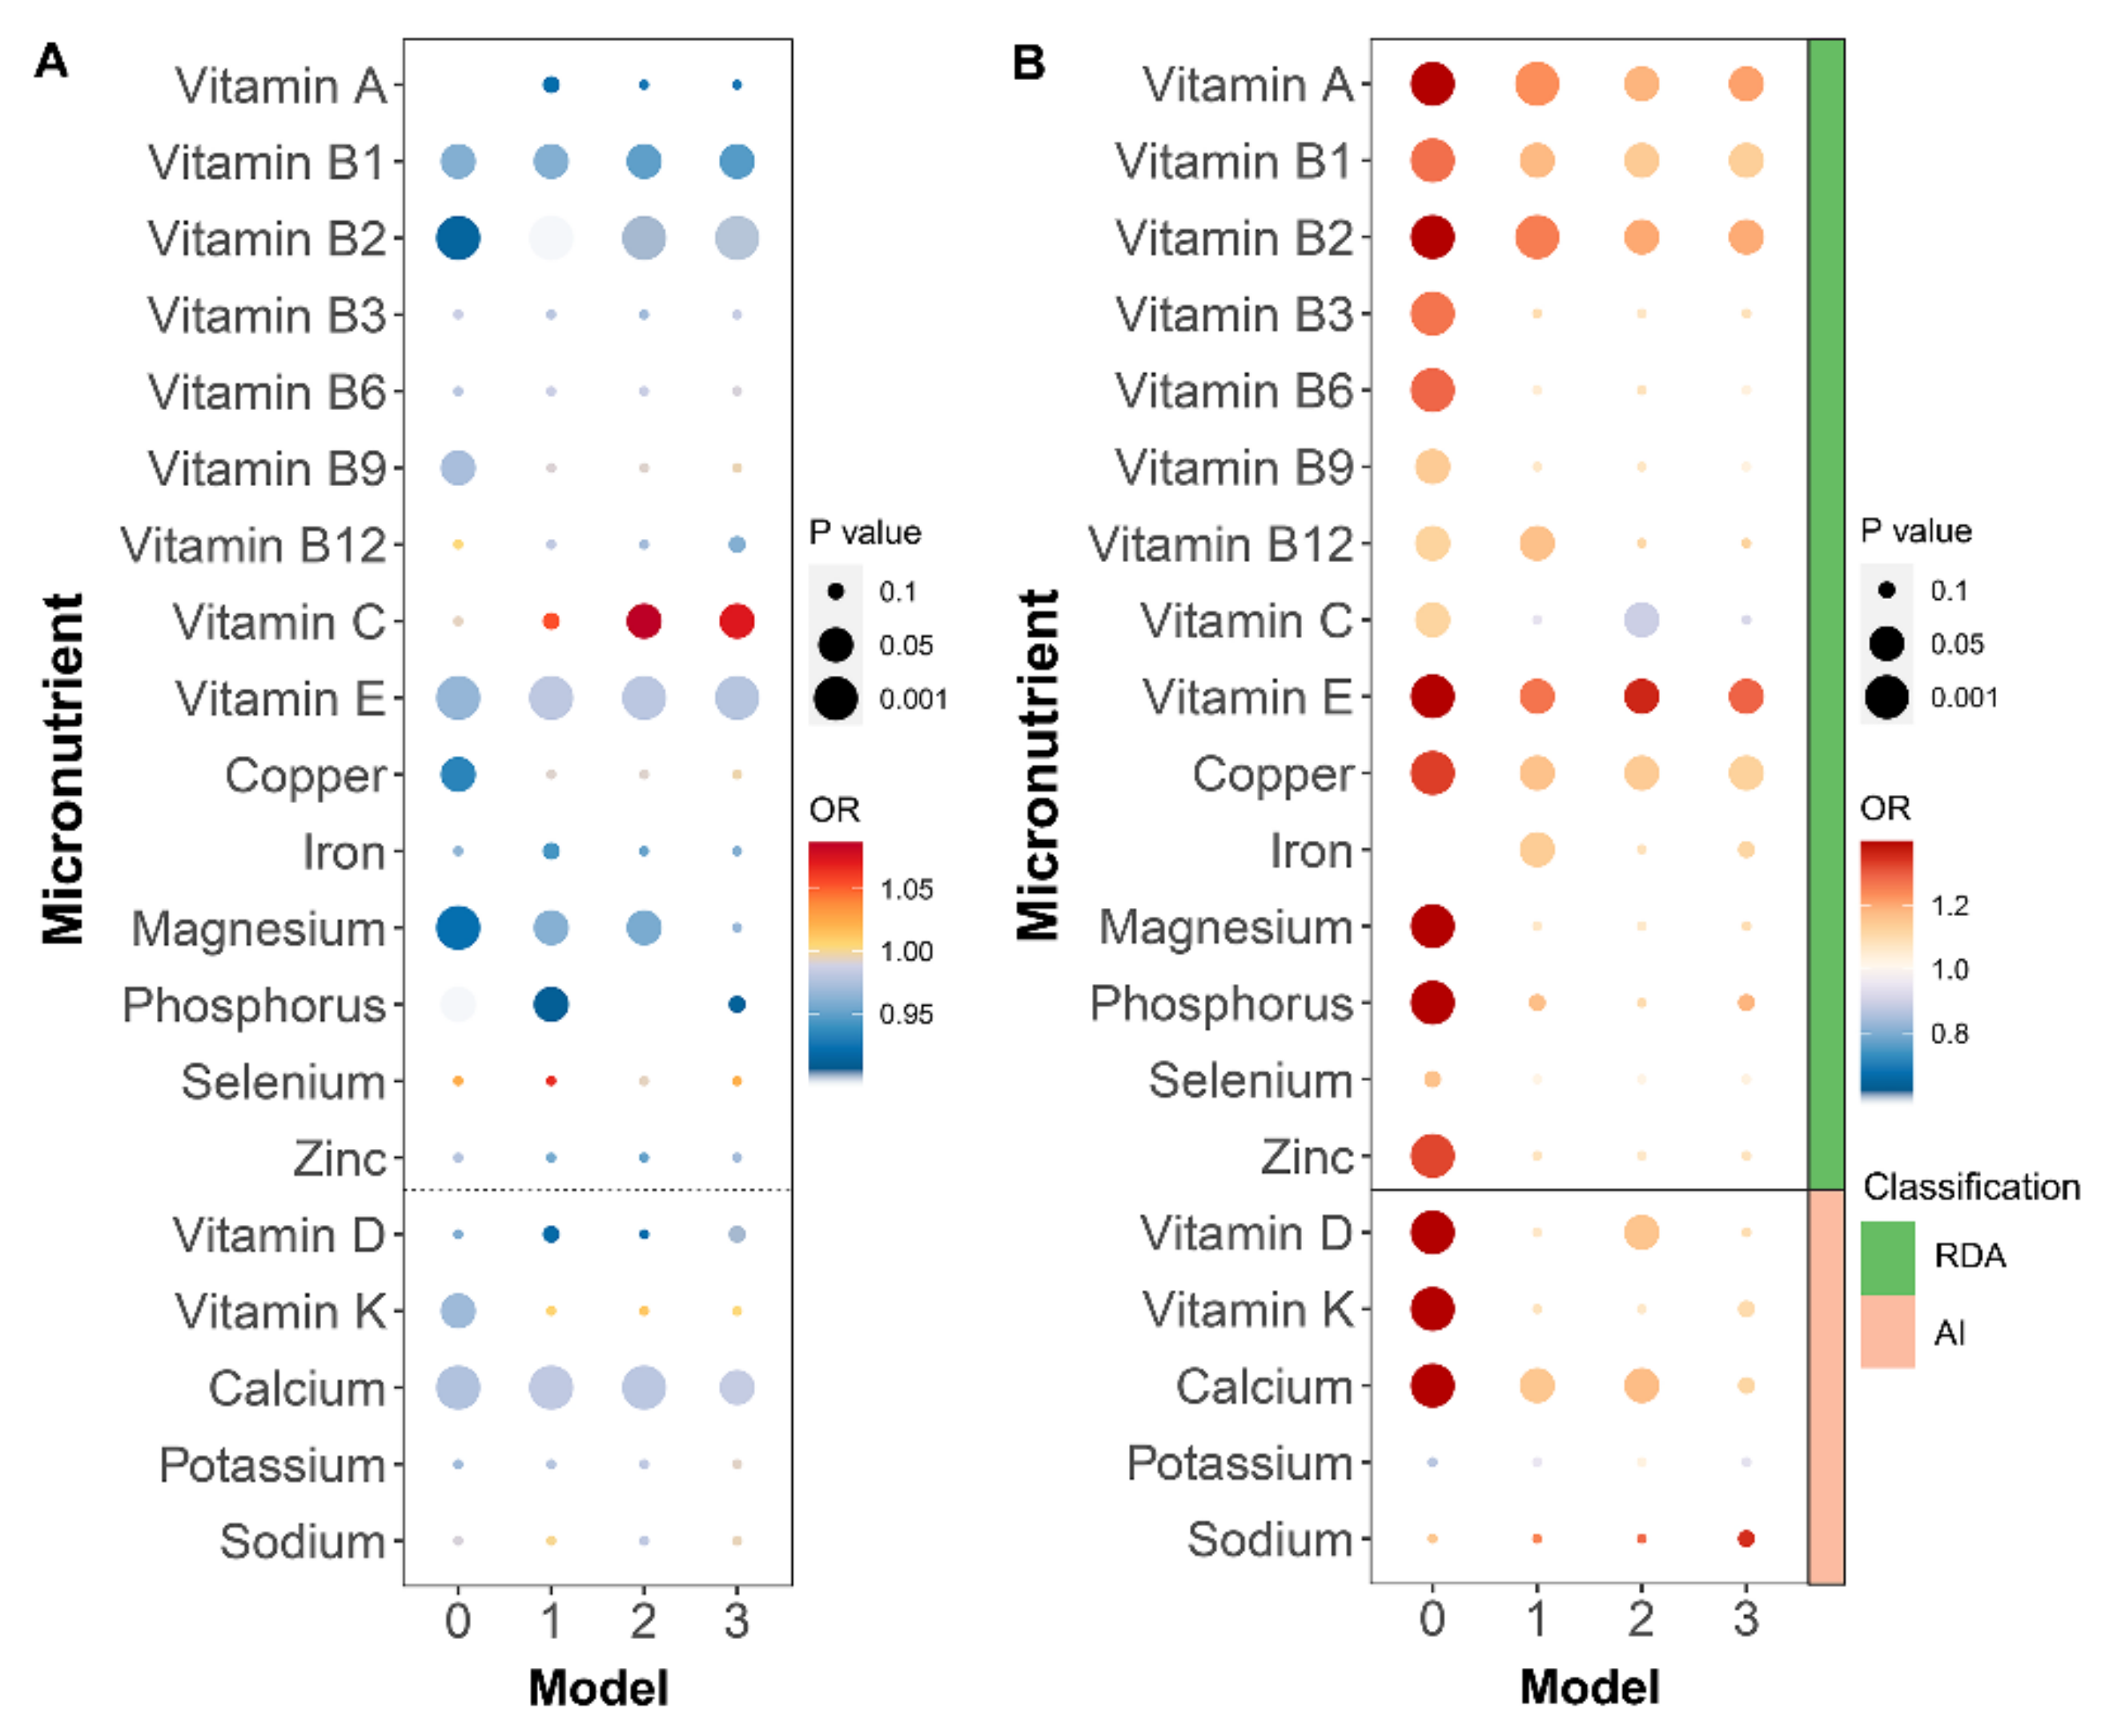
3.4. Characteristics of Micronutrients

Model 3 matched the 11 aforementioned covariates. After matching, 5530 participants were included—half with no or mild periodontitis and the other half with moderate/severe periodontitis. Table S4 presents information on continuous variables representing micronutrient intake after matching the 11 covariates. Table S5 shows the relevant characteristics of the categorical variables. Forest plots were drawn for the continuous and categorical variables after matching (Model 3), and the results are shown in Figures S1 and S2. Among the continuous variables, higher intakes of vitamin B1, vitamin B2, vitamin E, and calcium reduced the risk of periodontitis. Higher intake of vitamin C, on the other hand, increased the risk of periodontitis. Among the categorical variables, insufficient intake of vitamin A, vitamin B1, vitamin B2, and copper increased the risk of periodontitis. The results of the multifactorial logistic regression analysis incorporating seven statistically significant micronutrients as described above, including both continuous and categorical variables, were similar to the previously reported one-way logistic regression results (indicating stable model results). The forest plot depicting these data is shown in Figure 3.

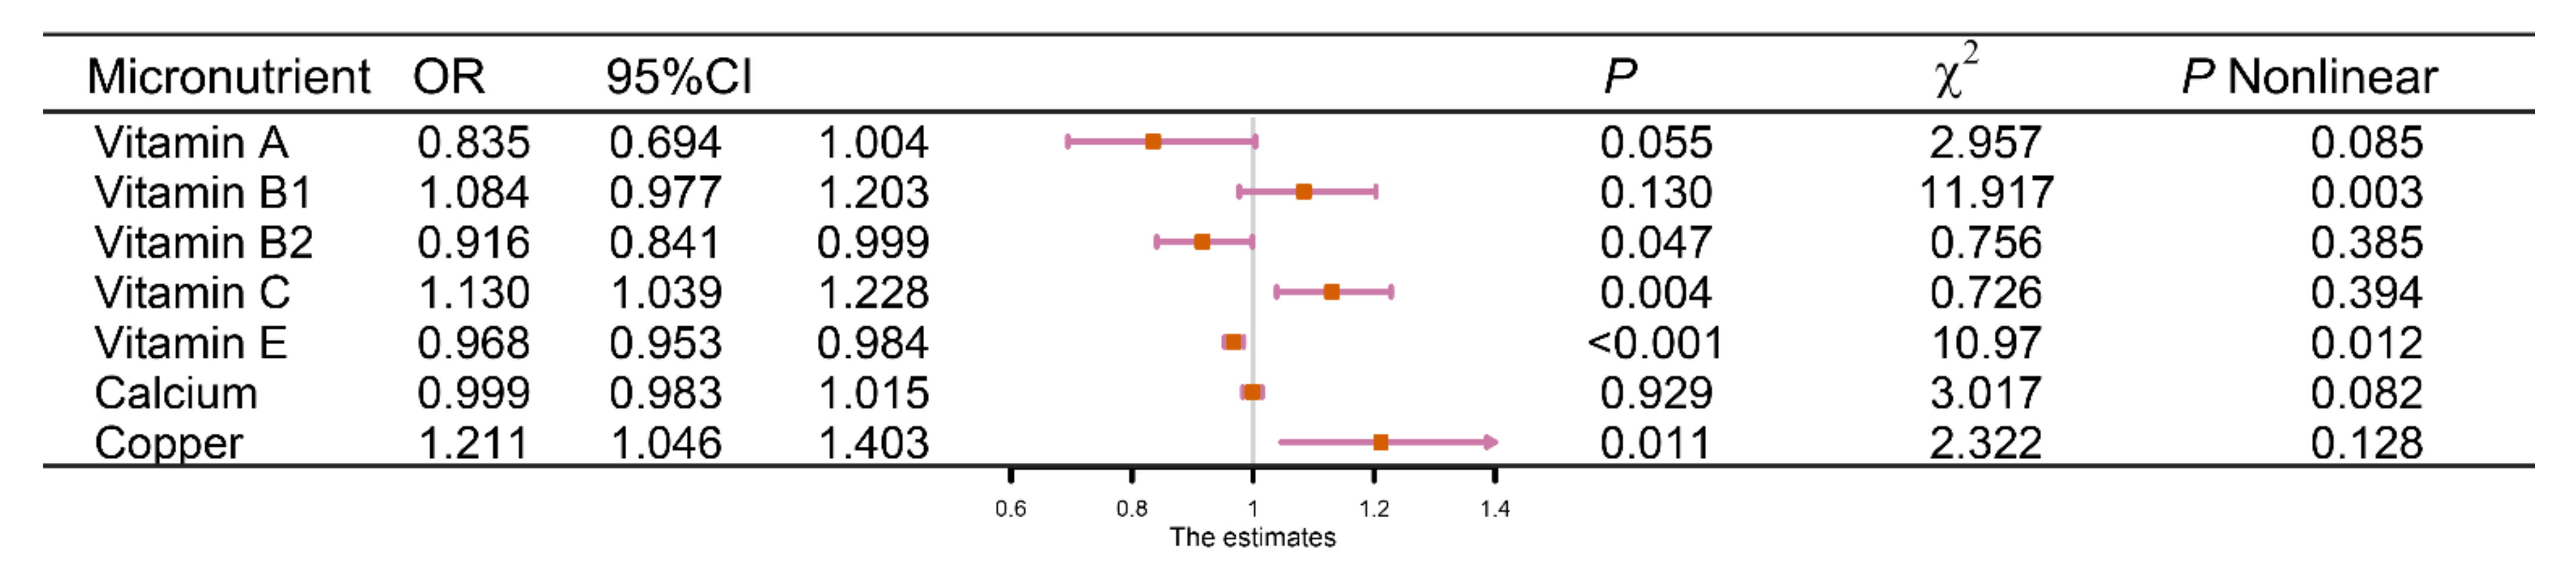
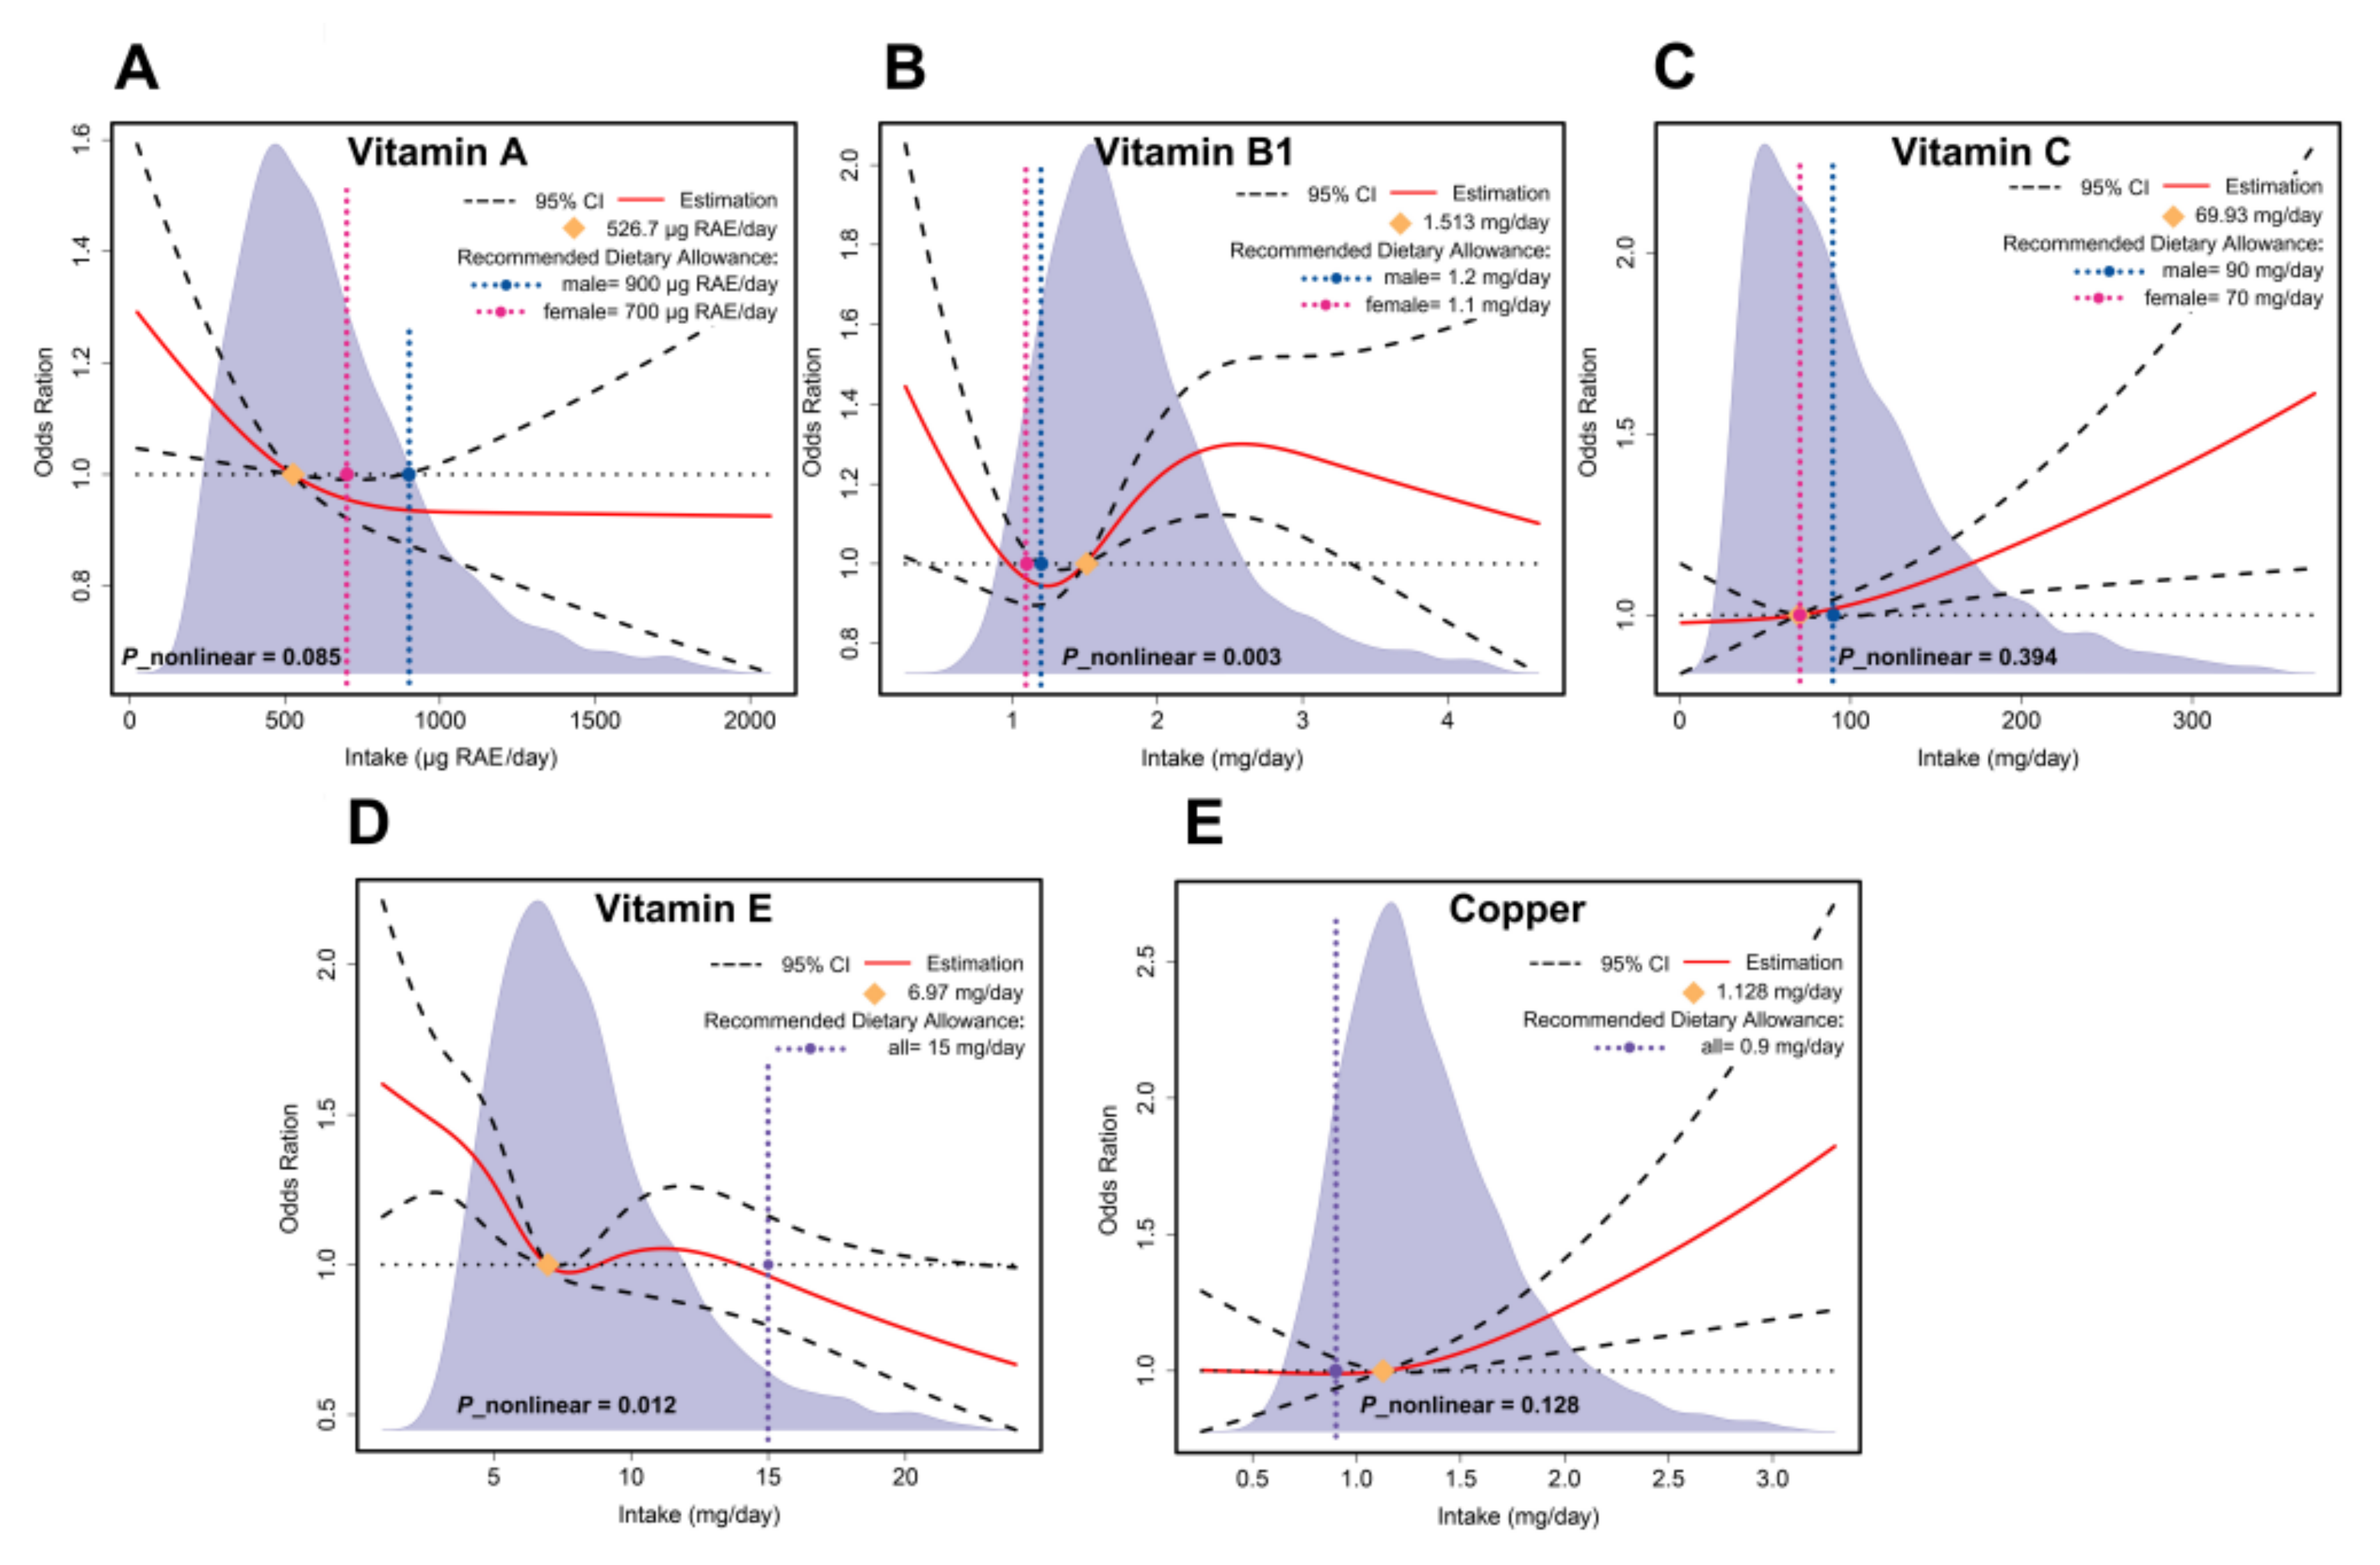
3.5. Dose–Response Effect Examination

Restricted cubic spline functions incorporated seven micronutrients that differed statistically significantly between categorical or continuous variables. Figure 4 shows the dose–response effect examination results for vitamins A, B1, C, and E, as well as copper. The results for the remaining micronutrients are shown in Figure S3. The overall dose–response effect examination results showed that vitamin A intake was linearly and negatively associated with the risk of periodontitis, and sufficient vitamin A intake reduced the risk of periodontitis (526.7 μg RAE (retinol activity equivalents)/day). Excessive vitamin C intake was linearly and positively correlated with an increased risk of periodontitis; however, vitamin C did not increase the risk of periodontitis if intake was within the recommended intake value (RDA). Vitamin B1, vitamin E, and copper showed complex non-linear relationships. Unlike vitamin E intake, which consistently tended to reduce the risk of periodontitis, a higher intake of vitamin B1 prior to the risk point (1.513 mg/day) reduced the risk of periodontitis. In contrast, an increased intake of vitamin B1 above the risk point increased the risk.

3.6. Subgroup Analyses

Figure 5 shows the results of subgroup analyses stratified by age or gender according to the reference threshold of the DRI. For women, adequate vitamin A intake (>491 μg RAE/day) reduced the risk of periodontitis. Associations with vitamin B1 intake were more complex. For males only, an appropriate intake (1.2–1.7 mg/day) was beneficial in reducing the risk of periodontitis, whereas only excess intake (1.3 mg/day) exacerbated the risk for females. Adequate intake of vitamin B2 (2.2 mg/day) in men was beneficial for reducing risk. Additionally, men were found to consume excessive amounts of vitamin C (90 mg/day). More data related to the subgroup analysis can be found in Figure S4.

4. Discussion

In the present study, the dose–effect relationship between micronutrients and periodontitis was investigated. We found a nonlinear association between the intake levels of some micronutrients— namely, vitamins B1 and E—and the risk of periodontitis. Our findings suggest that the intake of various micronutrients (such as vitamin B1) within a certain range may be beneficial in reducing the risk of periodontitis, whereas excessive micronutrient intake may increase the risk of periodontitis.
In addition to vitamin B1, multifactorial logistic regression following PSM, and RCS showed that intake within the recommended range of vitamin A and vitamin E levels reduced the risk of periodontitis, while excessive copper intake increased periodontitis risk; this is consistent with the results of previous studies [41,48,51,52]. In addition, our study also showed some results that differed from previous studies; for instance, in our study, excessive vitamin C intake increased periodontitis risk, whereas the results of a previous study conducted in the same population showed vitamin C to be a promoter of periodontal health [41,48].
We note that, in the current study, many micronutrient intake deficiencies were associated with a higher incidence of periodontitis when not adjusted for covariates. However, with progressively increasing adjustments for the 11 covariates described above, these statistically significant associations largely became statistically insignificant. We suggest that the statistically significant correlations present in the unadjusted data may arise from the influence of covariates, thus exaggerating associations between micronutrients and periodontitis; this could potentially explain the contradictory results between our study and those reported in previous investigations [44,45,46,47].
Notably, copper intake reduced the risk of periodontitis with regard to the evaluated categorical variables and likewise increased the risk of periodontitis in multivariate logistic regression analyses incorporating continuous variables. Both findings were consistent with our RCS results. This shows the limitations of using purely categorical variables, which may yield different or even opposite results if dose–response correlations are not explored. It is noteworthy that insufficient intake of both vitamin A and vitamin E occurs in over 50% of the population, and the detected associations between supplementation of these two vitamins and the prevention and treatment of periodontitis need to be taken very seriously.
In our subgroup analyses, threshold evaluations and nonlinear relationships differed according to gender and age, and we believe that the effect of the intake of different nutrients on the risk of periodontitis differs between genders or age groups (based on our work and the results of prior studies) [51,83]. Additional studies are needed to investigate this question more comprehensively. In addition, there was a trend of direct correlations between the intake levels of some micronutrients and periodontitis (e.g., for vitamin B2 intake in women), but the ORs and associated confidence intervals were not considered statistically significant. This may be due to our modest sample size, and therefore, a study enrolling a larger population is needed to determine this correlation trend.
Given the results of this and previous studies, we suggest that micronutrients are closely related to the biological mechanisms of periodontitis through mechanistic pathways, including those related to oxidative stress, inflammation, collagen structure, and bone mineralization. Since many micronutrients have roles in innate and adaptive immune responses (in particular, playing crucial roles in the immune response to oral biofilms), there is great potential with regard to nutritional research in the field of periodontitis prevention and treatment [48,67]. The potential risks and benefits of micronutrients in relation to periodontal health need to be evaluated more comprehensively in future research.
Our study has the following strengths. First, it is the first such study conducted to date that used RCS to explore the correlation between periodontitis and micronutrient intake. This breaks the tradition of evaluating simplistic “favorable” or “harmful” relationships between periodontitis and vitamin intake. Instead, we extended prior research by investigating favorable ranges of micronutrient intake levels as well as evaluating the threshold above which intake is harmful. This has helped in exploring these complex associations more deeply. Second, our study data were based on a nationally representative sample of US adults and were collected using a validated study design and methodology, including adjusting for 11 covariates to exclude as many confounding factors as possible from our evaluation. Third, the present study, which builds on previous studies, is the first investigation to explore the association between micronutrients and periodontitis using a randomization design performed with PSM to better correct for confounding factors (such as selection bias). Finally, we used both continuous variables (representing total micronutrient intake) and categorical variables (representing intake adequacy) to screen for eligible (i.e., statistically significant) micronutrients before using RCS to explore trends in correlations to make the interpretation of our results more reliable.
In addition to these strengths, this study has several limitations. First, dietary supplement intake was averaged to a daily amount using the results of a recall interview from the previous 30 days and daily food intake based on NHANES, which incorporates two 24 h dietary recalls. This may not reflect the actual daily intake. In addition, micronutrient intake was self-reported; therefore, micronutrient levels in blood samples are needed for future analysis. Second, although the use of PSM reduced the bias of estimates, a larger sample size is needed. Third, a cross-sectional design is inadequate for establishing causality. As such, a cohort study is needed in the future. Fourth, our study did not consider confounding factors of health awareness on outcomes. This is important as participants’ different health awareness may have influenced their micronutrient intake. Finally, after grouping and implementing RCS according to gender and age, we found that micronutrients showing an overall linear relationship may show a nonlinear relationship with periodontitis after grouping and that the opposite trend occurs as well; therefore, our findings should be interpreted with caution.

5. Conclusions

This study found a significant association between vitamin B1, vitamin B2, vitamin C, vitamin A, vitamin E, and copper and periodontitis. To the best of our knowledge, this was the first study to report a nonlinear dose–response for the incidence of periodontitis with vitamin B1 and vitamin E. When within reasonable limits, supplemental intake helped reduce the prevalence of periodontitis; however, excessive intake did not significantly help and might even increase the risk. In addition, there was a linear association between vitamin A, vitamin B2, vitamin C, and copper and periodontitis, where sufficient intake of vitamin A and vitamin B2 helped reduce the prevalence of periodontitis. However, high intakes of vitamin C and copper increased the risk. Adjusting micronutrient intake might help prevent and treat periodontitis.

Supplementary Materials

The following supporting information can be downloaded at: https://0-www-mdpi-com.brum.beds.ac.uk/article/10.3390/nu14122466/s1, File S1: Details for eligibility criteria and covariates classification, Figure S1: Forest plots for the association between micronutrient and periodontitis (continuous variables) after PSM, Figure S2: Forest plots for the association between micronutrient and periodontitis (categorical variables) after PSM, Figure S3: The Dose–response effect examination results for the remaining micronutrients, Figure S4: the RCS results of subgroup analysis, Table S1: The classification criteria for inadequate intake, Table S2: Details for the four models adjusted by logistic regression and PSM, Table S3: Details for the micronutrient’s intake unit’s adjustment, Table S4: Information on continuous variables representing micronutrient intake after matching the 11 covariates, Table S5: The relevant characteristics of the categorical variables after matching the 11 covariates.

Author Contributions

Conceptualization, W.L. and H.X.; methodology, W.L., J.P., and H.X.; software, W.L., Q.S., and D.Y.; validation, W.L. and H.X., and Q.S.; formal analysis, W.L. and H.X.; investigation, W.L. and H.X.; resources, W.L., H.Z., and H.X.; data curation, W.L. and H.X.; writing—original draft preparation, W.L. and H.X.; writing—review and editing, W.L. and H.X.; visualization, W.L. and H.X.; supervision, H.Z., Q.C., and H.X.; project administration, H.Z. and Q.C.; funding acquisition, Q.C. All authors have read and agreed to the published version of the manuscript.

Funding

This research was funded by the National Natural Science Foundation of China, grant number GM 82001059 and 81991500.

Institutional Review Board Statement

This study was conducted in accordance with the Declaration of Helsinki and approved by the National Center for Health Statistics (NCHS) Research Ethics Review Board (ERB) Approval. Protocol Number: NHANES 2009–2010: Continuation of Protocol #2005-06; NHANES 2011–2012: Protocol #2011-17; NHANES 2013–2014: Continuation of Protocol #2011-17.

Informed Consent Statement

Informed consent was obtained from all subjects involved in the study.

Data Availability Statement

The data used for this study, though not available in a public repository, will be made available to other researchers upon reasonable request.

Acknowledgments

We appreciate Lin Li’s guidance on the direction of this study related to periodontitis. We would like to thank the staff of NHANES for their support in providing the data in this study.

Conflicts of Interest

The authors declare no conflict of interest.

References

  1. Almoshari, Y.; Ren, R.; Zhang, H.; Jia, Z.; Wei, X.; Chen, N.; Li, G.; Ryu, S.; Lele, S.M.; Reinhardt, R.A.; et al. GSK3 inhibitor-loaded osteotropic Pluronic hydrogel effectively mitigates periodontal tissue damage associated with experimental periodontitis. Biomaterials 2020, 261, 120293. [Google Scholar] [CrossRef] [PubMed]
  2. Li, W.; Xu, J.; Zhang, R.; Li, Y.; Wang, J.; Zhang, X.; Lin, L. Is periodontal disease a risk indicator for colorectal cancer? A systematic review and meta-analysis. J. Clin. Periodontol. 2021, 48, 336–347. [Google Scholar] [CrossRef] [PubMed]
  3. Rojas, C.; Garcia, M.P.; Polanco, A.F.; Gonzalez-Osuna, L.; Sierra-Cristancho, A.; Melgar-Rodriguez, S.; Cafferata, E.A.; Vernal, R. Humanized Mouse Models for the Study of Periodontitis: An Opportunity to Elucidate Unresolved Aspects of Its Immunopathogenesis and Analyze New Immunotherapeutic Strategies. Front. Immunol. 2021, 12, 663328. [Google Scholar] [CrossRef] [PubMed]
  4. Chen, M.X.; Zhong, Y.J.; Dong, Q.Q.; Wong, H.M.; Wen, Y.F. Global, regional, and national burden of severe periodontitis, 1990-2019: An analysis of the Global Burden of Disease Study 2019. J. Clin. Periodontol. 2021, 48, 1165–1188. [Google Scholar] [CrossRef]
  5. Hewlett, S.A.; Anto, F.; Blankson, P.K.; Tormeti, D.; Ayettey-Adamafio, M.; Bayitse, P.; Danso-Appiah, T.; Amoah, A.G. Periodontitis prevalence and severity in an African population: A cross-sectional study in the Greater Accra Region of Ghana. J. Periodontol. 2021, 93, 732–744. [Google Scholar] [CrossRef]
  6. Shungin, D.; Haworth, S.; Divaris, K.; Agler, C.S.; Kamatani, Y.; Keun Lee, M.; Grinde, K.; Hindy, G.; Alaraudanjoki, V.; Pesonen, P.; et al. Genome-wide analysis of dental caries and periodontitis combining clinical and self-reported data. Nat. Commun. 2019, 10, 2773. [Google Scholar] [CrossRef] [Green Version]
  7. Dietrich, T.; Jimenez, M.; Krall Kaye, E.A.; Vokonas, P.S.; Garcia, R.I. Age-dependent associations between chronic periodontitis/edentulism and risk of coronary heart disease. Circulation 2008, 117, 1668–1674. [Google Scholar] [CrossRef]
  8. Feng, Y.K.; Wu, Q.L.; Peng, Y.W.; Liang, F.Y.; You, H.J.; Feng, Y.W.; Li, G.; Li, X.J.; Liu, S.H.; Li, Y.C.; et al. Oral P. gingivalis impairs gut permeability and mediates immune responses associated with neurodegeneration in LRRK2 R1441G mice. J. Neuroinflamm. 2020, 17, 347. [Google Scholar] [CrossRef]
  9. Norhammar, A.; Kjellstrom, B.; Habib, N.; Gustafsson, A.; Klinge, B.; Nygren, A.; Nasman, P.; Svenungsson, E.; Ryden, L. Undetected Dysglycemia Is an Important Risk Factor for Two Common Diseases, Myocardial Infarction and Periodontitis: A Report from the PAROKRANK Study. Diabetes Care 2019, 42, 1504–1511. [Google Scholar] [CrossRef]
  10. Punthakee, Z. In type 2 diabetes with periodontitis, intensive periodontitis treatment improved glycemic control at 1 year. Ann. Intern. Med 2019, 170, JC40. [Google Scholar] [CrossRef]
  11. Schwahn, C.; Frenzel, S.; Holtfreter, B.; Van der Auwera, S.; Pink, C.; Bulow, R.; Friedrich, N.; Volzke, H.; Biffar, R.; Kocher, T.; et al. Effect of periodontal treatment on preclinical Alzheimer’s disease-Results of a trial emulation approach. Alzheimer’s Dement. 2022, 18, 127–141. [Google Scholar] [CrossRef] [PubMed]
  12. Kinane, D.F.; Stathopoulou, P.G.; Papapanou, P.N. Periodontal diseases. Nat. Rev. Dis. Primers 2017, 3, 17038. [Google Scholar] [CrossRef] [PubMed]
  13. Ni, C.; Zhou, J.; Kong, N.; Bian, T.; Zhang, Y.; Huang, X.; Xiao, Y.; Yang, W.; Yan, F. Gold nanoparticles modulate the crosstalk between macrophages and periodontal ligament cells for periodontitis treatment. Biomaterials 2019, 206, 115–132. [Google Scholar] [CrossRef] [PubMed]
  14. Parveen, S. Impact of calorie restriction and intermittent fasting on periodontal health. Periodontol. 2000 2021, 87, 315–324. [Google Scholar] [CrossRef]
  15. Genco, R.J.; Borgnakke, W.S. Risk factors for periodontal disease. Periodontol. 2000 2013, 62, 59–94. [Google Scholar] [CrossRef]
  16. Munoz Aguilera, E.; Suvan, J.; Orlandi, M.; Miro Catalina, Q.; Nart, J.; D’Aiuto, F. Association between Periodontitis and Blood Pressure Highlighted in Systemically Healthy Individuals: Results from a Nested Case-Control Study. Hypertension 2021, 77, 1765–1774. [Google Scholar] [CrossRef]
  17. Prokopidis, K.; Witard, O.C. Understanding the role of smoking and chronic excess alcohol consumption on reduced caloric intake and the development of sarcopenia. Nutr. Res. Rev. 2021, 1–10. [Google Scholar] [CrossRef]
  18. Sanders, A.; Slade, G. State cigarette excise tax, secondhand smoke exposure, and periodontitis in US nonsmokers. Am. J. Public Health 2013, 103, 740–746. [Google Scholar] [CrossRef]
  19. Azzi, D.V.; Viafara, J.A.S.; Zangeronimo, M.G.; Ribeiro Lima, R.; Marques, L.S.; Pereira, L.J. n-3 Ingestion may modulate the severity of periodontal disease? Systematic review. Crit. Rev. Food Sci. Nutr. 2018, 58, 1937–1942. [Google Scholar] [CrossRef]
  20. Blasco-Baque, V.; Garidou, L.; Pomie, C.; Escoula, Q.; Loubieres, P.; Le Gall-David, S.; Lemaitre, M.; Nicolas, S.; Klopp, P.; Waget, A.; et al. Periodontitis induced by Porphyromonas gingivalis drives periodontal microbiota dysbiosis and insulin resistance via an impaired adaptive immune response. Gut 2017, 66, 872–885. [Google Scholar] [CrossRef] [Green Version]
  21. Decker, A.M.; Kapila, Y.L.; Wang, H.L. The psychobiological links between chronic stress-related diseases, periodontal/peri-implant diseases, and wound healing. Periodontol. 2000 2021, 87, 94–106. [Google Scholar] [CrossRef] [PubMed]
  22. Hajishengallis, G.; Lamont, R.J. Polymicrobial communities in periodontal disease: Their quasi-organismal nature and dialogue with the host. Periodontol. 2000 2021, 86, 210–230. [Google Scholar] [CrossRef] [PubMed]
  23. Iwasaki, M.; Usui, M.; Ariyoshi, W.; Nakashima, K.; Nagai-Yoshioka, Y.; Inoue, M.; Kobayashi, K.; Nishihara, T. Sleep duration and severe periodontitis in middle-aged Japanese workers. J. Clin. Periodontol. 2022, 49, 59–66. [Google Scholar] [CrossRef] [PubMed]
  24. Johannsen, A.; Asberg, M.; Soder, P.O.; Soder, B. Anxiety, gingival inflammation and periodontal disease in non-smokers and smokers—An epidemiological study. J. Clin. Periodontol. 2005, 32, 488–491. [Google Scholar] [CrossRef]
  25. Wang, Y.X.; Kang, X.N.; Cao, Y.; Zheng, D.X.; Lu, Y.M.; Pang, C.F.; Wang, Z.; Cheng, B.; Peng, Y. Porphyromonas gingivalis induces depression via downregulating p75NTR-mediated BDNF maturation in astrocytes. Brain Behav. Immun. 2019, 81, 523–534. [Google Scholar] [CrossRef]
  26. Zhou, F.; Liu, Z.; Guo, Y.; Xu, H. Association of short sleep with risk of periodontal disease: A meta-analysis and Mendelian randomization study. J. Clin. Periodontol. 2021, 48, 1076–1084. [Google Scholar] [CrossRef]
  27. Bailey, R.L.; Fulgoni, V.L.; Taylor, C.L.; Pfeiffer, C.M.; Thuppal, S.V.; McCabe, G.P.; Yetley, E.A. Correspondence of folate dietary intake and biomarker data. Am. J. Clin. Nutr. 2017, 105, 1336–1343. [Google Scholar] [CrossRef] [Green Version]
  28. Berryman, C.E.; Lieberman, H.R.; Fulgoni, V.L., III; Pasiakos, S.M. Protein intake trends and conformity with the Dietary Reference Intakes in the United States: Analysis of the National Health and Nutrition Examination Survey, 2001–2014. Am. J. Clin. Nutr. 2018, 108, 405–413. [Google Scholar] [CrossRef]
  29. Chang, A.R.; Lazo, M.; Appel, L.J.; Gutierrez, O.M.; Grams, M.E. High dietary phosphorus intake is associated with all-cause mortality: Results from NHANES III. Am. J. Clin. Nutr. 2014, 99, 320–327. [Google Scholar] [CrossRef] [Green Version]
  30. Chen, F.; Du, M.; Blumberg, J.B.; Ho Chui, K.K.; Ruan, M.; Rogers, G.; Shan, Z.; Zeng, L.; Zhang, F.F. Association Among Dietary Supplement Use, Nutrient Intake, and Mortality Among U.S. Adults: A Cohort Study. Ann. Intern. Med. 2019, 170, 604–613. [Google Scholar] [CrossRef]
  31. Frampton, J.; Murphy, K.G.; Frost, G.; Chambers, E.S. Higher dietary fibre intake is associated with increased skeletal muscle mass and strength in adults aged 40 years and older. J. Cachexia Sarcopenia Muscle 2021, 12, 2134–2144. [Google Scholar] [CrossRef]
  32. Gu, X.; Tucker, K.L. Dietary quality of the US child and adolescent population: Trends from 1999 to 2012 and associations with the use of federal nutrition assistance programs. Am. J. Clin. Nutr. 2017, 105, 194–202. [Google Scholar] [CrossRef] [PubMed] [Green Version]
  33. Han, Y.Y.; Forno, E.; Shivappa, N.; Wirth, M.D.; Hebert, J.R.; Celedon, J.C. The Dietary Inflammatory Index and Current Wheeze Among Children and Adults in the United States. J. Allergy Clin. Immunol. Pract. 2018, 6, 834–841. [Google Scholar] [CrossRef] [PubMed]
  34. Lan, T.; Liu, B.; Bao, W.; Thorne, P.S. BMI modifies the association between dietary intake and serum levels of PCBs. Environ. Int. 2021, 156, 106626. [Google Scholar] [CrossRef] [PubMed]
  35. Mazidi, M.; Mikhailidis, D.P.; Sattar, N.; Toth, P.P.; Judd, S.; Blaha, M.J.; Hernandez, A.V.; Penson, P.E.; Banach, M.; International Lipid Expert, P.; et al. Association of types of dietary fats and all-cause and cause-specific mortality: A prospective cohort study and meta-analysis of prospective studies with 1,164,029 participants. Clin. Nutr. 2020, 39, 3677–3686. [Google Scholar] [CrossRef] [PubMed]
  36. Wang, W.; Gao, J.; Li, N.; Han, S.; Wu, L.; Zhang, Y.; Han, T.; Shan, R.; Li, Y.; Sun, C.; et al. Dietary iron and vitamins in association with mortality. Clin. Nutr. 2021, 40, 2401–2409. [Google Scholar] [CrossRef] [PubMed]
  37. Kumpitsch, C.; Fischmeister, F.P.S.; Mahnert, A.; Lackner, S.; Wilding, M.; Sturm, C.; Springer, A.; Madl, T.; Holasek, S.; Hogenauer, C.; et al. Reduced B12 uptake and increased gastrointestinal formate are associated with archaeome-mediated breath methane emission in humans. Microbiome 2021, 9, 193. [Google Scholar] [CrossRef] [PubMed]
  38. Mogire, R.M.; Mutua, A.; Kimita, W.; Kamau, A.; Bejon, P.; Pettifor, J.M.; Adeyemo, A.; Williams, T.N.; Atkinson, S.H. Prevalence of vitamin D deficiency in Africa: A systematic review and meta-analysis. Lancet Glob. Health 2020, 8, e134–e142. [Google Scholar] [CrossRef] [Green Version]
  39. Wang, Z.; Wang, M.; Finn, F.; Carr, B.I. The growth inhibitory effects of vitamins K and their actions on gene expression. Hepatology 1995, 22, 876–882. [Google Scholar] [CrossRef]
  40. Alessi, M.; Paul, T.; Scaiano, J.C.; Ingold, K.U. The contrasting kinetics of peroxidation of vitamin E-containing phospholipid unilamellar vesicles and human low-density lipoprotein. J. Am. Chem. Soc. 2002, 124, 6957–6965. [Google Scholar] [CrossRef]
  41. Cabezas-Wallscheid, N.; Buettner, F.; Sommerkamp, P.; Klimmeck, D.; Ladel, L.; Thalheimer, F.B.; Pastor-Flores, D.; Roma, L.P.; Renders, S.; Zeisberger, P.; et al. Vitamin A-Retinoic Acid Signaling Regulates Hematopoietic Stem Cell Dormancy. Cell 2017, 169, 807–823.e19. [Google Scholar] [CrossRef] [PubMed] [Green Version]
  42. Ford, A.H.; Flicker, L.; Alfonso, H.; Thomas, J.; Clarnette, R.; Martins, R.; Almeida, O.P. Vitamins B(12), B(6), and folic acid for cognition in older men. Neurology 2010, 75, 1540–1547. [Google Scholar] [CrossRef] [PubMed] [Green Version]
  43. Messa, P.; Vallone, C.; Mioni, G.; Geatti, O.; Turrin, D.; Passoni, N.; Cruciatti, A. Direct in vivo assessment of parathyroid hormone-calcium relationship curve in renal patients. Kidney Int. 1994, 46, 1713–1720. [Google Scholar] [CrossRef] [PubMed] [Green Version]
  44. Luo, P.P.; Xu, H.S.; Chen, Y.W.; Wu, S.P. Periodontal disease severity is associated with micronutrient intake. Aust. Dent. J. 2018, 63, 193–201. [Google Scholar] [CrossRef] [PubMed]
  45. Nishida, M.; Grossi, S.G.; Dunford, R.G.; Ho, A.W.; Trevisan, M.; Genco, R.J. Calcium and the risk for periodontal disease. J. Periodontol. 2000, 71, 1057–1066. [Google Scholar] [CrossRef] [PubMed]
  46. Adegboye, A.; Boucher, B.; Kongstad, J.; Fiehn, N.; Christensen, L.; Heitmann, B. Calcium, vitamin D, casein and whey protein intakes and periodontitis among Danish adults. Public Health Nutr. 2016, 19, 503–510. [Google Scholar] [CrossRef] [Green Version]
  47. Chapple, I.L.; Bouchard, P.; Cagetti, M.G.; Campus, G.; Carra, M.C.; Cocco, F.; Nibali, L.; Hujoel, P.; Laine, M.L.; Lingstrom, P.; et al. Interaction of lifestyle, behaviour or systemic diseases with dental caries and periodontal diseases: Consensus report of group 2 of the joint EFP/ORCA workshop on the boundaries between caries and periodontal diseases. J. Clin. Periodontol. 2017, 44 (Suppl. S18), S39–S51. [Google Scholar] [CrossRef] [Green Version]
  48. Dommisch, H.; Kuzmanova, D.; Jonsson, D.; Grant, M.; Chapple, I. Effect of micronutrient malnutrition on periodontal disease and periodontal therapy. Periodontol. 2000 2018, 78, 129–153. [Google Scholar] [CrossRef]
  49. Akpinar, A.; Karakan, N.C.; Alpan, A.L.; Dogan, S.S.A.; Goze, F.; Poyraz, O. Comparative effects of riboflavin, nicotinamide and folic acid on alveolar bone loss: A morphometric and histopathologic study in rats. Srp. Arh. Celok. Lek. 2016, 144, 273–279. [Google Scholar] [CrossRef]
  50. Bordoloi, J.; Dihingia, A.; Kalita, J.; Manna, P. Implication of a novel vitamin K dependent protein, GRP/Ucma in the pathophysiological conditions associated with vascular and soft tissue calcification, osteoarthritis, inflammation, and carcinoma. Int. J. Biol. Macromol. 2018, 113, 309–316. [Google Scholar] [CrossRef]
  51. Ebersole, J.L.; Lambert, J.; Bush, H.; Huja, P.E.; Basu, A. Serum Nutrient Levels and Aging Effects on Periodontitis. Nutrients 2018, 10, 1986. [Google Scholar] [CrossRef] [PubMed] [Green Version]
  52. Iwasaki, M.; Moynihan, P.; Manz, M.C.; Taylor, G.W.; Yoshihara, A.; Muramatsu, K.; Watanabe, R.; Miyazaki, H. Dietary antioxidants and periodontal disease in community-based older Japanese: A 2-year follow-up study. Public Health Nutr. 2013, 16, 330–338. [Google Scholar] [CrossRef] [PubMed] [Green Version]
  53. Kunz, D.; Wirth, J.; Sculean, A.; Eick, S. In-vitro-activity of additive application of hydrogen peroxide in antimicrobial photodynamic therapy using LED in the blue spectrum against bacteria and biofilm associated with periodontal disease. Photodiagn. Photodyn. Ther. 2019, 26, 306–312. [Google Scholar] [CrossRef] [PubMed]
  54. Willershausen, B.; Ross, A.; Forsch, M.; Willershausen, I.; Mohaupt, P.; Callaway, A. The influence of micronutrients on oral and general health. Eur. J. Med. Res. 2011, 16, 514–518. [Google Scholar] [CrossRef] [Green Version]
  55. Zheng, X.; Hou, Y.; He, H.; Chen, Y.; Zhou, R.; Wang, X.; Gong, T.; Jiang, W. Synthetic vitamin K analogs inhibit inflammation by targeting the NLRP3 inflammasome. Cell. Mol. Immunol. 2021, 18, 2422–2430. [Google Scholar] [CrossRef] [PubMed]
  56. Alhassani, A.A.; Hu, F.B.; Rimm, E.B.; Li, Y.; Rosner, B.A.; Willett, W.C.; Joshipura, K.J. Dietary flavonoid intake and risk of periodontitis. J. Periodontol. 2020, 91, 1057–1066. [Google Scholar] [CrossRef] [PubMed]
  57. Hwang, S.Y.; Jang, J.H.; Park, J.E. Association between Healthy Lifestyle (Diet Quality, Physical Activity, Normal Body Weight) and Periodontal Diseases in Korean Adults. Int. J. Environ. Res. Public Health 2022, 19, 3871. [Google Scholar] [CrossRef] [PubMed]
  58. Bartha, V.; Exner, L.; Meyer, A.L.; Basrai, M.; Schweikert, D.; Adolph, M.; Bruckner, T.; Meller, C.; Woelber, J.P.; Wolff, D. How to Measure Adherence to a Mediterranean Diet in Dental Studies: Is a Short Adherence Screener Enough? A Comparative Analysis. Nutrients 2022, 14, 1300. [Google Scholar] [CrossRef]
  59. Watson, S.; Woodside, J.V.; Winning, L.; Wright, D.M.; Srinivasan, M.; McKenna, G. Associations between self-reported periodontal disease and nutrient intakes and nutrient-based dietary patterns in the UK Biobank. J. Clin. Periodontol. 2022, 49, 428–438. [Google Scholar] [CrossRef]
  60. Eberhard, J.; Ruiz, K.; Tan, J.; Jayasinghe, T.; Khan, S.; Eroglu, E.; Adler, C.; Simpson, S.; Le Couteur, D.; Raubenheimer, D.; et al. A randomized clinical trial to investigate the effect of dietary protein sources on periodontal health. J. Clin. Periodontol. 2022, 49, 388–400. [Google Scholar] [CrossRef]
  61. Bondonno, N.P.; Murray, K.; Cassidy, A.; Bondonno, C.P.; Lewis, J.R.; Croft, K.D.; Kyro, C.; Gislason, G.; Torp-Pedersen, C.; Scalbert, A.; et al. Higher habitual flavonoid intakes are associated with a lower risk of peripheral artery disease hospitalizations. Am. J. Clin. Nutr. 2020, 113, 187–199. [Google Scholar] [CrossRef] [PubMed]
  62. Cho, E.; Hankinson, S.E.; Rosner, B.; Willett, W.C.; Colditz, G.A. Prospective study of lutein/zeaxanthin intake and risk of age-related macular degeneration. Am. J. Clin. Nutr. 2008, 87, 1837–1843. [Google Scholar] [CrossRef]
  63. Jayedi, A.; Rashidy-Pour, A.; Parohan, M.; Zargar, M.S.; Shab-Bidar, S. Dietary Antioxidants, Circulating Antioxidant Concentrations, Total Antioxidant Capacity, and Risk of All-Cause Mortality: A Systematic Review and Dose-Response Meta-Analysis of Prospective Observational Studies. Adv. Nutr. 2018, 9, 701–716. [Google Scholar] [CrossRef] [PubMed] [Green Version]
  64. Jayedi, A.; Zargar, M.S. Intake of vitamin B6, folate, and vitamin B12 and risk of coronary heart disease: A systematic review and dose-response meta-analysis of prospective cohort studies. Crit. Rev. Food Sci. Nutr. 2019, 59, 2697–2707. [Google Scholar] [CrossRef] [PubMed]
  65. Liu, M.; Zhou, C.; Zhang, Z.; Li, Q.; He, P.; Zhang, Y.; Li, H.; Liu, C.; Qin, X. Inverse Association Between Riboflavin Intake and New-Onset Hypertension: A Nationwide Cohort Study in China. Hypertension 2020, 76, 1709–1716. [Google Scholar] [CrossRef]
  66. Zareba, P.; Colaci, D.S.; Afeiche, M.; Gaskins, A.J.; Jorgensen, N.; Mendiola, J.; Swan, S.H.; Chavarro, J.E. Semen quality in relation to antioxidant intake in a healthy male population. Fertil. Steril. 2013, 100, 1572–1579. [Google Scholar] [CrossRef] [Green Version]
  67. Zittermann, A.; Ernst, J.B.; Prokop, S.; Fuchs, U.; Dreier, J.; Kuhn, J.; Knabbe, C.; Birschmann, I.; Schulz, U.; Berthold, H.K.; et al. Effect of vitamin D on all-cause mortality in heart failure (EVITA): A 3-year randomized clinical trial with 4000 IU vitamin D daily. Eur. Heart J. 2017, 38, 2279–2286. [Google Scholar] [CrossRef] [Green Version]
  68. Inoue, K.; Tsugawa, Y.; Mangione, C.M.; Duru, O.K. Association between industry payments and prescriptions of long-acting insulin: An observational study with propensity score matching. PLoS Med. 2021, 18, e1003645. [Google Scholar] [CrossRef]
  69. Von Elm, E.; Altman, D.G.; Egger, M.; Pocock, S.J.; Gotzsche, P.C.; Vandenbroucke, J.P.; Initiative, S. The Strengthening the Reporting of Observational Studies in Epidemiology (STROBE) statement: Guidelines for reporting observational studies. Lancet 2007, 370, 1453–1457. [Google Scholar] [CrossRef]
  70. Dye, B.A.; Afful, J.; Thornton-Evans, G.; Iafolla, T. Overview and quality assurance for the oral health component of the National Health and Nutrition Examination Survey (NHANES), 2011–2014. BMC Oral Health 2019, 19, 95. [Google Scholar] [CrossRef] [Green Version]
  71. Eke, P.I.; Borgnakke, W.S.; Genco, R.J. Recent epidemiologic trends in periodontitis in the USA. Periodontol. 2000 2020, 82, 257–267. [Google Scholar] [CrossRef] [PubMed]
  72. Eke, P.I.; Dye, B.A.; Wei, L.; Slade, G.D.; Thornton-Evans, G.O.; Borgnakke, W.S.; Taylor, G.W.; Page, R.C.; Beck, J.D.; Genco, R.J. Update on Prevalence of Periodontitis in Adults in the United States: NHANES 2009 to 2012. J. Periodontol. 2015, 86, 611–622. [Google Scholar] [CrossRef] [PubMed] [Green Version]
  73. Tran, D.T.; Gay, I.; Du, X.L.; Fu, Y.; Bebermeyer, R.D.; Neumann, A.S.; Streckfus, C.; Chan, W.; Walji, M.F. Assessment of partial-mouth periodontal examination protocols for periodontitis surveillance. J. Clin. Periodontol. 2014, 41, 846–852. [Google Scholar] [CrossRef] [PubMed] [Green Version]
  74. Machado, V.; Botelho, J.; Viana, J.; Pereira, P.; Lopes, L.B.; Proenca, L.; Delgado, A.S.; Mendes, J.J. Association between Dietary Inflammatory Index and Periodontitis: A Cross-Sectional and Mediation Analysis. Nutrients 2021, 13, 1194. [Google Scholar] [CrossRef]
  75. Wright, D.M.; McKenna, G.; Nugent, A.; Winning, L.; Linden, G.J.; Woodside, J.V. Association between diet and periodontitis: A cross-sectional study of 10,000 NHANES participants. Am. J. Clin. Nutr. 2020, 112, 1485–1491. [Google Scholar] [CrossRef]
  76. Institute of Medicine. Dietary Reference Intakes; The National Academies Press: Washington, DC, USA, 2006; p. 1344. [Google Scholar]
  77. Bidinotto, A.B.; Martinez-Steele, E.; Thomson, W.M.; Hugo, F.N.; Hilgert, J.B. Investigation of direct and indirect association of ultra-processed food intake and periodontitis. J. Periodontol. 2021, 93, 603–612. [Google Scholar] [CrossRef]
  78. Arora, M.; Weuve, J.; Schwartz, J.; Wright, R.O. Association of environmental cadmium exposure with periodontal disease in U.S. adults. Environ. Health Perspect 2009, 117, 739–744. [Google Scholar] [CrossRef] [Green Version]
  79. Brook, R.D.; Rajagopalan, S. 2017 ACC/AHA/AAPA/ABC/ACPM/AGS/APhA/ASH/ASPC/NMA/PCNA Guideline for the Prevention, Detection, Evaluation, and Management of High Blood Pressure in Adults. A report of the American College of Cardiology/American Heart Association Task Force on Clinical Practice Guidelines. J. Am. Soc. Hypertens. 2018, 12, 238. [Google Scholar] [CrossRef]
  80. Herxenberg, L.A.; Moore, W.A.; De Rosa, S.C. Estimation of missing values. Lancet 1999, 354, 686. [Google Scholar] [CrossRef]
  81. O’Brien, S.M.; Dunson, D.B. Bayesian multivariate logistic regression. Biometrics 2004, 60, 739–746. [Google Scholar] [CrossRef]
  82. Liang, J.; Hu, Z.; Zhan, C.; Wang, Q. Using Propensity Score Matching to Balance the Baseline Characteristics. J. Thorac. Oncol. 2021, 16, e45–e46. [Google Scholar] [CrossRef] [PubMed]
  83. Bailey, D.; Bevilacqua, V.; Colantonio, D.A.; Pasic, M.D.; Perumal, N.; Chan, M.K.; Adeli, K. Pediatric within-day biological variation and quality specifications for 38 biochemical markers in the CALIPER cohort. Clin. Chem. 2014, 60, 518–529. [Google Scholar] [CrossRef] [PubMed] [Green Version]
  84. Hickman, P.E.; Koerbin, G.; Potter, J.M.; Glasgow, N.; Cavanaugh, J.A.; Abhayaratna, W.P.; West, N.P.; Glasziou, P. Choice of Statistical Tools for Outlier Removal Causes Substantial Changes in Analyte Reference Intervals in Healthy Populations. Clin. Chem. 2020, 66, 1558–1561. [Google Scholar] [CrossRef] [PubMed]
Figure 1. Flowchart for screening participants.
Nutrients 14 02466 g001
Figure 2. Logistic regression results for categorical and continuous variables for the four models: (A) logistic regression results of micronutrient intake (continuous variable); (B) logistic regression results of intake inadequate (categorical variable). RDA: recommended dietary allowance; AI: adequate intake. Model 0 had no adjustment of data; Model 1 was a multifactor logistic regression adjusted for all eleven covariates; Model 2 used propensity score matching to be balanced covariates (including smoke, alcohol, and physical activity) and then used multifactorial logistic regression adjusting for age, gender, educational level, income, BMI, diabetes, HPL, and HTN; Model 3 used PSM to balance all eleven covariates.
Nutrients 14 02466 g002
Figure 3. Result of the multifactorial logistic regression of 8 significantly micronutrients.
Nutrients 14 02466 g003
Figure 4. The RCS results for the micronutrients: (A) RCS results for vitamin A; (B) vitamin B1; (C) vitamin C; (D) vitamin E; (E) copper.
Nutrients 14 02466 g004
Figure 5. The RCS results after subgroup analysis for age or gender according to the reference threshold of DRI. RAE: retinol activity equivalents. Significance: intervals for the intake of significant micronutrients were determined based on odds ratio and confidence intervals. RDA: recommended dietary allowance; AI: adequate intake. Refvalue: the risk point.
Nutrients 14 02466 g005
Table 1. Characteristic of covariant.
LevelOverall aPeriodontitisNo Periodontitis aχ2p b
No.895939944965
Age (mean (SD))52.36 (14.16)56.75 (13.63)48.82 (13.59)/<0.001
Gender (%)Female4585 (51.2)1681 (42.1)2904 (58.5)237.64<0.001
Male4374 (48.8)2313 (57.9)2061 (41.5)
Edu (%)<High school graduate1950 (21.8)1209 (30.3)741 (14.9)551.05<0.001
College2576 (28.8)1053 (26.4)1523 (30.7)
College graduate2490 (27.8)717 (18.0)1773 (35.7)
High school graduate1943 (21.7)1015 (25.4)928 (18.7)
Income (%)High3106 (34.7)1002 (25.1)2104 (42.4)314.75<0.001
Low2600 (29.0)1419 (35.5)1181 (23.8)
Middle3253 (36.3)1573 (39.4)1680 (33.8)
BMI (mean (SD))29.48 (6.74)29.65 (6.73)29.35 (6.74)/0.037
Diabetes (%)Diabetes1399 (15.6)845 (21.2)554 (11.2)167.17<0.001
No diabetes7560 (84.4)3149 (78.8)4411 (88.8)
Alcohol (%)Drinkers6604 (73.7)2936 (73.5)3668 (73.9)0.13540.713
Nondrinkers2355 (26.3)1058 (26.5)1297 (26.1)
HPL (%)Hyperlipidemia4077 (45.5)1939 (48.5)2138 (43.1)26.646<0.001
No hyperlipidemia4882 (54.5)2055 (51.5)2827 (56.9)
HTN (%)Hypertension5113 (57.1)2612 (65.4)2501 (50.4)203.35<0.001
No hypertension3846 (42.9)1382 (34.6)2464 (49.6)
Phy (%)No physical activity2866 (32.0)1406 (35.2)1460 (29.4)33.923<0.001
Physical activity6093 (68.0)2588 (64.8)3505 (70.6)
Smoke (%)Active smoker1598 (17.8)970 (24.3)628 (12.6)334.72<0.001
Former smoker2322 (25.9)1180 (29.5)1142 (23.0)
Never smoker5039 (56.2)1844 (46.2)3195 (64.4)
a: Continuous variables such as age and gender are the mean (standard deviation), and other categorical variables are the number of people (percentage); b: chi-square test was used for continuous variables and rank-sum test for classified variables; SD: stand error; BMI: body mass index; HPL: hyperlipidemia; HTN: hypertension; phy: physical activity.
Publisher’s Note: MDPI stays neutral with regard to jurisdictional claims in published maps and institutional affiliations.

