1. Introduction
Beef is a popular food worldwide, and the United States (U.S.) consumes 21% of the world’s beef production, with China, the European Union, and Brazil consuming 16%, 13%, and 13%, respectively, of the world’s production (
https://www.fas.usda.gov/) (accessed on 2 December 2022). It is estimated that ground beef constitutes 40–45% of the beef consumed in the U.S.; when beef is prepared for meals at home, ground beef is used 60% of the time (
https://beef2live.com/story-ground-beef-united-states-128-104332) (accessed on 2 December 2022). Ground beef containing less than 5–9% fat, 10% fat, and 20% fat accounts for 20, 42, and 20% of retail sales, respectively; the remaining 18% is comprised primarily of ground beef containing 30% fat (
https://www.beefitswhatsfordinner.com/retail/sales-data-shopper-insights/ground-beef-at-retail-and-foodservice) (accessed on 2 December 2022). Palmitic acid (16:0) and stearic acid (18:0) are the most abundant saturated fatty acids (SFA) in beef, and oleic acid (18:1n-9) is the most abundant monounsaturated fatty acid (MUFA) in ground beef [
1,
2,
3,
4,
5]. Beef also contains significant amounts of naturally occurring
trans-fatty acid (TFA), primarily eladic acid (18:1
trans-9) and
trans-vaccenic acid (18:1
trans-11), and conventional, 20% fat ground beef (22.8 g fat/114-g patty) contains 5 g palmitic acid, 3 g stearic acid, 8 g oleic acid, and 1.7 g TFA [
1]. However, TFA derived from ruminal sources (e.g., dairy products and beef) does not affect the risk for cardiovascular disease (CVD) [
6].
As indicated above, ground beef is a popular component in U.S. diet, and as such, ground beef constitutes one of the primary dietary sources of saturated fatty acids. In addition, the total fat and saturated fatty acid content can be changed readily and accurately during the formulation of ground beef preparations. Therefore, we conducted several randomized, controlled trials with men and/or postmenopausal women in which we tested the effects of ground beef differing in fatty acid composition on risk factors for CVD. Adams et al. [
1] reported that high-density lipoprotein cholesterol (HDL-C) and low-density lipoprotein cholesterol (LDL-C) concentrations decreased from baseline when mildly hypercholesterolemic men were fed 35% fat, 114-g ground beef patties (40 g fat/patty; 15.7 g SFA/patty) (5 patties/week for 5 weeks). In a randomized controlled trial with normocholesterolemic men, consumption of 24% fat, 114-g patties (27 g fat/patty; 14.4 g SFA/patty) (5 patties/week for 5 weeks) had no effect on HDL-C or LDL-C concentration [
2]. In a subsequent randomized controlled trial with postmenopausal women, consumption of 21% fat, 114-g patties (24 g fat/patty; 10.5 g SFA/patty) (5 patties/week for 6 weeks) had no effect on HDL-C or LDL-C concentration [
3]. Choi et al. [
4] reported that in a randomized controlled trial including postmenopausal women and older men, consumption of 22% fat, 114 g patties (25 g fat/patty; 10.5 g SFA/patty) (5 patties/week for 5 weeks) had no effect on HDL-C or LDL-C concentration. When data were pooled across the four trials (
n = 42 men, 24 women), we established that intakes of 114-g high-fat/high-SFA ground beef patties 5 times per week for 5 or 6 weeks did not significantly affect HDL-C or LDL-C concentration [
5].
Our previous studies also demonstrated that ground beef interventions elicit differences in lipoprotein particle sizes. LDL particle diameter decreased in men following a 35% fat ground beef intervention [
1], and HDL
2 and HDL
3 particle diameter decreased in men following a 24% fat ground beef intervention [
2]. In contrast to [
1], LDL particle diameter increased in men and women following consumption of 25 g fat/patty ground beef, which was reflected in a greater concentration of cholesterol occurring in the LDL
1 and LDL
2 subfractions [
4]. Because our previous studies indicated that ground beef consumption could affect lipoprotein particle size, a feature that varies inversely with flotation density, a secondary outcome of the current trial was to document the effects of LF (5% fat) and HF (25% fat) ground beef consumption on the density distributions for LDL and HDL subfractions. We previously determined particle density distributions using isopycnic density profiling of lipoproteins pre-stained with a lipophilic fluorescent probe [
7]. In that method, the density distribution of labeled lipoproteins was analyzed as the area under the curve (AUC), where the image area was measured as pixels (i.e., number of pixels within a lipoprotein density interval). This study demonstrated that in a randomized controlled crossover study, both LF and HF ground beef consumption depressed plasma HDL-C and LDL-C concentrations as well as AUC for most HDL and LDL subfractions, providing new insight into the effects of beef consumption on the risk for CVD.
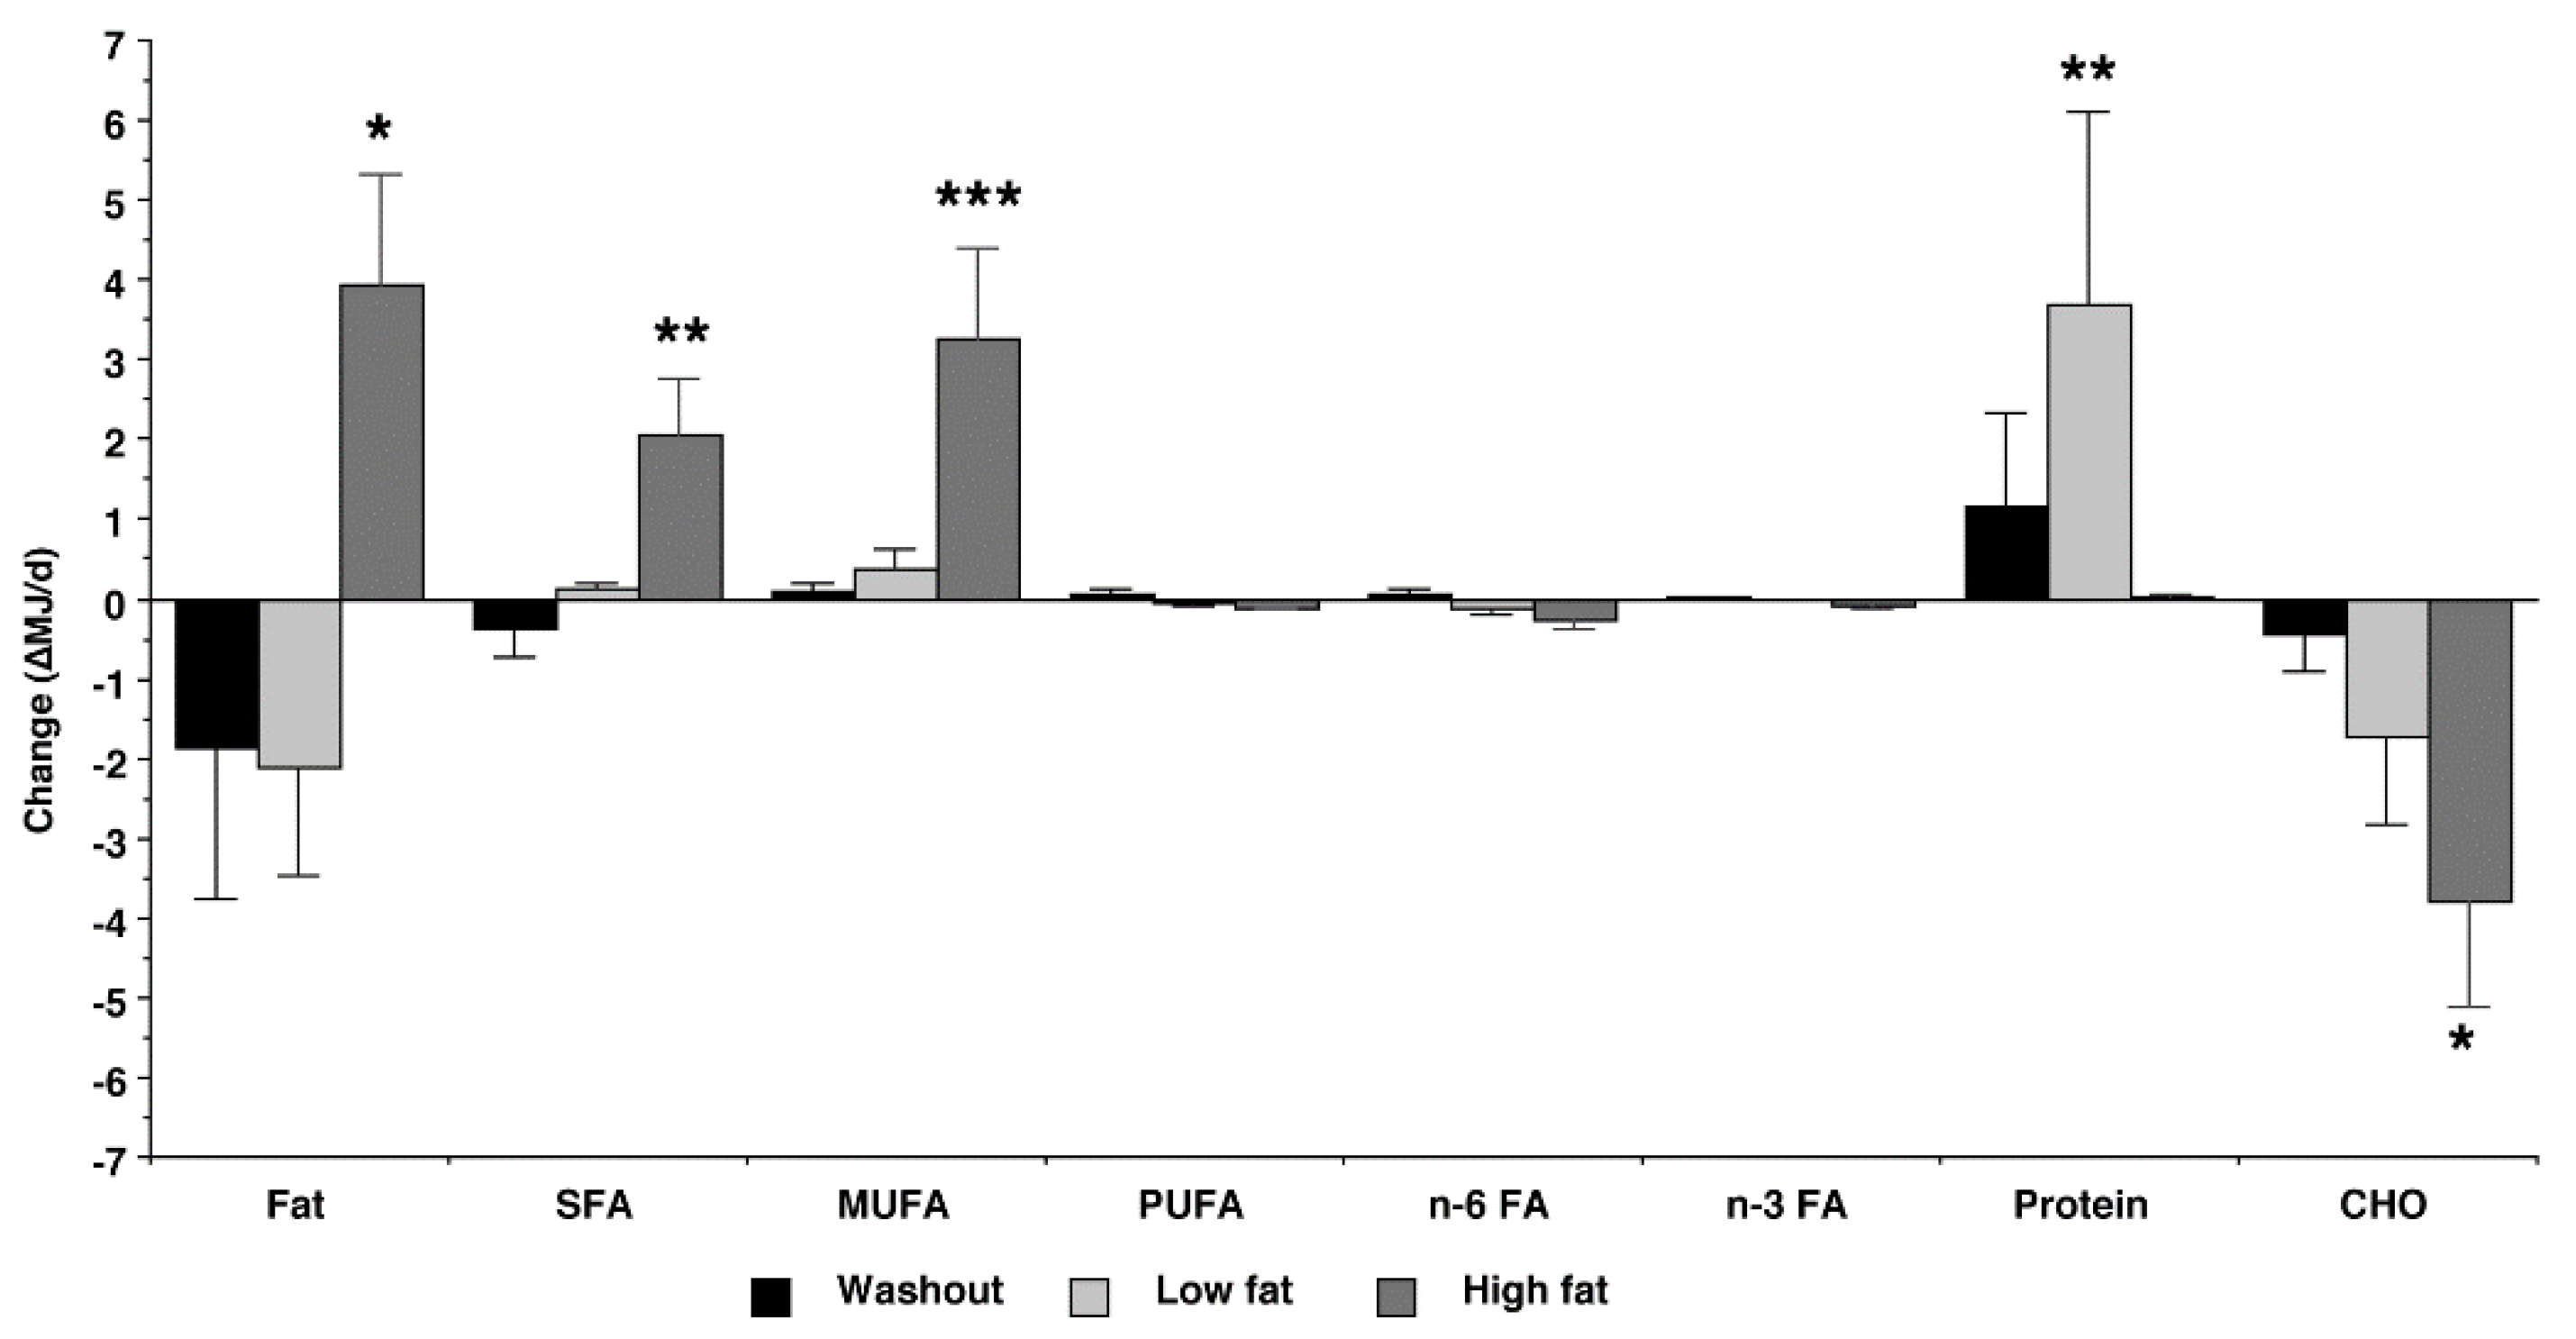
The primary outcome of the current randomized controlled trial was to document the effects of high-fat (HF) ground beef (27 g/patty, 24% fat by weight) and low-fat (LF) ground beef (6 g/patty, 5% fat by weight) on voluntary nutrient intake, and to establish if changes in major macronutrient intake were responsible for any changes we observed in lipoprotein cholesterol concentrations. We hypothesized that consumption of HF ground beef for 5 weeks would reduce the voluntary intake of carbohydrates but have no effect on HDL-C or LDL-C concentrations. Conversely, consumption of LF ground beef for 5 weeks would depress HDL-C and LDL-C concentrations.
2. Materials and Methods
2.1. Ethics Statements and Participant Recruitment
This randomized, controlled, 2-period crossover trial was conducted in accordance with the Declaration of Helsinki guidelines [
8]. The trial was registered at
www.clinicaltrials.gov as NCT04841460 accessed on 12 April 2021. All procedures involving human participants were approved by the Texas A&M University Institutional Review Board for use of human participants in research (Protocol number IRB2018-0755). Participants were recruited in October and November 2019, and the ground beef treatments were initiated in February 2020. The final blood samples were collected in July 2020. The study staff were not blinded, but the statistician was blinded to treatment during the initial analyses by identifying the diet conditions as A and B. All subjects were provided with detailed instructions, including potential risks of participation.
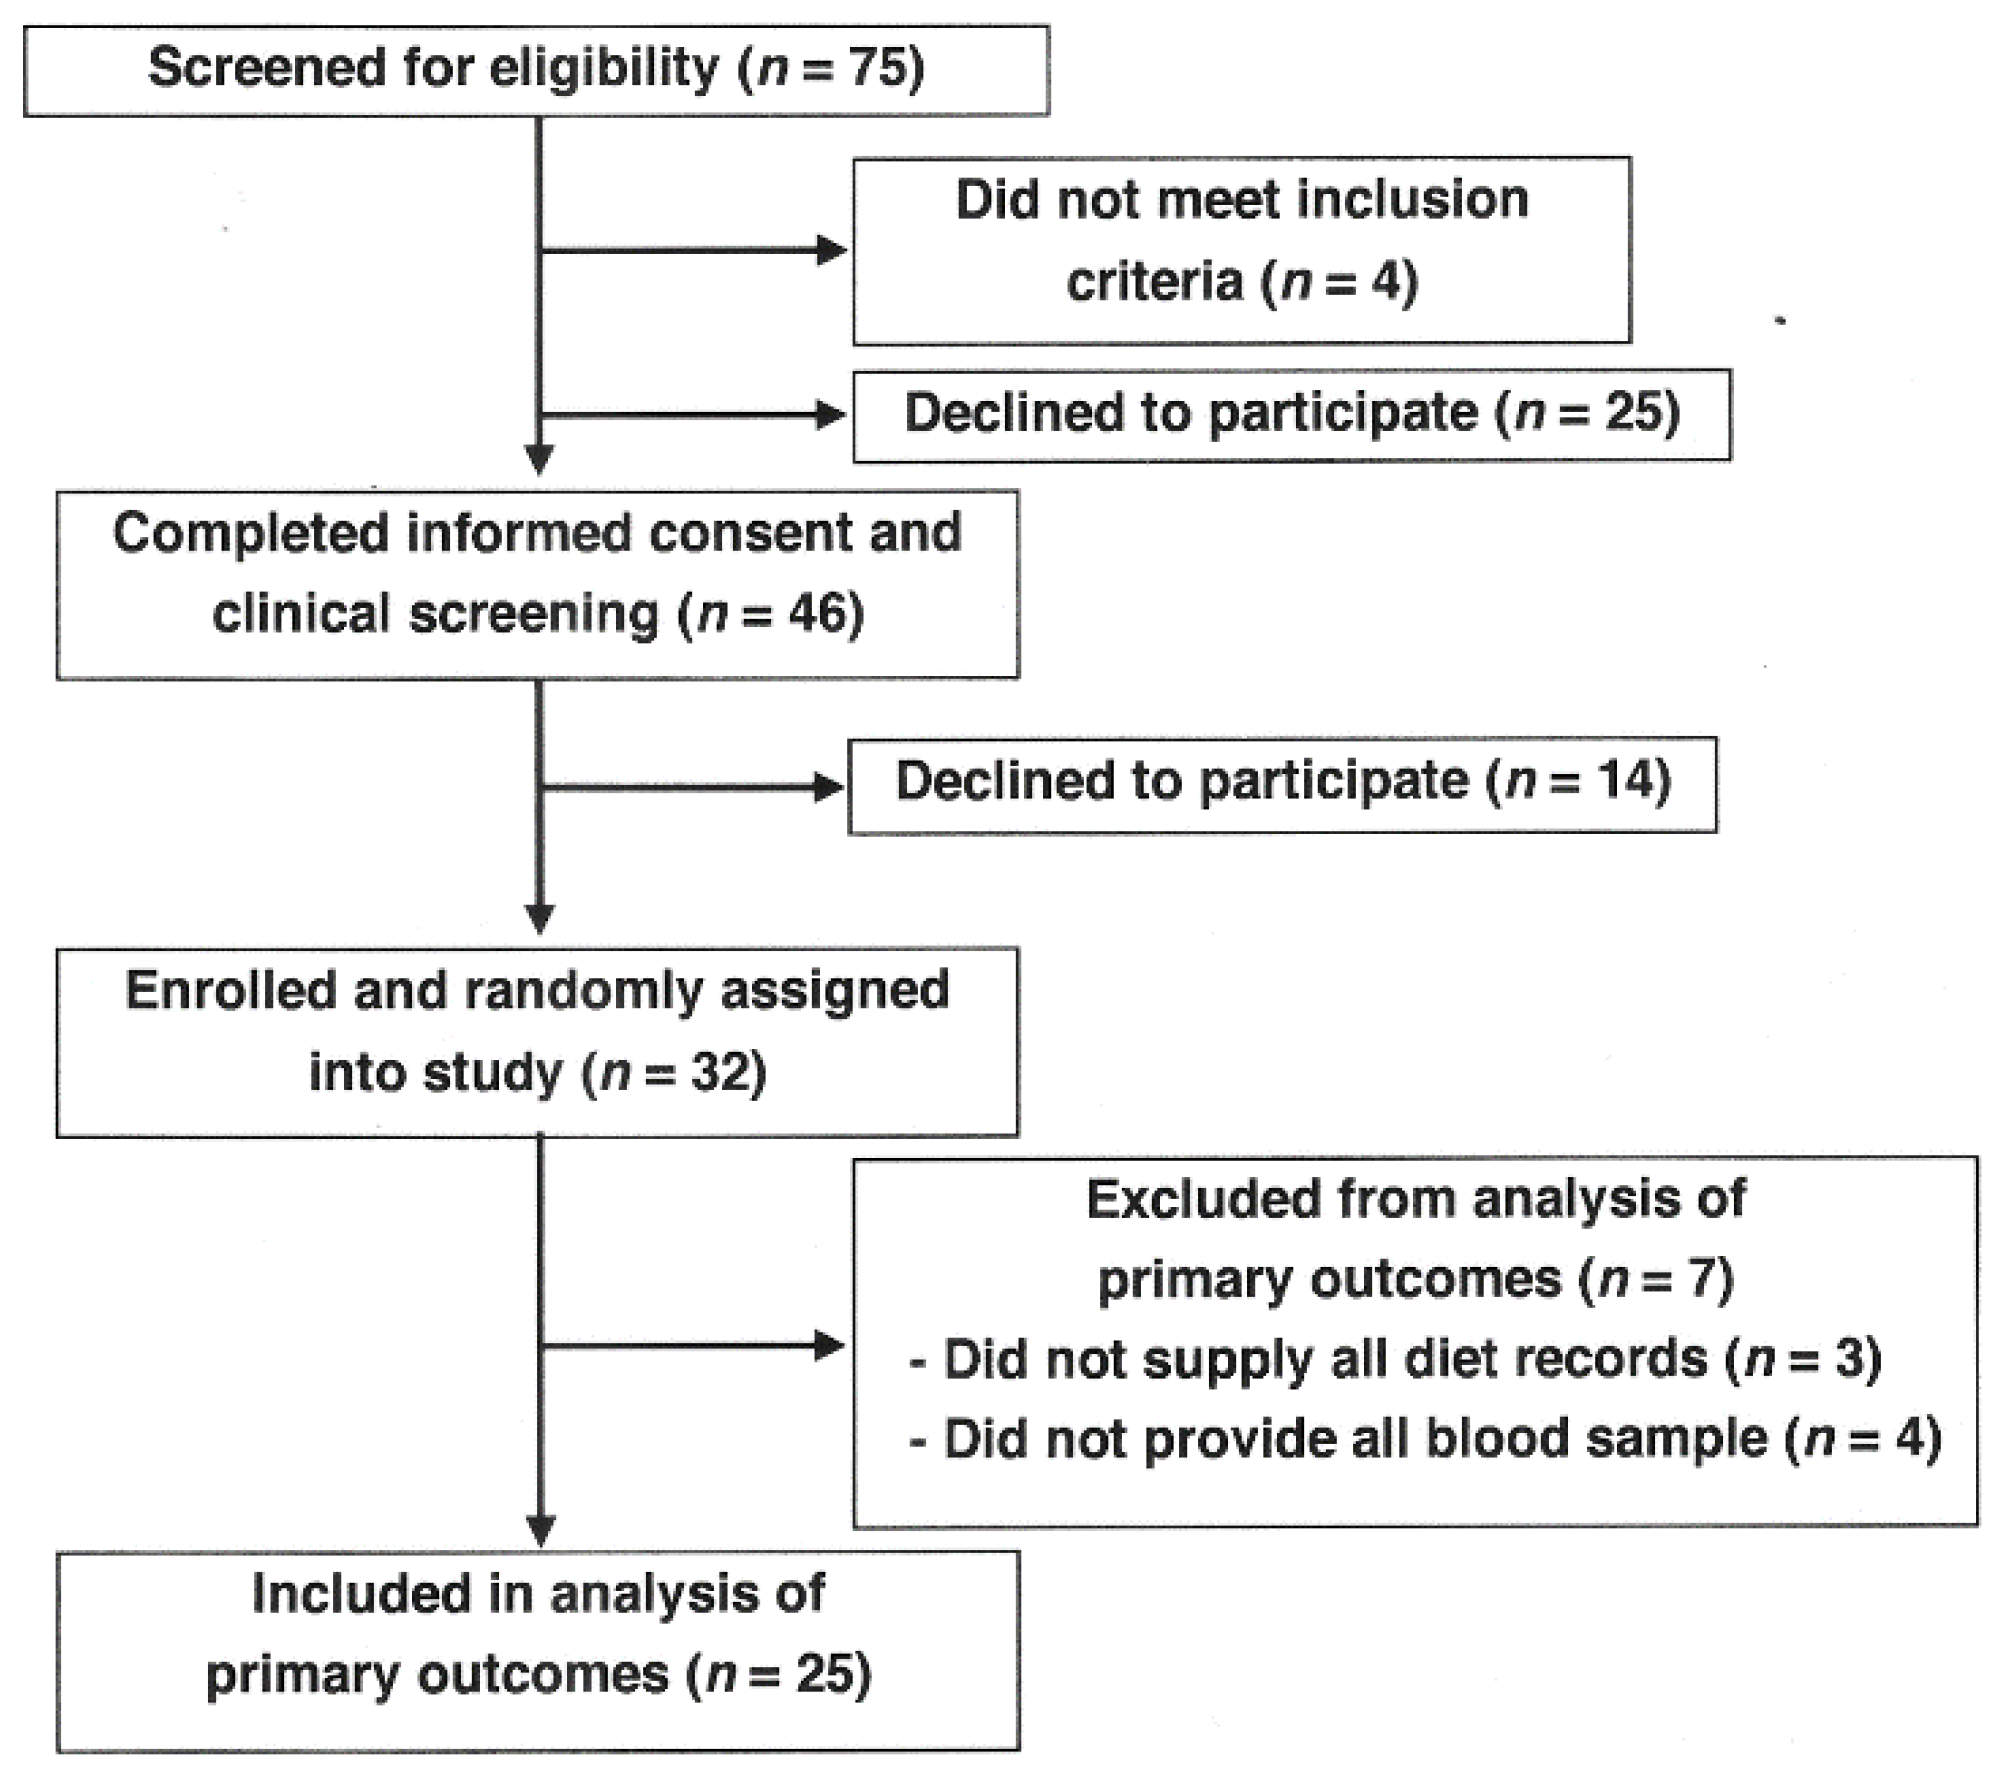
Seventy-five healthy males between the ages of 25 and 60 years participated in one of two informational meetings (
Figure 1). Four individuals did not meet the inclusion criteria, and 25 men declined to participate. Forty-six men signed Informed Consent forms, and 14 men later declined to participate. Thirty-two men were assigned at random to two treatment groups, LF and HF ground beef, and were provided test ground beef patties. Seven men who left the study were excluded due to inability to comply (did not provide all diet records,
n = 3; did not provide all blood samples,
n = 4), and 25 men completed all phases of the study.
2.2. Inclusion Criteria
The participants had to be non-smoking males, not be on any restrictive diets or cholesterol-lowering medications, and not have a total cholesterol (TC) above 350 mg/dL. The participants were requested not to change their habitual diet or level of physical activity. Due to limited funding, we chose to recruit men only, and not women only or a combination of men and women. Statistical power calculations were based on changes in HDL-C concentration in normocholesterolemic men in response to a ground beef intervention ([
2], described below). Unpublished data from previous trials in our laboratory [
1,
2,
3,
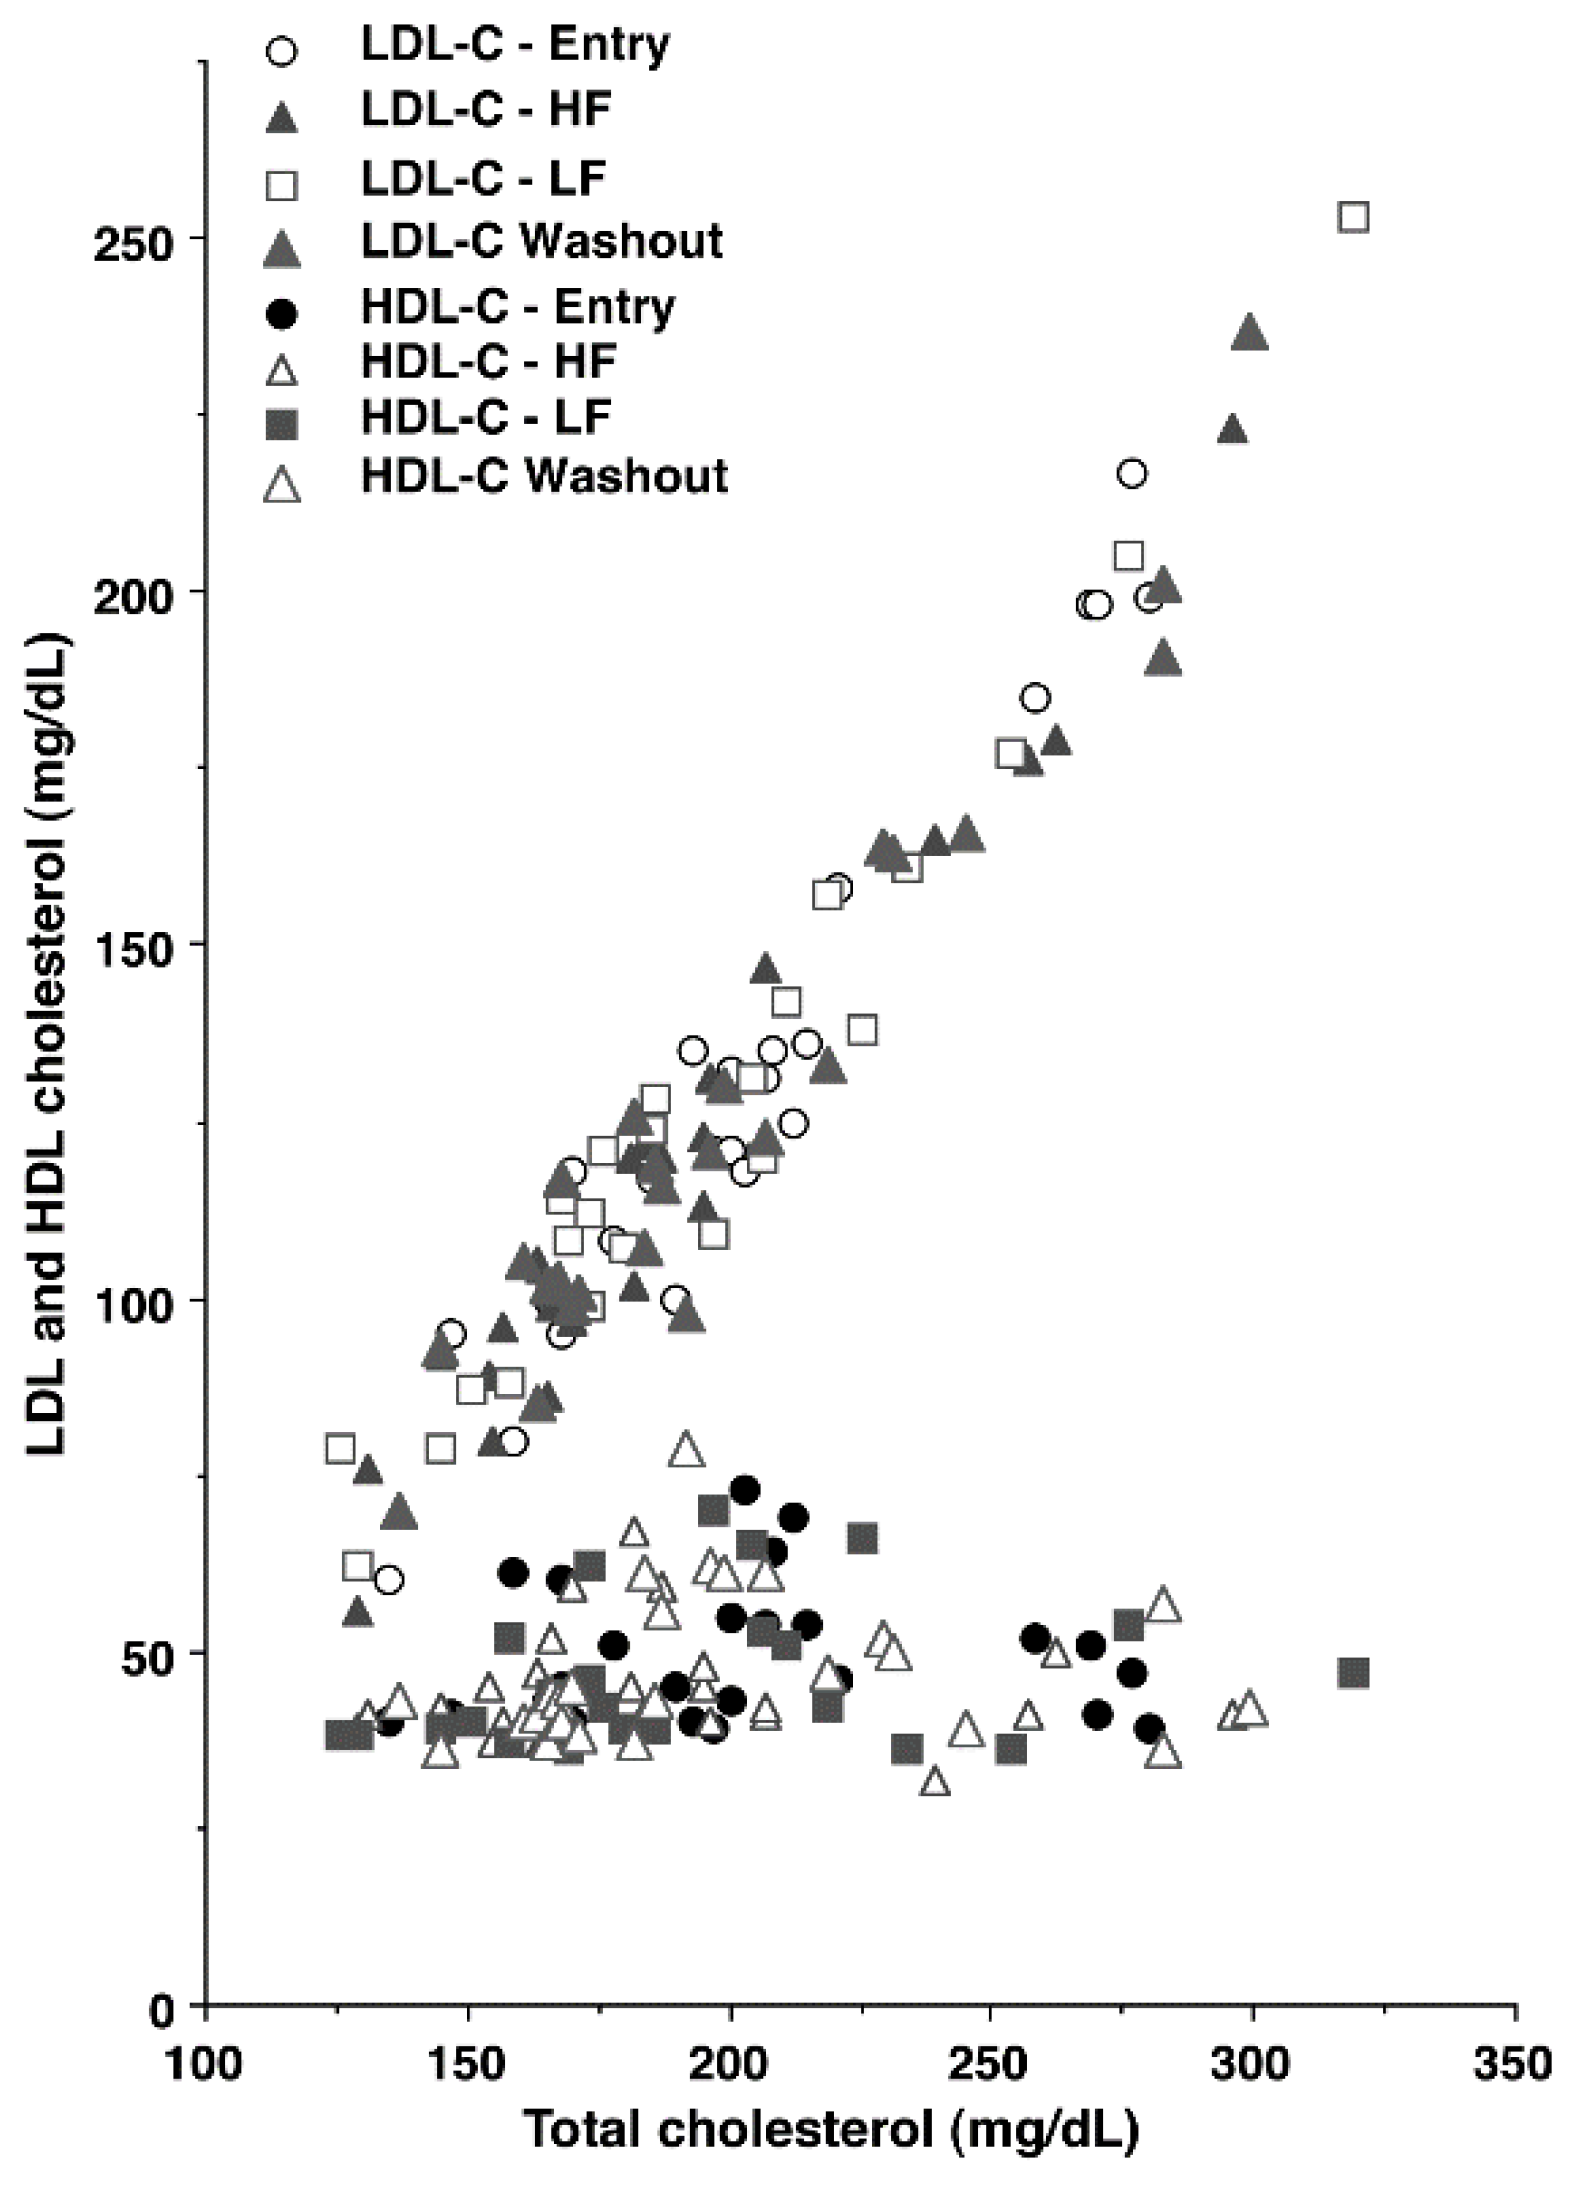
4] indicated that women had much greater variation in HDL-C concentration at entry (47–120 mg/dL) than men (36–76 mg/dL). The range of HDL-C concentrations at entry in the current study (39–73 mg/dL;
Figure 2) was similar to the variation in our previous studies with men. The lesser variation in HDL-C concentration for men improved the power of our statistical analyses, and for this reason, men only were chosen for this trial.
2.3. Study Design
The study design was a two-period, randomized crossover design in which each participant completed two 5-week ground beef interventions in a randomly assigned order, with a 4-week washout period [
9] between the test periods. All blood samples were taken from the fasting subjects. Four blood samples were drawn at baseline immediately before treatment assignment (entry), immediately after the ground beef interventions, and following the 4-week washout period, immediately before the second ground beef intervention. During the 5-week intervention, the men consumed 5 ground beef patties per week for 5 weeks for each ground beef type, LF and HF (total of 25 patties for each type). The participants were assigned to one of two groups, which were balanced based on plasma HDL-C concentrations measured at the initial screening. Before the first ground beef intervention, the men assigned to the LF group had a mean HDL-C concentration of 51 ± 3 mg/dL, and the men assigned to the HF group had a mean HDL-C concentration of 48 ± 3 mg/dL. Of the 25 men who completed the study, 12 men consumed LF ground beef, and 13 men consumed HF ground beef during the first intervention phase. After the washout period, the groups of 12 and 13 men were rotated to the other test ground beef.
2.4. Source of Ground Beef
The source of raw materials for the production of LF and HF patties were the beef pectoralis muscle and 75:25 coarse ground beef, respectively, purchased from a local supplier (Readfield Meats, Bryan, TX, USA). The muscle raw materials were ground, and 4-ounce (115 g) patties were formed in a patty maker, individually vacuum-packaged, and stored at −20 °C. Prior to the initiation of each phase of the ground beef interventions, each participant received an unlabeled box containing 25 frozen, vacuum-packaged patties.
Chemical analysis of the ground beef after patty formation indicated that raw LF patties contained 5% fat (6 g fat/patty) and HF patties contained 24% fat (27 g fat/patty) (
Table 1). Diet records from previous studies [
1,
2,
3,
4] indicated that most study participants pan-broiled the ground beef patties intact, so samples of the LF and HF patties were pan-broiled [
10], and total fat and fatty acid composition of the cooked patties were measured. Cooking losses for LF and HF patties were 3% and 41%, respectively. The total lipid and fatty acid composition of the drained pan-broiled patties were used to calculate the daily intake of dietary fats.
2.5. Diet Records
The participants were required to complete a 3-day diet record before the diet interventions and once during each intervention to establish nutrient intakes and encourage compliance. Daily intake of major nutrients and dietary exchanges were analyzed by a registered dietitian nutritionist (RDN) using ESHA’s Food Processor Nutrition Analysis software (ESHA, Salem, OR, USA). The participants were trained in the use of myfitnesspal (myfitnesspal.com) to record daily intakes, which were forwarded to the RDN. All participants received instructions from the RDN for the preparation of the ground beef, including recipes, but the participants were not restricted to specific cooking methods for the test ground beef. The RDN also contacted the participants at regular intervals to encourage compliance and provide information about completing diet records.
2.6. Body Composition
The body composition of all subjects was assessed at the beginning and at the end of the study using dual-energy X-ray absorptiometry (DXA) (General Electric Lunar Prodigy Advance, Madison, WI, USA). Derived variables of interest from the DXA scans were total body mass, lean body mass, android fat, gynoid fat (all in kg), and percent fat mass. Body mass index (BMI) was calculated for each individual (
Table 2).
2.7. General Blood Sampling and Analyses
Blood sampling and assay procedures were published previously [
11]. On the day of blood sampling (at entry and immediately following the 5-week ground beef interventions and 4-week washout), the subjects were asked to report to the laboratory after an overnight fast (approximately 10 h) restricted to water only. The evening meal was not standardized prior to the study visits; rather, throughout this trial, participants consumed their habitual diets, except for the inclusion of the ground beef patties during the ground beef interventions. Blood was collected after 5 min of seated rest via venipuncture from the antecubital fossa region into serum separator tubes using standard sterile phlebotomy procedures. After collection, the blood was allowed to clot at room temperature for 2 h or chilled at 4 °C for serum and plasma separation, respectively, prior to centrifugation in a refrigerated centrifuge for 20 min (2000×
g). One serum separator vacutainer was couriered the same day to a commercial Clinical Laboratory Improvement Amendments-certified laboratory for determination of TC, HDL-C, LDL-C, and triglyceride (TG) using standard clinical chemistry analyses. Plasma LDL-C concentration was calculated using the Friedwald equation, which is based primarily on TC (LDL-C = TC − HDL-C − TG/5). Aliquots of serum and plasma from additional vacutainers were transferred into separate 2 mL freezer vials, and the vials were stored frozen at −80 °C until analyzed.
2.8. Lipoprotein Density Profiles
Density profiles for circulating lipoproteins were determined by imaging 6 μL serum following NBD-C6-ceramide labeling of lipoproteins, as described [
7]. The overall lipoprotein density profile was analyzed as absolute AUC where image area was measured as pixels (i.e., number of pixels within a density interval). Eleven lipoprotein subclasses were identified by their density intervals and quantified by pixel values. The major lipoprotein subclasses were triacylglycerol-rich lipoproteins (TRL; d < 1.019 g/mL), LDL
1 (d = 1.019–1.023 g/mL), LDL
2 (d = 1.023–1.034 g/mL), LDL
3 (d = 1.034–1.044 g/mL), LDL
4 (d = 1.044–1.055 g/mL), LDL
5 (d = 1.055–1.063 g/mL), HDL
2b (d = 1.063–1.091 g/mL), HDL
2a (d = 1.091–1.110 g/mL), HDL
3a (d = 1.110–1.133 g/mL), HDL
3b (d = 1.133–1.156 g/mL) and HDL
3c (d = 1.156–1.179 g/mL) [
12]. Lipoprotein density profiles for the participants (not indicated) were essentially identical to those reported previously for men by the co-author Walzem, R.L. [
7].
The average percent relative standard deviation in AUC for different lipoprotein subfractions was 4.45% (within-day) and 7.37% (day-to-day). Data were also used to express HDL subfractions as percentages of total HDL AUC:
2.9. Statistics
Power calculations were conducted to estimate the required sample size based on HDL-C concentrations from our previous studies with normocholesterolemic men [
2]. Plasma HDL-C concentrations increased by 2.8 mg/dL on consumption of 24% fat ground beef [
2] compared to habitual diets. Analyses used the following assumptions: power was set at 0.8 and α = 0.05, 2-sided. It was estimated that a sample size of 18 was sufficient to test the hypothesis that HF ground beef would change HDL-C concentrations.
Ground beef effects were analyzed using a repeated measures mixed model to assess the effects of diet (LF vs. HF), sequence (entry, first LF/HF intervention, washout, and second LF/HF intervention), and the diet-by-sequence interaction. Entry BMI and age were included as covariates in the initial model but were insignificant for all dependent variables and were dropped from the final model. The NORM.DIST model of Excel (Microsoft Excel of Mac version 16.16.27) was used to test for normality, and the data were normally distributed. Pairwise comparisons were assessed by Fisher’s Protected LSD method when there was a significant effect of diet or sequence. Associations among plasma lipids were assessed using Pearson’s correlations. Absolute change from baseline was calculated by subtracting measurements taken at entry from post-dietary intervention period values. Data are reported as means ± standard error of the mean (SEM) (n = 25 men who completed all phases of the study). Differences among means were considered significant at p ≤ 0.05, but tendencies among treatments (p ≤ 0.08) will be noted.
5. Conclusions
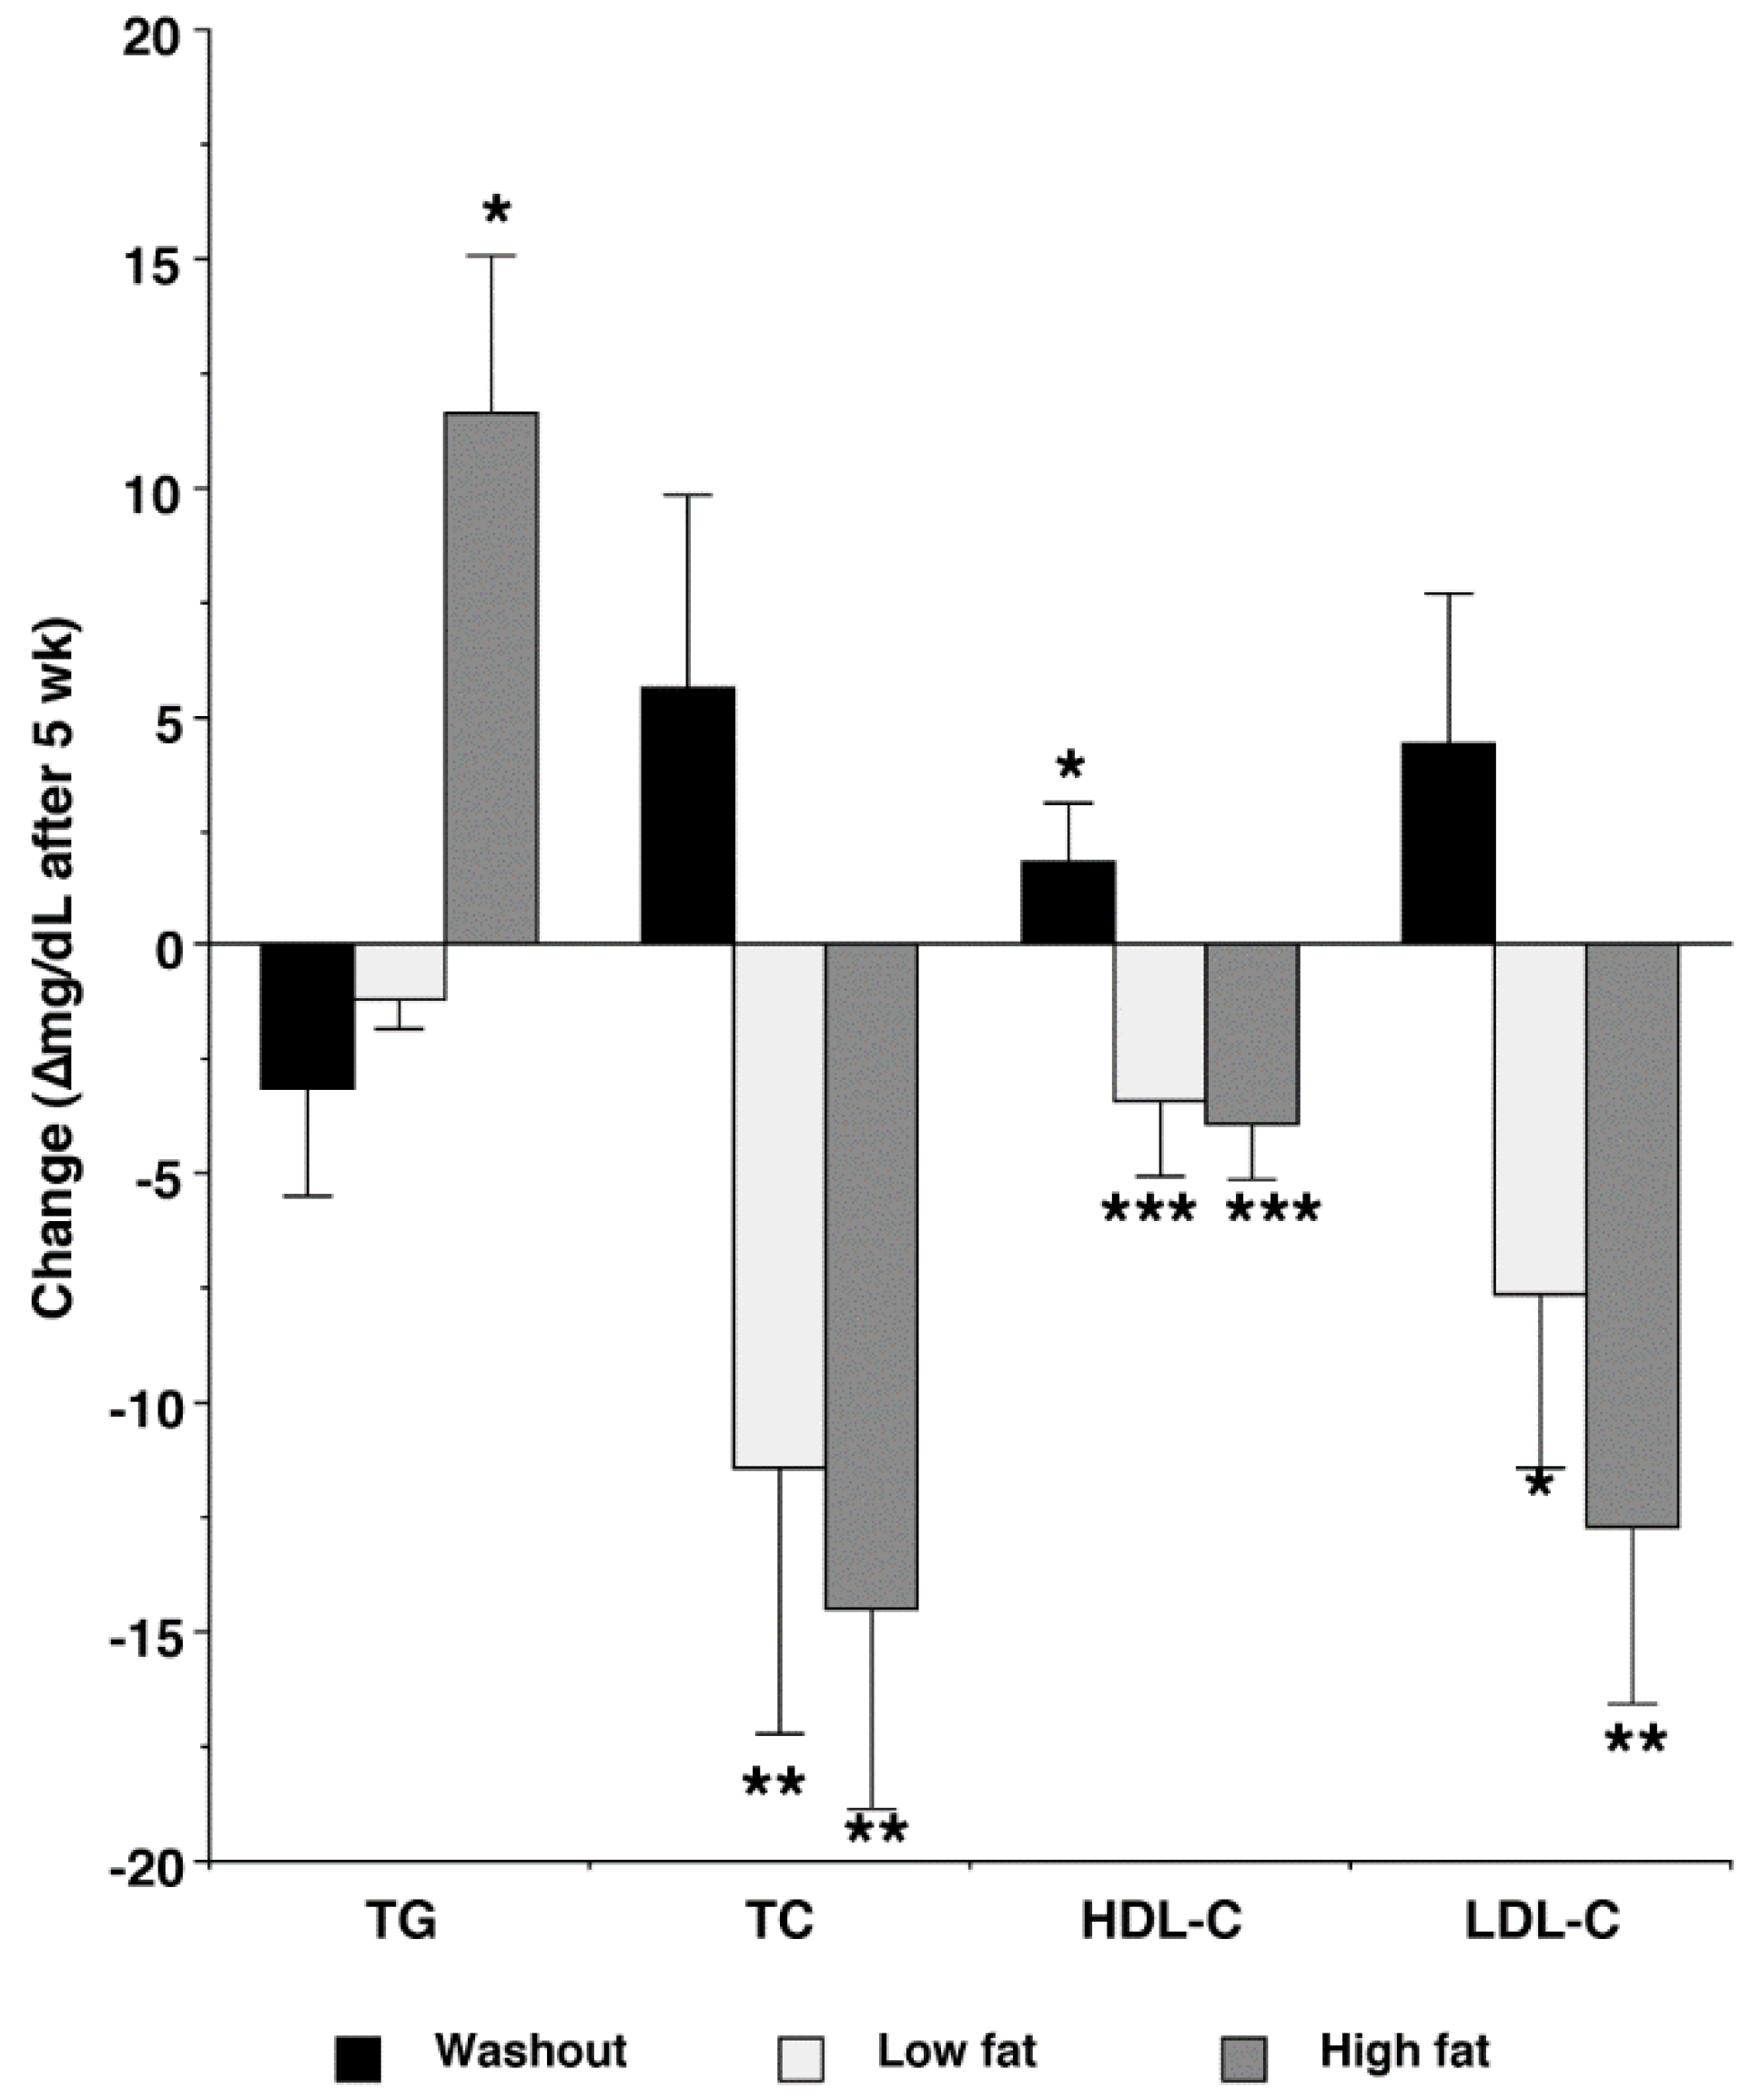
In summary, the LF and HF ground beef interventions differently affected voluntary nutrient intake, but the LF and HF treatments similarly depressed lipoprotein cholesterol concentrations. The LF and HF treatments improved the LDL density profile by decreasing abundance for small, dense LDL (LDL4 and LDL5), and increasing %AUC for large, less dense LDL (LDL1 and LDL2), relative to entry levels. However, both ground beef interventions increased abundance and %AUC for HDL3c, potentially increasing the risk of CVD. Despite frequent moderate ground beef intake (114 g/d), cholesterol intake declined, especially during the HF intervention. For this reason, care should be taken in the interpretation of studies that compare low-fat and low-cholesterol diets to higher-fat and higher-cholesterol diets.

 ,
, 


