Validity of Bioelectrical Impedance Analysis to Estimation Fat-Free Mass in the Army Cadets

 ,
,  and
and
Abstract
:1. Introduction
2. Methods
2.1. Subjects
2.2. Study Design and Ethics
2.3. Measurements
2.4. Selection of Predictive Equations of BIA
2.5. Statistical Analysis
3. Results
4. Discussion
5. Conclusions
Acknowledgments
Author Contributions
Conflicts of Interest
References
- Furth, S.L. Growth and nutrition in children with chronic kidney disease. Adv. Chronic Kidney Dis. 2005, 12, 366–371. [Google Scholar] [CrossRef] [PubMed]
- Matias, C.N.; Santos, D.A.; Júdice, P.B.; Magalhães, J.P.; Minderico, C.S.; Fields, D.A.; Lukaski, H.C.; Sardinha, L.B.; Silva, A.M. Estimation of total body water and extracellular water with bioimpedance in athletes: A need for athlete-specific prediction models. Clin. Nutr. Edinb. Scotl. 2015. [Google Scholar] [CrossRef] [PubMed]
- Siervogel, R.M.; Wisemandle, W.; Maynard, L.M.; Guo, S.S.; Roche, A.F.; Chumlea, W.C.; Towne, B. Serial changes in body composition throughout adulthood and their relationships to changes in lipid and lipoprotein levels. The Fels Longitudinal Study. Arterioscler. Thromb. Vasc. Biol. 1998, 18, 1759–1764. [Google Scholar] [CrossRef] [PubMed]
- Seidell, J.C.; Hautvast, J.G.; Deurenberg, P. Overweight: Fat distribution and health risks. Epidemiological observations. A review. Infus. Basel Switz. 1989, 16, 276–281. [Google Scholar] [CrossRef]
- Roubenoff, R. Sarcopenia and its implications for the elderly. Eur. J. Clin. Nutr. 2000, 54, S40–S47. [Google Scholar] [CrossRef] [PubMed]
- Moon, J.R. Body composition in athletes and sports nutrition: An examination of the bioimpedance analysis technique. Eur. J. Clin. Nutr. 2013, 67, S54–S59. [Google Scholar] [CrossRef] [PubMed]
- Ackland, T.R.; Lohman, T.G.; Sundgot-Borgen, J.; Maughan, R.J.; Meyer, N.L.; Stewart, A.D.; Müller, W. Current status of body composition assessment in sport: Review and position statement on behalf of the ad hoc research working group on body composition health and performance, under the auspices of the I.O.C. Medical Commission. Sports Med. Auckl. N. Z. 2012, 42, 227–249. [Google Scholar] [CrossRef] [PubMed]
- O’Connor, J.S.; Bahrke, M.S.; Tetu, R.G. 1988 active Army physical fitness survey. Mil. Med. 1990, 155, 579–585. [Google Scholar]
- TFM\iManual de Campanha: Treinamento Físico Militar—(C 20 20). Available online: http://pt.slideshare.net/DanielFXA/manual-de-campanha-treinamento-fsico-militar-c-2020 (accessed on 22 February 2016).
- Mattila, V.M.; Tallroth, K.; Marttinen, M.; Pihlajamäki, H. Physical fitness and performance. Body composition by DEXA and its association with physical fitness in 140 conscripts. Med. Sci. Sports Exerc. 2007, 39, 2242–2247. [Google Scholar] [CrossRef] [PubMed]
- Friedl, K.E. Body composition and military performance—Many things to many people. J. Strength Cond. Res. Natl. Strength Cond. Assoc. 2012, 26, S87–S100. [Google Scholar] [CrossRef] [PubMed]
- Silva, A.M.; Minderico, C.S.; Teixeira, P.J.; Pietrobelli, A.; Sardinha, L.B. Body fat measurement in adolescent athletes: Multicompartment molecular model comparison. Eur. J. Clin. Nutr. 2006, 60, 955–964. [Google Scholar] [CrossRef] [PubMed]
- Lukaski, H.C.; Bolonchuk, W.W. Theory and validation of tetrapolar bioelectrical impedance method to assess human body composition. In In Vivo Body Composition Studies; Institute of Phisical Sciences in Medicine: London, UK, 1987; pp. 410–414. [Google Scholar]
- Chumlea, W.C.; Baumgartner, R.N.; Roche, A.F. Specific resistivity used to estimate fat-free mass from segmental body measures of bioelectric impedance. Am. J. Clin. Nutr. 1988, 48, 7–15. [Google Scholar] [PubMed]
- Segal, K.R.; van Loan, M.; Fitzgerald, P.I.; Hodgdon, J.A.; van Itallie, T.B. Lean body mass estimation by bioelectrical impedance analysis: A four-site cross-validation study. Am. J. Clin. Nutr. 1988, 47, 7–14. [Google Scholar] [PubMed]
- Deurenberg, P.; Kusters, C.S.; Smit, H.E. Assessment of body composition by bioelectrical impedance in children and young adults is strongly age-dependent. Eur. J. Clin. Nutr. 1990, 44, 261–268. [Google Scholar] [PubMed]
- Deurenberg, P.; van der Kooy, K.; Leenen, R.; Weststrate, J.A.; Seidell, J.C. Sex and age specific prediction formulas for estimating body composition from bioelectrical impedance: A cross-validation study. Int. J. Obes. 1991, 15, 17–25. [Google Scholar] [PubMed]
- Lohman, T.G. Prediction equations and skinfolds, bioelectric impedance, and body mass index. In Advances in Body Composition Assessment; Human Kinetics: Champaign, IL, USA, 1992; pp. 37–56. [Google Scholar]
- Kotler, D.P.; Burastero, S.; Wang, J.; Pierson, R.N. Prediction of body cell mass, fat-free mass, and total body water with bioelectrical impedance analysis: Effects of race, sex, and disease. Am. J. Clin. Nutr. 1996, 64, 489S–497S. [Google Scholar] [PubMed]
- Sun, S.S.; Chumlea, W.C.; Heymsfield, S.B.; Lukaski, H.C.; Schoeller, D.; Friedl, K.; Kuczmarski, R.J.; Flegal, K.M.; Johnson, C.L.; Hubbard, V.S. Development of bioelectrical impedance analysis prediction equations for body composition with the use of a multicomponent model for use in epidemiologic surveys. Am. J. Clin. Nutr. 2003, 77, 331–340. [Google Scholar] [PubMed]
- Mullie, P.; Vansant, G.; Hulens, M.; Clarys, P.; Degrave, E. Evaluation of body fat estimated from body mass index and impedance in Belgian male military candidates: Comparing two methods for estimating body composition. Mil. Med. 2008, 173, 266–270. [Google Scholar] [CrossRef] [PubMed]
- Aandstad, A.; Holtberget, K.; Hageberg, R.; Holme, I.; Anderssen, S.A. Validity and reliability of bioelectrical impedance analysis and skinfold thickness in predicting body fat in military personnel. Mil. Med. 2014, 179, 208–217. [Google Scholar] [CrossRef] [PubMed]
- Böhm, A.; Heitmann, B.L. The use of bioelectrical impedance analysis for body composition in epidemiological studies. Eur. J. Clin. Nutr. 2013, 67, S79–S85. [Google Scholar] [CrossRef] [PubMed]
- Kyle, U.G.; Bosaeus, I.; de Lorenzo, A.D.; Deurenberg, P.; Elia, M.; Gómez, J.M.; Heitmann, B.L.; Kent-Smith, L.; Melchior, J.-C.; Pirlich, M.; et al. Bioelectrical impedance analysis—Part I: Review of principles and methods. Clin. Nutr. Edinb. Scotl. 2004, 23, 1226–1243. [Google Scholar] [CrossRef] [PubMed]
- Xu, L.; Cheng, X.; Wang, J.; Cao, Q.; Sato, T.; Wang, M.; Zhao, X.; Liang, W. Comparisons of body-composition prediction accuracy: A study of 2 bioelectric impedance consumer devices in healthy Chinese persons using DXA and MRI as criteria methods. J. Clin. Densitom. 2011, 14, 458–464. [Google Scholar] [CrossRef] [PubMed]
- WMA Declaration of Helsinki—Ethical Principles for Medical Research Involving Human Subjects. Available online: http://www.wma.net/en/30publications/10policies/b3/ (accessed on 13 January 2015).
- Lohman, T.G.; Roche, A.F. Anthropometric Standardization Reference Manual; Human Kinetics: Champaign, IL, USA, 1988. [Google Scholar]
- Sun, S.S.; Chumlea, W.C. Statistical Method. In Human Body Composition; Heymsfield, S.B., Wang, Z., Going, S.B., Lohman, T.G., Eds.; Human Kinetis: Champaign, IL, USA, 2005; pp. 151–160. [Google Scholar]
- Lin, L.I. A concordance correlation coefficient to evaluate reproducibility. Biometrics 1989, 45, 255–268. [Google Scholar] [CrossRef] [PubMed]
- Bland, J.M.; Altman, D.G. Statistical methods for assessing agreement between two methods of clinical measurement. Lancet Lond. Engl. 1986, 1, 307–310. [Google Scholar] [CrossRef]
- Horlick, M.; Arpadi, S.M.; Bethel, J.; Wang, J.; Moye, J.; Cuff, P.; Pierson, R.N.; Kotler, D. Bioelectrical impedance analysis models for prediction of total body water and fat-free mass in healthy and HIV-infected children and adolescents. Am. J. Clin. Nutr. 2002, 76, 991–999. [Google Scholar] [PubMed]
- Loftin, M.; Nichols, J.; Going, S.; Sothern, M.; Schmitz, K.H.; Ring, K.; Tuuri, G.; Stevens, J. Comparison of the validity of anthropometric and bioelectric impedance equations to assess body composition in adolescent girls. Int. J. Body Compos. Res. 2007, 5, 1–8. [Google Scholar] [PubMed]
- Deurenberg, P.; van der Kooij, K.; Evers, P.; Hulshof, T. Assessment of body composition by bioelectrical impedance in a population aged greater than 60 years. Am. J. Clin. Nutr. 1990, 51, 3–6. [Google Scholar] [PubMed]
- Wang, Z.; Deurenberg, P.; Wang, W.; Pietrobelli, A.; Baumgartner, R.N.; Heymsfield, S.B. Hydration of fat-free body mass: Review and critique of a classic body-composition constant. Am. J. Clin. Nutr. 1999, 69, 833–841. [Google Scholar] [PubMed]
- Hewitt, M.J.; Going, S.B.; Williams, D.P.; Lohman, T.G. Hydration of the fat-free body mass in children and adults: Implications for body composition assessment. Am. J. Physiol. 1993, 265, E88–E95. [Google Scholar] [PubMed]
- Kyle, U.G.; Bosaeus, I.; de Lorenzo, A.D.; Deurenberg, P.; Elia, M.; Manuel Gómez, J.; Lilienthal Heitmann, B.; Kent-Smith, L.; Melchior, J.-C.; Pirlich, M.; et al. Bioelectrical impedance analysis—Part II: Utilization in clinical practice. Clin. Nutr. Edinb. Scotl. 2004, 23, 1430–1453. [Google Scholar] [CrossRef] [PubMed]
- Sluyter, J.D.; Schaaf, D.; Scragg, R.K.R.; Plank, L.D. Prediction of fatness by standing 8-electrode bioimpedance: A multiethnic adolescent population. Obesity 2010, 18, 183–189. [Google Scholar] [CrossRef] [PubMed]
- Kushner, R.F.; Schoeller, D.A.; Fjeld, C.R.; Danford, L. Is the impedance index (HT2/R) significant in predicting total body water? Am. J. Clin. Nutr. 1992, 56, 835–839. [Google Scholar] [PubMed]
- Lazzer, S.; Bedogni, G.; Agosti, F.; de Col, A.; Mornati, D.; Sartorio, A. Comparison of dual-energy X-ray absorptiometry, air displacement plethysmography and bioelectrical impedance analysis for the assessment of body composition in severely obese Caucasian children and adolescents. Br. J. Nutr. 2008, 100, 918–924. [Google Scholar] [CrossRef] [PubMed]
- Pietrobelli, A.; Wang, Z.; Heymsfield, S.B. Techniques used in measuring human body composition. Curr. Opin. Clin. Nutr. Metab. Care 1998, 1, 439–448. [Google Scholar] [CrossRef] [PubMed]
- Heymsfield, S.B.; Nuñez, C.; Testolin, C.; Gallagher, D. Anthropometry and methods of body composition measurement for research and field application in the elderly. Eur. J. Clin. Nutr. 2000, 54, S26–S32. [Google Scholar] [CrossRef] [PubMed]
- Mazess, R.B.; Barden, H.S.; Bisek, J.P.; Hanson, J. Dual-energy X-ray absorptiometry for total-body and regional bone-mineral and soft-tissue composition. Am. J. Clin. Nutr. 1990, 51, 1106–1112. [Google Scholar] [PubMed]
- Svendsen, O.L.; Haarbo, J.; Hassager, C.; Christiansen, C. Accuracy of measurements of body composition by dual-energy X-ray absorptiometry in vivo. Am. J. Clin. Nutr. 1993, 57, 605–608. [Google Scholar] [PubMed]
- Brandão, C.M.A.; Camargos, B.M.; Zerbini, C.A.; Plapler, P.G.; Mendonça, L.M.; Albergaria, B.-H.; Pinheiro, M.M.; do Prado, M.; Eis, S.R. 2008 official positions of the Brazilian Society for Clinical Densitometry—SBDens. Arq. Bras. Endocrinol. Metabol. 2009, 53, 107–112. [Google Scholar] [CrossRef] [PubMed]
- Roubenoff, R.; Kehayias, J.J.; Dawson-Hughes, B.; Heymsfield, S.B. Use of dual-energy X-ray absorptiometry in body-composition studies: Not yet a “gold standard”. Am. J. Clin. Nutr. 1993, 58, 589–591. [Google Scholar] [PubMed]
- Friedl, K.E.; DeLuca, J.P.; Marchitelli, L.J.; Vogel, J.A. Reliability of body-fat estimations from a four-compartment model by using density, body water, and bone mineral measurements. Am. J. Clin. Nutr. 1992, 55, 764–770. [Google Scholar] [PubMed]
- Nielsen, B.M.; Dencker, M.; Ward, L.; Linden, C.; Thorsson, O.; Karlsson, M.K.; Heitmann, B.L. Prediction of fat-free body mass from bioelectrical impedance among 9- to 11-year-old Swedish children. Diabetes Obes. Metab. 2007, 9, 521–539. [Google Scholar] [CrossRef] [PubMed]
- INEP—Instituto Nacional de Estudos e Pesquisas Educacionais Anísio Teixeira. Mostre sua Raça, Declare sua cor. Available online: http://inep.gov.br/imprensa/noticias/censo/escolar/news05_05.htm (accessed on 19 October 2014).


| Initials | Reference | Sex (n) M/F | Age (Years) | Criterion | Prediction Equation of Fat-Free Mass | R2 | SEE |
|---|---|---|---|---|---|---|---|
| Equation (1) | Lukaski, et al. [13] | 321 b | 18–73 | UW | 0.734 × (S2/R) + 0.116 × Wt + 0.096 × Xc + 0.878 × Sex c − 4.03 | 0.99 | 2.2 |
| Equation (2) | Chumlea, et al. [14] | 77/96 | 18–62 | UW | 0.87 × (S2/Z) + 3.50 | 0.81 | 3.0 |
| Equation (3) | Segal, et al. [15] | 1069/498 | 17–62 | UW | 0.00132 × S2 − 0.04394 × R + 0.3052 × Wt − 0.1676 × Age + 22.66827 | 0.9 d | 3.6 |
| Equation (4) a | Deurenberg, et al. [16] | 130/116 | 7–25 | UW | 0.438 × (S2/Z) + 0.308 × Wt + 1.6 × Sex + 7.04 × S) − 8.50 | 0.99 | 2.4 |
| Equation (5) a | Deurenberg, et al. [17] | 361/466 | 16–83 | UW | 0.34 × (S2/Z) − 0.127 × Age + 0.273 × Wt + 4.56 × Sex c + 15.34 × S − 12.44 | 0.93 | 2.6 |
| Equation (6) | Lohman [18] | 153/153 | 18–30 | UW | 0.485 × (S2/R) + 0.338 × Wt + 5.32 | NR | 2.9 |
| Equation (7) | Kotler, et al. [19] | 206/126 | 18–40 | DXA | 0.50 × (S1.48/Z0.55) × (1.0/1.21) + 0.42 × Wt + 0.49 | 0.9 d | 5.0 e |
| Equation (8) | Sun, et al. [20] | 734/1095 | 12–94 | 4C | 0.65 × (S2/R) + 0.26 × Wt + 0.02 × R − 10.68 | 0.90 | 3.9 |
| Variables | Total (n = 396) | Development (n = 264) | Cross-Validation (n = 132) | ||
|---|---|---|---|---|---|
| Mean ± SD | Mean ± SD | Min–Max | Mean ± SD | Min–Max | |
| Age (years) | 19.2 ± 1.8 | 19.3 ± 1.2 | 17.0–24.0 | 19.1 ± 1.1 | 17.0–24.0 |
| Weight (kg) | 70.0 ± 8.5 | 69.9 ± 8.5 | 45.9–94.8 | 70.3 ± 8.7 | 50.9–99.4 |
| Stature (cm) | 175.8 ± 6.4 | 176.0 ± 6.7 | 159.6–192.7 | 175.3 ± 5.9 | 160.2–190.8 |
| BMI (kg/m2) | 22.6 ± 2.3 | 22.5 ± 2.2 | 16.0–29.7 | 22.8 ± 2.4 | 17.1–32.3 |
| FM (%) | 17.2 ± 3.9 | 17.1 ± 3.7 | 9.0–27.6 | 17.3 ± 4.2 | 10.2–27.8 |
| BMC (kg) | 3.0 ± 0.4 | 3.0 ± 0.4 | 2.0–4.2 | 3.0 ± 0.4 | 2.2–4.2 |
| LST (kg) | 55.2 ± 6.2 | 55.2 ± 6.2 | 38.5–75.4 | 55.2 ± 6.0 | 41.6–75.5 |
| FFM (kg) | 58.2 ± 6.5 | 58.2 ± 6.5 | 40.6–79.5 | 58.3 ± 6.4 | 44.0–79.3 |
| Resistance (Ω) | 479.5 ± 48.8 | 483.8 ± 48.4 | 345.0–669.0 | 470.8 ± 48.7 | 349.0–665.0 |
| Reactance (Ω) | 62.4 ± 7.0 | 63.0 ± 6.7 | 40.0–86.0 | 61.3 ± 7.7 | 27.0–80.0 |
| Impedance (Ω) | 483.6 ± 48.9 | 487.9 ± 48.5 | 349.5–673.4 | 474.9 ± 48.8 | 353.8–668.9 |
| Fat-Free Mass | Difference | CCC Analysis | R2 | SEE (kg) | PE (kg) | |||||
|---|---|---|---|---|---|---|---|---|---|---|
| Mean ± SD | Min–Max | Mean ± SD | % | CCC | ρ | Cb | ||||
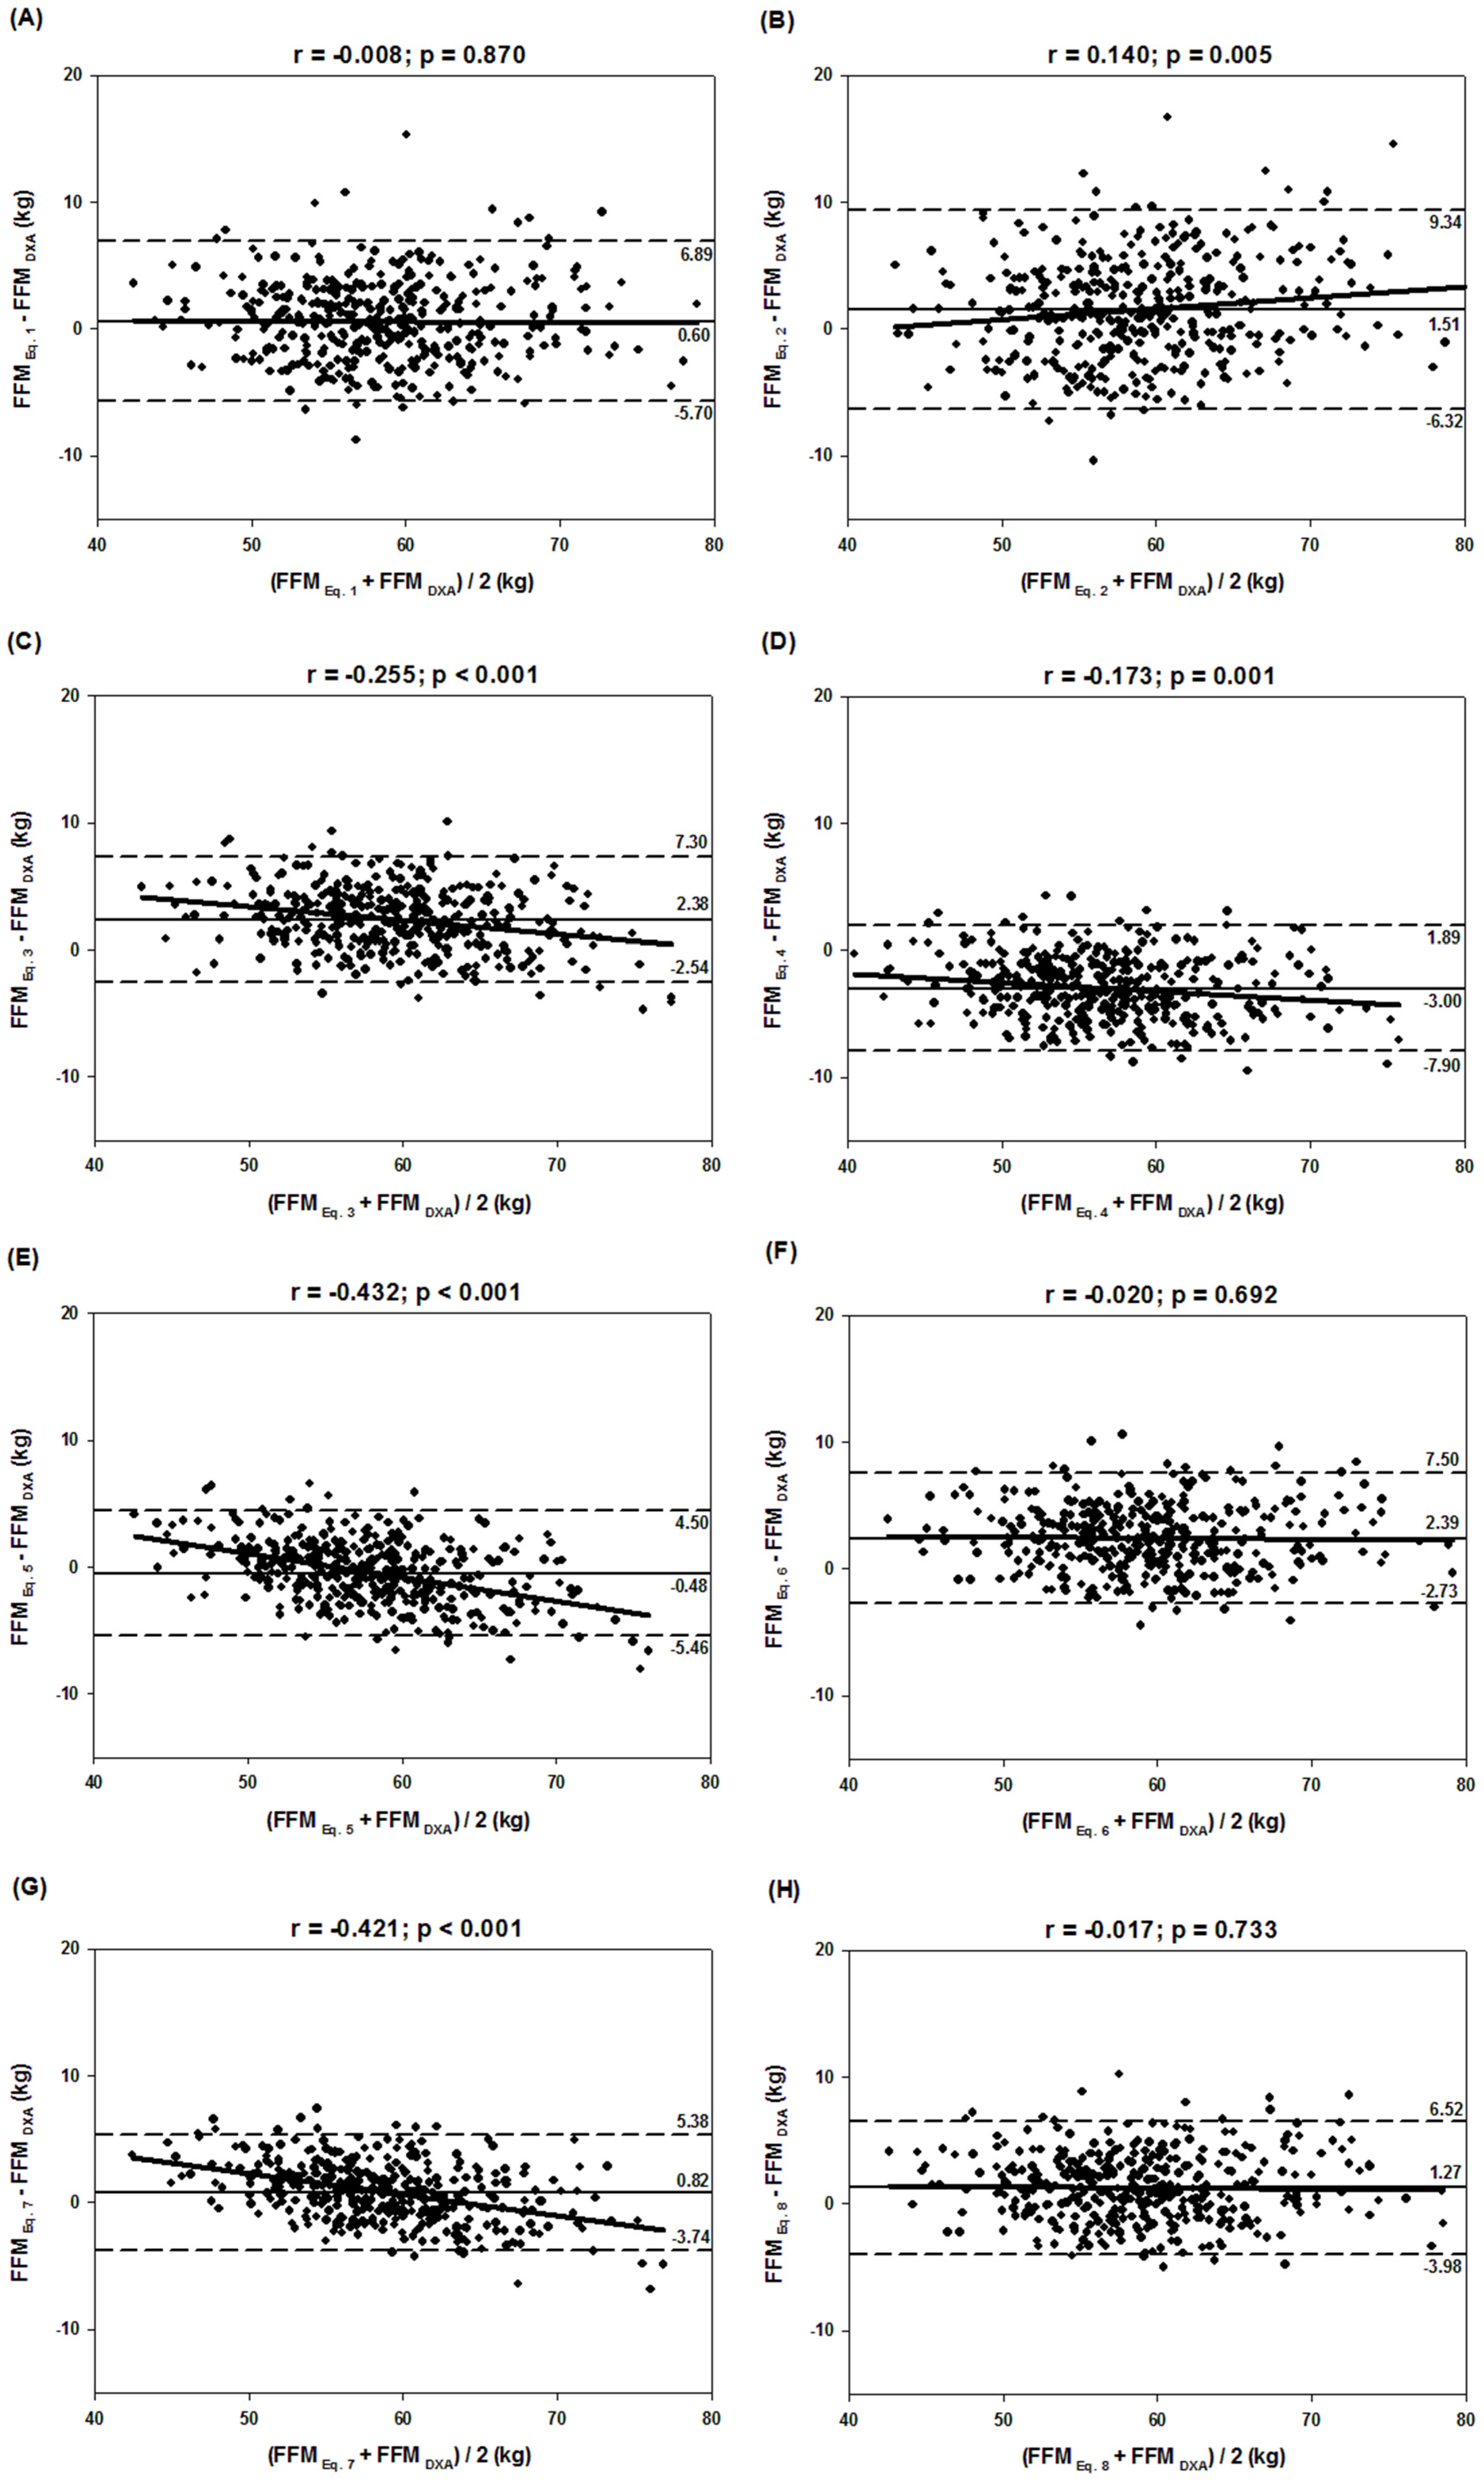
| Equation (1) | 58.8 ± 6.5 a | 44.1–79.9 | 0.6 ± 3.2 | 1.0 | 0.87 | 0.8762 | 0.9957 | 0.77 | 3.1 | 3.3 |
| Equation (2) | 59.7 ± 7.0 a | 42.9–82.7 | 1.5 ± 4.0 | 2.6 | 0.80 | 0.8271 | 0.9724 | 0.68 | 3.6 | 4.3 |
| Equation (3) | 60.6 ± 5.8 a | 45.0–75.6 | 2.4 ± 2.5 | 4.1 | 0.85 | 0.9219 | 0.9259 | 0.85 | 2.5 | 3.5 |
| Equation (4) | 55.2 ± 6.1 a | 40.3–72.5 | −3.0 ± 2.5 | 5.2 | 0.83 | 0.9225 | 0.8945 | 0.85 | 2.5 | 3.9 |
| Equation (5) | 57.7 ± 5.4 a | 44.1–72.7 | −0.5 ± 2.5 | 0.8 | 0.91 | 0.9242 | 0.9805 | 0.85 | 2.5 | 2.6 |
| Equation (6) | 60.6 ± 6.4 a | 44.5–79.8 | 2.4 ± 2.6 | 4.1 | 0.86 | 0.9181 | 0.9355 | 0.84 | 2.6 | 3.6 |
| Equation (7) | 59.0 ± 5.5 a | 44.3–74.7 | 0.8 ± 2.3 | 1.4 | 0.92 | 0.9371 | 0.9781 | 0.88 | 2.3 | 2.5 |
| Equation (8) | 59.5 ± 6.4 a | 44.1–78.9 | 1.3 ± 2.7 | 2.2 | 0.90 | 0.9138 | 0.9808 | 0.84 | 2.6 | 3.0 |
| Equation Specific | ||||||||||
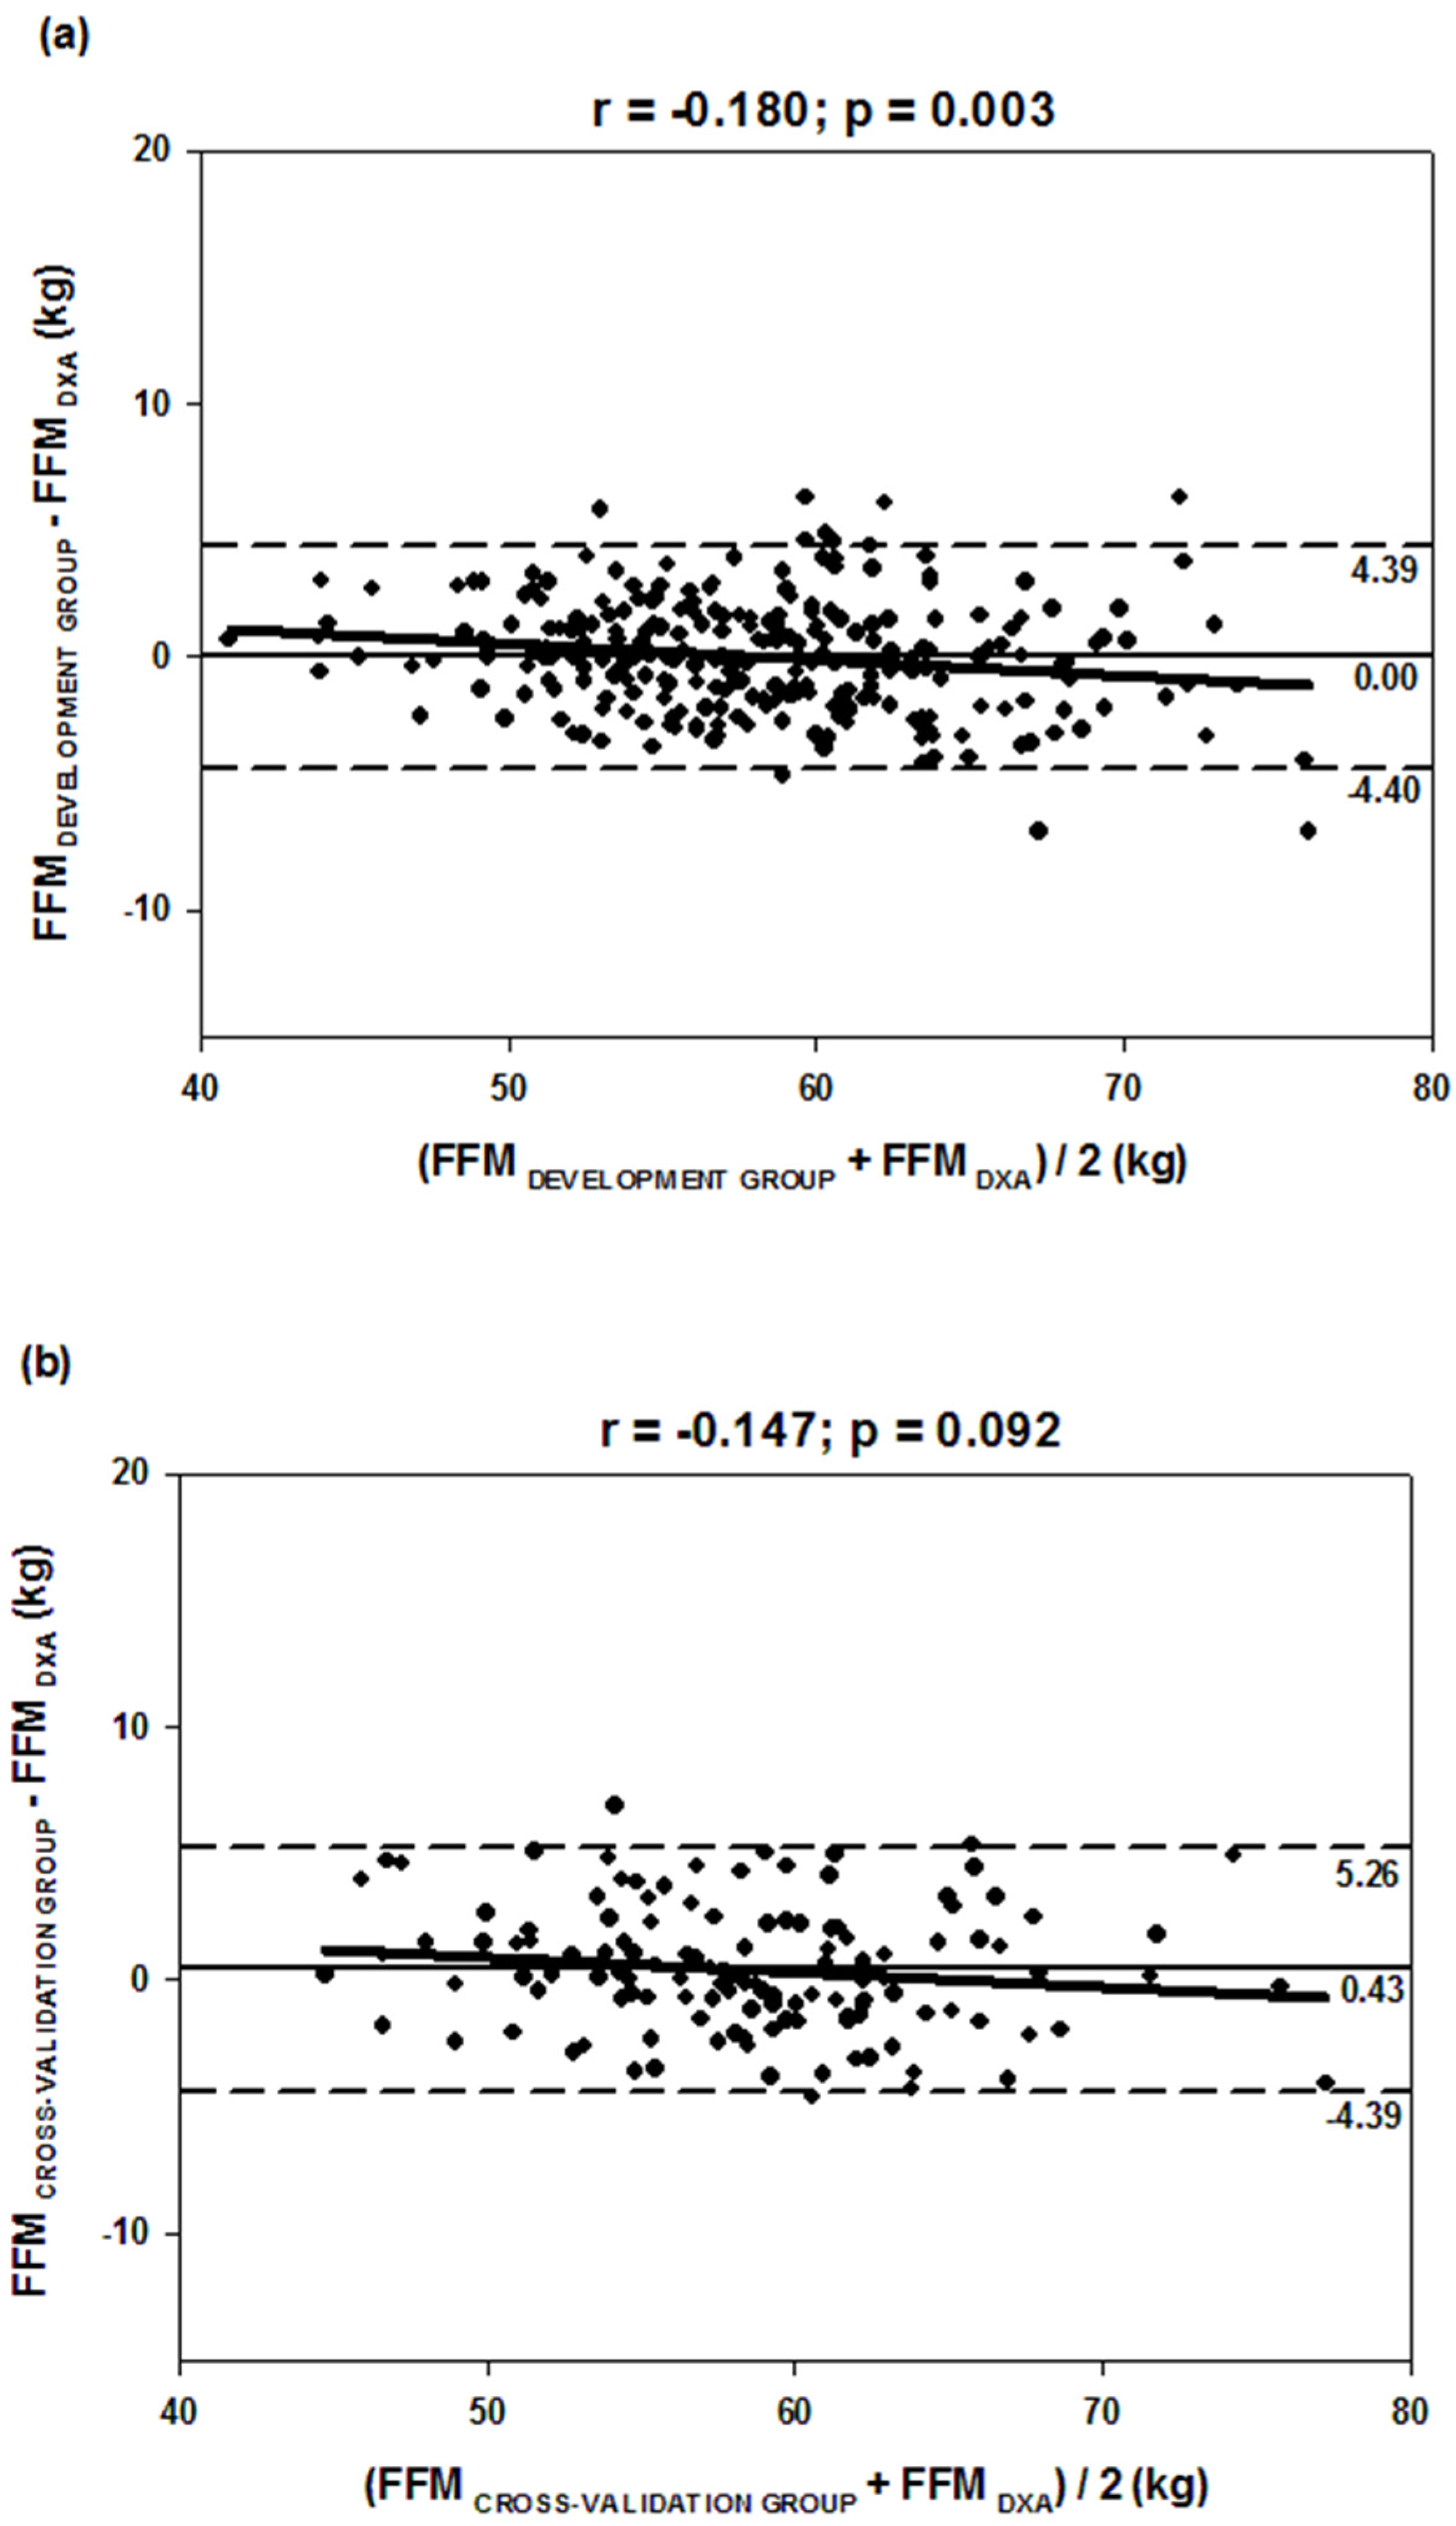
| DG | 58.2 ± 6.1 | 41.3–75.0 | 0.0 ± 2.2 | 0.0 | 0.94 | 0.9392 | 0.9980 | 0.88 | 2.2 | 2.2 |
| CVG | 58.7 ± 6.0 | 44.8–76.7 | 0.4 ± 2.5 | 0.7 | 0.92 | 0.9228 | 0.9959 | 0.85 | 2.5 | 2.5 |
| Total | 58.4 ± 6.1 | 41.3–76.7 | 0.1 ± 2.3 | 0.2 | 0.93 | 0.9334 | 0.9979 | 0.87 | 2.3 | 2.3 |
© 2016 by the authors; licensee MDPI, Basel, Switzerland. This article is an open access article distributed under the terms and conditions of the Creative Commons by Attribution (CC-BY) license (http://creativecommons.org/licenses/by/4.0/).
Share and Cite
Langer, R.D.; Borges, J.H.; Pascoa, M.A.; Cirolini, V.X.; Guerra-Júnior, G.; Gonçalves, E.M. Validity of Bioelectrical Impedance Analysis to Estimation Fat-Free Mass in the Army Cadets. Nutrients 2016, 8, 121. https://0-doi-org.brum.beds.ac.uk/10.3390/nu8030121
Langer RD, Borges JH, Pascoa MA, Cirolini VX, Guerra-Júnior G, Gonçalves EM. Validity of Bioelectrical Impedance Analysis to Estimation Fat-Free Mass in the Army Cadets. Nutrients. 2016; 8(3):121. https://0-doi-org.brum.beds.ac.uk/10.3390/nu8030121
Chicago/Turabian StyleLanger, Raquel D., Juliano H. Borges, Mauro A. Pascoa, Vagner X. Cirolini, Gil Guerra-Júnior, and Ezequiel M. Gonçalves. 2016. "Validity of Bioelectrical Impedance Analysis to Estimation Fat-Free Mass in the Army Cadets" Nutrients 8, no. 3: 121. https://0-doi-org.brum.beds.ac.uk/10.3390/nu8030121