The Effect of Gestational and Lactational Age on the Human Milk Metabolome

 ,
, 
Abstract
:1. Introduction
2. Materials and Methods
2.1. Ethical Approval
2.2. Samples and Sample Collection
2.2.1. Pre-term Samples
2.2.2. Full-term Samples
2.3. NMR Spectroscopy
2.4. Secretor Status
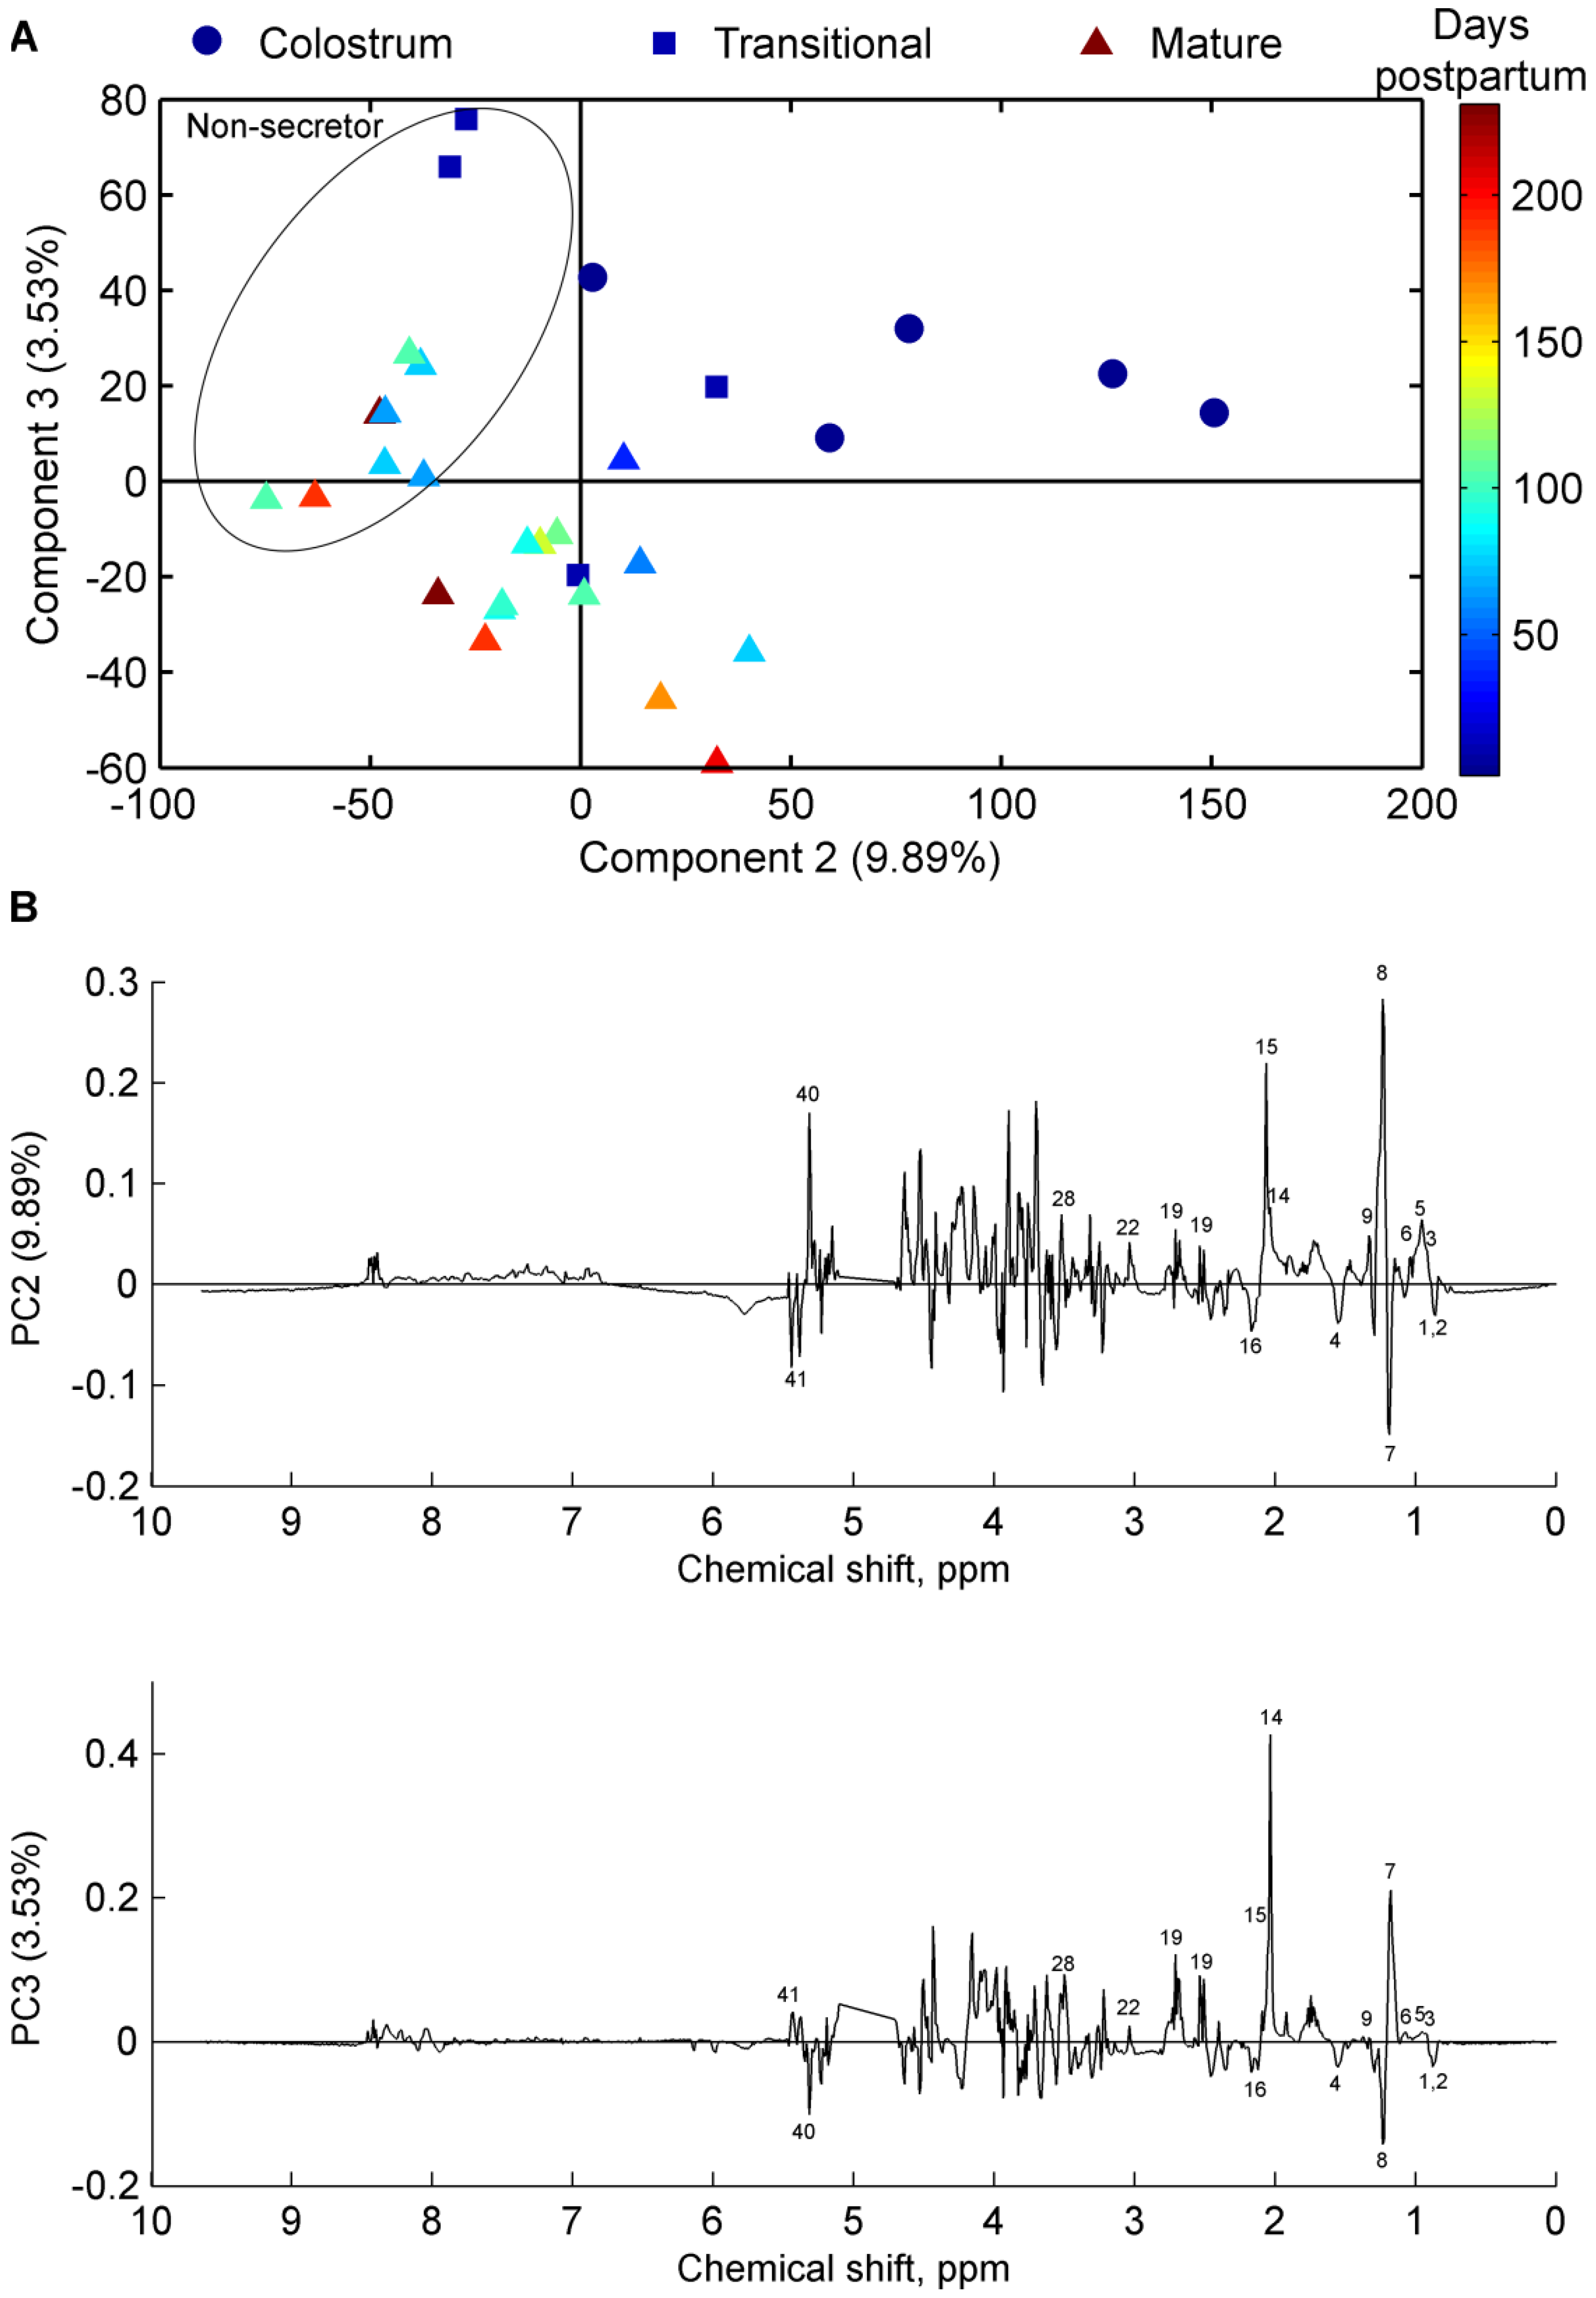
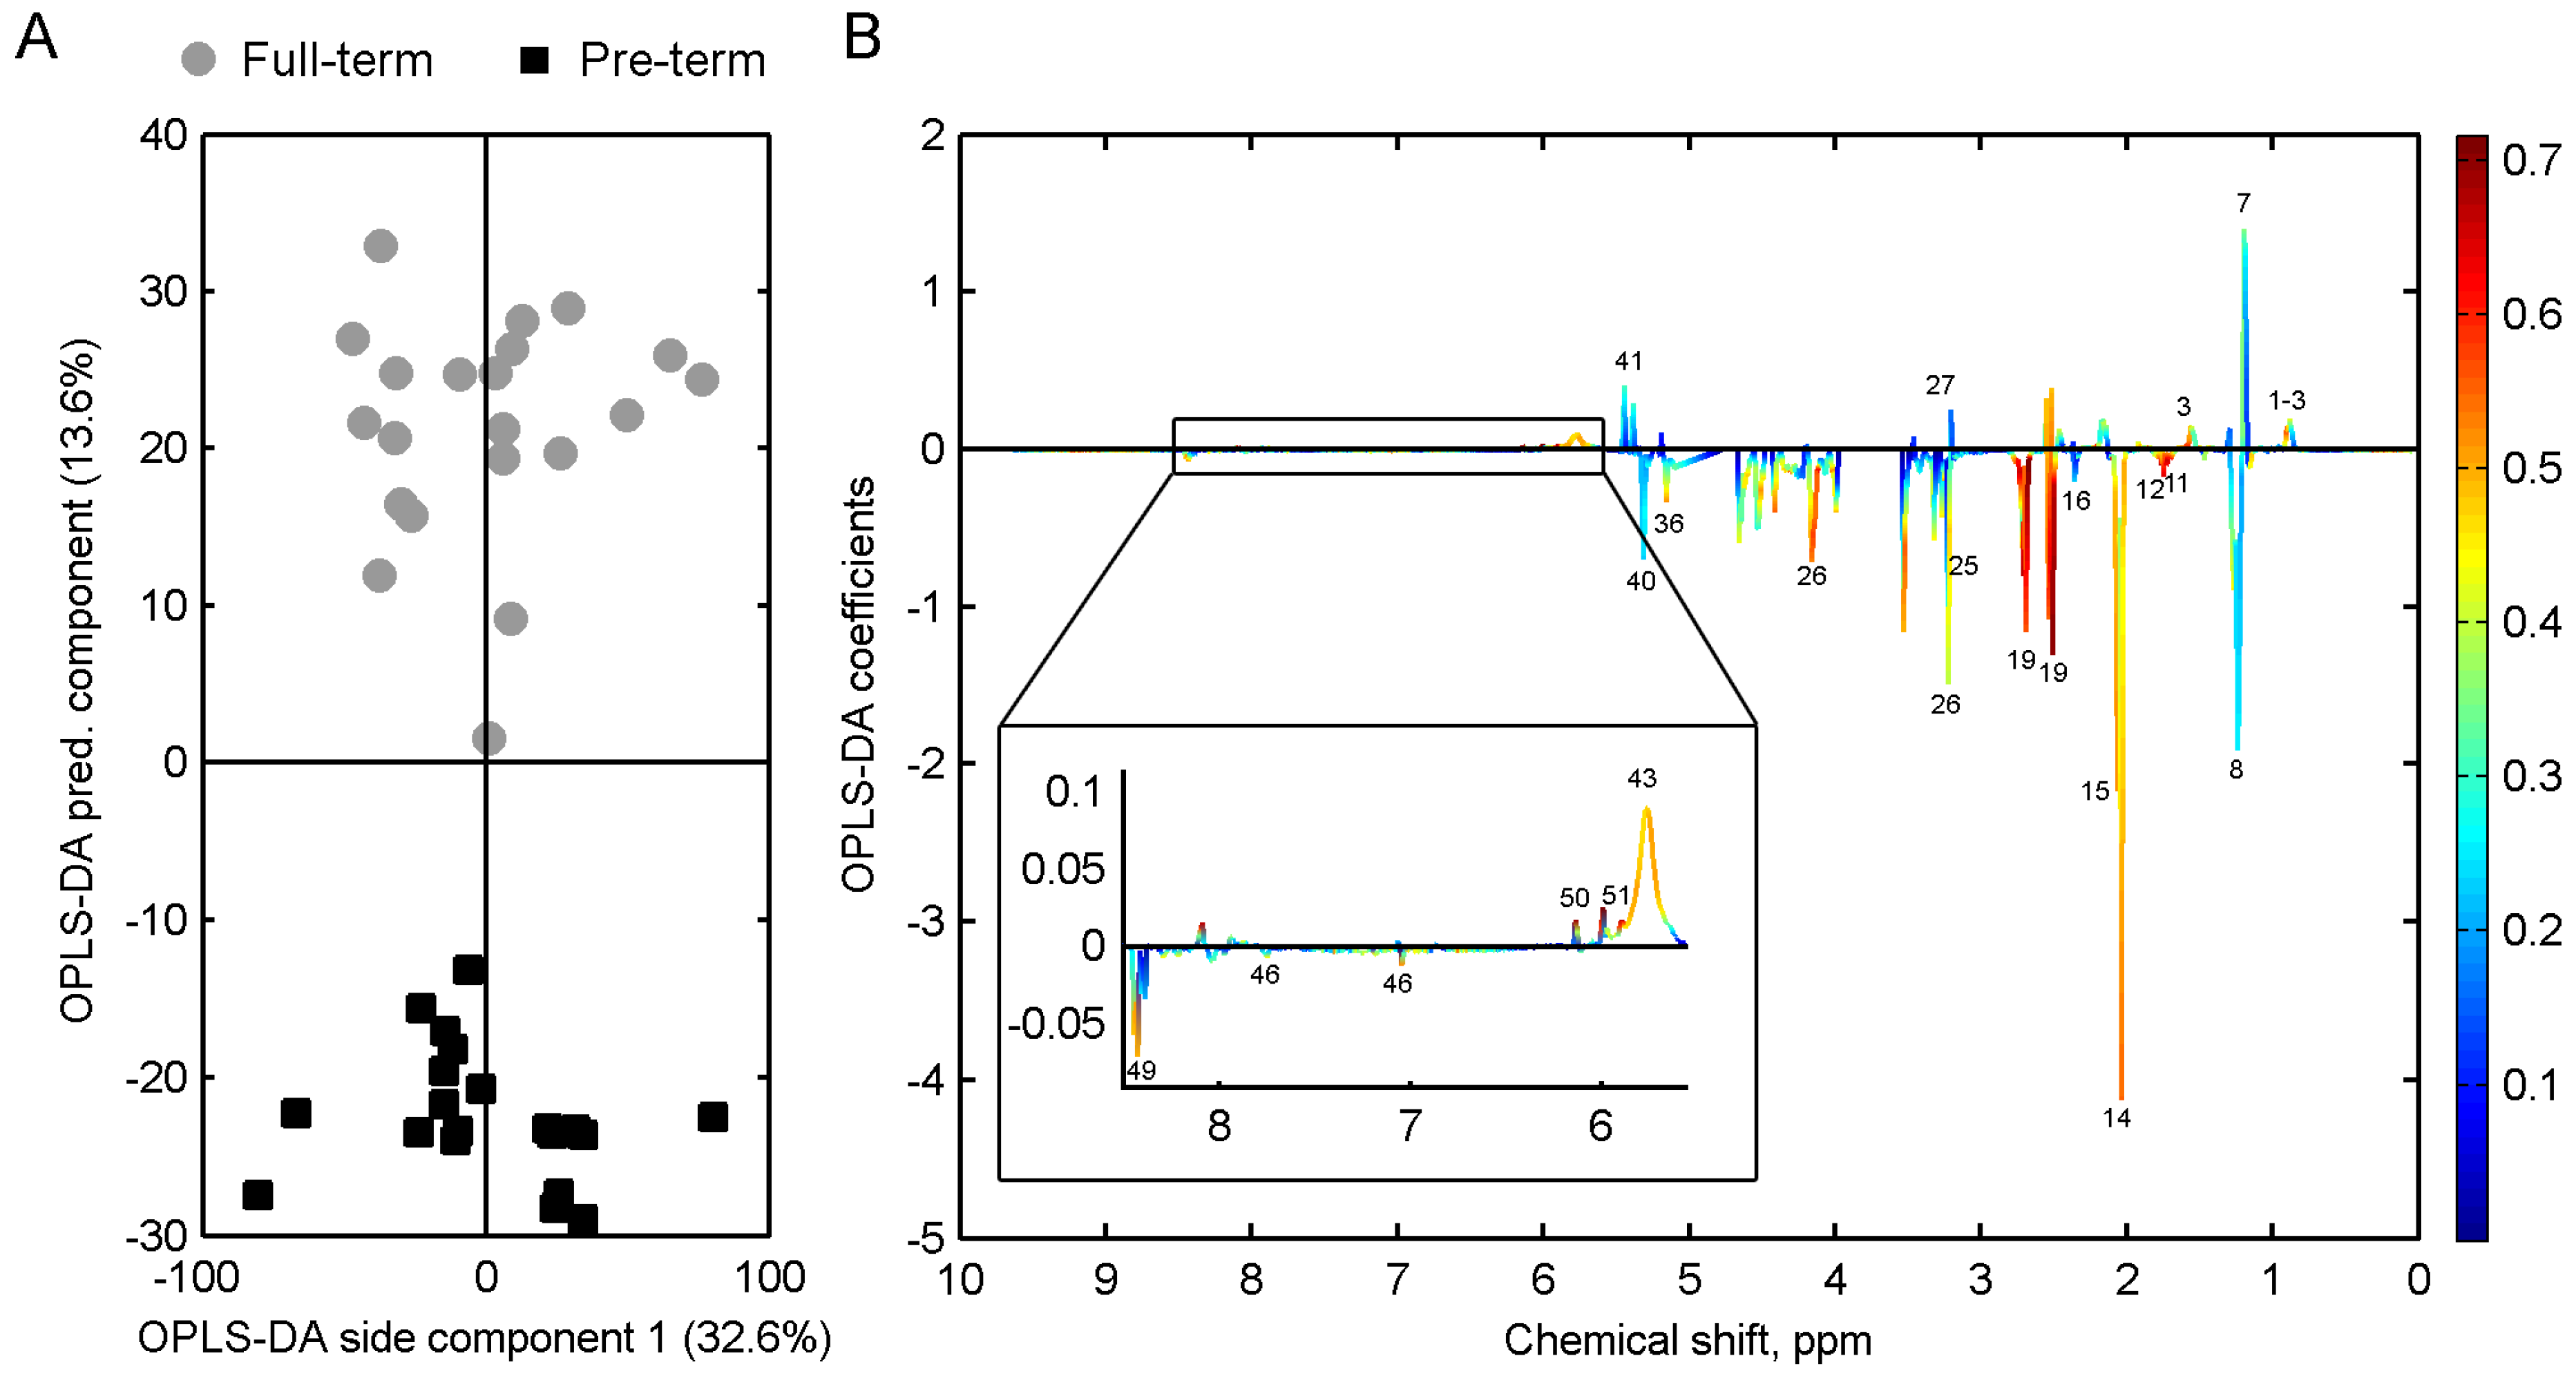
2.5. Multivariate Data and Statistical Analyses
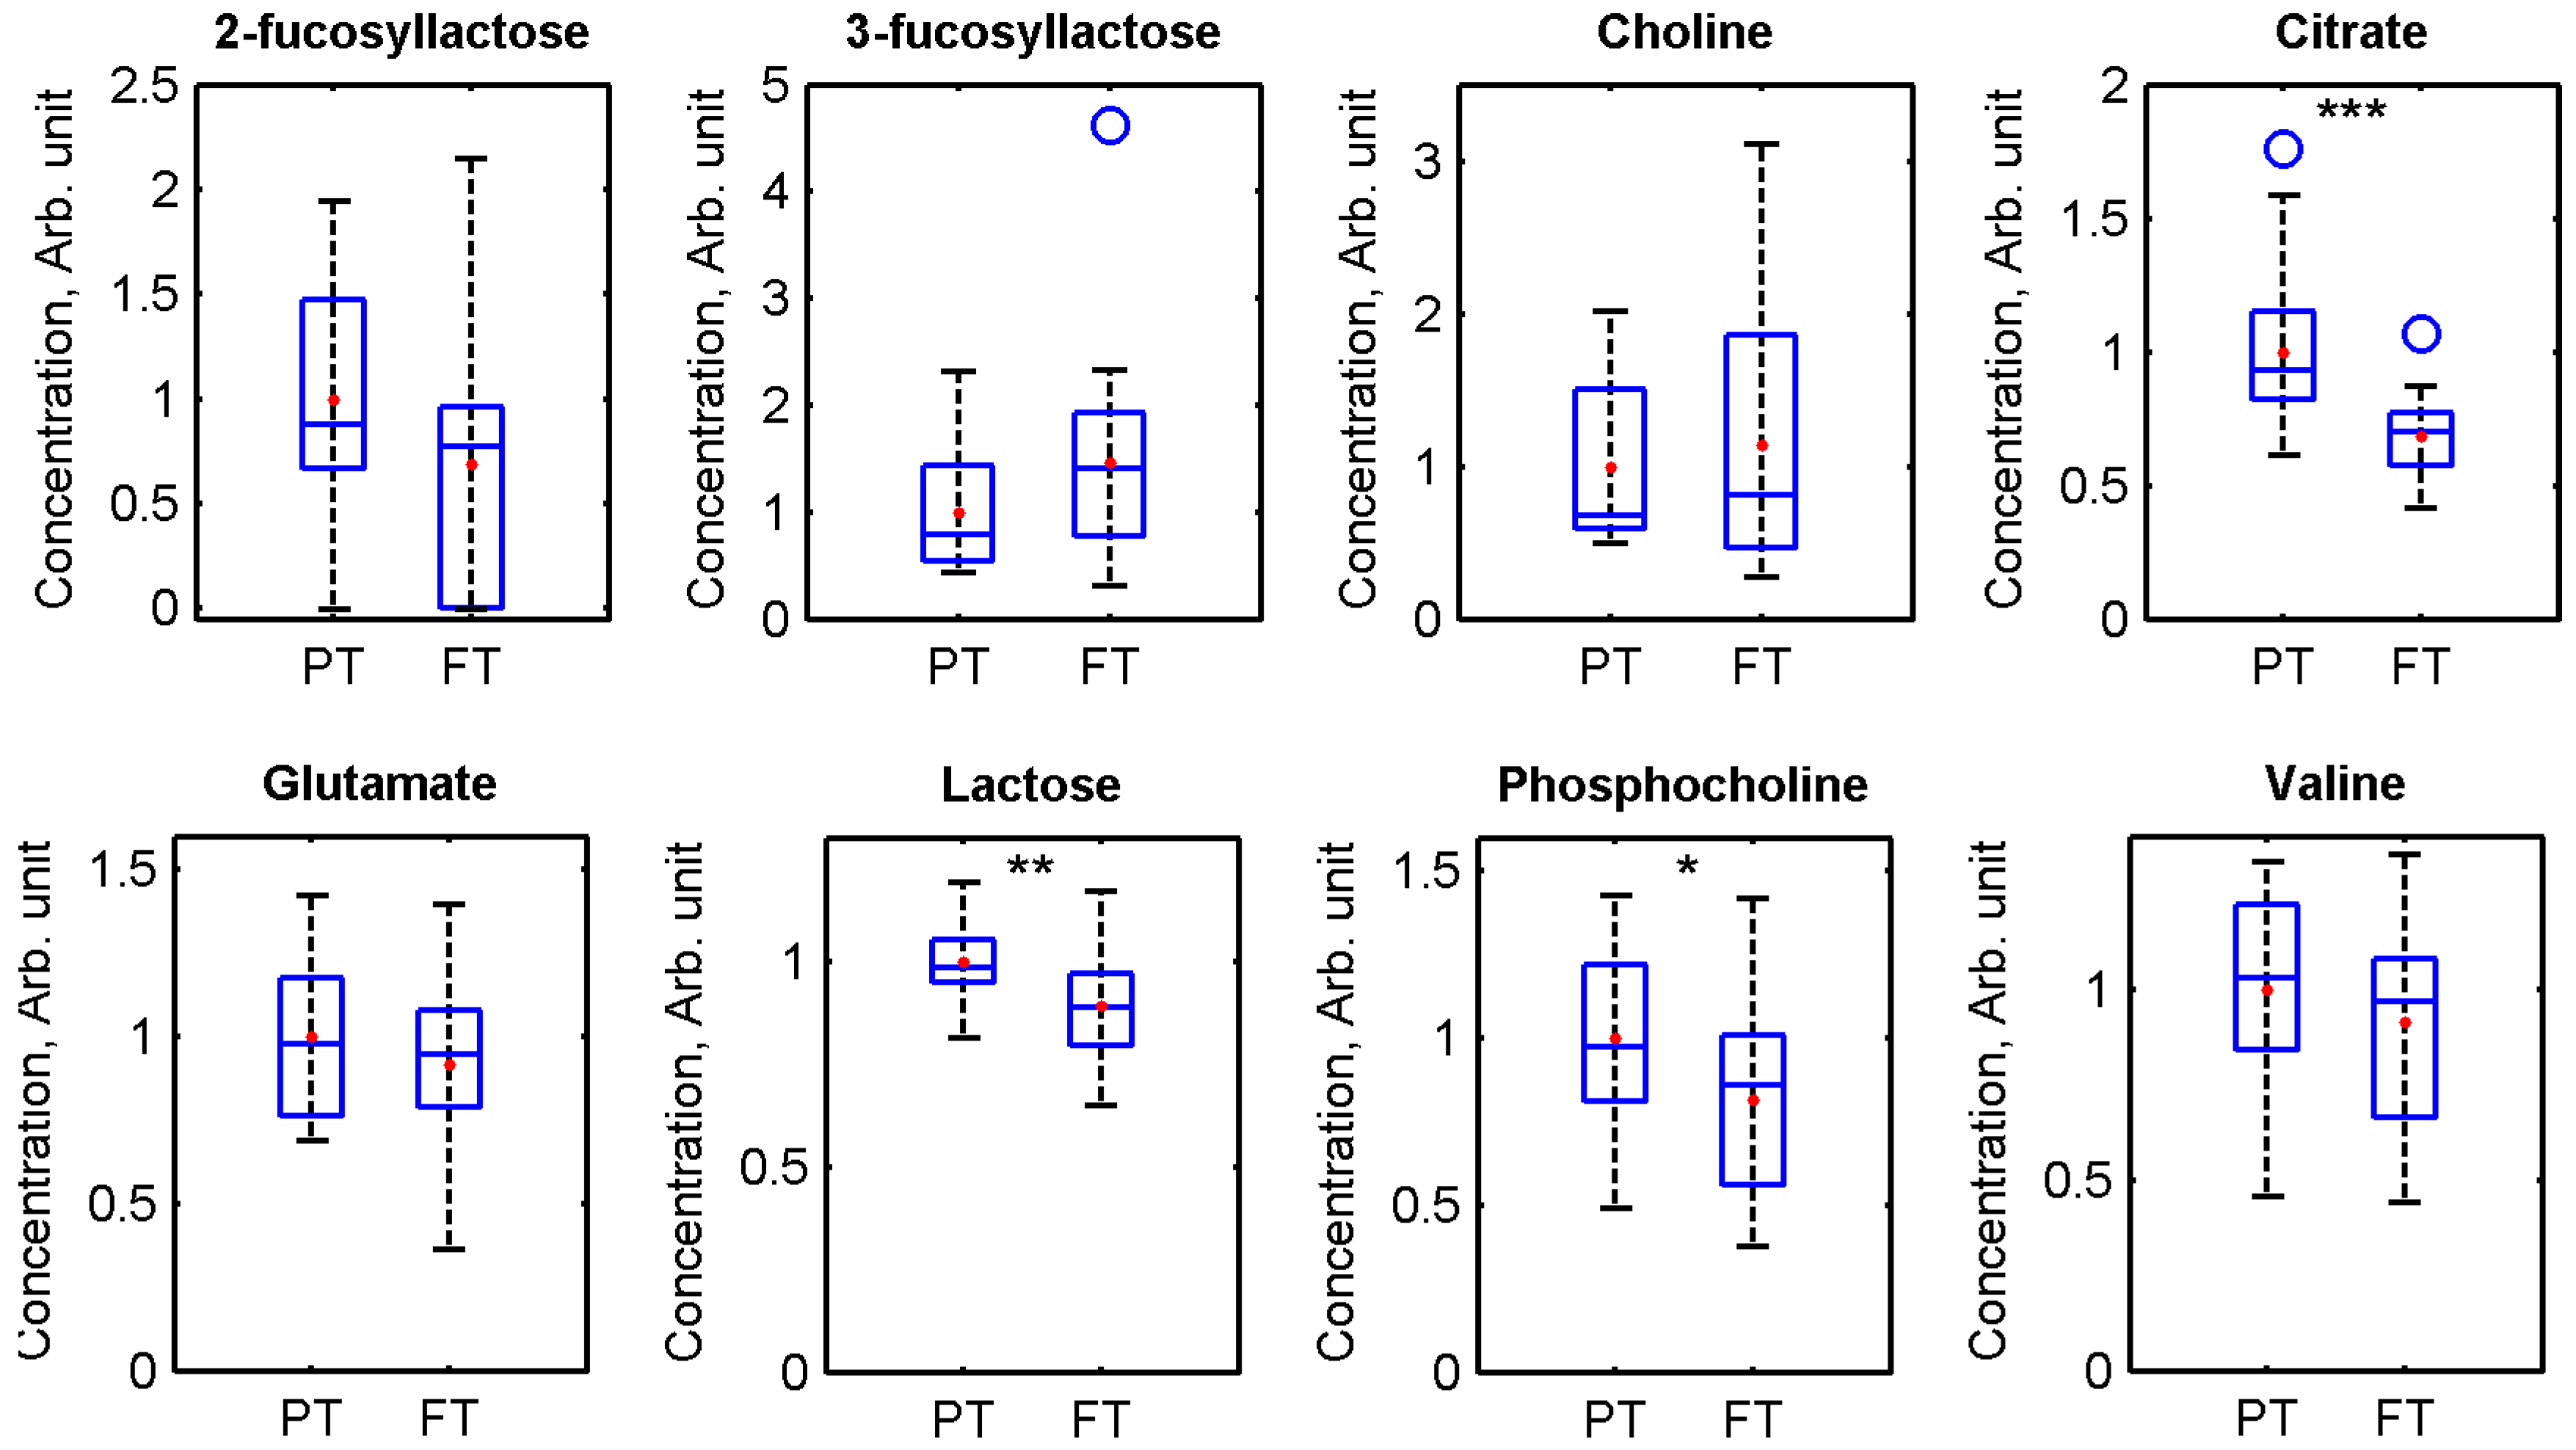
3. Results
4. Discussion
Acknowledgments
Author Contributions
Conflicts of Interest
Abbreviations
| HM | Human milk |
| HMO | Human milk oligosaccharide |
| NMR | Nuclear magnetic resonance |
References
- Wu, T.C.; Chen, P.H. Health consequences of nutrition in childhood and early infancy. Pediatr. Neonatol. 2009, 50, 135–142. [Google Scholar] [CrossRef]
- Da Costa, T.H.M.; Haisma, H.; Wells, J.C.K.; Mander, A.P.; Whitehead, R.G.; Bluck, L.J.C. How much human milk do infants consume? Data from 12 countries using a standardized stable isotope methodology. J. Nutr. 2010, 140, 2227–2232. [Google Scholar] [PubMed]
- Isaacs, E.B.; Morley, R.; Lucas, A. Early diet and general cognitive outcome at adolescence in children born at or below 30 weeks gestation. J. Pediatr. 2009, 155, 229–234. [Google Scholar] [CrossRef] [PubMed]
- Lawrence, R.M. Breastfeeding, Host-resistance factors and immunologic significance of human milk. In Breastfeeding. A guide for the medical profession; Lawrence, R.A., Lawrence, R.M., Eds.; Elsevier: Philadelphia, PA, USA, 2006; pp. 171–214. [Google Scholar]
- Sullivan, S.; Schanler, R.J.; Kim, J.H.; Patel, A.L.; Trawöger, R.; Kiechl-Kohlendorfer, U.; Chan, G.M.; Blanco, C.L.; Abrams, S.; Cotten, C.M.; et al. An exclusively human milk-based diet is associated with a lower rate of necrotizing enterocolitis than a diet of human milk and bovine milk-based products. J. Pediatr. 2010, 156, 562–567. [Google Scholar] [CrossRef] [PubMed]
- Jantscher-Krenn, E.; Zherebtsov, M.; Nissan, C.; Goth, K.; Guner, Y.S.; Naidu, N.; Choudhury, B.; Grishin, A.V.; Ford, H.R.; Bode, L. The human milk oligosaccharide disialyllacto-N-tetraose prevents necrotising enterocolitis in neonatal rats. Gut 2012, 61, 1417–1425. [Google Scholar] [CrossRef] [PubMed]
- Mikkola, K.; Ritari, N.; Tommiska, V.; Salokorpi, T.; Lehtonen, L.; Tammela, O.; Pääkkönen, L.; Olsen, P.; Korkman, M.; Fellman, V. Neurodevelopmental outcome at 5 years of age of a national cohort of extremely low birth weight infants who were born in 1996–1997. Pediatrics 2005, 116, 1391–1400. [Google Scholar] [CrossRef] [PubMed]
- Sauer, P.J. Can extrauterine growth approximate intrauterine growth? Should it? Am. J. Clin. Nutr. 2007, 85, 608S–613S. [Google Scholar] [PubMed]
- Faerk, J.; Petersen, S.; Peitersen, B.; Michaelsen, K.F. Diet and bone mineral content at term in premature infants. Pediatr. Res. 2000, 47, 148–156. [Google Scholar] [CrossRef] [PubMed]
- Gross, S.J. Bone mineralization in preterm infants fed human milk with and without mineral supplementation. J. Pediatr. 1987, 111, 450–458. [Google Scholar] [CrossRef]
- Martins, E.C.; Krebs, V.L.J. Effects of the use of fortified raw maternal milk on very low birth weight infants. J. Pediatr. 2009, 85, 157–162. [Google Scholar] [CrossRef]
- Nicholl, R.M.; Gamsu, H.R. Changes in growth and metabolism in very low birthweight infants fed with fortified breast milk. Acta. Paediatr. 1999, 88, 1056–1061. [Google Scholar] [CrossRef] [PubMed]
- Pettifor, J.M.; Rajah, R.; Venter, A.; Moodley, G.P.; Opperman, L.; Cavaleros, M.; Ross, F.P. Bone mineralization and mineral homeostasis in very low-birth-weight infants fed either human milk or fortified human milk. J. Pediatr. Gastroenterol. Nutr. 1989, 8, 217–224. [Google Scholar] [CrossRef] [PubMed]
- Bauer, J.; Gerss, J. Longitudinal analysis of macronutrients and minerals in human milk produced by mothers of preterm infants. Clin. Nutr. 2011, 30, 215–220. [Google Scholar] [CrossRef] [PubMed]
- Armaforte, E.; Curran, E.; Huppertz, T.; Ryan, C.A.; Caboni, M.F.; O’Connor, P.M.; Ross, R.P.; Hirtz, C.; Sommerer, N.; Chevalier, F.; et al. Proteins and proteolysis in pre-term and term human milk and possible implications for infant formulae. Int. Dairy J. 2010, 20, 715–723. [Google Scholar] [CrossRef]
- Boudonck, K.J.; Mitchell, M.W.; Wulff, J.; Ryals, J.A. Characterization of the biochemical variability of bovine milk using metabolomics. Metabolomics 2009, 5, 375–386. [Google Scholar] [CrossRef]
- Buitenhuis, A.J.; Sundekilde, U.K.; Poulsen, N.A.; Bertram, H.C.; Larsen, L.B.; Sørensen, P. Estimation of genetic parameters and detection of quantitative trait loci for metabolites in Danish Holstein milk. J. Dairy Sci. 2013, 96, 3285–3295. [Google Scholar] [CrossRef] [PubMed]
- Klein, M.S.; Almstetter, M.F.; Schlamberger, G.; Nurnberger, N.; Dettmer, K.; Oefner, P.J.; Meyer, H.H.D.; Wiedemann, S.; Gronwald, W. Nuclear magnetic resonance and mass spectrometry-based milk metabolomics in dairy cows during early and late lactation. J. Dairy Sci. 2010, 93, 1539–1550. [Google Scholar] [CrossRef] [PubMed]
- Maher, A.D.; Hayes, B.; Cocks, B.; Marett, L.; Wales, W.J.; Rochfort, S. Latent biochemical relationships in the blood-milk metabolic axis of dairy cows revealed by statistical integration of 1H NMR spectroscopic data. J. Proteome Res. 2013, 12, 1428–1435. [Google Scholar] [CrossRef] [PubMed]
- Sundekilde, U.K.; Larsen, L.B.; Bertram, H.C. NMR-Based Milk Metabolomics. Metabolites 2013, 3, 204–222. [Google Scholar] [PubMed]
- Andreas, N.J.; Hyde, M.J.; Gomez-Romero, M.; Lopez-Gonzalvez, M.A.; Villaseñor, A.; Wijeyesekera, A.; Barbas, C.; Modi, N.; Holmes, E.; Garcia-Perez, I. Multiplatform characterization of dynamic changes in breast milk during lactation. Electrophoresis 2015, 36, 2269–2285. [Google Scholar] [CrossRef] [PubMed]
- Longini, M.; Tataranno, M.L.; Proietti, F.; Tortoriello, M.; Belvisi, E.; Vivi, A.; Tassini, M.; Perrone, S.; Buonocore, G. A metabolomic study of preterm and term human and formula milk by proton MRS analysis: Preliminary results. J. Matern. Neonatal Med. 2014, 27, 27–33. [Google Scholar] [CrossRef] [PubMed]
- Marincola, F.C.; Dessì, A.; Corbu, S.; Reali, A.; Fanos, V. Clinical impact of human breast milk metabolomics. Clin. Chim. Acta. 2015, 451, 103–106. [Google Scholar] [CrossRef] [PubMed]
- Marincola, F.C.; Noto, A.; Caboni, P.; Reali, A.; Barberini, L.; Lussu, M.; Murgia, F.; Santoru, M.L.; Atzori, L.; Fanos, V. A metabolomic study of preterm human and formula milk by high resolution NMR and GC/MS analysis: Preliminary results. J. Matern. Neonatal Med. 2012, 25, 62–67. [Google Scholar] [CrossRef] [PubMed]
- Praticò, G.; Capuani, G.; Tomassini, A.; Baldassarre, M.E.; Delfini, M.; Miccheli, A. Exploring human breast milk composition by NMR-based metabolomics. Nat. Prod. Res. 2014, 28, 95–101. [Google Scholar] [CrossRef] [PubMed]
- Smilowitz, J.T.; O’Sullivan, A.; Barile, D.; German, J.B.; Lönnerdal, B.; Slupsky, C.M. The human milk metabolome reveals diverse oligosaccharide profiles. J. Nutr. 2013, 143, 1709–1718. [Google Scholar] [CrossRef] [PubMed]
- Spevacek, A.R.; Smilowitz, J.T.; Chin, E.L.; Underwood, M.A.; German, J.B.; Slupsky, C.M. Infant maturity at birth reveals minor differences in the maternal milk metabolome in the first month of lactation. J. Nutr. 2015, 145, 1698–1708. [Google Scholar] [CrossRef] [PubMed]
- Wu, J.; Domellöf, M.; Zivkovic, A.M.; Larsson, G.; Öhman, A.; Nording, M.L. NMR-based metabolite profiling of human milk: A pilot study of methods for investigating compositional changes during lactation. Biochem. Biophys. Res. Commun. 2015, 469, 626–632. [Google Scholar] [CrossRef] [PubMed]
- Sundekilde, U.K.; Poulsen, N.A.; Larsen, L.B.; Bertram, H.C. Nuclear magnetic resonance metabonomics reveals strong association between milk metabolites and somatic cell count in bovine milk. J. Dairy Sci. 2013, 96, 290–299. [Google Scholar] [CrossRef] [PubMed]
- Wishart, D.S.; Knox, C.; Guo, A.C.; Eisner, R.; Young, N.; Gautam, B.; Hau, D.D.; Psychogios, N.; Dong, E.; Bouatra, S.; et al. HMDB: A knowledgebase for the human metabolome. Nucleic Acids Res. 2009, 37, D603–D610. [Google Scholar] [CrossRef] [PubMed]
- Savorani, F.; Tomasi, G.; Engelsen, S.B. icoshift: A versatile tool for the rapid alignment of 1D NMR spectra. J. Magn. Reson. 2010, 202, 190–202. [Google Scholar] [CrossRef] [PubMed]
- Cloarec, O.; Dumas, M.E.; Trygg, J.; Craig, A.; Barton, R.H.; Lindon, J.C.; Nicholson, J.K.; Holmes, E. Evaluation of the orthogonal projection on latent structure model limitations caused by chemical shift variability and improved visualization of biomarker changes in 1H NMR spectroscopic metabonomic studies. Anal. Chem. 2005, 77, 517–526. [Google Scholar] [CrossRef] [PubMed]
- Thurl, S.; Munzert, M.; Henker, J.; Boehm, G.; Müller-Werner, B.; Jelinek, J.; Stahl, B. Variation of human milk oligosaccharides in relation to milk groups and lactational periods. Br. J. Nutr. 2010, 104, 1261–1271. [Google Scholar] [CrossRef] [PubMed]
- Dessì, A.; Ottonello, G.; Fanos, V. Physiopathology of intrauterine growth retardation: From classic data to metabolomics. J. Matern. Neonatal Med. 2012, 25 (Suppl. 5), 13–18. [Google Scholar] [CrossRef] [PubMed]
- Palmas, F.; Fattuoni, C.; Noto, A.; Barberini, L.; Dessì, A.; Fanos, V. The choice of amniotic fluid in metabolomics for the monitoring of fetus health. Expert Rev. Mol. Diagn. 2016, 7159, 1–14. [Google Scholar] [CrossRef] [PubMed]
- Klein, M.S.; Buttchereit, N.; Miemczyk, S.P.; Immervoll, A.K.; Louis, C.; Wiedemann, S.; Junge, W.; Thaller, G.; Oefner, P.J.; Gronwald, W. NMR metabolomic analysis of dairy cows reveals milk glycerophosphocholine to phosphocholine ratio as prognostic biomarker for risk of ketosis. J. Proteome Res. 2012, 11, 1373–1381. [Google Scholar] [CrossRef] [PubMed]
- McManaman, J.L.; Neville, M.C. Mammary physiology and milk secretion. Adv. Drug Deliv. Rev. 2003, 55, 629–641. [Google Scholar] [CrossRef]
- Molinari, C.E.; Casadio, Y.S.; Hartmann, B.T.; Livk, A.; Bringans, S.; Arthur, P.G.; Hartmann, P.E. Proteome mapping of human skim milk proteins in term and preterm milk. J. Proteome Res. 2012, 11, 1696–1714. [Google Scholar] [CrossRef] [PubMed]
- Whitmore, T.J.; Trengove, N.J.; Graham, D.F.; Hartmann, P.E. Analysis of insulin in human breast milk in mothers with type 1 and type 2 diabetes mellitus. Int. J. Endocrinol. 2012, 2012, 296368. [Google Scholar] [CrossRef] [PubMed]
- Kelly, R.J.; Rouquier, S.; Giorgi, D.; Lennon, G.G.; Lowe, J.B. Sequence and Expression of a Candidate for the Human Secretor Blood Group (1,2) Fucosyltransferase Gene (FUT2): Homozygosity for an enzyme-inactivating nonsense mutation commonly correlates with the non-secretor phenotype. J. Biol. Chem. 1995, 270, 4640–4649. [Google Scholar] [CrossRef] [PubMed]
- Totten, S.M.; Zivkovic, A.M.; Wu, S.; Ngyuen, U.; Freeman, S.L.; Ruhaak, L.R.; Darboe, M.K.; German, J.B.; Prentice, A.M.; Lebrilla, C.B. Comprehensive profiles of human milk oligosaccharides yield highly sensitive and specific markers for determining secretor status in lactating mothers. J. Proteome Res. 2012, 11, 6124–6133. [Google Scholar] [CrossRef] [PubMed]
- Beijers, R.J.W.; Schaafsma, A. Long-chain polyunsaturated fatty acid content in Dutch preterm breast milk; differences in the concentrations of docosahexaenoic acid and arachidonic acid due to length of gestation. Early Hum. Dev. 1996, 44, 215–223. [Google Scholar] [CrossRef]
- Coppa, G.V.; Gabrielli, O.; Pierani, P.; Catassi, C.; Carlucci, A.; Giorgi, P.L. Changes in carbohydrate composition in human milk over 4 months of lactation. Pediatrics 1993, 91, 637–641. [Google Scholar] [PubMed]
- Villaseñor, A.; Garcia-Perez, I.; Garcia, A.; Posma, J.M.; Fernández-López, M.; Nicholas, A.J.; Modi, N.; Holmes, E.; Barbas, C. Breast milk metabolome characterization in a single-phase extraction, multiplatform analytical approach. Anal. Chem. 2014, 86, 8245–8252. [Google Scholar] [CrossRef] [PubMed]
- De Leoz, M.L.A.; Gaerlan, S.C.; Strum, J.S.; Dimapasoc, L.M.; Mirmiran, M.; Tancredi, D.J.; Smilowitz, J.T.; Kalanetra, K.M.; Mills, D.A.; German, J.B.; et al. Lacto-N-tetraose, fucosylation, and secretor status are highly variable in human milk oligosaccharides from women delivering preterm. J. Proteome Res. 2012, 11, 4662–4672. [Google Scholar] [CrossRef] [PubMed]
- Torrazza, R.M.; Neu, J. The altered gut microbiome and necrotizing enterocolitis. Clin. Perinatol. 2013, 40, 93–108. [Google Scholar] [CrossRef] [PubMed]
- Zhang, Z.; Adelman, A.S.; Rai, D.; Boettcher, J.; Lőnnerdal, B. Amino acid profiles in term and preterm human milk through lactation: A systematic review. Nutr. 2013, 5, 4800–4821. [Google Scholar] [CrossRef] [PubMed]
- Atkinson, S.; Anderson, G.; Bryan, M. Human milk: Comparison of the nitrogen composition in milk from mothers of premature and full-term infants. Am. J. Clin. Nutr. 1980, 33, 811–815. [Google Scholar] [PubMed]
- Chuang, C.K.; Lin, S.P.; Lee, H.C.; Wang, T.J.; Shih, Y.S.; Huang, F.Y.; Yeung, C.Y. Free amino acids in full-term and pre-term human milk and infant formula. J. Pediatr. Gastroenterol. Nutr. 2005, 40, 496–500. [Google Scholar] [CrossRef] [PubMed]
- Moltó-Puigmartí, C.; Castellote, A.I.; Carbonell-Estrany, X.; López-Sabater, M.C. Differences in fat content and fatty acid proportions among colostrum, transitional, and mature milk from women delivering very preterm, preterm, and term infants. Clin. Nutr. 2011, 30, 116–123. [Google Scholar] [CrossRef] [PubMed]
- Holmes-McNary, M.Q.; Cheng, W.L.; Mar, M.H.; Fussell, S.; Zeisel, S.H. Choline and choline esters in human and rat milk and in infant formulas. Am. J. Clin. Nutr. 1996, 64, 572–576. [Google Scholar] [PubMed]


| Sample Id | Secretor Status | Gestation | Infant Weight, Grams | Age of Mother, Years | Gravida 1 | Para 2 | Number of Samples | Postpartum Span 3 |
|---|---|---|---|---|---|---|---|---|
| Pre 01 | Se+ | – | – | – | – | – | 4 | – |
| Pre 02 | Se+ | 38 weeks | 3210 | 35 | 2 | 2 | 4 | 7–11 weeks |
| Pre 03 | Se+ | 28 weeks | 1190 | 33 | 1 | 1 | 9 | 4–12 days |
| Pre 04 | Se+ | 31 weeks | 1830 | 36 | 3 | 3 | 5 | 1–5 weeks |
| Pre 05 | Se+ | 30 weeks | 1340 | 29 | 1 | 1 | 7 | 4 days–7 weeks |
| Pre 06 | Se+ | 32 weeks + 2 days | 2340 | 42 | 2 | 2 | 1 | 8 days |
| Pre 07 | Se− | 24 weeks + 4 days | 540 | 33 | 1 | 1 | 4 | 1–4 days |
| Pre 08 | Se− | 31 weeks | 1680 | 35 | 2 | 2 | 2 | 5–14 weeks |
| Pre 09 | Se+ | 35 weeks + 6 days | 2410 | 33 | 1 | 1 | 3 | 2–5 weeks |
| Pre 10 | Se+ | 35 weeks + 2 days | 3100 | 26 | 1 | 1 | 2 | 4–5 days |
| Pre 11 | Se+ | 33 weeks + 4 days | 1800 | 29 | 6 | 5 | 2 | 4–6 days |
| Pre 12 | Se+ | 35 weeks + 4 days | 3260 | 45 | 4 | 3 + 2 4 | 2 | 9–10 days |
| Pre 13 | Se+ | 26 weeks | 650 | 40 | – | – | 15 | 6 days–8 weeks |
| Pre 14 | Se− | 28 weeks + 3 days | – | – | – | – | 1 | 13 weeks |
| Pre 15 | Se+ | 32 weeks | – | – | – | – | 1 | 9 weeks |
| Sample ID | Secretor status | Time postpartum | Group |
|---|---|---|---|
| Term 01 | Se+ | <5 days | Colostrum |
| Term 02 | Se+ | <5 days | Colostrum |
| Term 03 | Se+ | <5 days | Colostrum |
| Term 04 | Se+ | <5 days | Colostrum |
| Term 05 | Se+ | <5 days | Colostrum |
| Term 06 | Se+ | 2 weeks | Transitional |
| Term 07 | Se+ | 2 weeks | Transitional |
| Term 08 | Se− | 6 days | Transitional |
| Term 09 | Se− | 2 weeks | Transitional |
| Term 10 | Se− | 15 weeks | Mature |
| Term 11 | Se− | 9 weeks | Mature |
| Term 12 | Se+ | 15 weeks | Mature |
| Term 13 | Se− | 11 weeks | Mature |
| Term 14 | Se− | 15 weeks | Mature |
| Term 15 | Se− | 11 weeks | Mature |
| Term 16 | Se+ | 16 weeks | Mature |
| Term 17 | Se− | 9 weeks | Mature |
| Term 18 | Se+ | 19 weeks | Mature |
| Term 19 | Se+ | 24 weeks | Mature |
| Term 20 | Se+ | 11 weeks | Mature |
| Term 21 | Se+ | 7–10 weeks | Mature |
| Term 22 | Se+ | 13 weeks | Mature |
| Term 23 | Se+ | 13 weeks | Mature |
| Term 24 | Se+ | 14 weeks | Mature |
| Term 25 | Se+ | 5 weeks | Mature |
| Term 26 | Se+ | 27 weeks | Mature |
| Term 27 | Se− | 33 weeks | Mature |
| Term 28 | Se− | 27 weeks | Mature |
| Term 29 | Se+ | 29 weeks | Mature |
| Term 30 | Se+ | 33 weeks | Mature |
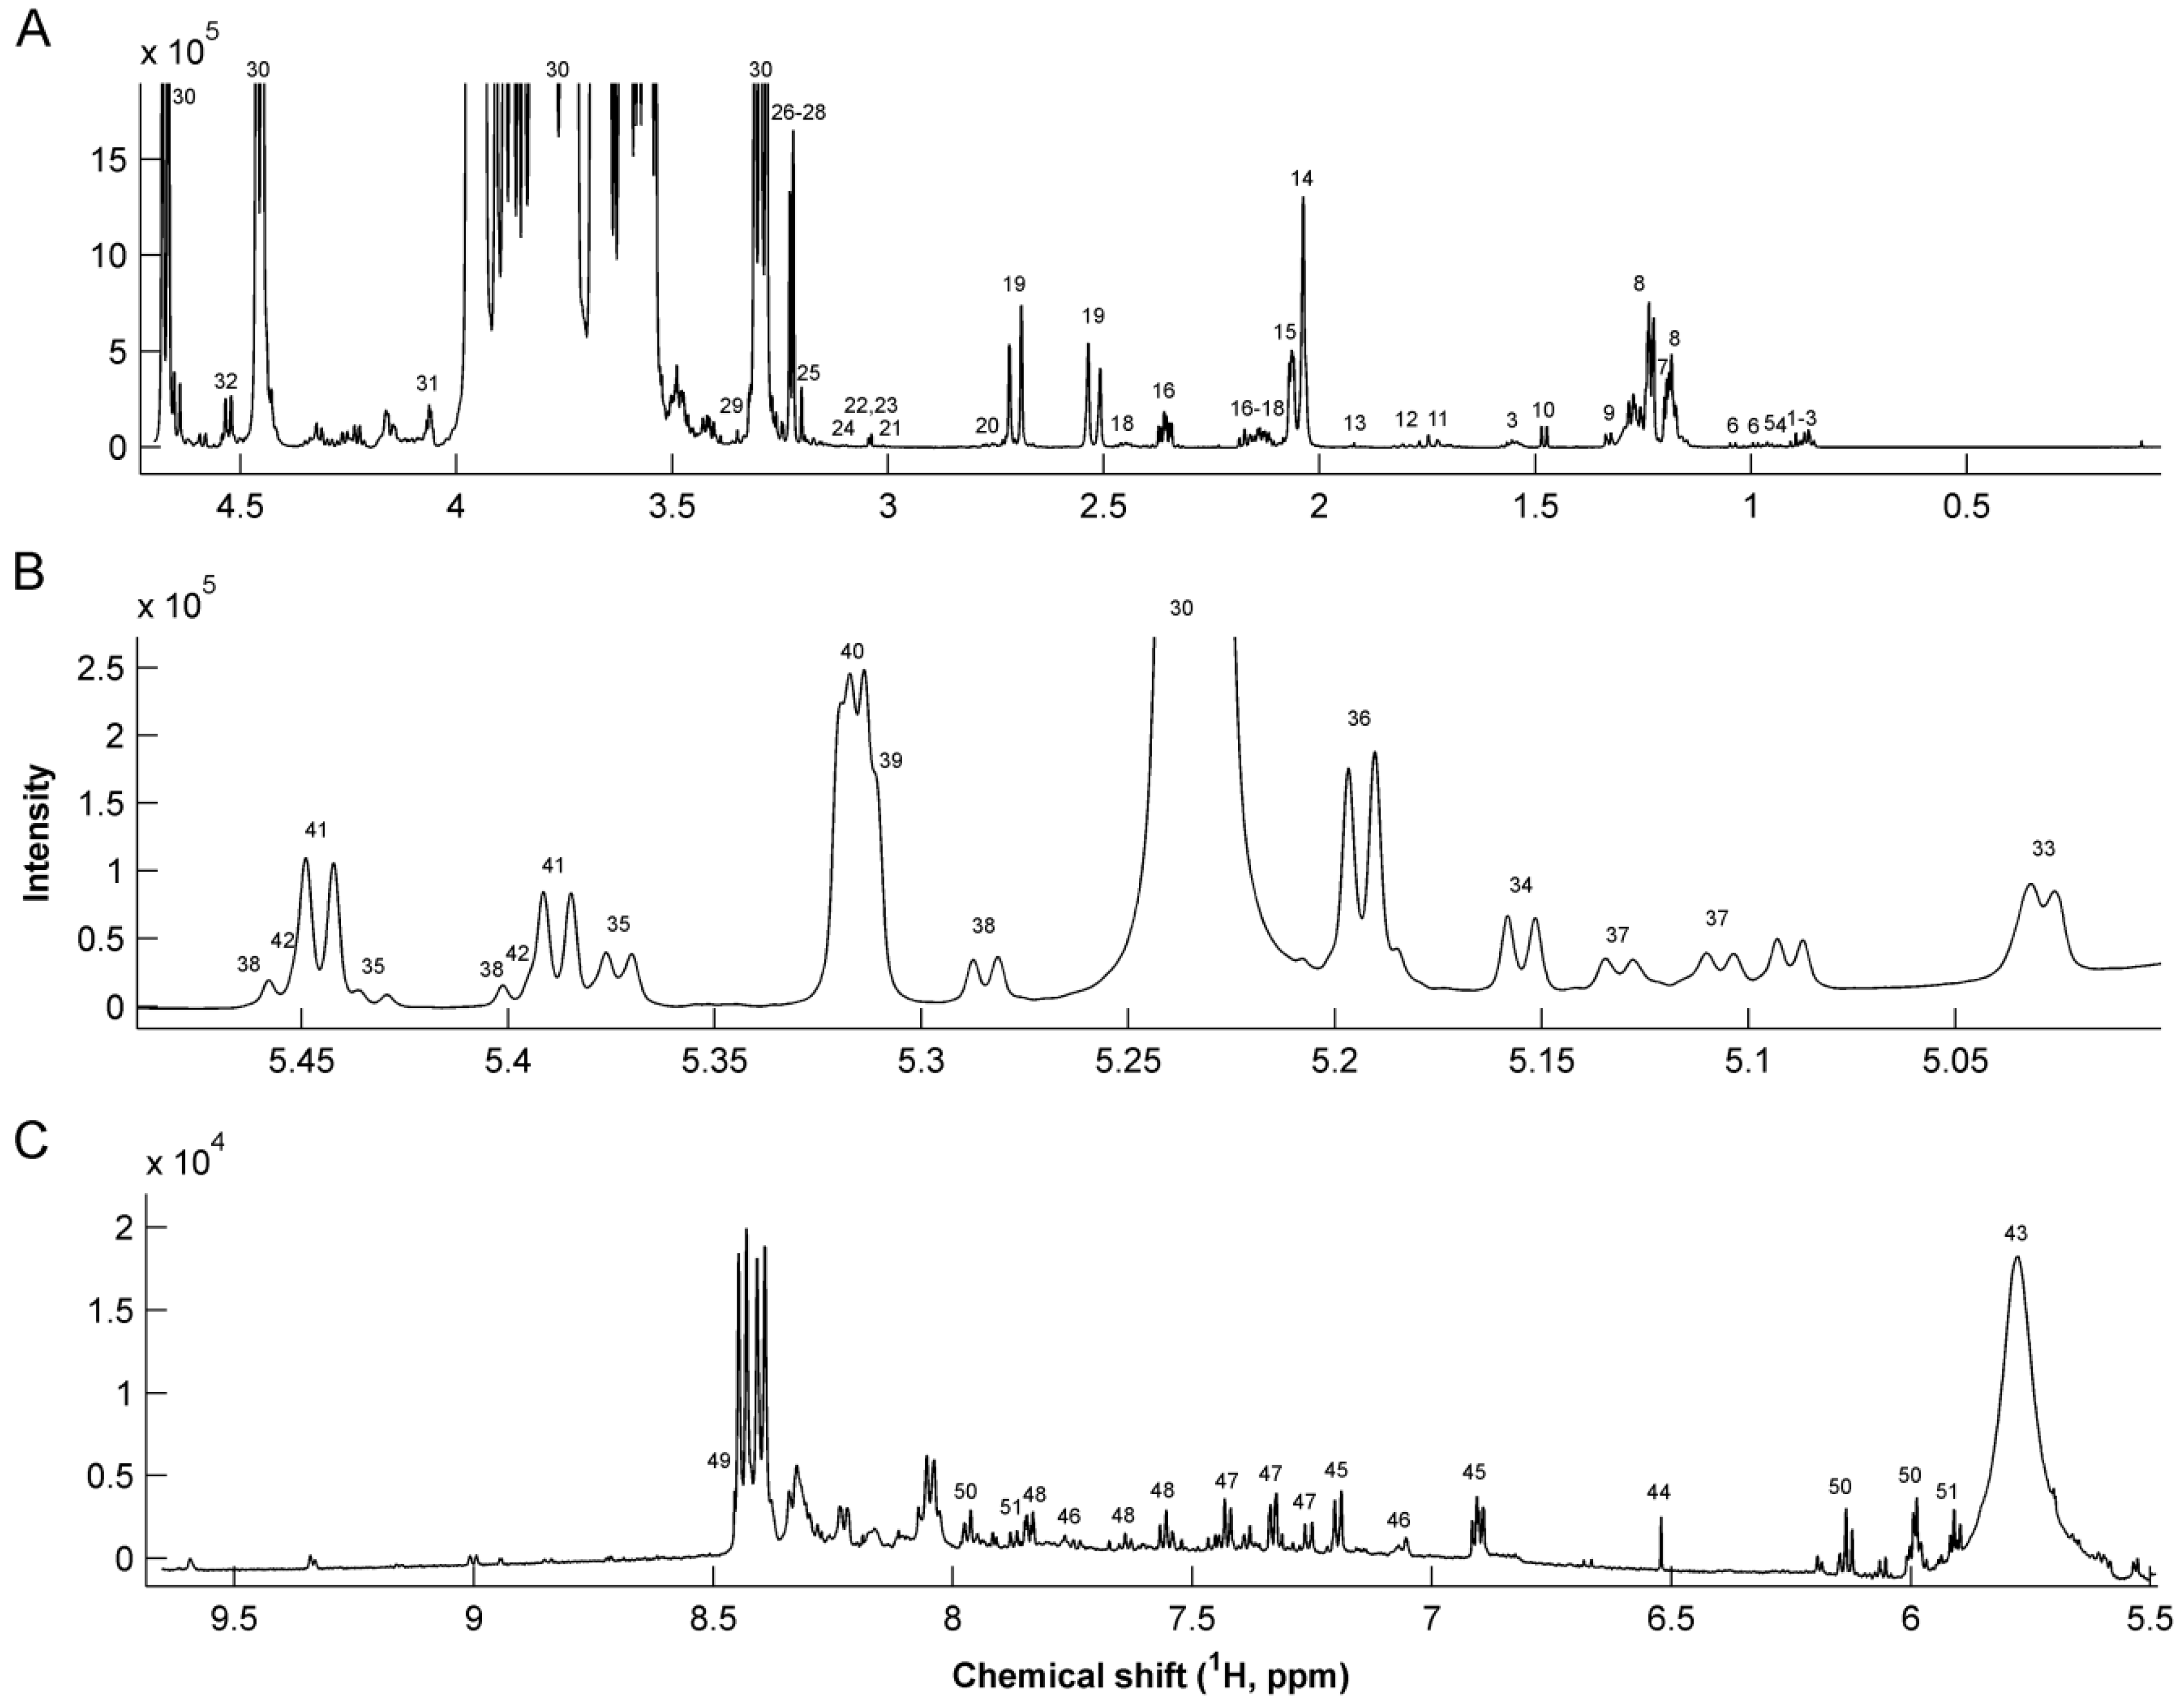
| # | Metabolite | 1H Chemical shift (ppm) | Assignment | # | Metabolite | 1H Chemical shift (ppm) | Assignment |
|---|---|---|---|---|---|---|---|
| 1 | Caprylate | 0.85 | CH3 | 29 | Methanol | 3.37 | CH3 |
| 1.53 | CH2 | 30 | Lactose | 3.23, 3.5–4.0 | Multiple | ||
| 2 | Caprate | 0.85 | CH3 | 31 | Gluconate | 4.05 | CH |
| 1.53 | CH2 | 32 | Galactose | 4.57 | CH | ||
| 3 | Butyrate | 0.88 | CH3 | 33 | Fuc α1,4 GlcNAc | 5.03 | CH-1 |
| 1.55 | β-CH2 | 34 | Fuc α1,3 GlcNAc | 5.19 | CH-1 | ||
| 2.16 | α-CH2 | 35 | LNDFH II | 5.03 | Fuc (α1-4) CH-1 | ||
| 4 | Pantothenate | 0.91 | CH3 | 5.38 | Fuc (α1-3) αGlc CH-1 | ||
| 5 | Leucine | 0.94 | CH3 | 5.43 | Fuc (α1-3) βGlc CH-1 | ||
| 6 | Valine | 0.98 | γ-CH3 | 36 | LNDFH I | 5.16 | Fuc (α1-2) CH-1 |
| 1.03 | γ’-CH3 | 5.03 | Fuc (α1-4) CH-1 | ||||
| 7 | 3-BHBA | 1.18 | CH3 | 37 | LNFP III | 5.11 | Fuc (α1-3) GlcNAc CH-1 |
| 2.39 | CH2 | 5.13 | Fuc (α1-3) GlcNAc CH-1 | ||||
| 8 | Fucosyl moieties | 1.19 | CH3-6 | 38 | LDFT | 5.29 | Fuc (α1-2) CH-1 |
| 1.23–1.29 | CH3-6 | 5.4 | Fuc (α1-3) αGlc CH-1 | ||||
| 9 | Lactate | 1.32 | CH3 | 5.46 | Fuc (α1-3) βGlc CH-1 | ||
| 10 | Alanine | 1.47 | CH3 | 39 | LNFP I | 5.32 | Fuc (α1-2) CH-1 |
| 11 | 6’-SL | 1.73 | CH3 | 40 | 2’FL | 5.32 | Fuc (α1-2) CH-1 |
| 12 | 3’-SL | 1.78 | CH3 | 41 | 3’FL | 5.39 | Fuc (α1-3) αGlc CH-1 |
| 13 | Acetate | 1.91 | CH3 | 5.44 | Fuc (α1-3) βGlc CH-1 | ||
| 14 | GlcNAc | 2.04 | CH3 | 42 | LNFP V | 5.39 | Fuc(α1-3)αGlc CH-1 |
| 15 | Sialic acid | 2.06 | CH3 | 5.44 | Fuc (α1-3) βGlc CH-1 | ||
| 16 | Glutamate | 2.12 | β-CH2 | 43 | Urea | 5.76 | NH2 |
| 2.33 | γ-CH2 | 44 | Fumarate | 6.51 | CH = CH | ||
| 17 | Methionine | 2.13 | CH3 | 45 | Tyrosine | 6.9 | CH-3,5 |
| 18 | Glutamine | 2.11 | β-CH2 | 7.2 | CH-2,6 | ||
| 2.46 | γ-CH2 | 46 | Methylhistidine | 7.06 | CH-4 | ||
| 19 | Citrate | 2.51 | α-CH2 | 7.8 | CH-2 | ||
| 2.69 | α’-CH2 | 47 | Phenylalanine | 7.32 | CH-2,6 | ||
| 20 | Dimethylamine | 2.72 | 2 CH3 | 7.37 | CH-4 | ||
| 21 | 2-oxogluturate | 2.99 | CH2 | 7.42 | CH-3,5 | ||
| 22 | Creatinine | 3.02 | CH3 | 48 | Hippurate | 7.54 | CH-2,6 |
| 23 | Creatine | 3.03 | CH3 | 7.63 | CH-4 | ||
| 24 | Malonate | 3.12 | CH2 | 7.82 | CH-3,5 | ||
| 25 | Choline | 3.19 | 3 CH3 | 49 | Formate | 8.44 | CH |
| 26 | O-Phosphocholine | 3.21 | 3 CH3 | 50 | Cytidine triphosphate | 5.99 | CH-2 |
| 4.16 | CH2 | 6.13 | CH-10 | ||||
| 27 | Carnitine | 2.42 | CH2 | 7.97 | CH-11 | ||
| 3.21 | 3 CH3 | 51 | Uridine | 5.89 | CH-2 | ||
| 28 | Betaine | 3.24 | 3 CH3 | 5.91 | CH-10 | ||
| 7.87 | CH-11 |
© 2016 by the authors; licensee MDPI, Basel, Switzerland. This article is an open access article distributed under the terms and conditions of the Creative Commons Attribution (CC-BY) license (http://creativecommons.org/licenses/by/4.0/).
Share and Cite
Sundekilde, U.K.; Downey, E.; O’Mahony, J.A.; O’Shea, C.-A.; Ryan, C.A.; Kelly, A.L.; Bertram, H.C. The Effect of Gestational and Lactational Age on the Human Milk Metabolome. Nutrients 2016, 8, 304. https://0-doi-org.brum.beds.ac.uk/10.3390/nu8050304
Sundekilde UK, Downey E, O’Mahony JA, O’Shea C-A, Ryan CA, Kelly AL, Bertram HC. The Effect of Gestational and Lactational Age on the Human Milk Metabolome. Nutrients. 2016; 8(5):304. https://0-doi-org.brum.beds.ac.uk/10.3390/nu8050304
Chicago/Turabian StyleSundekilde, Ulrik K., Eimear Downey, James A. O’Mahony, Carol-Anne O’Shea, C. Anthony Ryan, Alan L. Kelly, and Hanne C. Bertram. 2016. "The Effect of Gestational and Lactational Age on the Human Milk Metabolome" Nutrients 8, no. 5: 304. https://0-doi-org.brum.beds.ac.uk/10.3390/nu8050304