The Combined Application of the Caco-2 Cell Bioassay Coupled with In Vivo (Gallus gallus) Feeding Trial Represents an Effective Approach to Predicting Fe Bioavailability in Humans


Abstract
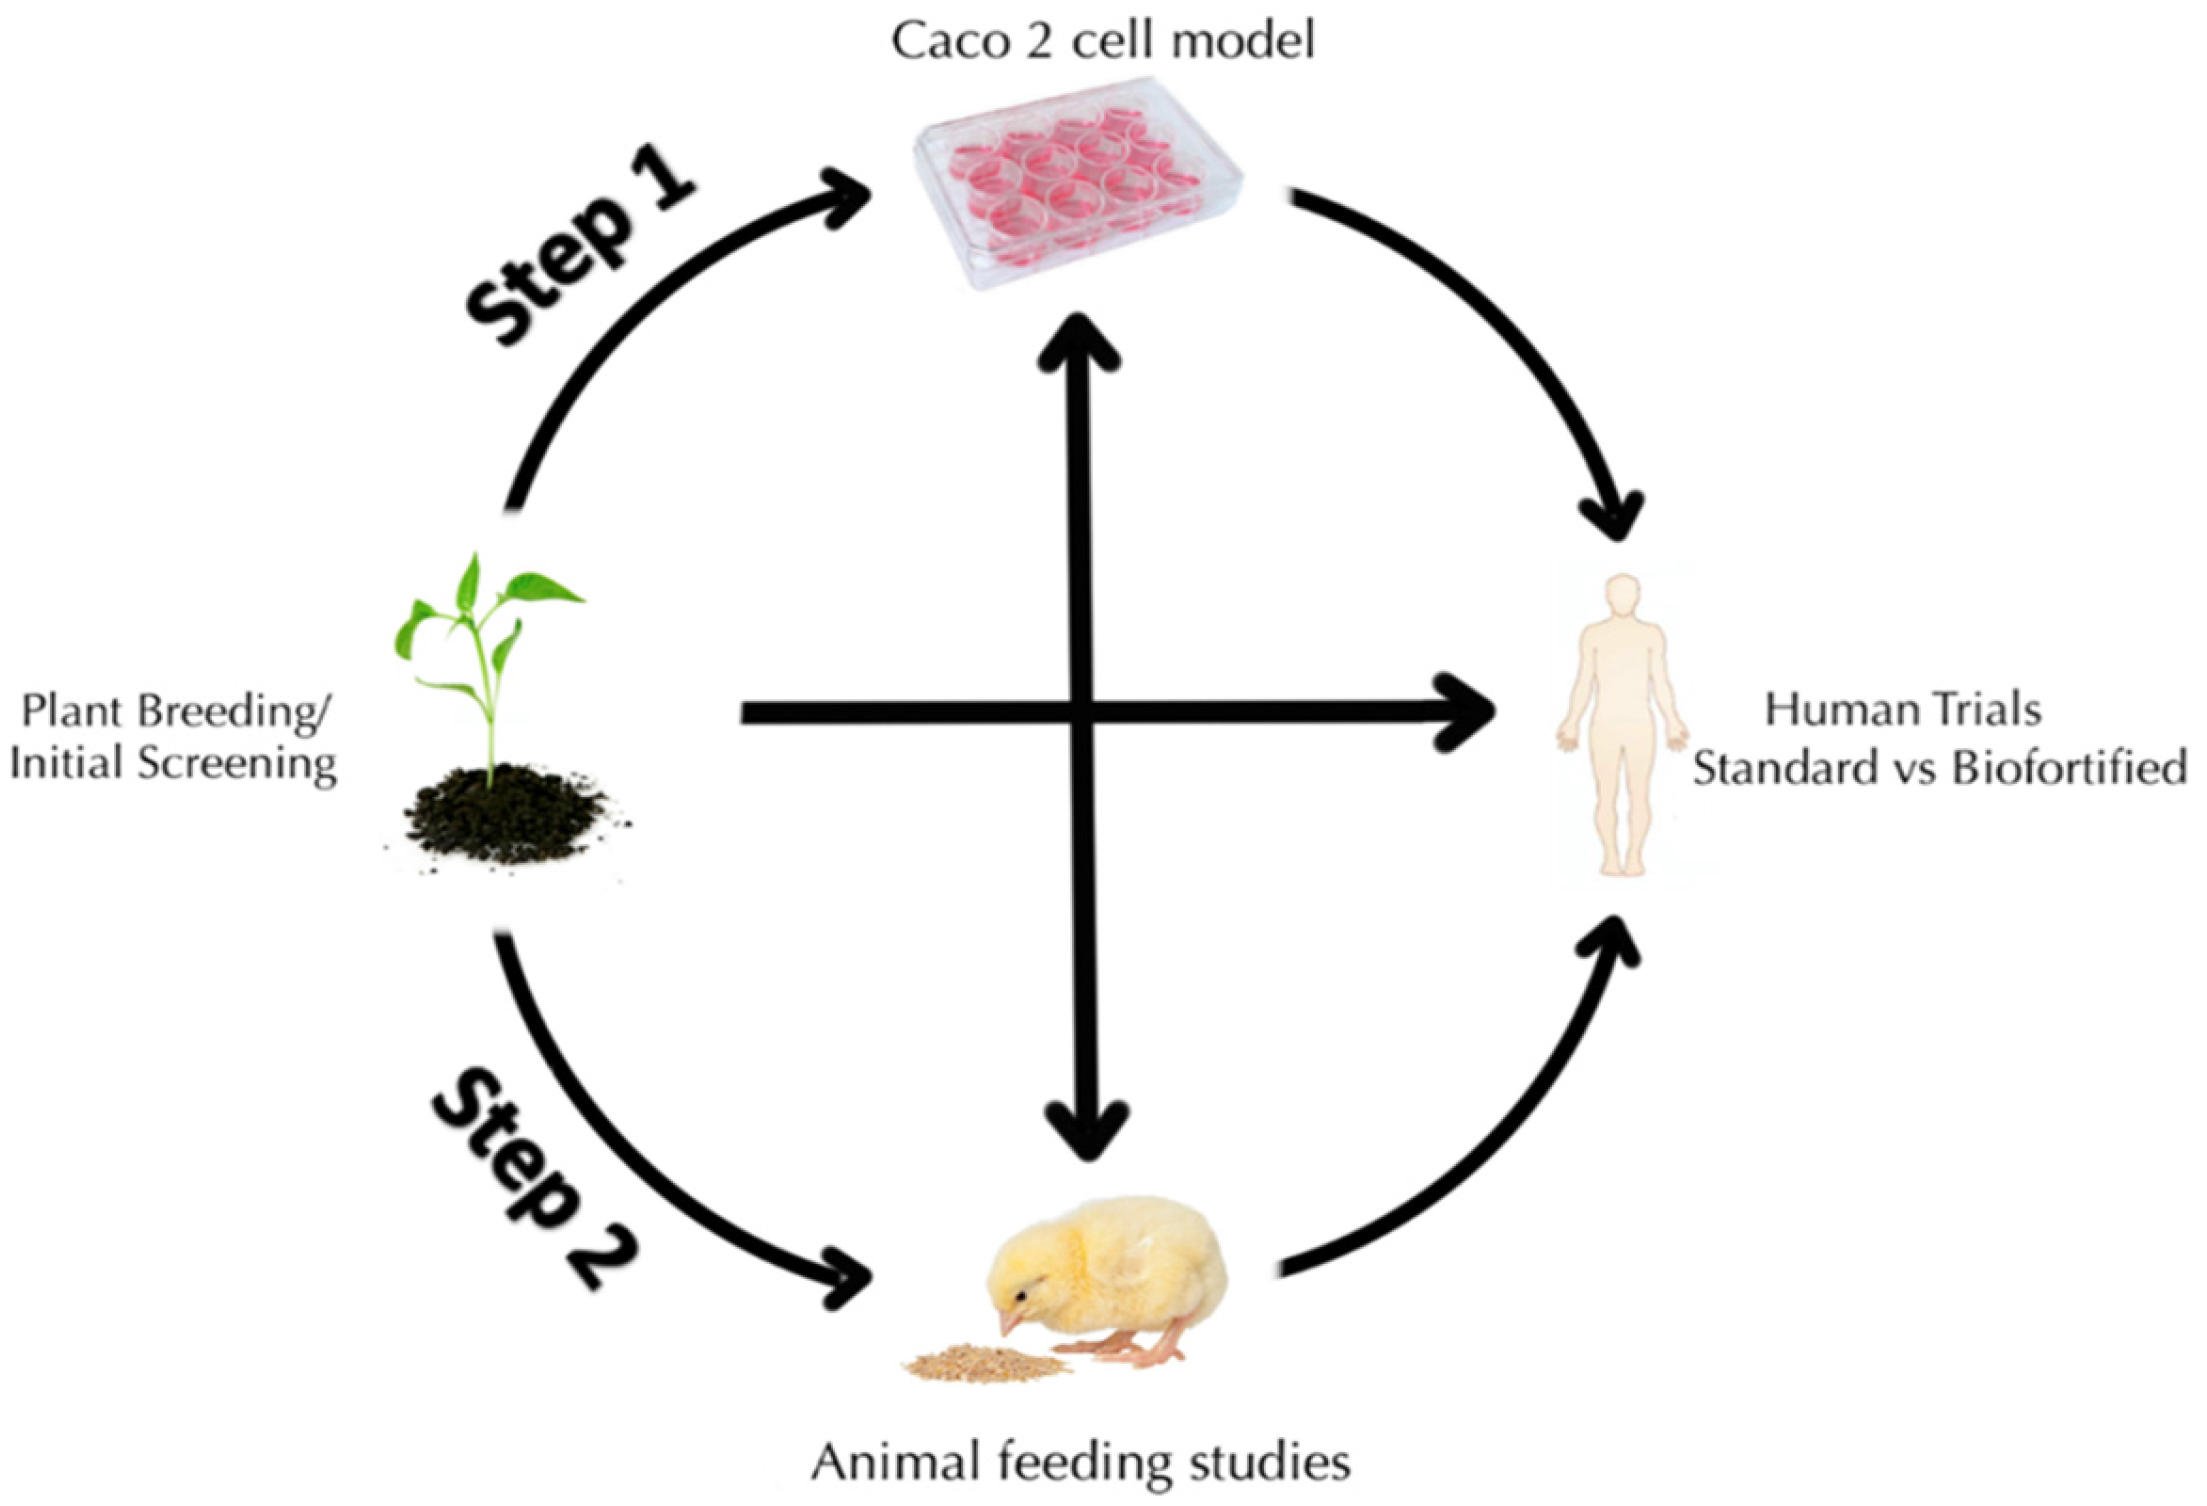
:1. Introduction
1.1. Biofortification of Staple Food Crops as a Sustainable Strategy to Alleviate Dietary Fe Deficiency
1.2. Factors That Limit Fe Bioavailability in a Plant Based Diet Forms of Dietary Fe
1.2.1. Phytate
1.2.2. Polyphenols
1.3. In Vitro Assessment of Fe Bioavailability (Caco-2 Cell Bioassay)
1.4. In Vivo Assessment of Fe Bioavailability via Poultry (Gallus gallus)
2. Materials and Methods
2.1. Ethics Statement
2.2. Animals, Diets and Study Design
2.3. Blood Analysis, Hemoglobin (Hb) Determination, and Tissue Collection
2.4. Isolation of Total RNA
2.5. DMT–1, DcytB and, Ferroportin Gene Expression Analysis
2.6. In Vitro Fe Bioavailability Assessment
2.7. Harvesting of Caco-2 Cells for Ferritin Analysis
2.8. Ferritin and Fe in the Liver, Electrophoresis, Staining and Measurement of Gels
2.9. Polyphenol Extraction
2.10. Ultra Performance Liquid Chromatography–Mass Spectrometry (UPLC–MS) Analysis of Polyphenols
2.11. Determination of Phytic Acid Concentration in the Diet Samples
2.12. Statistical Analysis
3. Results
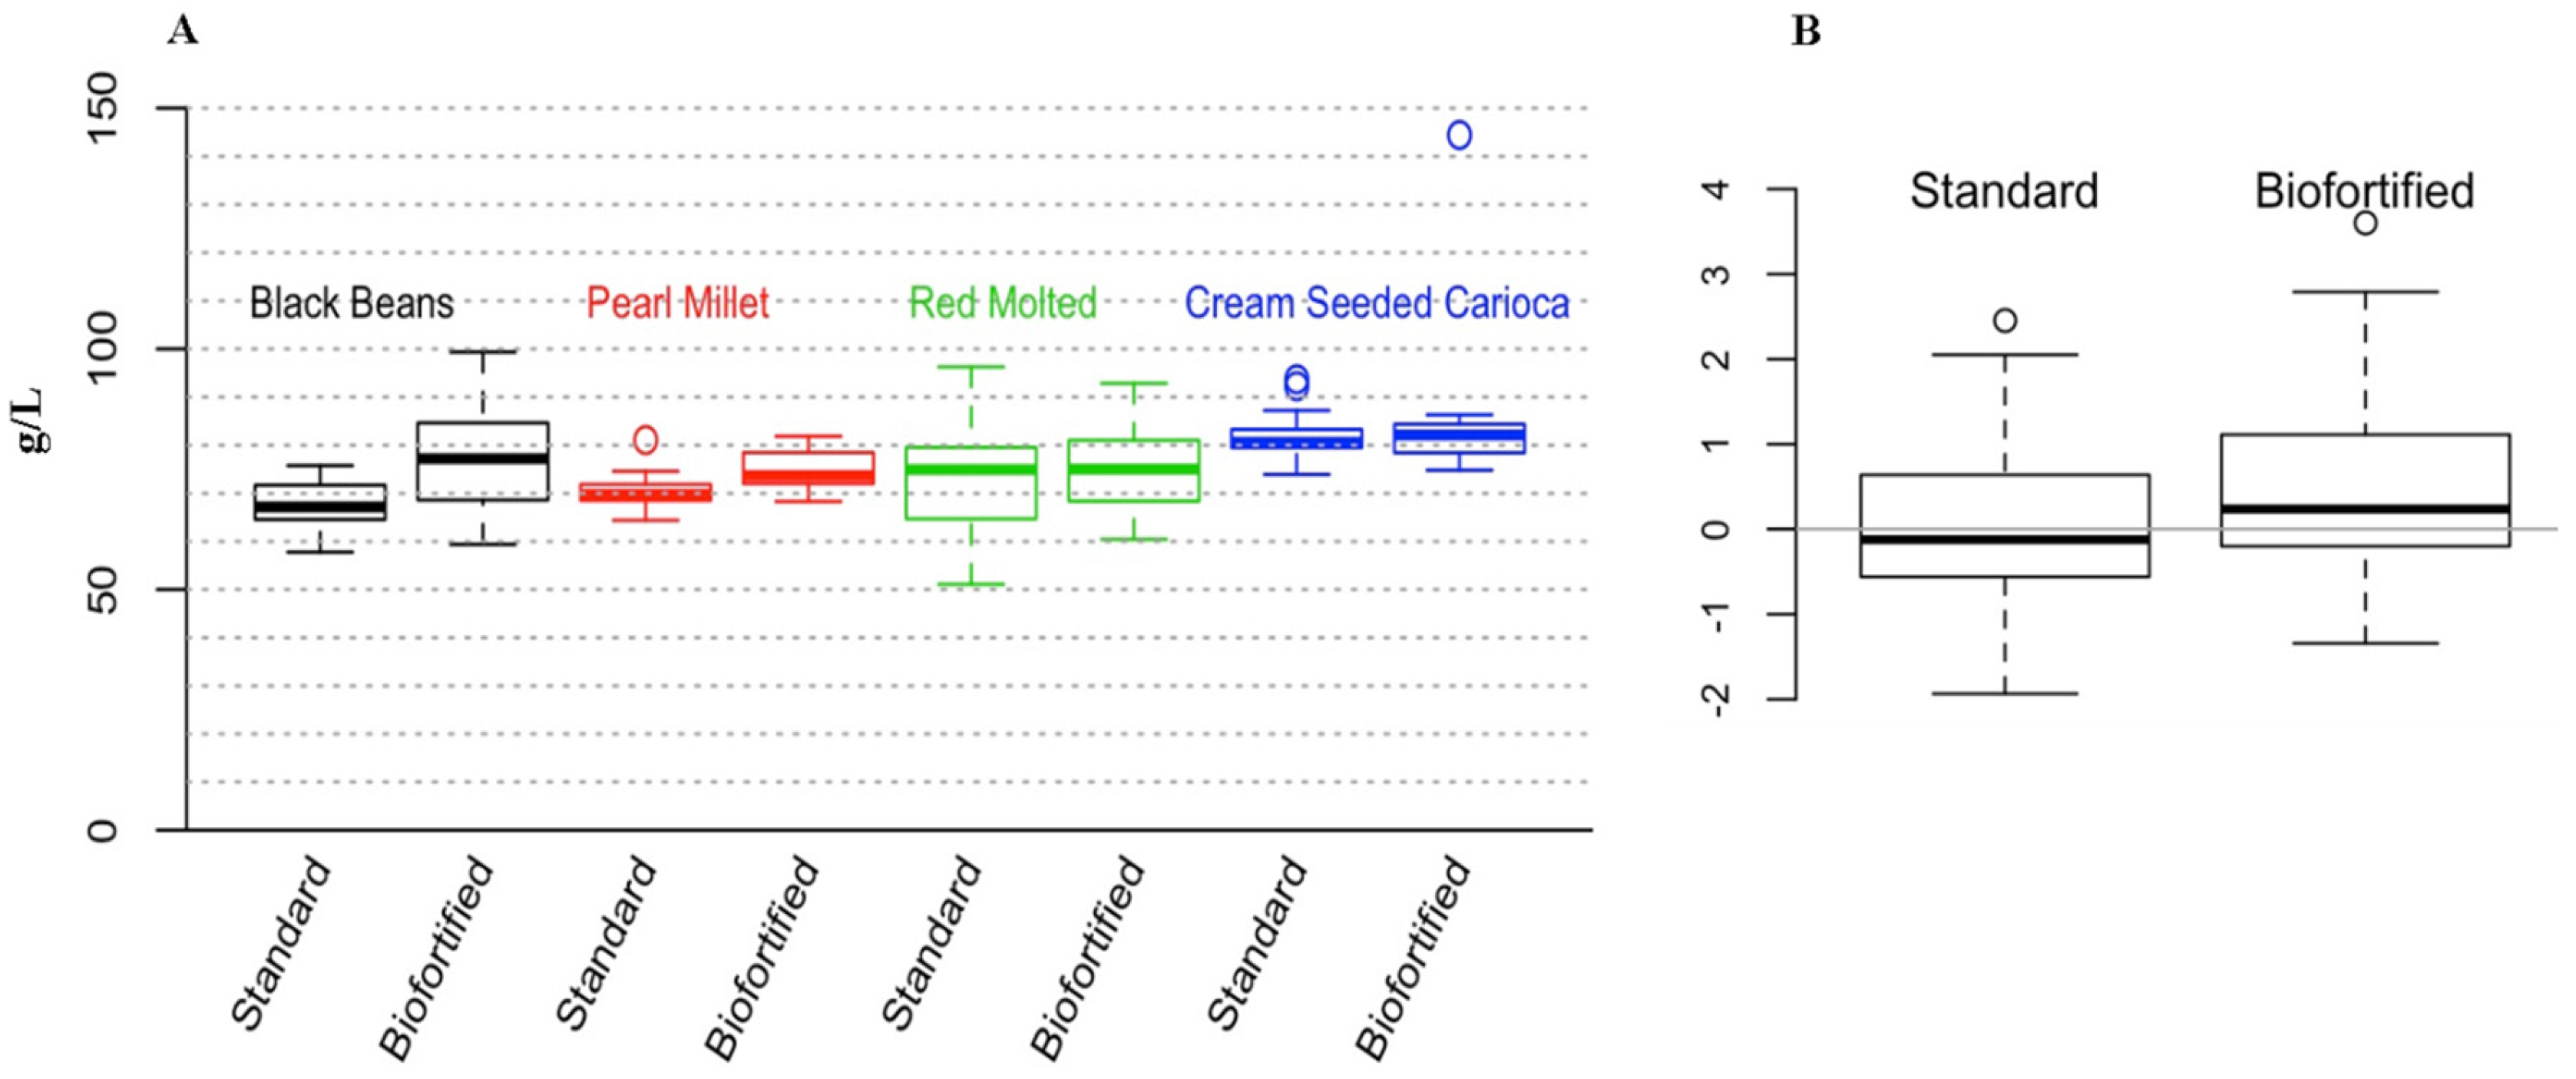
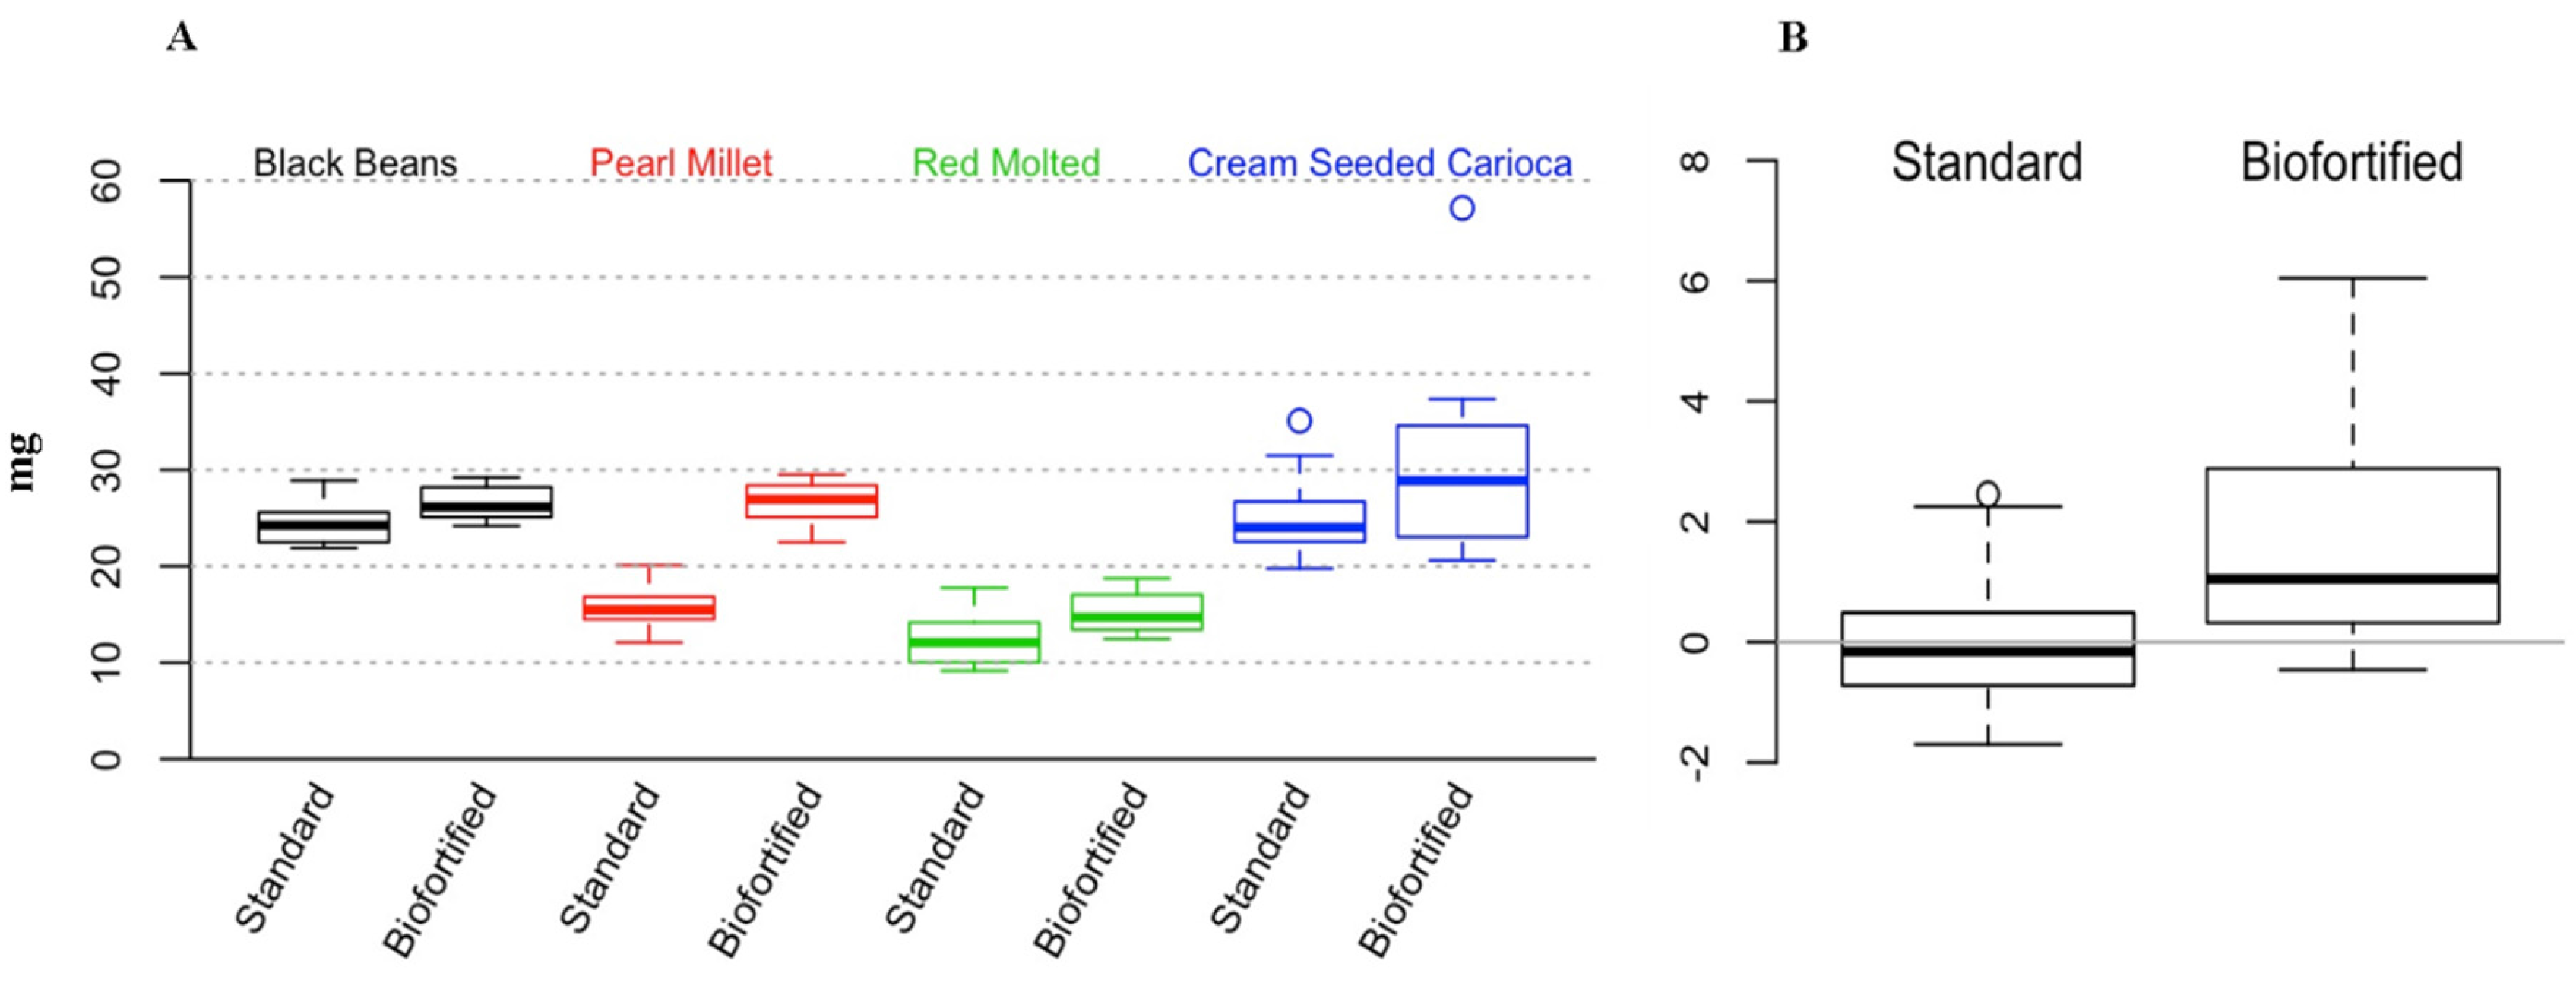
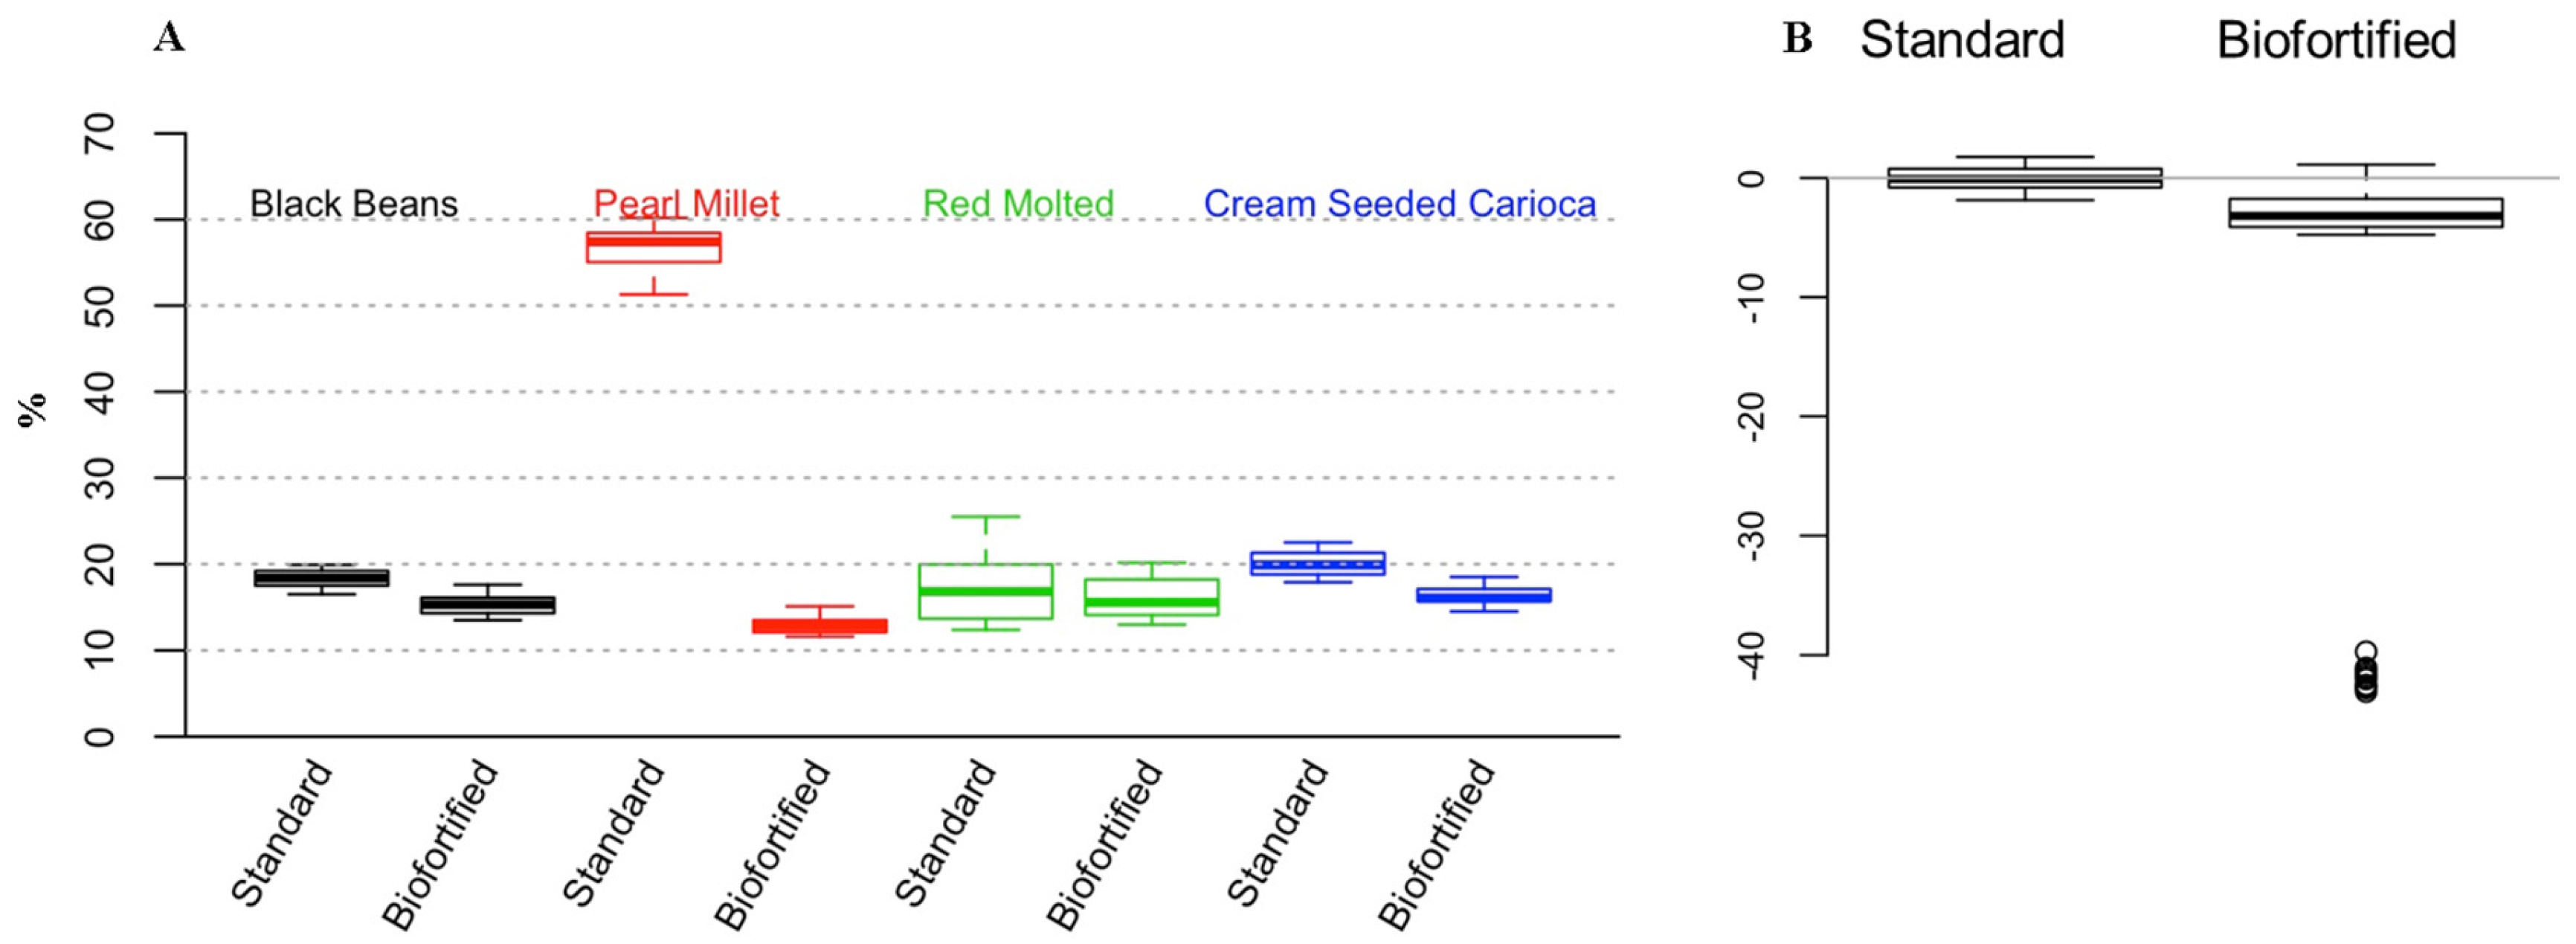
3.1. Cross Experimental In Vitro Assessments of Fe Bioavailability
3.2. Cross Experimental In Vivo Assessment of Fe Bioavailability, Absorption and Status
3.2.1. Blood Hb
3.2.2. Total Body Hb-Fe
3.2.3. Hemoglobin Maintenance Efficiency (HME)
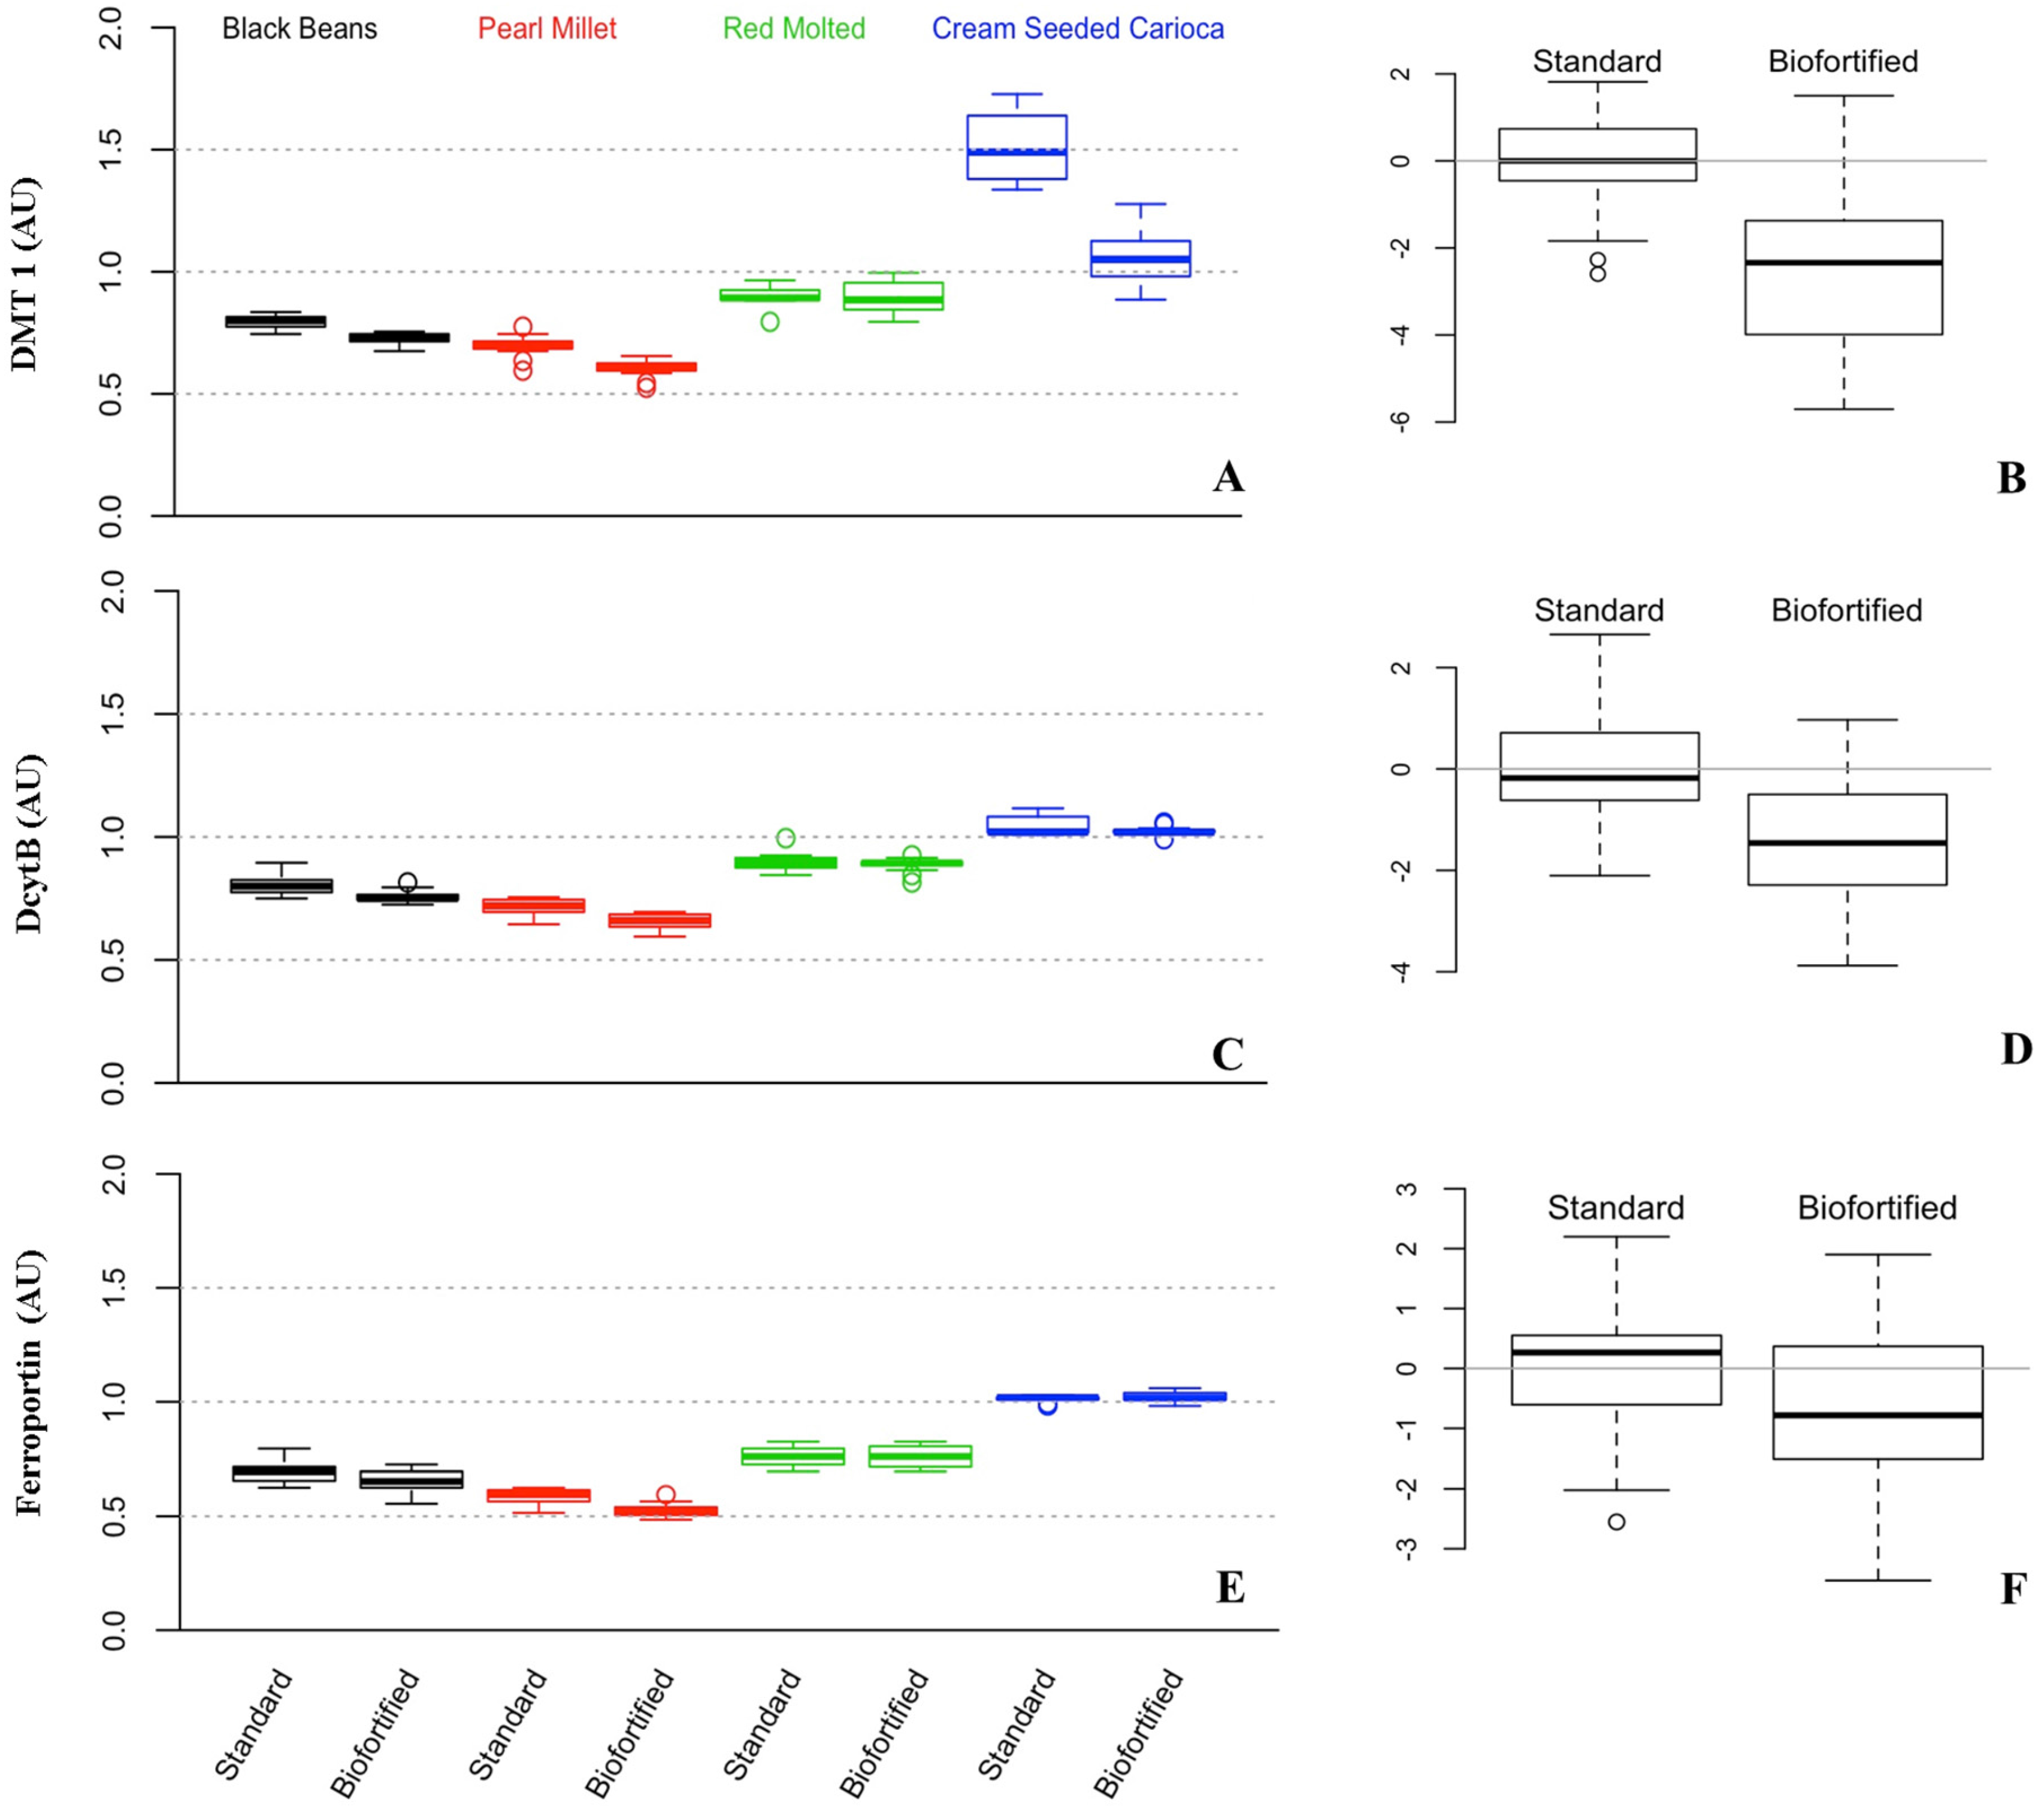
3.3. Gene Expression of Fe Related Transporters and Enzyme (Divalent Metal Transporter 1 (DMT1), Duodenal Cytochrome B (DcytB), and Ferroportin)
3.4. Ferritin and Fe in the Liver
3.5. Total Concentration of Polyphenols in the Diets
4. Discussion
4.1. The Correlation between Screening Tools (In Vitro and In Vivo Models) for Fe Bioavailability and Human Efficacy Studies
4.2. Strategy: Tailoring a Specific Diet
4.3. Use of a Caco-2 Cell Bioassay in Identification and Characterization of Specific Polyphenolic Compounds That May Inhibit the Nutritional Benefit of the Fe Biofortified Staple Food Crop
5. Conclusions
Author Contributions
Conflicts of Interest
Abbreviations
| Fe | iron |
| Hb | hemoglobin |
| HME | hemoglobin maintenance efficiency |
| DMT1 | divalent metal transporter 1 |
| DcytB | duodenal cytochrome B |
| UPLC–MS | ultra performance liquid chromatography–mass spectrometry |
References
- World Health Organization. Iron Deficiency Anemia Assessment, Prevention and Control; A Guide for Program Managers; World Health Organization: Geneva, Switzerland, 2001; pp. 15–21. [Google Scholar]
- Nestel, P.; Bouis, H.E.; Meenakshi, J.V.; Pfeiffer, W. Biofortification of staple food crops. J. Nutr. 2006, 136, 1064–1067. [Google Scholar] [PubMed]
- Bouis, H.E. Plant breeding: A new tool for fighting micronutrient malnutrition. J. Nutr. 2002, 132, S491–S494. [Google Scholar] [CrossRef]
- Glahn, R.P.; Tako, E.; Cichy, K.; Wiesinger, J. The cotyledon cell wall and intracellular matrix are factors that limit iron bioavailability of the common bean (Phaseolus vulgaris). Food Funct. 2016, 7, 3193–3200. [Google Scholar] [CrossRef] [PubMed]
- Murgia, I.; Arosio, P.; Tarantino, D.; Soave, C. Biofortification for combating ‘hidden hunger’ for iron. Trends Plant Sci. 2012, 17, 47–55. [Google Scholar] [CrossRef] [PubMed]
- Fanzo, J.; Reman, R.; Pronyk, P.M.; Negin, J.; Wariero, J.; Mutuo, P. A 3-year cohort study to assess the impact of an integrated food- and livelihood-based model on undernutrition in rural western Kenya. In Combating Micronutrient Deficiencies: Food Based Approaches; Thompson, B., Amoroso, L., Eds.; FAO: Rome, Italy, 2011; p. 76. [Google Scholar]
- Bhargava, A.; Bouis, H.E.; Scrimshaw, N.S. Dietary intakes and socioeconomic factors are associated with the hemoglobin concentration of Bangladeshi women. J. Nutr. 2001, 131, 758–764. [Google Scholar] [PubMed]
- Lozoff, B.; Jimenez, E.; Wolf, A.W. Long-term developmental outcome of infants with iron deficiency. N. Engl. J. Med. 1991, 325, 687–694. [Google Scholar] [CrossRef] [PubMed]
- Welch, R.M. Biotechnology, biofortification, and global health. Food Nutr. Bull. 2005, 26, 419–421. [Google Scholar] [CrossRef] [PubMed]
- De Moura, F.F.; Palmer, A.C.; Finkelstein, J.L.; Haas, J.D.; Murray-Kolb, L.E.; Wenger, M.J.; Birol, E.; Boy, E.; Peña-Rosas, J.P. Are biofortified staple food crops improving vitamin A and iron status in women and children? New evidence from efficacy trials. Adv. Nutr. 2014, 5, 568–570. [Google Scholar] [CrossRef] [PubMed]
- Tako, E.; Blair, M.W.; Glahn, R.P. Biofortified red mottled beans (Phaseolus vulgaris L.) in a maize and bean diet provide more bioavailable iron than standard red mottled beans: Studies in poultry (Gallus gallus) and an in vitro digestion/Caco-2 model. Nutr. J. 2011, 10, 113. [Google Scholar] [CrossRef] [PubMed]
- Johnson, A.A.; Kyriacou, B.; Callahan, D.L.; Carruthers, L.; Stangoulis, J.; Lombi, E.; Tester, M. Constitutive overexpression of the OsNAS gene family reveals single-gene strategies for effective iron- and zinc-biofortification of rice endosperm. PLoS ONE 2011, 6, e24476. [Google Scholar]
- Lyons, G.H.; Stangoulis, J.C.; Graham, R.D. Exploiting micronutrient interaction to optimize biofortification programs: The case for inclusion of selenium and iodine in the HarvestPlus program. Nutr. Rev. 2004, 62, 247–252. [Google Scholar] [CrossRef] [PubMed]
- Trijatmiko, K.R.; Dueñas, C.; Tsakirpaloglou, N.; Torrizo, L.; Arines, F.M.; Adeva, C.; Balindong, J.; Oliva, N.; Sapasap, M.V.; Borrero, J.; et al. Biofortified indica rice attains iron and zinc nutrition dietary targets in the field. Sci. Rep. 2016, 6, 19792. [Google Scholar] [CrossRef] [PubMed]
- Tako, E.; Beebe, S.E.; Reed, S.; Hart, J.J.; Glahn, R.P. Polyphenolic compounds appear to limit the nutritional benefit of biofortified higher iron black bean (Phaseolus vulgaris L.). Nutr. J. 2014, 13, 28. [Google Scholar] [CrossRef] [PubMed]
- Tako, E.; Reed, S.M.; Budiman, J.; Hart, J.J.; Glahn, R.P. Higher iron pearl millet (Pennisetum glaucum L.) provides more absorbable iron that is limited by increased polyphenolic content. Nutr. J. 2015, 14, 11. [Google Scholar] [CrossRef] [PubMed]
- Tako, E.; Reed, S.; Anandaraman, A.; Beebe, S.E.; Hart, J.J.; Glahn, R.P. Studies of Cream Seeded Carioca Beans (Phaseolus vulgaris L.) from a Rwandan Efficacy Trial: In Vitro and In Vivo Screening Tools Reflect Human Studies and Predict Beneficial Results from Iron Biofortified Beans. PLoS ONE 2015, 10, e0138479. [Google Scholar] [CrossRef] [PubMed]
- Hart, J.J.; Tako, E.; Kochian, L.V.; Glahn, R.P. Identification of Black Bean (Phaseolus vulgaris L.) Polyphenols That Inhibit and Promote Iron Uptake by Caco-2 Cells. J. Agric. Food Chem. 2015, 63, 5950–5956. [Google Scholar] [CrossRef] [PubMed]
- Hart, J.J.; Kochian, L.V.; Glahn, R.P. Developing Staple Food Crops for Improved Nutritional Quality: Identification of Compounds in Bean Seed Coats That Inhibit and Enhance Fe Absorption. In Proceedings of the Crop Science Society of America Meeting, Minneapolis, MN, USA, 15–18 November 2015.
- Glahn, R.P.; Lee, O.A.; Yeung, A.; Goldman, M.I.; Miller, D.D. Caco-2 cell ferritin formation predicts nonradiolabeled food iron availability in an in vitro digestion/Caco-2 cell culture model. J. Nutr. 1998, 128, 1555–1561. [Google Scholar] [PubMed]
- Lung’aho, M.G.; Mwaniki, A.M.; Szalma, S.J.; Hart, J.J.; Rutzke, M.A.; Kochian, L.V.; Glahn, R.P.; Hoekenga, O.A. Genetic and physiological analysis of iron biofortification in maize kernels. PLoS ONE 2011, 6, e20429. [Google Scholar] [CrossRef] [PubMed]
- Hoekenga, O.A.; Lung’aho, M.G.; Tako, E.; Kochian, L.V.; Glahn, R.P. Iron biofortification of maize grain. Plant Genet. Res. 2011, 9, 327–329. [Google Scholar] [CrossRef]
- Haas, J.D.; Luna, S.V.; Lung’aho, M.G.; Wenger, M.J.; Murray-Kolb, L.E.; Beebe, S.; Gahutu, J.B.; Egli, I.M. Consuming Iron Biofortified Beans Increases Iron Status in Rwandan Women after 128 Days in a Randomized Controlled Feeding Trial. J. Nutr. 2016, 146, 1586–1592. [Google Scholar] [CrossRef] [PubMed]
- Haas, J.; Luna, S.; Lung’aho, M.; Ngabos, F.; Wagner, M.; Murray-Kolb, L.; Beebe, S.; Gahutu, J.-B.; Egli, I. Iron biofortificatified beans improve bean status in Rwandan university women: Results of a feeding trial. FASEB J. 2014, 28, S646.1. [Google Scholar]
- Finkelstein, J.L.; Mehta, S.; Udipi, S.A.; Ghugre, P.S.; Luna, S.V.; Wenger, M.J.; Murray-Kolb, L.E.; Przybyszewski, E.M.; Haas, J.D. A Randomized Trial of Iron-Biofortified Pearl Millet in School Children in India. J. Nutr. 2015, 145, 1576–1581. [Google Scholar] [CrossRef] [PubMed]
- Haas, J.D.; Beard, J.L.; Murray-Kolb, L.E.; del Mundo, A.M.; Felix, A.; Gregorio, G.B. Iron-biofortified rice improves the iron stores of nonanemic Filipino women. J. Nutr. 2005, 135, 2823–2830. [Google Scholar] [PubMed]
- Hurrell, R.; Egli, I. Iron bioavailability and dietary reference values. Am. J. Clin. Nutr. 2010, 91, 1461S–1467S. [Google Scholar] [CrossRef] [PubMed]
- Carpenter, C.E.; Mahoney, A.W. Contributions of heme and nonheme iron to human nutrition. Crit. Rev. Food Sci. Nutr. 1992, 31, 333–367. [Google Scholar] [CrossRef] [PubMed]
- Hunt, J.R. Moving toward a plant-based diet: Are iron and zinc at risk? Nutr. Rev. 2002, 60, 127–134. [Google Scholar] [CrossRef] [PubMed]
- Hallberg, L.; Brune, M.; Rossander, L. Iron absorption in man: Ascorbic acid and dose-dependent inhibition by phytate. Am. J. Clin. Nutr. 1989, 49, 140–144. [Google Scholar] [PubMed]
- Hallberg, L.; Hultén, L.; Gramatkovski, E. Iron absorption from the whole diet in men: How effective is the regulation of iron absorption? Am. J. Clin. Nutr. 1997, 66, 347–356. [Google Scholar] [PubMed]
- Hallberg, L.; Hulthén, L. Prediction of dietary iron absorption: An algorithm for calculating absorption and bioavailability of dietary iron. Am. J. Clin. Nutr. 2000, 71, 1147–1160. [Google Scholar] [PubMed]
- Consaul, J.R.; Lee, K. Extrinsic tagging in iron bioavailability research: A critical review. J. Agric. Food Chem. 1983, 31, 684–689. [Google Scholar] [CrossRef] [PubMed]
- Glahn, R.P.; Cheng, Z.; Giri, S. Extrinsic labeling of staple food crops with isotopic iron does not consistently result in full equilibration: Revisiting the methodology. J. Agric. Food Chem. 2015, 63, 9621–9628. [Google Scholar] [CrossRef] [PubMed]
- Hurrell, R.F.; Juillerat, M.A.; Reddy, M.B.; Lynch, S.R.; Dassenko, S.A.; Cook, J.D. Soy protein, phytate, and iron-absorption in humans. Am. J. Clin. Nutr. 1992, 56, 573–578. [Google Scholar] [PubMed]
- Hurrell, R.F. Phytic acid degradation as a means of improving iron absorption. Int. J. Vitam. Nutr. Res. 2004, 74, 445–452. [Google Scholar] [CrossRef] [PubMed]
- Tuntawiroon, M.; Sritongkul, N.; Rossander-Hulten, L.; Pleehachinda, R.; Suwanik, R.; Brune, M.; Hallberg, L. Rice and iron-absorption in man. Eur. J. Clin. Nutr. 1990, 44, 489–497. [Google Scholar] [PubMed]
- Engle-Stone, R.; Yeung, A.; Welch, R.; Glahn, R.P. Meat and ascorbic acid can promote Fe availability from Fe-phytate but not from Fe-tannic acid complexes. J. Agric. Food Chem. 2005, 53, 10276–10284. [Google Scholar] [CrossRef] [PubMed]
- Egli, I.; Davidsson, L.; Juillerat, M.A.; Barclay, D.; Hurrell, R.F. The influence of soaking and germination on the phytase activity and phytic acid content of grains and seeds potentially useful for complementary feeding. J. Food Sci. 2002, 67, 3484. [Google Scholar] [CrossRef]
- Egli, I.; Davidsson, L.; Zeder, C.; Walczyk, T.; Hurrell, R. Dephytinization of a complementary food based on wheat and soy increases zinc, but not copper, apparent absorption in adults. J. Nutr. 2004, 134, 1077–1180. [Google Scholar] [PubMed]
- Troesch, B.; Egli, I.; Zeder, C.; Hurrell, R.F.; de Pee, S.; Zimmermann, M.B. Optimization of a phytase-containing micronutrient powder with low amounts of highly bioavailable iron for in-home fortification of complementary foods. Am. J. Clin. Nutr. 2009, 89, 539–544. [Google Scholar] [CrossRef] [PubMed]
- Sandberg, A.S.; Andersson, H. Effect of dietary phytase on the digestion of phytate in the stomach and small-intestine of humans. J. Nutr. 1988, 118, 469–473. [Google Scholar] [PubMed]
- Brune, M.; Rossander, L.; Hallberg, L. Iron-absorption and phenolic-compounds—Importance of different phenolic structures. Eur. J. Clin. Nutr. 1989, 43, 547–558. [Google Scholar]
- Hallberg, L.; Rossander, L. Effect of different drinks on the absorption of non-heme iron from composite meals. Hum. Nutr. Appl. Nutr. 1982, 36, 116–123. [Google Scholar] [PubMed]
- Hurrell, R.F.; Reddy, M.; Cook, J.D. Inhibition of non-haem iron absorption in man by polyphenolic-containing beverages. Br. J. Nutr. 1999, 81, 289–295. [Google Scholar] [PubMed]
- Cook, J.D.; Reddy, M.B.; Hurrell, R.F. The effect of red and white wines on nonheme-iron absorption in humans. Am. J. Clin. Nutr. 1995, 61, 800–804. [Google Scholar] [PubMed]
- Tuntipopipat, S.; Judprasong, K.; Zeder, C.; Wasantwisut, E.; Winichagoon, P.; Charoenkiatkul, S.; Hurrell, R.; Walczyk, T. Chili, but not turmeric, inhibits iron absorption in young women from an iron-fortified composite meal. J. Nutr. 2006, 136, 2970–2974. [Google Scholar] [PubMed]
- Hurrell, R.F.; Reddy, M.B.; Juillerat, M.A.; Cook, J.D. Degradation of phytic acid in cereal porridges improves iron absorption by human subjects. Am. J. Clin. Nutr. 2003, 77, 1213–1219. [Google Scholar] [PubMed]
- Blair, M.W.; Torres, M.M.; Giraldo, M.C.; Pedraza, F. Development and diversity of Andean-derived, gene-based microsatellites for common bean (Phaseolus vulgaris L.). BMC Plant Biol. 2009, 9, 100. [Google Scholar] [CrossRef] [PubMed]
- Blair, M.W.; Díaz, M.; Buendía, H.F.; Duque, M.C. Genetic diversity, seed size associations and population structure of a core collection of common beans (Phaseolus vulgaris L.). Theor. Appl. Genet. 2009, 119, 955–972. [Google Scholar] [CrossRef] [PubMed]
- Beebe, S.J.; Chen, Y.J.; Sain, N.M.; Schoenbach, K.H.; Xiao, S. Transient features in nanosecond pulsed electric fields differentially modulate mitochondria and viability. PLoS ONE 2012, 7, e51349. [Google Scholar] [CrossRef] [PubMed]
- Ariza-Nieto, M.; Blair, M.W.; Welch, R.M.; Glahn, R.P. Screening of iron bioavailability patterns in eight bean (Phaseolus vulgaris L.) genotypes using the Caco-2 cell in vitro model. J. Agric. Food Chem. 2007, 55, 7950–7956. [Google Scholar] [CrossRef] [PubMed]
- Blair, M.W.; Izquierdo, P.; Astudillo, C.; Grusak, M.A. A legume biofortification quandary: Variability and genetic control of seed coat micronutrient accumulation in common beans. Front. Plant. Sci. 2013, 4, 275. [Google Scholar] [CrossRef] [PubMed]
- Hoppler, M.; Egli, I.; Petry, N.; Gille, D.; Zeder, C.; Walczyk, T.; Blair, M.W.; Hurrell, R.F. Iron speciation in beans (Phaseolus vulgaris) biofortified by common breeding. J. Food Sci. 2014, 79, C1629–C1634. [Google Scholar] [CrossRef] [PubMed]
- Tako, E.; Glahn, R.P. White beans provide more bioavailable iron than red beans: Studies in poultry (Gallus gallus) and an in vitro digestion/Caco-2 model. Int. J. Vitam. Nutr. Res. 2010, 80, 416–429. [Google Scholar] [CrossRef] [PubMed]
- Yun, S.; Habicht, J.P.; Miller, D.D.; Glahn, R.P. An in vitro digestion/Caco-2 cell culture system accurately predicts the effects of ascorbic acid and polyphenolic compounds on iron bioavailability in humans. J. Nutr. 2004, 134, 2717–2721. [Google Scholar] [PubMed]
- Hu, Y.; Cheng, Z.; Heller, L.I.; Krasnoff, S.B.; Glahn, R.P.; Welch, R.M. Kaempferol in red and pinto bean seed (Phaseolus vulgaris L.) coats inhibits iron bioavailability using an in vitro digestion/human Caco-2 cell model. J. Agric. Food Chem. 2006, 54, 9254–9261. [Google Scholar] [CrossRef] [PubMed]
- Hentze, M.W.; Kühn, L.C. Molecular control of vertebrate iron metabolism: mRNA-based regulatory circuits operated by iron, nitric oxide, and oxidative stress. Proc. Natl. Acad. Sci. USA 1996, 93, 8175–8182. [Google Scholar] [CrossRef] [PubMed]
- Glahn, R.P.; Cheng, Z.; Welch, R.M.; Gregorio, G.B. Comparison of iron bioavailability from 15 rice genotypes: Studies using an in vitro digestion/caco-2 cell culture model. J. Agric. Food Chem. 2002, 50, 3586–3591. [Google Scholar] [CrossRef] [PubMed]
- Tako, E.; Rutzke, M.A.; Glahn, R.P. Using the domestic chicken (Gallus gallus) as an In Vivo model for iron bioavailability. Poult. Sci. 2010, 89, 514–521. [Google Scholar] [CrossRef] [PubMed]
- Lung’aho, M.G.; Glahn, R.P. In vitro estimates of iron bioavailability in some Kenyan complementary foods. Food Nutr. Bull. 2009, 30, 145–152. [Google Scholar] [CrossRef] [PubMed]
- Beiseigel, J.M.; Hunt, J.R.; Glahn, R.P.; Welch, R.M.; Menkir, A.; Maziya-Dixon, B.B. Iron bioavailability from maize and beans: a comparison of human measurements with Caco-2 cell and algorithm predictions. Am. J. Clin Nutr. 2007, 86, 388–396. [Google Scholar] [PubMed]
- Tako, E.; Glahn, R.P.; Laparra, J.M.; Welch, R.M.; Lei, X.; Kelly, J.D.; Rutzke, M.A.; Miller, D.D. Iron and zinc bioavailabilities to pigs from red and white beans (Phaseolus vulgaris L.) are similar. J. Agric. Food Chem. 2009, 57, 3134–3140. [Google Scholar] [CrossRef] [PubMed]
- Tako, E.; Laparra, J.M.; Glahn, R.P.; Welch, R.M.; Lei, X.G.; Beebe, S.; Miller, D.D. Biofortified black beans in a maize and bean diet provide more bioavailable iron to piglets than standard black beans. J. Nutr. 2009, 139, 305–309. [Google Scholar] [CrossRef] [PubMed]
- Tan, S.Y.; Yeung, C.K.; Tako, E.; Glahn, R.P.; Welch, R.M.; Lei, X.; Miller, D.D. Iron bioavailability to piglets from red and white common beans (Phaseolus vulgaris). J. Agric. Food Chem. 2008, 56, 5008–5014. [Google Scholar] [CrossRef] [PubMed]
- Pachón, H.; Stoltzfus, R.J.; Glahn, R.P. Chicken thigh, chicken liver, and iron-fortified wheat flour increase iron uptake in an In Vitro digestion/Caco-2 cell model. Nutr. Res. 2008, 8, 851–858. [Google Scholar] [CrossRef] [PubMed]
- Tako, E.; Glahn, R.P. Intra-amniotic administration and dietary inulin affect the iron status and intestinal functionality of iron-deficient broiler chickens. Poult. Sci. 2012, 91, 1361–1370. [Google Scholar] [CrossRef] [PubMed]
- Seim, G.L.; Tako, E.; Ahn, C.; Glahn, R.P.; Young, S.L. A novel In Vivo model for assessing the impact of geophagic earth on iron status. Nutrients 2016, 8, 362. [Google Scholar] [CrossRef] [PubMed]
- Mahler, G.J.; Esch, M.B.; Tako, E.; Southard, T.L.; Archer, S.D.; Glahn, R.P.; Shuler, M.L. Oral exposure to polystyrene nanoparticles affects iron absorption. Nat. Nanotechnol. 2012, 7, 264–271. [Google Scholar] [CrossRef] [PubMed]
- Reed, S.; Qin, X.; Ran-Ressler, R.; Brenna, J.T.; Glahn, R.P.; Tako, E. Dietary zinc deficiency affects blood linoleic acid: Dihomo-γ-linolenic acid (LA:DGLA) ratio; a sensitive physiological marker of zinc status In Vivo (Gallus gallus). Nutrients 2014, 6, 1164–1180. [Google Scholar] [CrossRef] [PubMed]
- Reed, S.; Neuman, H.; Moscovich, S.; Glahn, R.P.; Koren, O.; Tako, E. Chronic Zinc Deficiency Alters Chick Gut Microbiota Composition and Function. Nutrients 2015, 7, 9768–9784. [Google Scholar] [CrossRef] [PubMed]
- International Chicken Genome Sequencing Consortium. Sequence and comparative analysis of the chicken genome provide unique perspectives on vertebrate evolution. Nature 2004, 432, 695–716. [Google Scholar]
- Fairweather-Tait, S.J. Iron. J. Nutr. 2001, 131 (Suppl. S4), 1383S–1386S. [Google Scholar] [PubMed]
- Patterson, J.K.; Rutzke, M.A.; Fubini, S.L.; Glahn, R.P.; Welch, R.M.; Lei, X.; Miller, D.D. Dietary inulin supplementation does not promote colonic iron absorption in a porcine model. J. Agric. Food Chem. 2009, 57, 5250–5256. [Google Scholar] [CrossRef] [PubMed]
- Tumbleson, M.E.; Kalish, P.R. Serum biochemical and hematological parameters in crossbred swine from birth through eight weeks of age. Can. J. Comp. Med. 1972, 36, 202–209. [Google Scholar] [PubMed]
- Miller, E.R.; Ullrey, D.E. The pig as a model for human nutrition. Annu. Rev. Nutr. 1987, 7, 361–382. [Google Scholar] [CrossRef] [PubMed]
- Kyriazakis, I.; Tolkamp, B.J.; Emmans, G. Diet selection and animal state: An integrative framework. Proc. Nutr. Soc. 1999, 58, 765–772. [Google Scholar] [CrossRef] [PubMed]
- Van Rens, B.T.; van der Lende, T. Piglet and placental traits at term in relation to the estrogen receptor genotype in gilts. Theriogenology 2002, 57, 1651–1667. [Google Scholar] [CrossRef]
- Martini, F.H.; Ober, W.C.; Garrison, C.W.; Weich, K.; Hutchings, R.T. Fundamentals of Anatomy and Physiology; Prentice Hall International: London, UK, 1998; pp. 861–917. [Google Scholar]
- Mochizuki, S.; Makita, T. Differences in intestinal between specific pathogen free (SPF) and conventional swine. J. Vet. Med. Sci. 1998, 60, 545–548. [Google Scholar] [CrossRef] [PubMed]
- Sturkie, P. Avian Physiology; Academic Press: San Diego, CA, USA, 2000. [Google Scholar]
- Hartono, K.; Reed, S.; Ayikarkor Ankrah, N.; Glahn, R.P.; Tako, E. Alterations in gut microflora populations and brush border functionality following intra-amniotic daidzein administration. RSC. Adv. 2015, 5, 6407. [Google Scholar] [CrossRef]
- Tako, E.; Glahn, R.P.; Welch, R.M.; Lei, X.; Yasuda, K.; Miller, D.D. Dietary inulin affects the expression of intestinal enterocyte iron transporters, receptors and storage protein and alters the microbiota in the pig intestine. Br. J. Nutr. 2008, 99, 472–480. [Google Scholar] [CrossRef] [PubMed]
- DellaValle, D.M.; Vandenberg, A.; Glahn, R.P. Seed coat removal improves iron bioavailability in cooked lentils: Studies using an in vitro digestion/Caco-2 cell culture model. J. Agric. Food Chem. 2013, 61, 8084–8089. [Google Scholar] [CrossRef] [PubMed]
- Mete, A.; van Zeeland, Y.R.; Vaandrager, A.B.; van Dijk, J.E.; Marx, J.J.; Dorrestein, G.M. Partial purification and characterization of ferritin from the liver and intestinal mucosa of chickens, turtledoves and mynahs. Avian Pathol. 2005, 34, 430–434. [Google Scholar] [CrossRef] [PubMed]
- Passaniti, A.; Roth, T.F. Purification of chicken liver ferritin by two novel methods and structural comparison with horse spleen ferritin. Biochem. J. 1989, 258, 413–419. [Google Scholar] [CrossRef] [PubMed]
- Argyri, K.; Tako, E.; Miller, D.D.; Glahn, R.P.; Komaitis, M.; Kapsokefalou, M. Milk peptides increase iron dialyzability in water but do not affect DMT-1 expression in Caco-2 cells. J. Agric. Food Chem. 2009, 57, 1538–1543. [Google Scholar] [CrossRef] [PubMed]
- Byrnes, V.; Barrett, S.; Ryan, E.; Kelleher, T.; O’Keane, C.; Coughlan, B.; Crowe, J. Increased duodenal DMT-1 expression and unchanged HFE mRNA levels in HFE-associated hereditary hemochromatosis and iron deficiency. Blood Cells Mol. Dis. 2002, 29, 251–260. [Google Scholar] [CrossRef] [PubMed]
- Zoller, H.; Theurl, I.; Koch, R.O.; McKie, A.T.; Vogel, W.; Weiss, G. Duodenal cytochrome B and hephaestin expression in patients with iron deficiency and hemochromatosis. Gastroenterology 2003, 125, 746–754. [Google Scholar] [CrossRef]
- Nam, H.; Wang, C.Y.; Zhang, L.; Zhang, W.; Hojyo, S.; Fukada, T.; Knutson, M.D. ZIP14 and DMT1 in the liver, pancreas, and heart are differentially regulated by iron deficiency and overload: Implications for tissue iron uptake in iron-related disorders. Haematologica 2013, 98, 1049–1057. [Google Scholar] [CrossRef] [PubMed]
- Mira, L.; Fernandez, M.T.; Santos, M.; Rocha, R.; Florêncio, M.H.; Jennings, K.R. Interactions of flavonoids with iron and copper ions: A mechanism for their antioxidant activity. Free Radic. Res. 2002, 36, 1199–1208. [Google Scholar] [CrossRef] [PubMed]
- Benherlal, P.S.; Arumughan, C. Studies on modulation of DNA integrity in Fenton’s system by phytochemicals. Mutat. Res. 2008, 648, 1–8. [Google Scholar] [CrossRef] [PubMed]
- Mladěnka, P.; Macáková, K.; Filipský, T.; Zatloukalová, L.; Jahodář, L.; Bovicelli, P.; Silvestri, I.P.; Hrdina, R.; Saso, L. In vitro analysis of iron chelating activity of flavonoids. J. Inorg. Biochem. 2011, 105, 693–701. [Google Scholar] [CrossRef] [PubMed]
- Perez, C.A.; Wei, Y.; Guo, M. Iron-binding and anti-Fenton properties of baicalein and baicalin. J. Inorg. Biochem. 2009, 103, 326–332. [Google Scholar] [CrossRef] [PubMed]
- Park, S.S.; Bae, I.; Lee, Y.J. Flavonoids-induced accumulation of hypoxia-inducible factor (HIF)-1alpha/2alpha is mediated through chelation of iron. J. Cell. Biochem. 2008, 103, 1989–1998. [Google Scholar] [CrossRef] [PubMed]
- Persichini, T.; Maio, N.; di Patti, M.C.; Rizzo, G.; Colasanti, M.; Musci, G. Genistein up-regulates the iron efflux system in glial cells. Neurosci. Lett. 2010, 470, 145–149. [Google Scholar] [CrossRef] [PubMed]
- Wang, L.S.; Sun, X.D.; Cao, Y.; Wang, L.; Li, F.J.; Wang, Y.F. Antioxidant and pro-oxidant properties of acylated pelargonidin derivatives extracted from red radish (Raphanus sativus var. niger, Brassicaceae). Food Chem. Toxicol. 2010, 48, 2712–2718. [Google Scholar] [CrossRef] [PubMed]
- Zheng, L.; Cheng, Z.; Ai, C.; Jiang, X.; Bei, X.; Zheng, Y.; Glahn, R.P.; Welch, R.M.; Miller, D.D.; Lei, X.G.; et al. Nicotianamine, a novel enhancer of rice iron bioavailability to humans. PLoS ONE 2010, 16, e10190. [Google Scholar] [CrossRef] [PubMed]
- Etcheverry, P.; Wallingford, J.C.; Miller, D.D.; Glahn, R.P. The effect of calcium salts, ascorbic acid and peptic pH on calcium, zinc and iron bioavailabilities from fortified human milk using an in vitro digestion/Caco-2 cell model. Int. J. Vitam. Nutr. Res. 2005, 75, 171–178. [Google Scholar] [CrossRef] [PubMed]
- Etcheverry, P.; Wallingford, J.C.; Miller, D.D.; Glahn, R.P. Calcium, zinc, and iron bioavailabilities from a commercial human milk fortifier: A comparison study. J. Dairy Sci. 2004, 87, 3629–3637. [Google Scholar] [CrossRef]
- Lung’aho, M.G.; Glahn, R.P. Micronutrient sprinkles add more bioavailable iron to some Kenyan complementary foods: Studies using an in vitro digestion/Caco-2 cell culture model. Matern. Child Nutr. 2009, 5, 151–158. [Google Scholar] [CrossRef] [PubMed]
- Lung’aho, M.G.; Glahn, R.P. Use of white beans instead of red beans may improve iron bioavailability from a Tanzanian complementary food mixture. Int. J. Vitam. Nutr. Res. 2010, 80, 24–31. [Google Scholar] [CrossRef] [PubMed]
- Huh, E.C.; Hotchkiss, A.; Brouillette, J.; Glahn, R.P. Carbohydrate fractions from cooked fish promote iron uptake by Caco-2 cells. J. Nutr. 2004, 134, 1681–1689. [Google Scholar] [PubMed]
- Tako, E.; Glahn, R.P. Caco-2 Cell and Animal Model Studies (Gallus gallus) Are Effective at Screening and Developing Staple Food Crops with Improved Fe Bioavailability. In Proceedings of the Symposium—Improving Pulse Crops for Nutrition and Health, Crop Science Society of America Meeting Abstract, Minneapolis, MN, USA, 15–18 November 2015.
- Petry, N.; Egli, I.; Gahutu, J.B.; Tugirimana, P.L.; Boy, E.; Hurrell, R. Phytic acid concentration influences iron bioavailability from biofortified beans in Rwandese women with low iron status. J. Nutr. 2014, 144, 1681–1687. [Google Scholar] [CrossRef] [PubMed]
- DellaValle, D.M.; Glahn, R.P. Differences in relative iron bioavailability in traditional Bangladeshi meal plans. Food Nutr. Bull. 2014, 35, 431–439. [Google Scholar] [CrossRef] [PubMed]
- Mascitelli, L.; Goldstein, M.R. Inhibition of iron absorption by polyphenols as an anti-cancer mechanism. QJM 2011, 104, 459–461. [Google Scholar] [CrossRef] [PubMed]
- Zimmermann, M.B.; Chaouki, N.; Hurrell, R.F. Iron deficiency due to consumption of a habitual diet low in bioavailable iron: A longitudinal cohort study in Moroccan children. Am. J. Clin. Nutr. 2005, 81, 115–121. [Google Scholar] [PubMed]
- Kumar, V.; Sinha, A.K.; Makkar, H.P.S.; Becker, K. Dietary roles of phytate and phytase in human nutrition: A review. Food Chem. 2010, 120, 945–959. [Google Scholar] [CrossRef]
- Ryan, P.; Hynes, M.J. The kinetics and mechanisms of the reactions of iron (III) with quercetin and morin. J. Inorg. Biochem. 2008, 102, 127–136. [Google Scholar] [CrossRef] [PubMed]
- Lesjak, M.; Hoque, R.; Balesaria, S.; Skinner, V.; Debnam, E.S.; Srai, S.K.; Sharp, P.A. Quercetin inhibits intestinal iron absorption and ferroportin transporter expression In Vivo and In Vitro. PLoS ONE 2014, 9, e102900. [Google Scholar] [CrossRef] [PubMed]
- Kim, E.Y.; Ham, S.K.; Bradke, D.; Ma, Q.; Han, O. Ascorbic acid offsets the inhibitory effect of bioactive dietary polyphenolic compounds on transepithelial iron transport in Caco-2 intestinal cells. J. Nutr. 2011, 141, 828–834. [Google Scholar] [CrossRef] [PubMed]
- Scalbert, A.; Johnson, I.T.; Saltmarsh, M. Polyphenols: Antioxidants and beyond. Am. J. Clin. Nutr. 2005, 81 (Suppl. S1), 215S–217S. [Google Scholar] [PubMed]
- Crozier, A.; Jaganath, I.B.; Clifford, M.N. Dietary phenolics: Chemistry, bioavailability and effects on health. Nat. Prod. Rep. 2009, 26, 1001–1043. [Google Scholar] [CrossRef] [PubMed]
- Petry, N.; Egli, I.; Zeder, C.; Walczyk, T.; Hurrell, R. Polyphenols and phytic acid contribute to the low iron bioavailability from common beans in young women. J. Nutr. 2010, 140, 1977–1782. [Google Scholar] [CrossRef] [PubMed]
- Ramachandra, G.; Virupaksha, T.K.; Shadaksharaswamy, M. Relationship between tannin levels and in vitro protein digestibility in finger millet (Eleusine coracana Gaertn.). J. Agric. Food Chem. 1977, 25, 1101–1104. [Google Scholar] [CrossRef] [PubMed]
- Reichert, R.D. The pH-sensitive pigments in pearl millet. Cereal Chem. 1979, 56, 291–294. [Google Scholar]
- Chethan, S.; Sreerama, Y.N.; Malleshi, N.G. Mode of inhibition of finger millet malt amylases by the millet phenolics. Food Chem. 2008, 111, 187–191. [Google Scholar] [CrossRef]
- Devi, P.B.; Vijayabharathi, R.; Sathyabama, S.; Malleshi, N.G.; Priyadarisini, V.B. Health benefits of finger millet (Eleusine coracana L.) polyphenols and dietary fiber: A review. J. Food Sci. Technol. 2014, 51, 1021–1040. [Google Scholar] [CrossRef] [PubMed]
- Salunkhe, D.K.; Jadhav, S.J.; Kadam, S.S.; Chavan, J.K. Chemical, biochemical, and biological significance of polyphenols in cereals and legumes. Crit. Rev. Food Sci. Nutr. 1982, 17, 277–305. [Google Scholar] [CrossRef] [PubMed]


| Ingredient Low-Fe Bean Diet High-Fe Bean Diet | ||
|---|---|---|
| g/kg (by Formulation) | ||
| High-Fe Beans (71 µg Fe/g), NUA35 | − | 600 |
| Low-Fe Beans (49 µg Fe/g), CAL96 | 600 | − |
| Corn | 200 | 200 |
| Corn oil | 30 | 30 |
| Dry skim milk | 100 | 100 |
| Vitamin/mineral premix (no Fe) 1 | 70 | 70 |
| dl-Methionine | 2.5 | 2.5 |
| Choline Chloride | 0.75 | 0.75 |
| Total (g) | 1000 | 1000 |
| Selected components | mean ± SEM, n = 5 (by analysis) | |
| Fe (µg Fe/g) 2 | 42.9 ± 1.2 a | 54.6 ± 0.9 b |
| Total Phenols (gallic acid, µg/g) 3 | 103.5 ± 5.5 a | 101.8 ± 6.1 a |
| Phytate:Fe molar ratio 3 | 8.28 ± 9.2 a | 8.59 ± 1.06 a |
| Ingredient Standard Bean Diet Biofortified Bean Diet | ||
|---|---|---|
| g/kg (by Formulation) | ||
| Biofortified Beans (88 µg Fe/g),MIB465 | − | 400 |
| Standard Beans (59 µg Fe/g), DOR500 | 400 | − |
| Corn | 350 | 350 |
| Corn oil | 30 | 30 |
| Dry skim milk | 100 | 100 |
| Corn starch | 46.75 | 46.75 |
| Vitamin/mineral premix (no Fe) 1 | 70 | 70 |
| dl-Methionine | 2.5 | 2.5 |
| Choline Chloride | 0.75 | 0.75 |
| Total (g) | 1000 | 1000 |
| Selected components | mean ± SEM, n = 5 (by analysis) | |
| Fe (µg Fe/g) 2 | 39.4 ± 0.2 b | 52.9 ± 0.9 a |
| Phytate:Fe molar ratio 3 | 8.25 ± 0. 65 a | 8.95 ± 0.72 a |
| Ingredient | High-Fe (Biofortified) | Low-Fe (Standard) |
|---|---|---|
| g/kg (by Formulation) | ||
| High-Fe Pearl millet (84.9 µg/g Fe), ICTP 8203 | 750 | − |
| Low-Fe Pearl Millet (25.9 µg/g Fe), DG 9444 | − | 750 |
| Skim milk, dry | 100 | 100 |
| dl-Methionine | 2.5 | 2.5 |
| Corn starch | 47.5 | 47.5 |
| Corn oil | 30 | 30 |
| Choline chloride | 0.75 | 0.75 |
| Vitamin/mineral premix (no Fe) | 70 | 70 |
| Total (g) | 1000 | 1000 |
| Selected components | mean ± SEM, n = 5 (by analysis) | |
| Dietary Fe concentration (µg/g) | 78.6 ± 0.51 a | 22.1 ± 0.52 b |
| Phytic Acid (µg/g) | 9940 ± 1380 a | 10,500 ± 230 a |
| Phytate:Fe molar ratio 3 | 10.7 ± 0.55 b | 40.2 ± 0.35 a |
| Ingredient | Fe Content1 | Standard Bean Diet | Biofortified Bean Diet |
|---|---|---|---|
| µg Fe/g, (n = 5, by Analysis) g/kg (by Formulation) | |||
| Biofortified-Fe Beans, SMC | 106.1 ± 0.204 | – | 346 |
| Standard-Fe Beans, G4825 | 57.10 ± 0.145 | 346 | – |
| Basmati Rice | 0.290 ± 0.006 | 135 | 135 |
| Pasta (non-enriched) | 11.48 ± 0.358 | 70 | 70 |
| Potato flakes | 10.26 ± 0.061 | 215 | 215 |
| Banana Chips | 7.510 ± 0.521 | 115 | 115 |
| Cabbage | 16.32 ± 0.400 | 30 | 30 |
| Tomato powder | 39.92 ± 1.187 | 16 | 16 |
| Orange sweet potatoes | 26.90 ± 0.611 | 73 | 73 |
| Vitamin/mineral premix (no Fe) 2 | 0.00 ± 0.00 | 70 | 70 |
| dl-Methionine | 0.00 ± 0.00 | 2.5 | 2.5 |
| Vegetable oil | 0.00 ± 0.00 | 30 | 30 |
| Choline chloride | 0.00 ± 0.00 | 0.75 | 0.75 |
| Total (g) | 1000 | 1000 | |
| Selected components | mean ± SEM, n = 5 (by analysis) 4 | ||
| Dietary Fe concentration (µg/g) | 33.7 ± 0.80 b | 48.7 ± 1.50 a | |
| Phytic acid (µg/g) 3 | 10,605 ± 742 b | 13,793 ± 1172 a | |
| Phytate:Fe molar ratio | 15.43 ± 0.85 a | 10.95 ± 0.65 b | |
| Tested Sample 1 | Cream Seeded Carioca Beans Study [17] | Black Beans Study [15] | Red Mottled Beans Study [11] | Pearl Millet Study [16] | |
|---|---|---|---|---|---|
| Food Crop | |||||
| Ferritin (ng/mg of Protein) | |||||
| Standard variety only | 2.86 ± 0.14 b | 2.31 ± 0.11 c | 7.82 ± 0.75 d | 1.22 ± 0.05 c | |
| Fe Biofortified variety only | 4.40 ± 0.14 a | 2.19 ± 0.14 c | 30.6 ± 2.08 a | 2.61 ± 0.36 a | |
| Standard variety based diet | 1.96 ± 0.05 d | 2.97 ± 0.10 b | 11.2 ± 0.97 c | 1.47 ± 0.27 bc | |
| Fe Biofortified variety based diet | 2.73 ± 0.23 bc | 2.75 ± 0.09 b | 15.7 ± 1.05 b | 2.46 ± 0.13 a | |
| Cell baseline 2 | 2.53 ± 0.07 c | 3.28 ± 0.13 a | 4.06 ± 0.37 e | 1.54 ± 0.12 b | |
| Treatment Group | Ferritin (µg/g Wet Weight) | Iron (µg/g Wet Weight) | |
|---|---|---|---|
| Red Mottled Bean study [11] | Standard | 409 ± 12 a | 39.5 ± 3.5 a |
| Fe biofortified | 425 ± 18 a | 48.1 ± 4.2 a | |
| Black bean study [15] | Standard | 282 ± 12 a | 27.2 ± 1.7 a |
| Fe biofortified | 293 ± 11 a | 33.1 ± 2.2 a | |
| Pearl Millet study [16] | Standard | 277 ± 7.1 a | 19.3 ± 2.7 a |
| Fe biofortified | 285 ± 8.5 a | 25.2 ± 3.9 a | |
| Cream Seeded Carioca bean study [17] | Standard | 284 ± 13 a | 45.5 ± 3.4 b |
| Fe biofortified | 315 ± 22 a | 62.6 ± 5.7 a |
| Bean Variety | Compound | “Biofortified Fe” | “Standard Fe” | Putative In Vitro Effect on Fe Absorption/Bioavailability [15,17,18,19] |
|---|---|---|---|---|
| Black beans | Caffeic acid | 0.060 ± 0.0009 b | 0.026 ± 0.004 a | ↑ |
| Gallic acid | 0.125 ± 0.0088 a | 0.103 ± 0.018 a | ↑ | |
| Ferulic acid | 0.153 ± 0.011 a | 0.163 ± 0.020 a | ↓ | |
| Kaempferol | 0.005.0 ± 0.0001 a | 0.00 ± 0.00 b | ↑ | |
| Catechin | 0.669 ± 0.0311 a | 0.367 ± 0.025 b | ↑ | |
| Myricetin | 0.024 ± 0.0017 a | 0.012 ± 0.004 b | ↓ | |
| Kaempferol 3-glucoside | 0.198 ± 0.0107 a | 0.019 ± 0.005 b | ↑ | |
| Quercetin 3-glucoside | 0.239 ± 0.0203 a | 0.046 ± 0.007 b | ↓ | |
| Cream seeded carioca beans | 3,4-dihydroxybenzoic acid | 0.211 ± 0.02 a | 0.198 ± 0.002 a | ↑ |
| Catechin | 0.179 ± 0.004 a | 0.175 ± 0.02 a | ↑ | |
| Quercetin 3-glucoside | 0.085 ± 0.01 a | 0.00 ± 0.00 b | ↓ | |
| Kaempferol 3-glucoside | 0.302 ± 0.007 a | 0.206 ± 0.008 b | ↑ | |
| Kaempferol | 0.015 ± 0.001 a | 0.015 ± 0.001 a | ↑ |
| Class | Compound | Putative In Vitro Effect on Fe Absorption/Bioavailability | Citation |
|---|---|---|---|
| Flavones | Apigenin | ↓ | [91,92,93] |
| Baicalein | ↓ | [94,95] | |
| Luteolin | ↓ | [92] | |
| Norwogonin | * | ||
| Scutellarein | * | ||
| 5,7,2’-Trihydroxyflavone | * | ||
| 7,3’,4’-Trihydroxyflavone | * | ||
| 7,3’,4’,5’-Tetrahydroxyflavone | * | ||
| Flavonol | Galangin | ↓ | [96] |
| Kaempferol | ↓ ↑ | [18,19,92] | |
| Isoflavones | Dihydrodaidzein | ↓ | [92] |
| Genistein | ↓ | [93,97] | |
| Trihydroxyisoflavone | * | ||
| 6,7,4’-trihydroxyisoflavone | * | ||
| Anthocyanins | Pelargonidin | ↓ | [98] |
© 2016 by the authors; licensee MDPI, Basel, Switzerland. This article is an open access article distributed under the terms and conditions of the Creative Commons Attribution (CC-BY) license (http://creativecommons.org/licenses/by/4.0/).
Share and Cite
Tako, E.; Bar, H.; Glahn, R.P. The Combined Application of the Caco-2 Cell Bioassay Coupled with In Vivo (Gallus gallus) Feeding Trial Represents an Effective Approach to Predicting Fe Bioavailability in Humans. Nutrients 2016, 8, 732. https://0-doi-org.brum.beds.ac.uk/10.3390/nu8110732
Tako E, Bar H, Glahn RP. The Combined Application of the Caco-2 Cell Bioassay Coupled with In Vivo (Gallus gallus) Feeding Trial Represents an Effective Approach to Predicting Fe Bioavailability in Humans. Nutrients. 2016; 8(11):732. https://0-doi-org.brum.beds.ac.uk/10.3390/nu8110732
Chicago/Turabian StyleTako, Elad, Haim Bar, and Raymond P. Glahn. 2016. "The Combined Application of the Caco-2 Cell Bioassay Coupled with In Vivo (Gallus gallus) Feeding Trial Represents an Effective Approach to Predicting Fe Bioavailability in Humans" Nutrients 8, no. 11: 732. https://0-doi-org.brum.beds.ac.uk/10.3390/nu8110732