Article

Future Changes in Western North Pacific Tropical Cyclone Genesis Environment in High-Resolution Large-Ensemble Simulations

1
College of Education, Yokohama National University, Yokohama 240-8501, Japan
2
Meteorological Research Institute, Tsukuba 305-0052, Japan
3
CIRES, University of Colorado Boulder, NOAA Chemical Sciences Laboratory, Boulder, CO 80305, USA
4
RIKEN Center for Computational Science, Kobe 650-0047, Japan
5
Research Center for Urban Safety and Security, Kobe University, Kobe 657-8501, Japan
*
Author to whom correspondence should be addressed.
Submission received: 14 October 2020 / Revised: 9 December 2020 / Accepted: 10 December 2020 / Published: 18 December 2020
(This article belongs to the Special Issue Tropical Cyclone Future Projections)

Abstract

:
This study applied the database for Policy Decision making for Future climate change (d4PDF) and tropical cyclone (TC) genesis (TCG) environment factors to project future changes in the frequency and characteristics of TCs over the western North Pacific. We examined current and future TCG environmental conditions in terms of the contribution of five factors: shear line (SL), confluence region (CR), monsoon gyre, easterly wave (EW), and Rossby wave energy dispersion from a preexisting TC (PTC). Among summer and autumn TCs, the contributions of SL and EW to future TCG increased by about 4% and 1%, respectively, whereas those of CR and PTC decreased by the same amounts. In future climate projections, the average lifetime maximum intensity (LMI) of TCs associated with EW (EW-TCs) was significantly higher than those of TCs associated with other factors except PTC. At higher sea surface temperatures and wetter conditions, higher lower-tropospheric relative vorticity was related to increases in the development rate of EW-TCs. Findings of this study suggest that increases in the average LMI of all future TCs were caused by large contributions from the average LMI of future EW-TCs.

1. Introduction

Many studies have reported predictions of tropical cyclone (TC) activity, including the frequency of TC genesis (TCG) and lifetime maximum intensity (LMI), under future global warming using high-resolution global models. One such study, Yoshida et al. [1], applied a large-scale ensemble dataset based on a high-resolution global atmospheric model the database for Policy Decision making for Future climate change (d4PDF) to assess the uncertainty of atmospheric internal variations and sea surface temperature (SST) increases; the frequency of global TCG was projected to decrease significantly and the proportion of intense TCs to increase by the end of the 21st century, based on the Representative Concentration Pathway 8.5 (RCP8.5) scenario. Over the western North Pacific (WNP), the TCG frequency was projected to decrease by about 40%, and the average LMI of TCs to increase by about 10%.
Several other TC projection studies have shown variant results. A review of Knutson et al. [2] that have projected future TC activity found a medium to high confidence for projected LMI increases, but less consensus for future TCG frequency changes. For example, Roberts et al. [3] projected a 10–20% decrease in TCG frequency using a high-resolution atmospheric model Met. Office Unified Model Global Atmosphere 3 configuration for RCP8.5 by the end of the 21st century. Knutson et al. [4] simulated a 35% decrease in TCG frequency using the high-resolution atmospheric model (HiRAM) and the Geophysical Fluid Dynamics Laboratory (GFDL) hurricane model for Representative Concentration Pathway 4.5 (RCP4.5). In contrast, the atmosphere–ocean-coupled high-resolution forecast-oriented low ocean resolution (HiFLOR) model [5] showed an increase in TCG frequency of 5.8%. A recent study by Zhang et al. [6] used a TC downscaling model and found that the Pacific TCs are going to become more frequent and more intense. Thus, future TC activity remains highly uncertain, and it is difficult to design measures such as social infrastructure to adapt to anticipated increases in TC variability. To reduce the uncertainty of TC activity projections, it is necessary to develop a comprehensive understanding of the detailed mechanisms of TCs in the models.
To assess modeled TCG, it is important to understand the environmental factors that influence TCG over the WNP. Ritchie and Holland [7] examined five large-scale flow patterns as factors contributing to TCG: shear line (SL), confluence region (CR), monsoon gyre (GY), easterly wave (EW), and Rossby wave energy dispersion from a preexisting TC (PTC). The SL is enhanced by horizontal cyclonic shear over the WNP. The CR is a confluence zone situated between the easterly trade winds and westerly monsoon winds at the eastern extremity of the Asian monsoon. The GY is a synoptic-scale gyre embedded within a developed Asian monsoon trough [8,9]. Thus, these factors are closely related to Asian monsoons over the WNP. The EW is related to the synoptic-scale trade easterly wind system; the trough of easterly trade winds provides an environment favorable for TCG [10,11]. A mature TC disperses its energy as a Rossby wave in a southeastward direction; low-pressure areas of the wave train sometimes develop into TCs [12,13,14].
Yoshida and Ishikawa [15] developed a TCG score detection method (TGS) as an objective index to identify the main environmental factors contributing to TCG. Using the TGS and data collected during the Japanese 25-year Reanalysis Project [16], Fudeyasu and Yoshida [17] determined the statistical characteristics of TCs over the WNP, stratified by five TCG environmental factors in the summer and autumn during 1979–2013. TCs that formed in large-scale flows mainly associated with a GY (hereafter, GY-TCs, and similar terms indicate a TC that formed in a large-scale flow mainly associated with an GY or similar factor) tended to develop slowly. The average LMI of PTC-TCs is larger than those of other factors, due to their longer development stage. On average, TC size of GY-TCs is larger at the TCG time than other TCG factors, whereas those of EW-TCs and PTC-TCs are smaller. Fudeyasu and Yoshida [17] summarized differences in the TCG factors that lead to characterization of TCs.
Previous studies [18,19] have projected the environmental factors on TCG over the WNP under future climate change in terms of genesis potential index or similar indices. None has explored future changes in the five TCG environment factors identified by Ritchie and Holland [7]. Assuming that five TCG factors are also the main contributors to TCG over the WNP, future changes in TC characteristics may be projected in terms of TCG frequency or the average LMI of future TCs. To enhance our understanding of TC activity under future climate change, the present study used the d4PDF large-scale ensemble dataset and TGS to investigate the TCG environment statistically under future climate simulations and stratified changes in TC characteristics by the TCG factors.

2. Methodology

In this study, we used the d4PDF large-scale ensemble simulation dataset for current and future climates. The d4PDF dataset was produced by the Meteorological Research Institute–Atmospheric General Circulation Model Version 3.2 (MRI–AGCM3.2H), which is based on a numerical weather prediction model of the Japan Meteorological Agency (JMA), with a horizontal resolution of 60 km [20]. The model has 64 vertical layers, and the model top is set at 0.01 hPa. Current (future) climate simulations of the d4PDF dataset were achieved using 100 (90) ensemble members based on initial atmospheric perturbations and short-term monthly SST perturbations. Six SST warming patterns used in future climate simulations are projected by six coupled models: the Community Climate System Model, version 4 (CCSM4), the Geophysical Fluid Dynamics Laboratory Climate Model, version 3 (GFDL-CM3), the Hadley Centre Global Environment Model, version 2—Atmosphere and Ocean (HadGEM2-AO), the Model for Interdisciplinary Research on Climate, version 5 (MIROC5), the Max Planck Institute Earth System Model, medium resolution (MPI-ESM-MR), and the Meteorological Research Institute Coupled Atmosphere–Ocean General Circulation Model, version 3 (MRI-CGCM3). For the RCP8.5 scenario, SST warming patterns are calculated as monthly differences in SSTs between 1991–2010 and 2080–2099. Climatological differences are scaled by a multiplier, such that MRI–AGCM3.2H reproduces surface air warming of 4 K above pre-industrial levels (+4 K). Current climate simulations were integrated for 60 years (1951–2010) using observed SSTs and sea ice concentrations obtained from the Centennial in situ Observation-Based Estimates (COBE) SST2 product [21]. Future climate simulations were performed for a 60-year period with constant warming roughly corresponding to the levels projected for 2090 under the RCP8.5 scenario adopted in Phase 5 of the Coupled Model Intercomparison Project (CMIP5). For each of the six warming SST patterns, 15-member ensemble experiments were conducted with adding small SST perturbations, giving a total of 90 members (see Mizuta et al. [22] in detail). Thus, the ensemble datasets for present and +4 K future climate scenarios are summarized as follows: 1951–2010 × 100 members (a 6000-year dataset) for the current climate, and 2051–2110 × 90 members (a 5400-year dataset) for the future climate. Further details of the experimental design were provided in Mizuta et al. [22].
In this study, we analyzed 180,753 (87,746) TCs in current (future) climate simulations of the d4PDF dataset. TC track data for the d4PDF dataset were derived from Yoshida et al. [1], which applied the same TC tracking method and threshold values as Murakami et al. [23], which reported that MRI–AGCM3.2H reproduced realistic TC activity in all aspects except for intensity. The TC tracking method and threshold values are provided in Yoshida et al. [1] and Murakami et al. [23].
This study applied the TGS developed by Yoshida and Ishikawa [15] to estimate the contributions of each TCG factor [7] for wind speeds at 850 hPa and sea level pressure, derived from d4PDF. The location and time of the first TC track data entry were used as the TCG location and time. The maximum contribution score was determined as the major flow pattern that mainly affected the TCG, among the SL, CR, GY, EW, and PTC. When a contributing factor could not be detected by the TGS algorithm, the flow pattern was categorized as unclassified flow (UCF). Details of the objective TGS algorithm are provided in previous studies [15,17,24].
This study performed statistical analysis of the following environmental conditions related to TCG, as derived from the d4PDF dataset: SST, magnitude of vertical shear (SHR), middle-tropospheric humidity (HMD), and lower tropospheric relative vorticity. SHR was defined as the difference in horizontal wind speed between heights of 200 and 850 hPa. HMD was defined as the specific humidity at a height of 500 hPa. The 850-hPa relative vorticity (VOR850) was calculated to represent lower-tropospheric relative vorticity. These physical parameters were averaged over a 5° × 5° box relative to the TC center.

3. Results

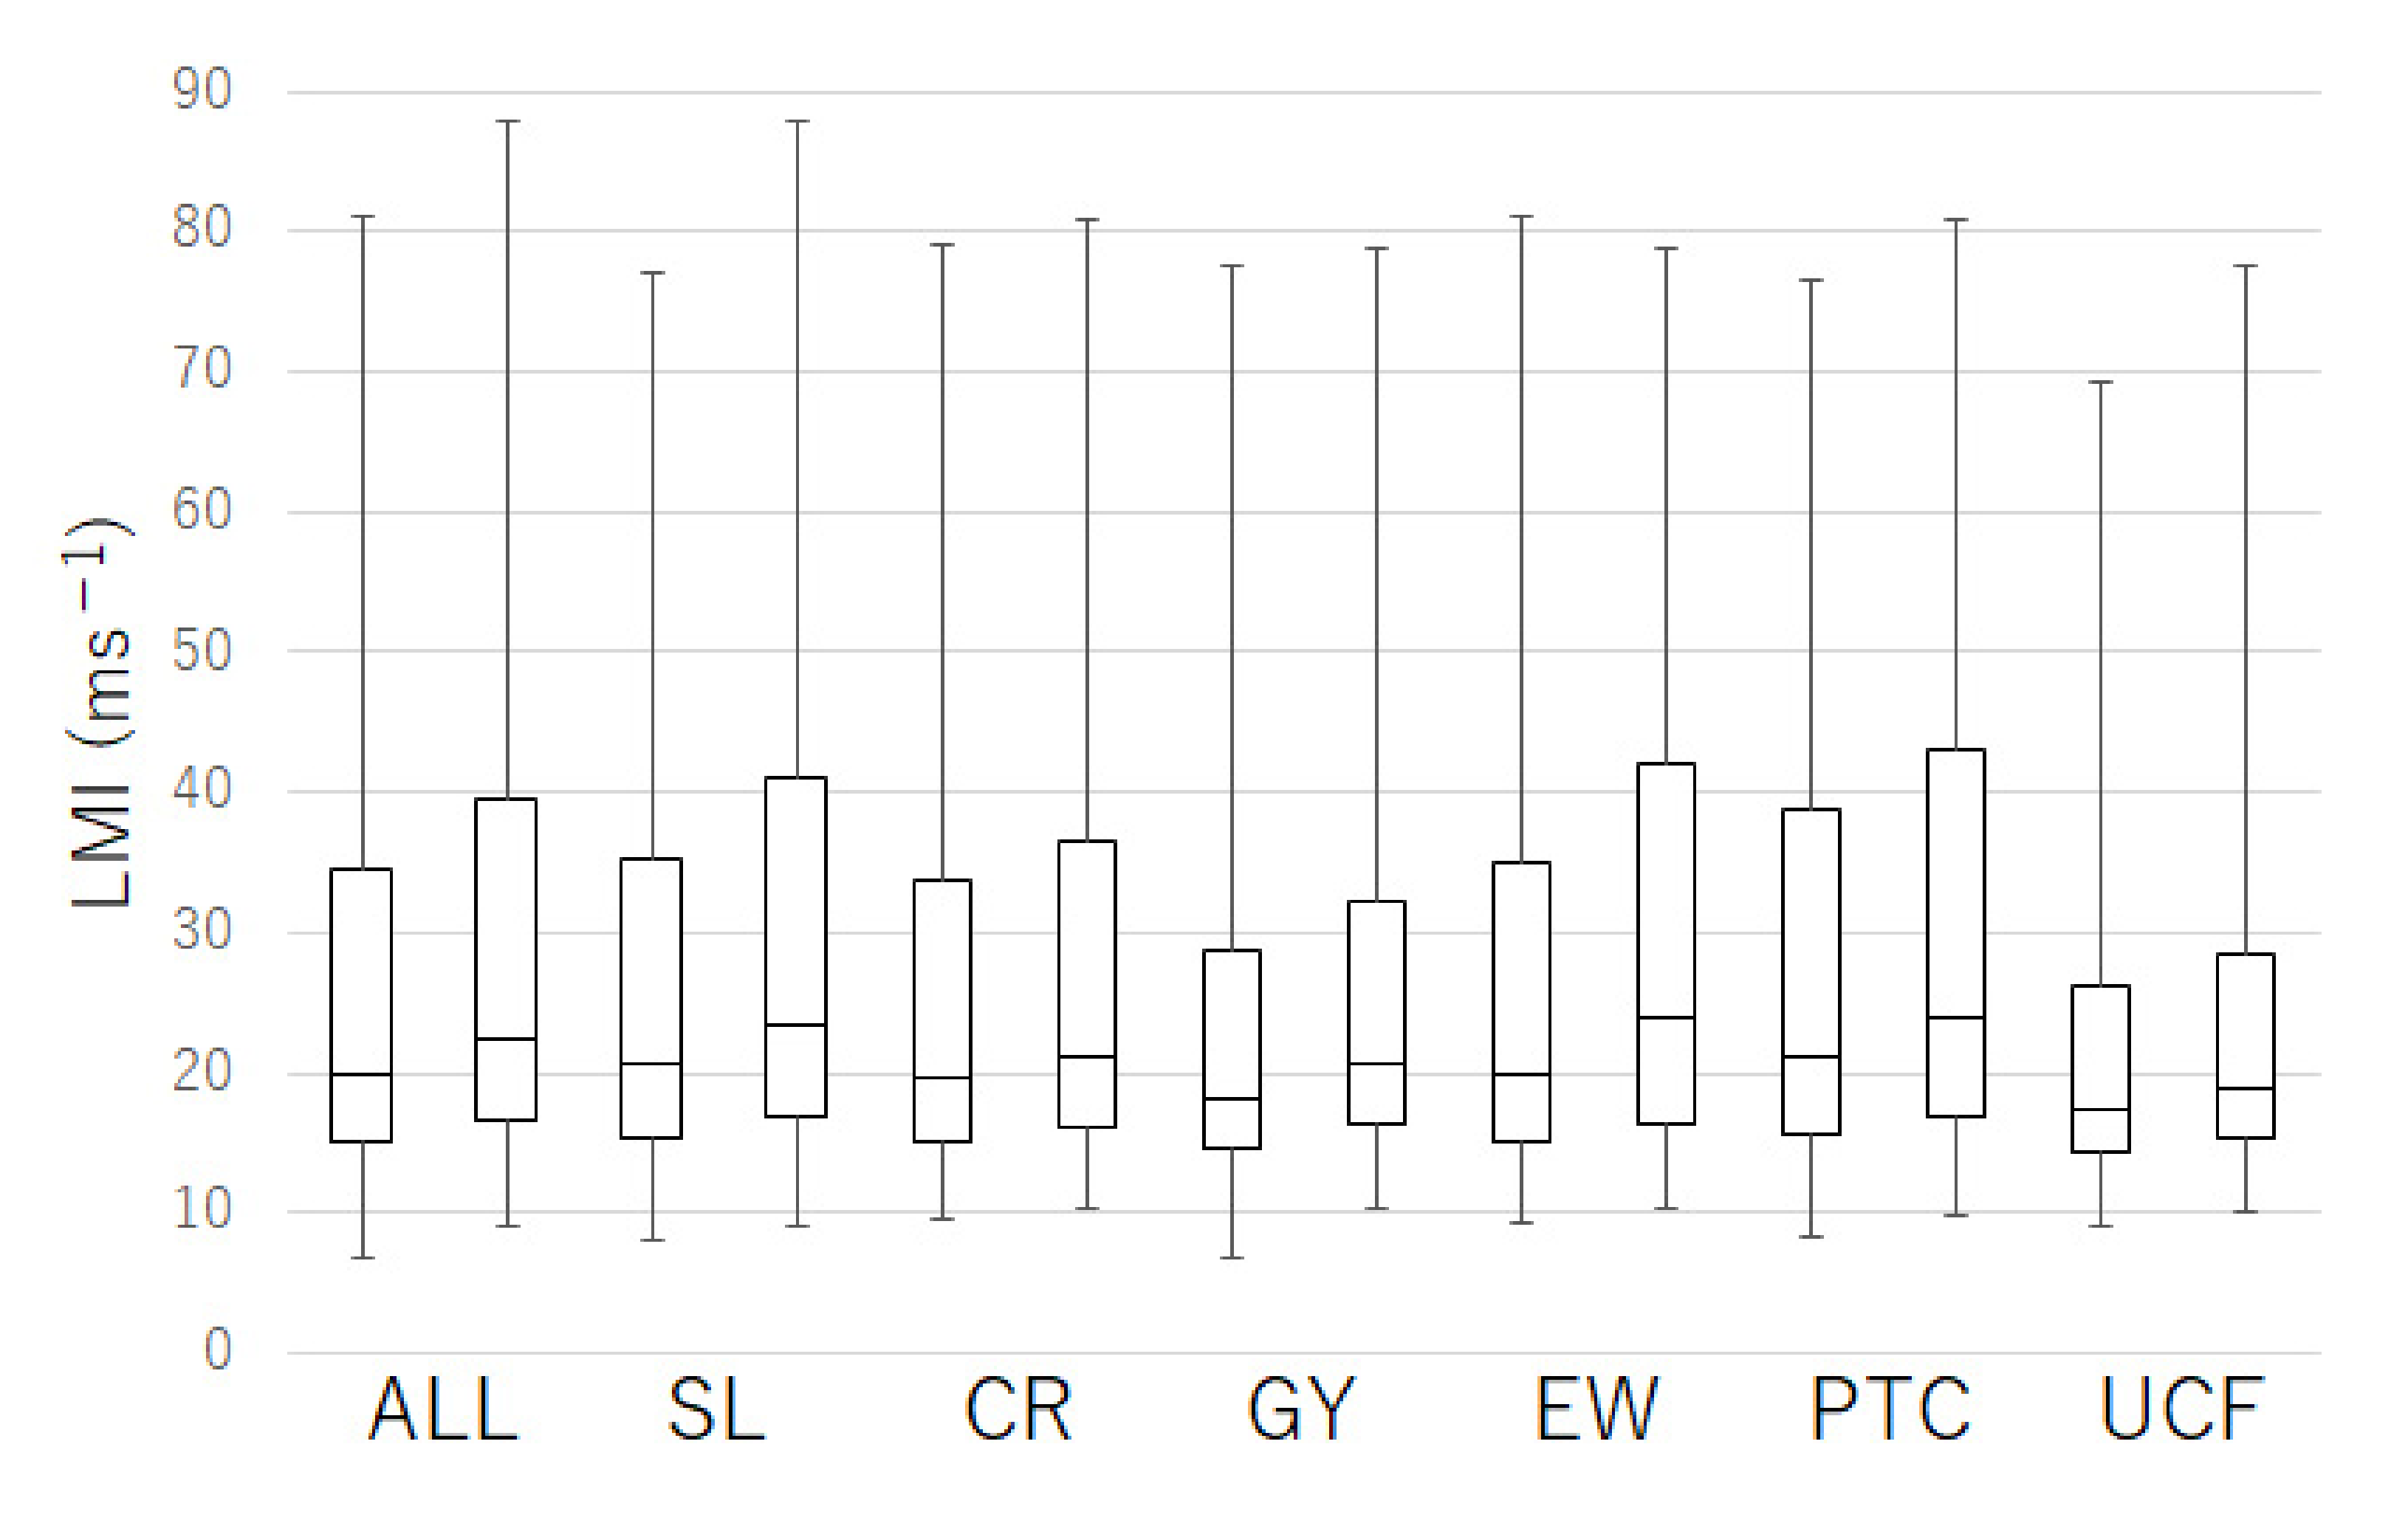
3.1. Characteristics of Current TCs Stratified by TCG Environmental Factors

The annual average TCG over the WNP in the current d4PDF climate simulations was 30.1, which was slightly larger than the observed average of 26.2, obtained from the best-track archives of the Regional Specialized Meteorological Centers Tokyo–Typhoon Center. Figure 1a shows the seasonal changes in TCs stratified by the five TCG environmental factors and UCF. SL-TCs occurred throughout the year. The number of CR-TCs and GY-TCs tended to increase in summer. PTC-TCs tended to occur in autumn, when many TCs formed at lower latitudes. The seasonality of TCs, stratified by TCG environmental factors, was similar to that reported in Yoshida and Ishikawa [15], which considered TCG factors for all TCs, including tropical disturbances.
To compare the characteristics of TCs accurately among TCG factors, we considered TCs in summer and autumn from June to November; all of the examined environmental factors occurred during this period. Among the 143,734 TCs that occurred in summer and autumn (Figure 2a), the most frequent were SL-TCs (72,673 TCs, 50.6% of the total), followed by CR-TCs (27,912 TCs, 19.4%), and EW-TCs (16,113 TCs, 11.2%). PTC-TCs (11,257 TCs) and GY-TCs (10,970 TCs) accounted for 7.8% and 7.6% of all TCs, respectively. The least frequent TCs were those for which the major contributing factors could not be determined, UCF-TCs (4809 TCs, 3.3%).
Using TC data derived from the International Best Track Archive for Climate Stewardship (IBTrACS) [25] and Japanese 25-year Reanalysis Project [16], Fudeyasu and Yoshida [17] analyzed TCG frequency over the WNP, stratified by TCG factors. Among the 677 TCs that occurred in June to November during the analysis period (1979–2013), the most frequent were SL-TCs (300 TCs, 44.3% of the total), followed by CR-TCs (130 TCs, 19.2%), EW-TCs (92 TCs, 13.6%), GY-TCs (61 TCs, 9.0%), PTC-TCs (66 TCs, 9.7%), and UCF-TCs (28 TCs, 4.1%). Although the proportion of SL-TCs (EW-TCs and PTC-TCs) in the d4PDF dataset was slightly higher (lower), the TCG frequency stratified by five TCG factors and UCF in the present study was almost the same as those reported in Fudeyasu and Yoshida [17].
This study performed statistical analysis of TCs stratified by TCG factors in current d4PDF climate simulations. For each factor that influences TCG, the relationship between the average contribution of each factor and those of all other factors was assessed using Student’s t-test at a significance level of p < 0.01. For example, average characteristics of SL-TCs were compared to those of CR-TCs, GY-TCs, EW-TCs, PTC-TCs, and UCF-TCs.
Table 1 show the average locations of TCG for all TCs (Figure 3) and TCG factors (Figure 4) from June to November. There were significant differences in average TCG location among all factors. On average, SL-TCs and GY-TCs occurred significantly farther to the west than the other TCG factors (p < 0.01). On average, CR-TCs, EW-TCs, and UCF-TCs (GY-TCs, and PTC-TCs) occurred farther to the north (south) than other TCG factors.
Fudeyasu and Yoshida [17] clarified the characteristics of observed TCs in summer and autumn from 1979 to 2013, stratified by five TCG factors and UCF. The average TCG locations differed significantly among all factors (p < 0.05). The average location of EW-TCs (PTC-TCs) was farther east and north (south), whereas that of SL-TCs was farther west than those of all other TCG factors, which is consistent with our results (Table 1); we observed significant differences in average location for CR-TCs, GY-TCs, and UCF-TCs for current d4PDF climate simulations, due to very large sample sizes.
We defined TC size as the horizontal extent of TCs at the time of TCG; TC size was calculated as the maximum radius of the 1000-hPa contour from the TC center (Table 1). On average, GY-TCs were larger than TCs of all other factors, whereas EW-TCs and PTC-TCs were smaller (Table 1), which was consistent with the observations of Fudeyasu and Yoshida [17]. In the current d4PDF climate simulations, SL-TCs and UCF-TCs (CR-TCs) were larger (smaller) than TCs of the other factors.
The development rate at TCG, defined as the increase in maximum wind speed 6 h after the time of TCG, differed significantly among factors. GY-TCs had lower development rates than all other TCG factors, which was consistent with the observations reported in Fudeyasu and Yoshida [17]. In the current d4PDF climate simulations, the average development rates of SL-TCs and PTC-TCs (CR-TCs and UCF-TCs) were higher (lower) than those of the other TCG factors.
Table 1 also shows the average TC movement speed during the development stage, which is the duration from the time of TCG to maturity. The mature time is defined as the time at which maximum wind speed occurred. The movement speed was calculated in terms of the hourly horizontal displacement of the TC. The average movement speeds of CR-TCs, EW-TCs, and PTC-TCs were higher than those of the other factors in the development stage. The average duration of the development stage was longer for PTC-TCs than for the other TCG factors, which was consistent with Fudeyasu and Yoshida [17]. In the current d4PDF climate simulations, the average development stage of CR-TCs was longer than those of the other factors.
Highly significant differences in LMI among TCG factors were observed (Table 1 and Figure 5). PTC-TCs (UCF-TCs) tended to have higher (lower) LMI, which was consistent with Fudeyasu and Yoshida [17]. In the current d4PDF climate simulations, the average LMI of SL-TCs (CR-TCs and GY-TCs) was significantly higher (lower) than those of the other TCG factors (p < 0.01).

3.2. Characteristics of Future TCs Stratified by TCG Environmental Factors

The annual average of TCG over the WNP in the future climate simulations was 16.2, while that in the current climate was 30.1. It was almost a half of the number in the current climate simulations, and this significant decrease was consistent with a future trend of TCG frequency reported in previous studies [26,27]. Figure 1b shows the seasonal changes in TCs stratified the five TCG factors and UCF; the seasonal changes due to each TCG factor were very similar to those shown in the current climate simulations. Among the 70,920 TCs projected to occur in summer and autumn in future climate simulations, the most frequent were SL-TCs (38,584 TCs, 54.4% of the total; Figure 2b). The percentage of SL-TCs was about 3.8% higher than that of the current climate simulations. The percentage of CR-TCs (10,666 TCs) was 15.0%, about 4.4% lower than that of the current climate simulations. The percentages of EW-TCs (8420 TCs, 11.9%) and PTC-TCs (5200 TCs, 7.3%) were about 1% higher and lower than those of the current climate, respectively. The percentages of GY-TCs (5404 TCs, 7.6%) and UCF-TCs (2646 TCs, 3.7%) were almost same as those of the current climate simulations.
The averages characteristics of all TCs for the current and future climate simulations are shown in the leftmost columns of Table 1 and Table 2, respectively. A comparison of these averages for all TCs showed many significant differences (p < 0.01). The average TCG locations were farther to the east and north for the future climate simulations (Figure 3b) than for the current climate simulations (Figure 3a). The average sizes and development rates of future TCs were larger than those of current TCs. The increase in average TC sizes at the TCG time was consistent with Khairoutdinov and Emanuel [28], who showed that the storm size of the initial TC vortex increased under the warming experiments. The future increase in TC size was also analyzed in the projection simulations by previous studies [4,29,30,31] which were reviewed in Knutson et al. [2].
The average movement speed of TCs during the development stage was slightly higher for the future climate simulations than for the current climate simulations. The average duration of the development stage was shorter for future TCs than for current TCs. The average LMI of future TCs (Figure 5) was higher than those of current TCs, which is consistent with the findings of previous studies.
Figure 4 and Table 2 show differences in average TC characteristics stratified by TCG factors between current and future climate simulations. The stratified average characteristics were similar to those of all TCs, except for average TCG location and movement speed during the development stage for EW-TCs and PTC-TCs. Although the average locations of SL-TCs, CR-TCs, GY-TCs, and UCF-TCs were farther east under future climate change, those of EW-TCs and PTC-TCs were farther west. Therefore, the TCG classified with monsoon related factors tend to shift eastward, and that with easterly related factors tends to shift westward.
Two modes of distribution change in EW-TCs location can be found in the future climate simulations, expanding to the north-eastward broadly and increasing near the northern part of Philippine sea and South China Sea locally. The former trend is similar to monsoon related factors. But the contribution of the TCG increase around Philippine island results in the statistical significance for the westward shift of the EW-TCs genesis location in the future climate simulations.
Average movement speeds during the development stage of EW-TCs and PTC-TCs were lower in the future climate simulations than those of the current climate simulations. Yamaguchi et al. [32] found that the annual average of TC movement speed under future climate change simulated using d4PDF data had variation among latitudes. Since the dependency of the TCG location to the TCG factors was found in this study, the TC movement speed may have been dependent on TCG factors.
Most TC characteristics among the different TCG factors in the future climate simulations (Table 2) showed the similar for current climate simulations (Table 1), with some exceptions. Interestingly, the average LMI (Figure 5) and TC development rate were significantly higher for EW-TCs than for other TCG factors except PTC in the future climate simulations, but not in the current climate simulations. The average TC development rates for all factors were higher in the future climate simulations; however, the largest increase in the average development rates for EW-TCs resulted in the largest increase in LMI for EW-TC (Table 2).

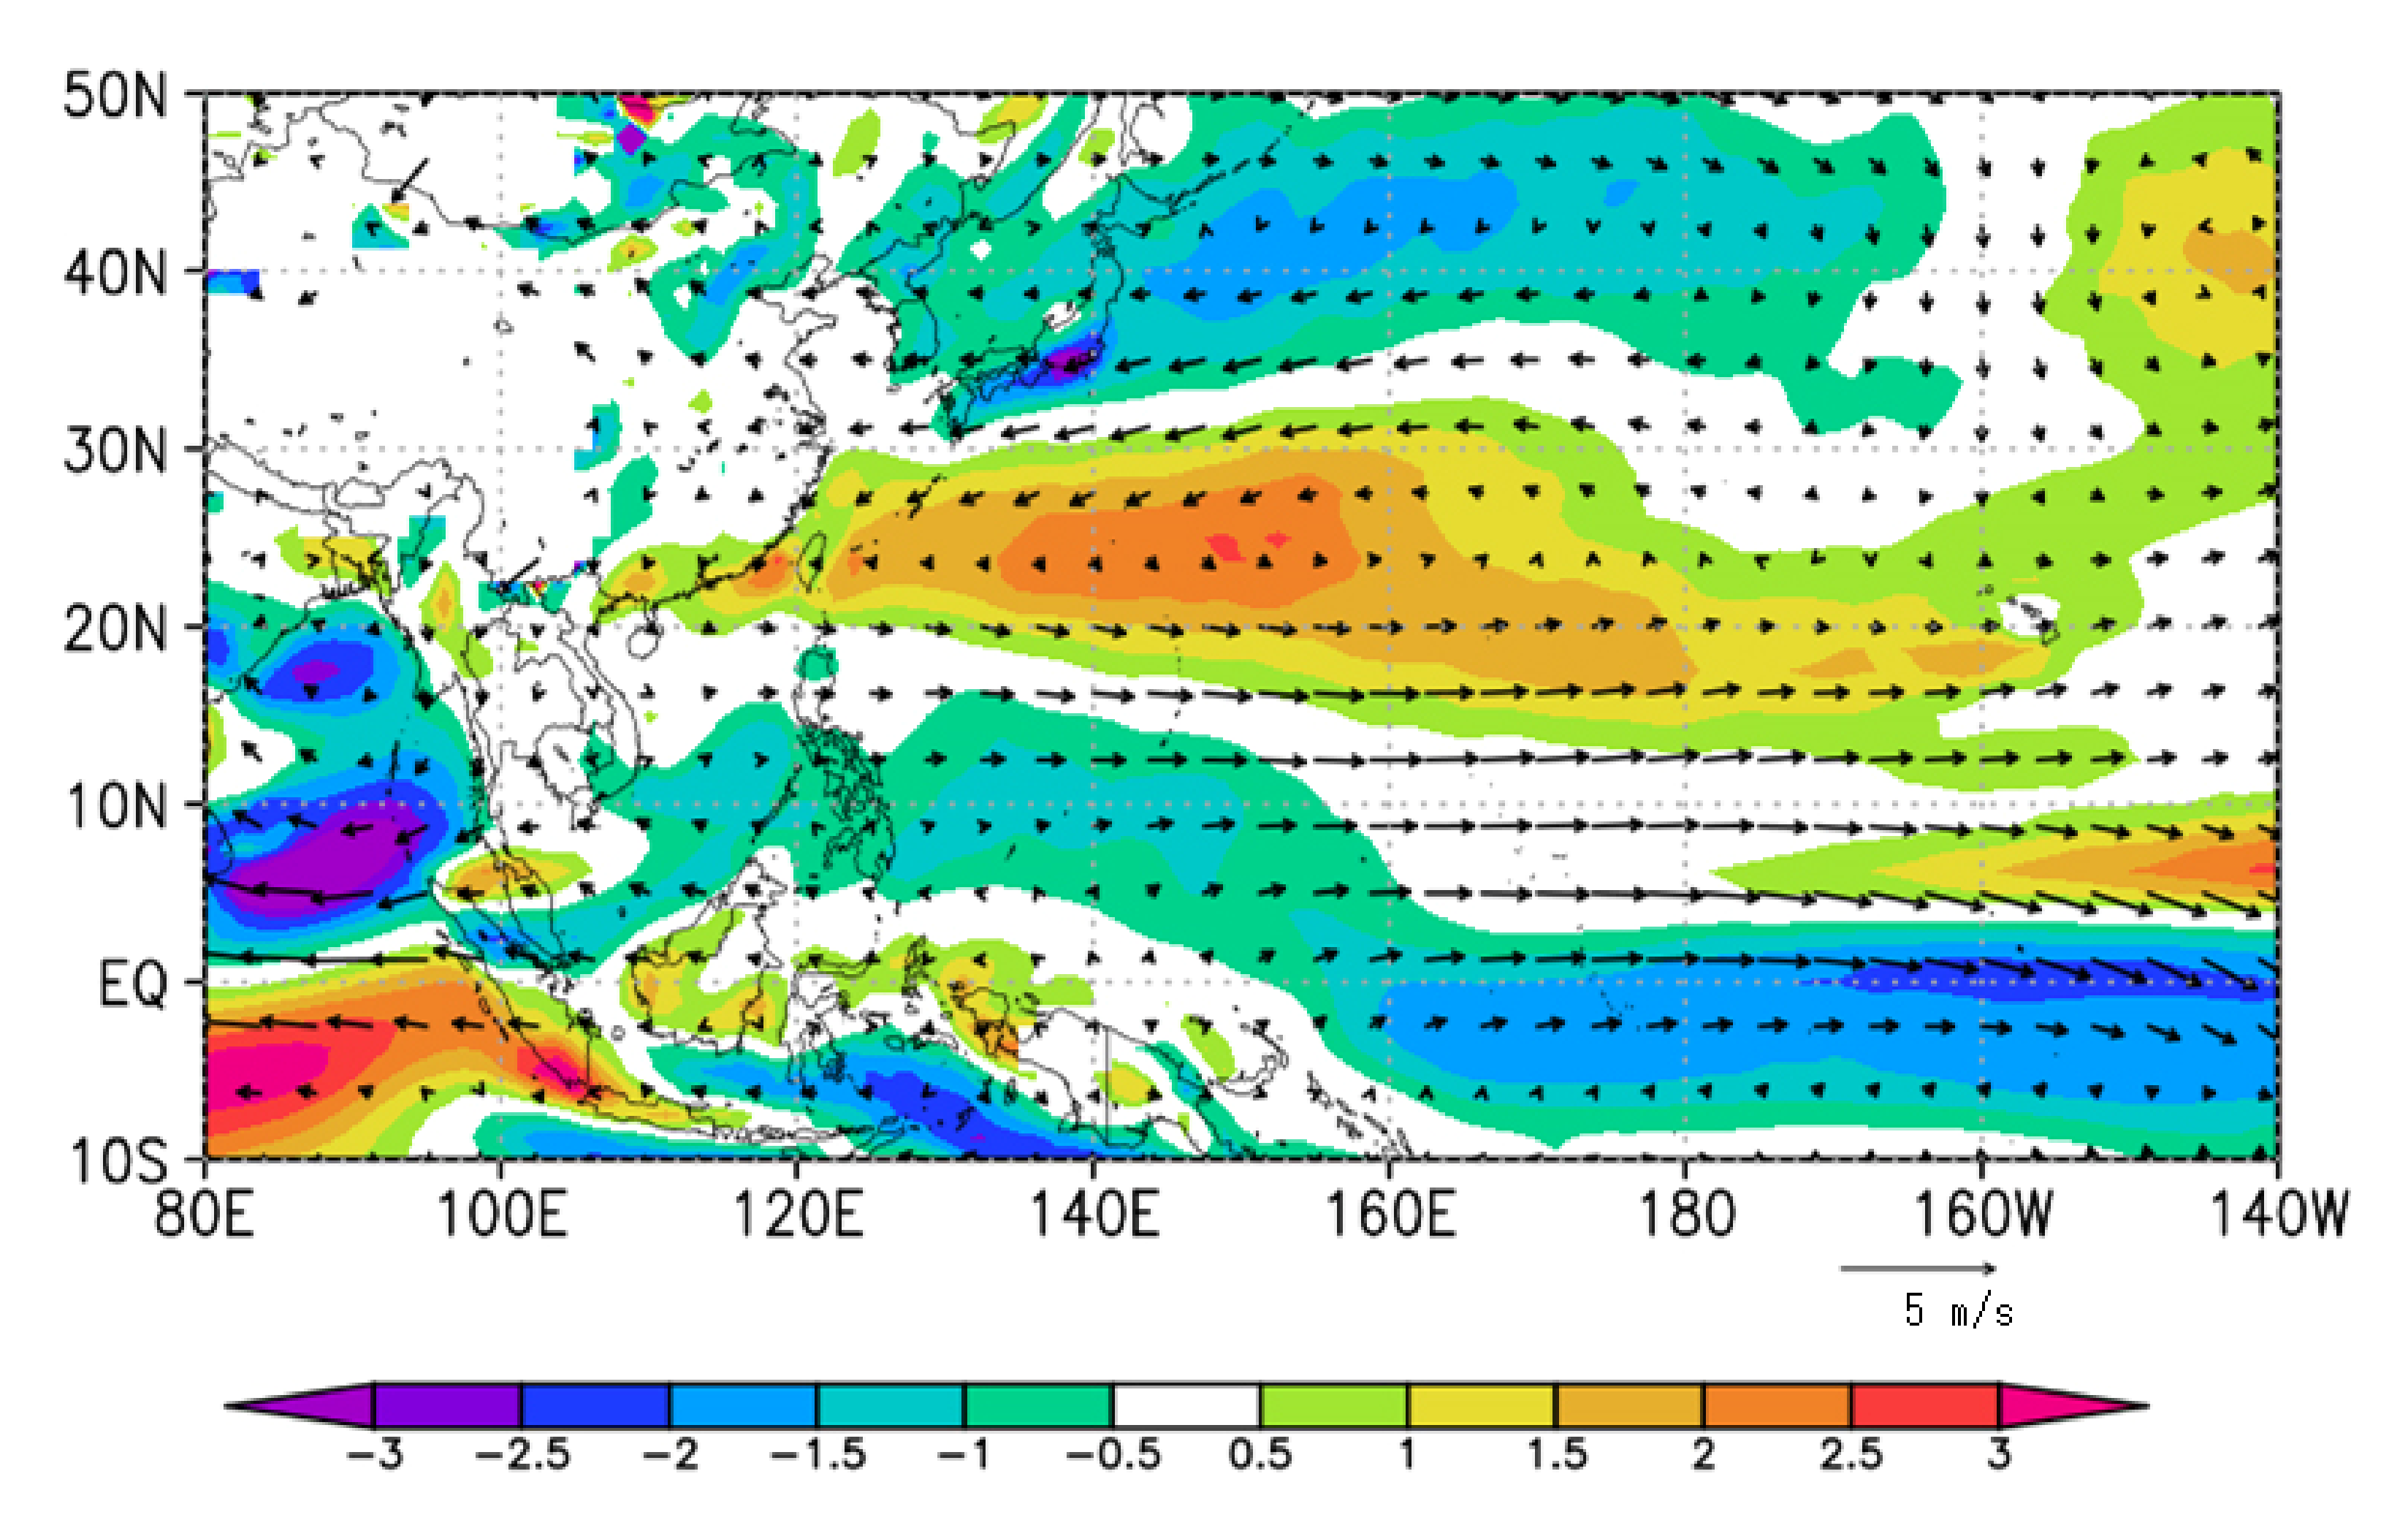
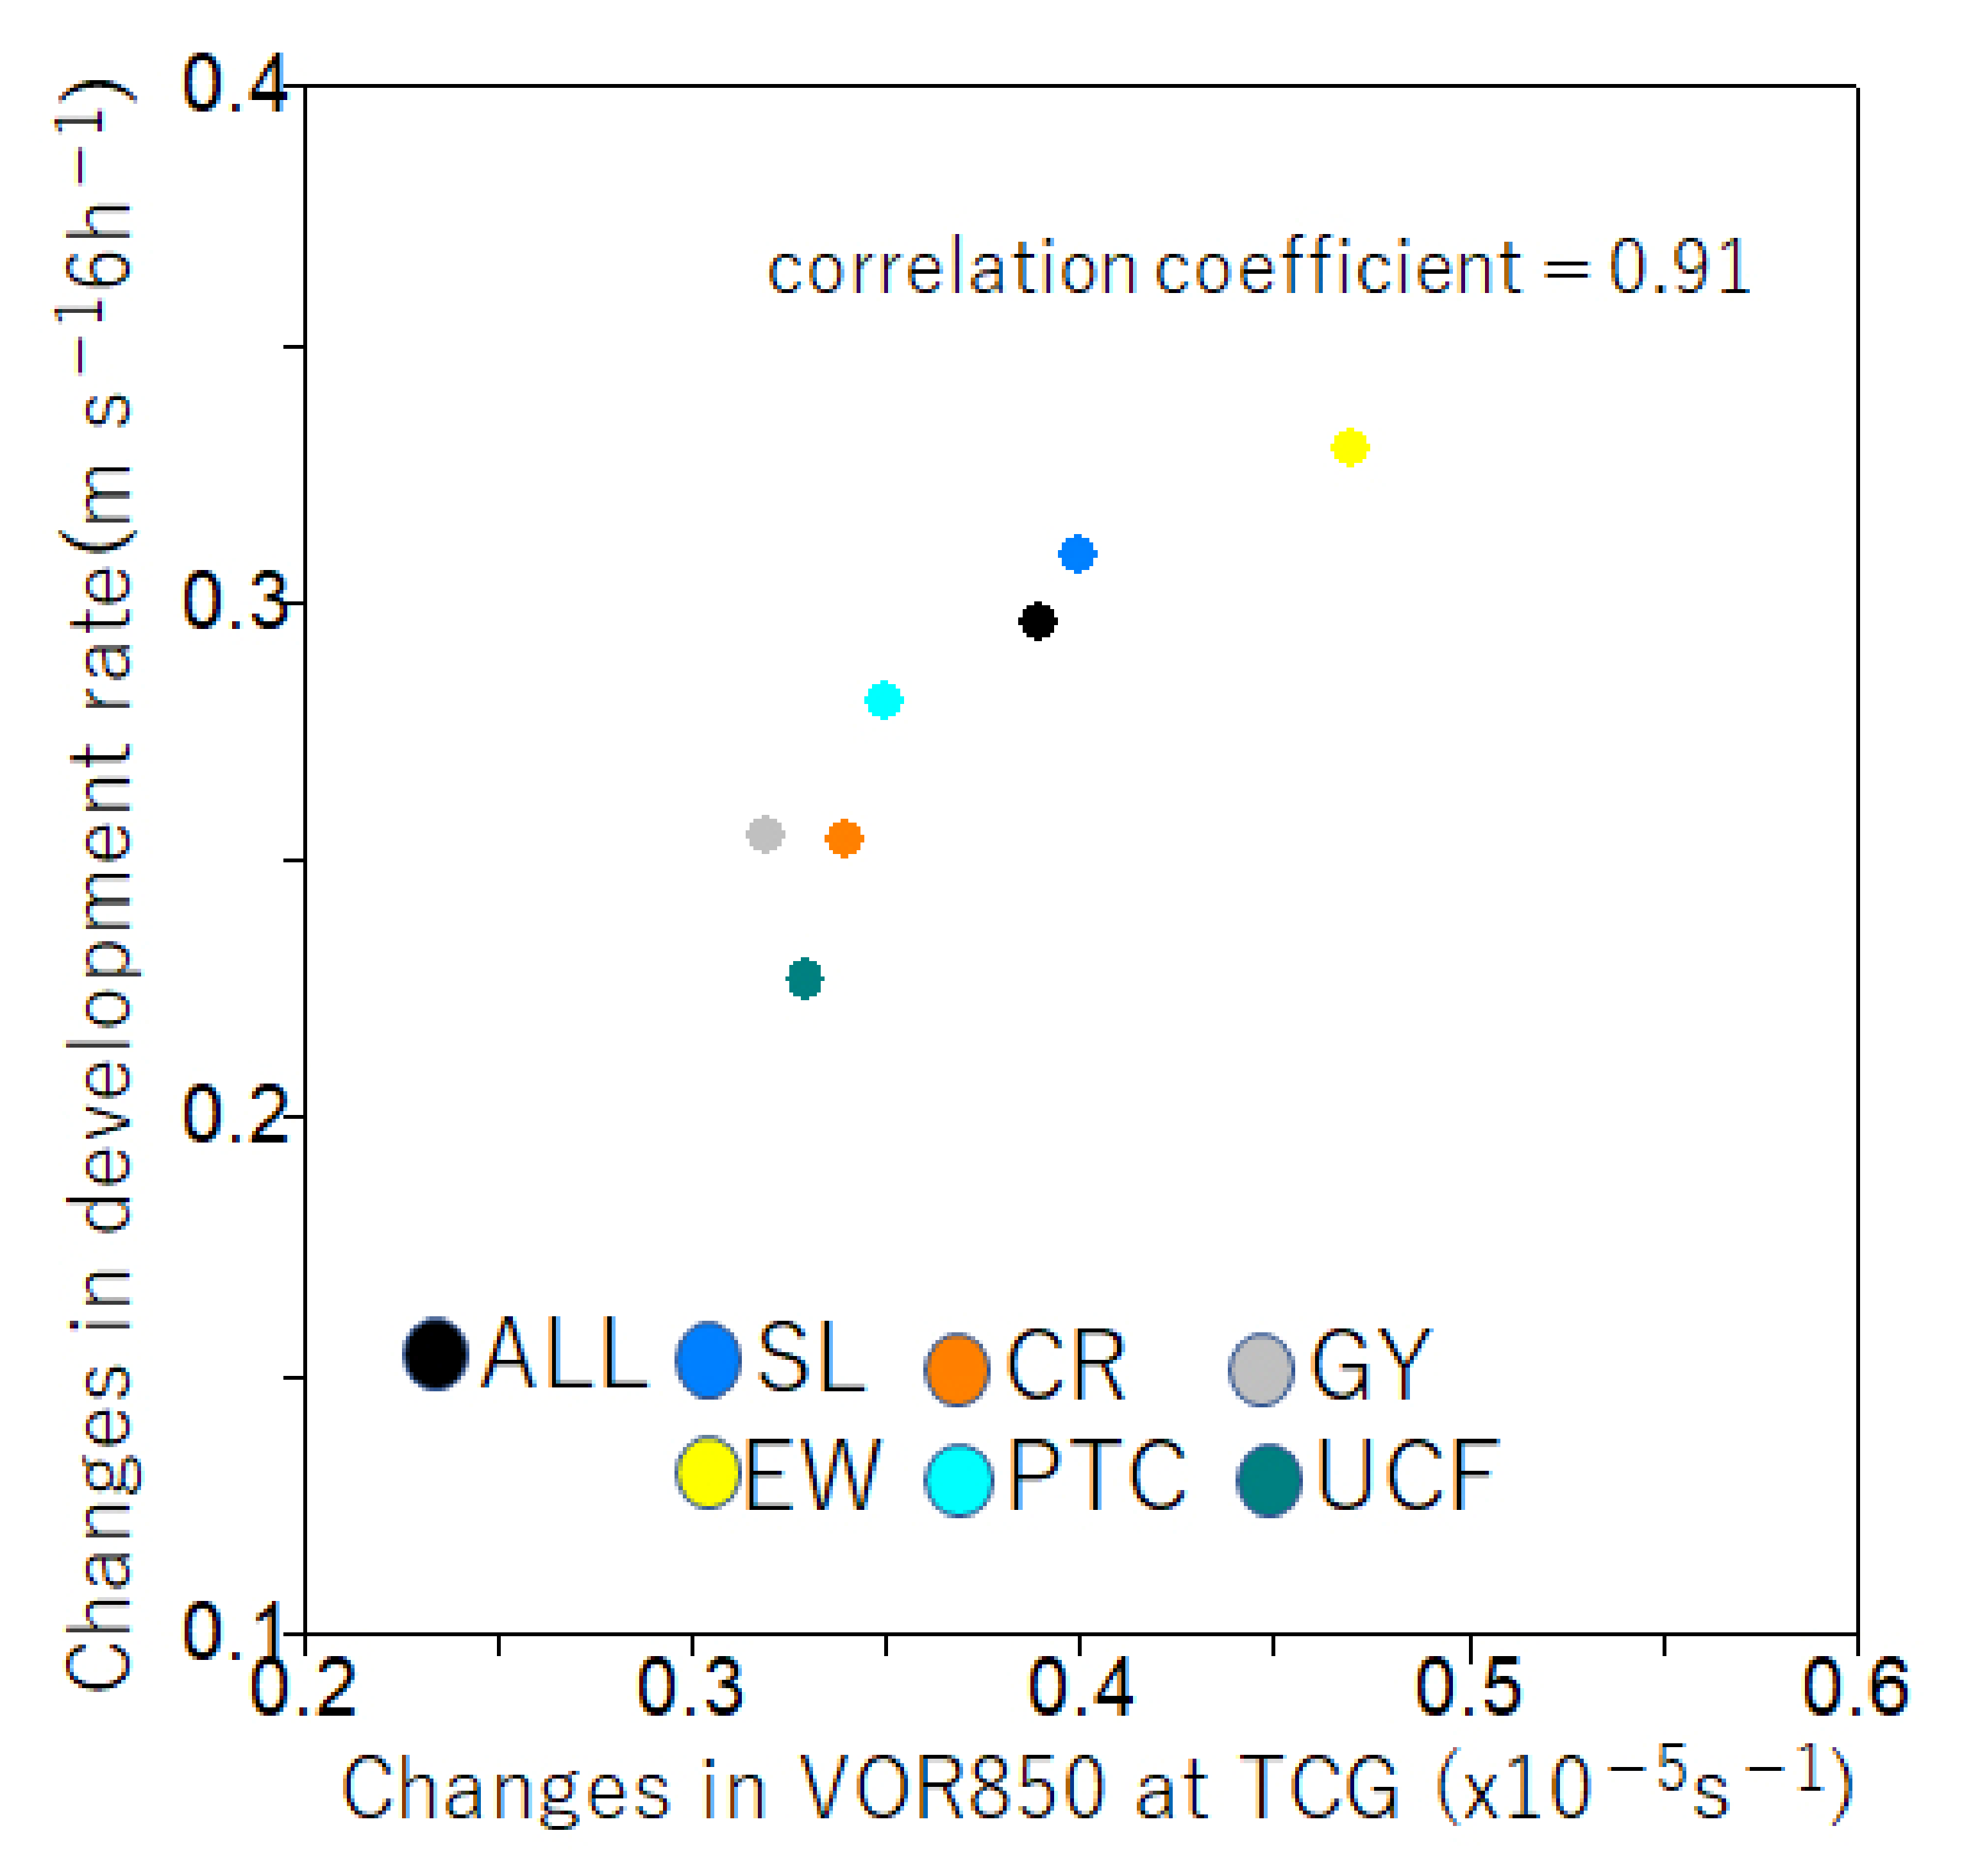
3.3. Future Changes in Environmental Physical Parameters

This study further analyzed the changes in SST and atmospheric parameters associated with TCs from June to November between current and future climate simulations. The average TC characteristics at the both time of TCG and maturity under current and future simulated climate simulations are shown in Table 3 and Table 4, respectively. Future SST averages for all TCs and each TCG factor were about 3.0 K higher than those in the current climate simulations at both the time of TCG and maturity.
The atmospheric parameters SHR, HMD, and VOR850 were also significantly higher for all TCs in the future climate simulations than in the current climate simulations (p < 0.01). Figure 6 shows the differences between current and future climate simulations for the 850-hPa horizontal winds at the time of TCG in summer and autumn. A trend of anomalous westerlies appeared in an area from 10–20 °N of the central Pacific, which enhances cyclonic circulation anomalies over the northeastern part of the WNP in the future climate simulation. The cyclonic circulation anomalies were favorable for TCG in this region, resulting in the northeast shift of the average TCG locations in the future climate simulation.
The average SSTs near CR-TCs (GY-TCs, EW-TCs, PTC-TCs, and UCF-TCs) at the TCG time were higher (lower) than those near TCs associated with other factors in the current climate simulations. At mature time, the average SSTs near EW-TCs and PTC-TCs were lower than those near TCs associated with the other factors. Characteristics of SSTs among the TCG factors in the future climate simulations were similar to those in the current climate simulations.
In the current climate simulations, the average SHR near SL-TCs (EW-TCs) was higher (lower) at the TCG time, whereas the SHR near SL-TCs (GY-TCs, EW-TCs, and UCF-TCs) was higher (lower) at the mature time. In the future climate simulations, the average SHR around PTC-TCs and UCF-TCs (CR-TCs and EW-TCs) was higher (lower) at the TCG time, whereas that around SL-TCs and PTC-TCs (CR-TCs, GY-TCs, and UCF-TCs) was higher (lower) at mature time.
At both time of TCG and maturity in the current climate simulations, average HMD was higher around SL-TCs, CR-TCs, and GY-TCs, due to the Asian monsoon. In contrast, drier conditions were observed around EW-TCs, PTC-TCs, and UCF-TCs. Characteristics of the average HMD among the TCG factors in the future climate simulations were similar to those in the current climate simulations.
At both time of TCG and maturity in the current climate simulations, the average VOR850 was higher near SL-TCs and PTC-TCs, and lower near GY-TCs, EW-TCs, and UCF-TCs (p < 0.01). Characteristics of the VOR850 among the TCG factors in the future climate simulations were similar to those in the current climate simulations. Differences in the averages of physical environmental parameters for the different TCG factors between current and future climate simulations are shown in Table 4. Interestingly, changes in VOR850 of each factor were similar to changes in development rate at the TCG time (Table 2). Figure 7 shows the relationship between future changes in VOR850 and development rate stratified by TCG factors. The increases in the average development rate were correlated with the increases in VOR850 (correlation coefficient = 0.91). Thus, higher average development rate of future EW-TCs than those of other factors was also caused by this highest increase in VOR850 around EW-TCs, supported by higher SSTs and wetter conditions under the future climate simulations.

4. Discussion

This study evaluated the differences in average TC characteristics over the WNP between current and future climate simulations. The average TCG locations were farther to the east and to the north in the future climate simulations than in the current climate simulations. Murakami et al. [33] and Yokoi et al. [34] showed an eastward shift in the positions of northward-recurving TC tracks and TCG location over the WNP under future climate. They discussed that the eastward shift was caused by changes in dynamical environmental conditions such as lower-tropospheric relative vorticity, directly resulted from the eastward extension of the monsoon trough. By using simulations from CMIP5, Wang and Wu [35] showed the monsoon trough over the WNP was intensify and extend eastward in the warming scenarios. We have extended their work to examine the contributions of an eastward shift in the TCG location stratified by the environmental factors that influenced TCG. In the future climate simulations, the average TCG locations of SL-TCs, CR-TCs, and GY-TCs, which are related to Asian monsoon, were farther east than those of other factors. Yokoi and Takayabu [26] examined the global warming impact on TCG over the WNP projected by five models that participate in Phase 3 of the Coupled Model Intercomparison Project (CMIP3). All of the five models projected an increasing trend of the TCG frequency over the central North Pacific. They concluded that the increasing trend over the central North Pacific resulted from changes of SST and large-scale circulation field over the central North Pacific that exhibit an El Niño-like pattern. The El Niño-like pattern was characterized by the relative vorticity in the lower troposphere over the central North Pacific that became more favorable for TCG. Their finding was consistent with the results of this study. We found that the average LMI (Figure 5) and TC development rate (Table 2) in the future climate simulations were significantly higher for EW-TCs, mainly occurred over the central North Pacific. In the future climate, the higher development rate of EW-TCs than those of other factors was caused by SST and enhanced cyclonic circulation anomalies (Figure 6) around TCG region of EW-TCs.
The large-scale flow pattern over the WNP changed in the future climate simulations (Figure 6), consistent with previous studies [36,37]. However, the contributions of TCG stratified by environmental factors did not so much change in the future climate simulations. Since the contributions of TCG environment associated with Asian monsoon for the TCG frequency over the WNP, namely SL and CR, were large (Figure 1), the future change of TCG frequency depends on that of monsoon activity. On the other hand, the increases in average LMI projected for all future TCs over the WNP, consistent with several previous studies, were caused by large contributions from the average LMI of future EW-TCs. Our results suggest that the frequency of EW-TCs in the warming scenarios is important for TC projection research.

5. Conclusions

This study investigated future changes in the frequency of TCG and TC characteristics in summer and autumn over the WNP, stratified by TCG environmental factors classified by Ritchie and Holland [7], using the d4PDF large-scale ensemble dataset and the TGS method. The TCG factors explained the environmental conditions of TCG under the future climate simulations, as well as under current climate simulations. Among summer and autumn TCs, SL-TCs (54.4% of all TCs) were about 3.8% more frequent in the future climate simulations than in the current climate simulations, whereas CR-TCs (15.0%) were about 4.4% less frequent and the frequency of EW-TCs (11.9%) and PTC-TCs (7.3%) changed by <1%, respectively. The frequencies of GY-TCs (7.6%) and UCF-TCs (3.7%) were unchanged between the climate simulations.
The statistical characteristics of TCs stratified by TCG factors were similar between the current and future climate simulations, except that average LMI of EW-TCs was significantly higher than those of other TCG factors in the future climate simulations, due to the higher development rate, higher SSTs, higher VOR850, and wetter conditions associated with EW in the future climate simulations. Together, these results suggest that the high increases in average LMI projected for all future TCs over the WNP in several previous studies are due to the relatively high contribution of EW-TCs. Our elucidation of future trends in EW-TCs will be important for disaster prevention under climate change.

Author Contributions

Conceptualization, H.F.; methodology, H.F., K.Y., and R.Y.; formal analysis, H.F.; writing—original draft preparation, H.F.; writing—review and editing, H.F., K.Y., and R.Y. All authors have read and agreed to the published version of the manuscript.

Funding

This research was funded by Ministry of Education, Culture, Sports, Science and Technology (MEXT), Japan, KAKENHI Grants JP19H05696, and partly supported by KAKENHI Grants JP19H00705 and the Integrated Research Program for Advancing Climate Models (TOUGOU) Grant JPMXD0717935498 from MEXT, Japan.

Acknowledgments

The authors are grateful to the editor and anonymous reviewers for their useful and critical comments. This study used d4PDF produced with the Earth Simulator jointly by science programs (SOUSEI, TOUGOU, SI-CAT, DIAS) of the Ministry of Education, Culture, Sports, Science, and Technology (MEXT), Japan. The d4PDF data set is available from the DIAS website (https://www.diasjp.net/en/). This work is supported by MEXT KAKENHI Grants 17H02956, 17K14398, JP19H05696 and TOUGOU program.

Conflicts of Interest

The authors declare no conflict of interest.

References

  1. Yoshida, K.; Sugi, M.; Mizuta, R.; Murakami, H.; Ishii, M. Future Changes in Tropical Cyclone Activity in High-Resolution Large-Ensemble Simulations. Geophys. Res. Lett. 2017, 44, 9910–9917. [Google Scholar] [CrossRef]
  2. Knutson, T.; Camargo, S.J.; Chan, J.C.L.; Emanuel, K.; Chang-Hoi, H.; Kossin, J.; Mohapatra, M.; Satoh, M.; Sugi, M.; Walsh, K.; et al. Tropical Cyclones and Climate Change Assessment: Part II: Projected Response to Anthropogenic Warming. Bull. Am. Meteor. Soc. 2020, 101, E303–E322. [Google Scholar] [CrossRef]
  3. Roberts, M.J.; Vidale, P.L.; Mizielinski, M.S.; Demory, M.-E.; Schiemann, R.; Strachan, J.; Hodges, K.; Bell, R.; Camp, J. Tropical Cyclones in the UPSCALE Ensemble of High-Resolution Global Climate Models. J. Clim. 2015, 28, 574–596. [Google Scholar] [CrossRef]
  4. Knutson, T.R.; Sirutis, J.J.; Zhao, M.; Tuleya, R.E.; Bender, M.; Vecchi, G.A.; Villarini, G.; Chavas, D. Global Projections of Intense Tropical Cyclone Activity for the Late Twenty-First Century from Dynamical Downscaling of CMIP5/RCP4.5 Scenarios. J. Clim. 2015, 28, 7203–7224. [Google Scholar] [CrossRef] [Green Version]
  5. Bhatia, K.; Vecchi, G.; Murakami, H.; Underwood, S.; Kossin, J. Projected Response of Tropical Cyclone Intensity and Intensification in a Global Climate Model. J. Clim. 2018, 31, 8281–8303. [Google Scholar] [CrossRef]
  6. Zhang, L.; Karnauskas, K.B.; Donnelly, J.P.; Emanuel, K. Response of the North Pacific Tropical Cyclone Climatology to Global Warming: Application of Dynamical Downscaling to CMIP5 Models. J. Clim. 2017, 30, 1233–1243. [Google Scholar] [CrossRef]
  7. Ritchie, E.A.; Holland, G.J. Large-scale patterns associated with tropical cyclogenesis in the western Pacific. Mon. Weather Rev. 1999, 127, 2027–2043. [Google Scholar] [CrossRef]
  8. Lander, M.A. Description of a monsoon gyre and its effects on the tropical cyclones in the western North Pacific during August 1991. Weather Forecast. 1994, 9, 640–654. [Google Scholar] [CrossRef]
  9. Chen, S.S.; Houze, R.A., Jr.; Mapes, B.E. Multiscale variability of deep convection in relation to large-scale circulation in TOGA COARE. J. Atmos. Sci. 1996, 53, 1380–1409. [Google Scholar] [CrossRef] [Green Version]
  10. Heta, Y. An analysis of tropical wind fields in relation to typhoon formation over the western Pacific. J. Meteor. Soc. Jpn. 1990, 68, 65–77. [Google Scholar] [CrossRef] [Green Version]
  11. Heta, Y. The origin of tropical disturbances in the equatorial Pacific. J. Meteorol. Soc. Jpn. 1991, 69, 337–351. [Google Scholar] [CrossRef] [Green Version]
  12. McDonald, N.R. The decay of cyclonic eddies by Rossby wave radiation. J. Fluid Mech. 1998, 361, 237–252. [Google Scholar] [CrossRef] [Green Version]
  13. Li, T.; Fu, B. Tropical cyclogenesis associated with Rossby wave energy dispersion of a preexisting typhoon. Part I: Satellite data analyses. J. Atmos. Sci. 2006, 63, 1377–1389. [Google Scholar] [CrossRef] [Green Version]
  14. Li, T.; Ge, X.; Wang, B.; Zhu, Y. Tropical cyclogenesis associated with Rossby wave energy dispersion of a preexisting typhoon. Part II: Numerical simulations. J. Atmos. Sci. 2006, 63, 1390–1409. [Google Scholar] [CrossRef]
  15. Yoshida, R.; Ishikawa, H. Environmental factors contributing to tropical cyclone genesis over the Western north Pacific. Mon. Weather Rev. 2013, 141, 451–467. [Google Scholar] [CrossRef]
  16. Onogi, K. The JRA-25 Reanalysis. J. Meteorol. Soc. Jpn. 2007, 85, 369–432. [Google Scholar] [CrossRef] [Green Version]
  17. Fudeyasu, H.; Yoshida, R. Western North Pacific Tropical Cyclone Characteristics Stratified by Genesis Environment. Mon. Weather Rev. 2018, 146, 435–446. [Google Scholar] [CrossRef]
  18. Yamada, Y.; Oouchi, K.; Satoh, M.; Tomita, H.; Yanase, W. Projection of changes in tropical cyclone activity and cloud height due to greenhouse warming: Global cloud-system-resolving approach. Geophys. Res. Lett. 2010, 37. [Google Scholar] [CrossRef]
  19. Camargo, S.; Tippett, J.; Michael, K.; Sobel, A.; Vecchi, H.; Gabriel, A.; Zhao, M. Testing the performance of tropical cyclone genesis indices in future climates using the HiRAM model. J. Clim. 2014, 27, 9171–9196. [Google Scholar] [CrossRef]
  20. Mizuta, R.; Yoshimura, H.; Murakami, H.; Matsueda, M.; Endo, H.; Ose, T.; Makiguchi, M.; Hosaka, M.; Sugi, S.; Yukimoto, S.; et al. Climate simulations using MRI-AGCM3.2 with 20-km Grid. J. Meteorol. Soc. Jpn. 2012, 90A, 233–258. [Google Scholar] [CrossRef] [Green Version]
  21. Hirahara, S.; Ishii, M.; Fukuda, Y. Centennial-scale sea surface temperature analysis and its uncertainty. J. Clim. 2014, 27, 57–75. [Google Scholar] [CrossRef]
  22. Mizuta, R.; Murata, A.; Ishii, M.; Shiogama, H.; Hibino, K.; Mori, N.; Arakawa, O.; Imada, Y.; Yoshida, K.; Aoyagi, T.; et al. Over 5000 years of ensemble future climate simulations by 60 km global and 20 km regional atmospheric models. Bull. Amer. Meteorol. Soc. 2017, 98, 1383–1398. [Google Scholar] [CrossRef]
  23. Murakami, H.; Mizuta, R.; Shindo, E. Future changes in tropical cyclone activity projected by multi-physics and multi-SST ensemble experiments using the 60-km-mesh MRI-AGCM. Clim. Dyn. 2012, 39, 2569–2584. [Google Scholar] [CrossRef] [Green Version]
  24. Fudeyasu, H.; Yoshida, R. Statistical Analysis of the Relationship between Upper Tropospheric Cold Lows and Tropical Cyclone Genesis over the Western North Pacific. J. Meteorol. Soc. Jpn. 2019, 97, 439–451. [Google Scholar] [CrossRef]
  25. Knapp, K.R.; Kruk, M.C.; Levinson, D.H.; Diamond, H.J.; Neumann, C.J. The International Best Track Archive for Climate Stewardship (IBTrACS). Bull. Am. Meteorol. Soc. 2010, 91, 363–376. [Google Scholar] [CrossRef]
  26. Yokoi, S.; Takayabu, Y.N. Multi-model projection of global warming impact on tropical cyclone genesis frequency over the Western North Pacific. J. Meteorol. Soc. Jpn. 2009, 87, 525–538. [Google Scholar] [CrossRef] [Green Version]
  27. Sugi, M.; Yamada, Y.; Yoshida, K.; Mizuta, R.; Nakano, M.; Kodama, C.; Satoh, M. Future changes in the global frequency of tropical cyclones seeds. SOLA 2020, 16, 70–74. [Google Scholar] [CrossRef] [Green Version]
  28. Khairoutdinov, M.F.; Emanuel, K. Rotating radiative-convective equilibrium sismulated by a cloud-resolving model. J. Adv. Model. Earth Sys. 2013, 5, 816–825. [Google Scholar] [CrossRef] [Green Version]
  29. Kim, H.-S.; Vecchi, G.A.; Knutson, T.R.; Anderson, W.G.; Delworth, T.L.; Rosati, A.; Zeng, F.; Zhao, M. 2014: Tropical cyclone simulation and response to CO2 doubling in the GFDL CM2.5 high-resolution coupled climate model. J. Clim. 2014, 27, 8034–8054. [Google Scholar] [CrossRef]
  30. Yamada, Y.; Satoh, M.; Sugi, M.; Kodama, C.; Noda, A.T.; Nakano, M.; Nasuno, T. Response of tropical cyclone activity and structure to global warming in a high-resolution global nonhydrostatic model. J. Clim. 2017, 30, 9703–9724. [Google Scholar] [CrossRef]
  31. Gutmann, E.D.; Rasmussen, R.M.; Liu, C.; Ikeda, K.; Bruyere, C.L.; Done, J.; Garre, L.; Friis-Hansen, P.; Veldore, V. Changes in hurricanes from a 13-yr convection-permitting pseudo-global warming simulation. J. Clim. 2018, 31, 3643–3657. [Google Scholar] [CrossRef]
  32. Yamaguchi, M.; Chan, J.C.; Yoshida, K.; Mizuta, R. Global warming changes tropical cyclone translation speed. Nat. Commun. 2020, 11, 1–7. [Google Scholar] [CrossRef] [PubMed] [Green Version]
  33. Murakami, H.; Wang, B.; Kitoh, A. Future change of western North Pacific typhoons: Projections by a 20-km-mesh global atmospheric model. J. Clim. 2011, 24, 1154–1169. [Google Scholar] [CrossRef] [Green Version]
  34. Yokoi, S.; Takahashi, C.; Yasunaga, K.; Shirooka, R. Multi-model projection of tropical cyclone genesis frequency over the Western North Pacific: CMIP5 results. SOLA 2012, 8, 137–140. [Google Scholar] [CrossRef] [Green Version]
  35. Wang, C.; Wu, L. Future changes of the monsoon trough: Sensitivity to sea surface temperature gradient and implications for tropical cyclone activity. Earth’s Future 2018, 6, 919–936. [Google Scholar] [CrossRef]
  36. Li, X.; Ting, M.; Li, C.; Henderson, N. Mechanisms of Asian Summer Monsoon Changes in Response to Anthropogenic Forcing in CMIP5 Models. J. Clim. 2015, 28, 4107–4125. [Google Scholar] [CrossRef]
  37. Zhang, L.; Li, T. Relative roles of anthropogenic aerosols and greenhouse gases in land and oceanic monsoon changes during past 156 years in CMIP5 models. Geophys. Res. Lett. 2016, 43, 5295–5301. [Google Scholar] [CrossRef]
Figure 1. Monthly annual number of tropical cyclones (TCs), stratified by five flow patterns and unclassified flow (UCF) for (a) current and (b) future climate simulations performed using the d4PDF dataset. SL, shear line; CR, confluence region; GY, monsoon gyre; EW, easterly wave; PTC, Rossby wave energy dispersion from a preexisting TC.
Oceans 01 00024 g001
Figure 2. Distribution of frequency of TC genesis (TCG) environments stratified by five TCG factors and UCF from June to November over the analysis period for (a) current and (b) future climate simulations performed using the d4PDF.
Oceans 01 00024 g002
Figure 3. Distribution rate of TCG location, expressed as percentage values of the total number of TCG for (a) current all TCs and (b) future all TCs into a 2.5° × 2.5° latitude-longitude grid box with respect to the total number of TCG for (a) current all TCs and (b) future all TCs formed in the WMP from June to November over the analysis period in current and future climate simulations performed using the d4PDF.
Oceans 01 00024 g003
Figure 4. Same as Figure 3, except distribution rate (percent) of TCG location for (a) current SL-TCs, (b) future SL-TCs, (c) current CR-TCs, (d) future CR-TCs, (e) current GY-TCs, (f) future GY-TCs, (g) current EW-TCs, (h) future EW-TCs, (i) current PTC-TCs, and (j) future PTC-TCs.
Oceans 01 00024 g004
Figure 5. Boxplots of TC lifetime maximum intensity (LMI) stratified by TCG factors and UCF from June to November over the analysis period in current and future climate simulations performed using the d4PDF dataset. For each factor, boxes on the left and right are derived from current and future climate simulations, respectively. Vertical bar indicates the full range of the distributions; box indicates the interquartile range of 25–75% of all cases; bold horizontal line indicates the median.
Oceans 01 00024 g005
Figure 6. Future changes in horizontal winds (m s−1 arrows, scale at bottom) and relative vorticity (×10−6 s−1 color) at 850 hPa at the time of TCG for TCs from June to November over the analysis period in current and future climate simulations performed using the d4PDF.
Oceans 01 00024 g006
Figure 7. Scatterplot of the relationship between changes in VOR850 and development rate between current and future climate simulations stratified by TCG factors.
Oceans 01 00024 g007
Table 1. Statistical summary of the tropical cyclone (TC) characteristics associated with TCG environmental factors from June to November over a 6000-year analysis period in current climate simulations using the d4PDF dataset. Significant differences are indicated in bold and italic fonts (Student’s t-test; p < 0.01). ALL, averaged for all TCs; SL, shear line; CR, confluence region; GY, monsoon gyre; EW, easterly wave; PTC, Rossby wave energy dispersion from a preexisting TC; UCF, unclassified flow.
ALLSLCRGYEWPTCUCF
Longitude at TCG time (°N)137.4135.2141.0132.9140.6141.4138.8
Latitude at TCG time (°E)16.616.617.216.317.713.517.6
TC size at TCG time (km)333.5343.2321.7349.2317.0262.1358.6
Development rate (m s−1 6 h−1)0.610.630.560.550.600.690.55
Movement speed (km h−1)16.015.416.614.717.517.615.6
Duration of development (day)3.13.23.32.93.03.32.8
LMI (m s−1)25.926.425.423.425.827.822.4
Table 2. Statistical summary of TC characteristics associated with TCG environmental factors from June to November over a 5600-year analysis period in future climate simulations using the d4PDF dataset. Significant differences are indicated in bold and italic fonts (Student’s t-test; p < 0.01); changes are shown below each parameter.
ALLSLCRGYEWPTCUCF
Longitude at TCG time (°N)138.5137.2141.8133.8140.0141.1144.0
+1.1+2.0+0.8+0.9−0.6−0.3+5.2
Latitude at TCG time (°E)18.118.018.917.919.215.319.3
+1.5+1.4+1.7+1.6+1.5+1.8+1.7
TC size at TCG time (km)352.2364.8332.7367.2330.7285.6371.8
+18.7+21.6+11.0+18.0+13.7+23.5+13.2
Development rate (m s−1 6 h−1)0.910.940.820.800.930.970.78
+0.30+0.31+0.26+0.25+0.33+0.28+0.23
Movement speed (km h−1)16.115.716.715.217.316.716.3
+0.1+0.3+0.1+0.5−0.2−0.9+0.7
Duration of development (day)2.62.72.72.42.52.82.3
−0.5−0.5−0.6−0.5−0.5−0.5−0.5
LMI (m s−1)29.129.827.626.330.130.624.6
+3.2+3.4+2.2+2.9+4.3+2.8+2.2
Table 3. Statistical summary of sea surface temperatures (SSTs) and atmospheric parameters near TCs associated with TCG environmental factors from June to November over the 6000-year analysis period in current climate simulations performed using the d4PDF dataset. Significant differences are indicated in bold and italic fonts (Student’s t-test; p < 0.01). SHR, difference in horizontal wind speed between 200 and 850 hPa; HMD, specific humidity at 500 hPa; VOR850, relative vorticity at 850 hPa.
ALLSLCRGYEWPTCUCF
SST at TCG time (K)301.9301.9302.1301.8301.8301.7301.8
SHR at TCG time (m s−1)13.513.713.513.513.313.513.6
HMD at TCG time (kg kg−1)4.144.184.254.173.864.044.09
VOR850 at TCG time (×10−5 s−1)2.712.832.562.602.492.862.45
SST at mature time (K)301.0301.0301.0301.1300.8300.7301.0
SHR at mature time (m s−1)17.918.117.917.217.618.017.1
HMD at mature time (kg kg−1)3.733.783.833.853.443.443.72
VOR850 at mature time (×10−5 s−1)3.343.433.403.142.993.473.05
Table 4. Statistical summary of SSTs and atmospheric parameters near TCs associated with TCG environmental factors from June to November over the 5600-year analysis period in future climate simulations performed using the d4PDF dataset. Significant differences are indicated in bold and italic fonts (Student’s t-test; p < 0.01); changes are shown below each parameter.
ALLSLCRGYEWPTCUCF
SST at TCG time (K)304.9304.9305.0304.8304.7304.8304.8
+3.0+3.0+2.9+3.0+2.9+3.0+3.0
SHR at TCG time (m s−1)14.114.213.714.213.914.414.4
+0.6+0.5+0.5+0.8+0.5+0.5+0.8
HMD at TCG time (kg kg−1)5.815.875.955.785.475.695.65
+1.66+1.69+1.70+1.62+1.61+1.66+1.56
VOR850 at TCG time (×10−5 s−1)3.103.232.902.922.963.212.78
+0.39+0.40+0.34+0.32+0.47+0.35+0.33
SST at mature time(K)304.0304.1304.0304.2303.9304.0304.1
+3.1+3.1+3.0+3.1+3.1+3.2+3.0
SHR at mature time (m s−1)18.118.317.917.718.218.417.3
+0.3+0.2+0.0+0.5+0.6+0.2+0.2
HMD at mature time (kg kg−1)5.275.365.455.344.864.895.31
+1.54+1.57+1.61+1.49+1.42+1.45+1.50
VOR850 at mature time (×10−5 s−1)3.763.893.733.483.473.843.28
+0.42+0.46+0.33+0.34+0.48+0.37+0.23
Publisher’s Note: MDPI stays neutral with regard to jurisdictional claims in published maps and institutional affiliations.

