
Simple Estimate of the Impact of M2 and Strehl Ratio on the Effective Focusable Spot Size


1
SCHWIND Eye-Tech-Solutions, 63801 Kleinostheim, Germany
2
Light Conversion, 10234 Vilnius, Lithuania
*
Author to whom correspondence should be addressed.
Optics 2024, 5(1), 56-65; https://0-doi-org.brum.beds.ac.uk/10.3390/opt5010004
Submission received: 14 December 2023
/
Revised: 17 January 2024
/
Accepted: 24 January 2024
/
Published: 29 January 2024
(This article belongs to the Special Issue Advanced Optical Imaging for Biomedicine)
Abstract
:A simple method (first-order approximation) to determine the impact of M2 and the Strehl Ratio on the effective focusable spot size avoiding complex propagations of the beam wavefront is proposed. The model is based upon previous models and the definition of M2 and the Strehl Ratio in a simple manner. This work provides qualitative and quantitative estimates for the interplay of M2 and the Strehl Ratio on the effectively focusable spot size.
1. Introduction
The spot size of a laser beam close to the focus is an important parameter for many laser applications [1]. The spot size depends on numerous factors, including, among others, the laser wavelength, the beam profile, the numerical aperture (NA) of the system, and, in general, the caustic of the beam (i.e., the propagation of the beam’s wavefront towards and close to the focus) [2].
Often, simple numerical values are provided as a compact expression of the complex effects of the beam’s wavefront close to the focus. Among them, M2 and the Strehl Ratio are commonly reported values for the beam quality and the optical quality of laser systems.
M2 is simply a heuristic parameter of the laser beam [3], whereas the Strehl Ratio (SR) is a metric of the point spread function (PSF) relative to the equivalent diffraction-limited PSF [4]. A thorough presentation of beam quality metrics can be found in a seminal work from 2006 [5].
M2 is a heuristic parameter of the laser beam related to the spot size in focus [6], whereas the SR is a measure of the quality of optical image formation, originally proposed by Karl Strehl [7]. The SR is frequently defined as the ratio of the peak aberrated image intensity from a point source compared to the maximum attainable intensity using an ideal optical system limited only by diffraction over the system’s aperture [8]. Usually, M2 values of 1.25 or below are considered excellent (and non-rigorously as “close to the diffraction-limit”) [9]. Similarly, optical systems with SR values of 0.8 or better are considered excellent (and non-rigorously as “close to the diffraction-limit”) [7].
It has been previously shown that M2 and the SR affect different laser–tissue interaction processes including laser-induced optical breakdown (LIOB) [10] and laser-induced refractive index change (LIRIC) [11].
In this work, a simple method (first order approximation) to determine the impact of M2 and the SR on the effective focusable spot size avoiding complex propagations of the beam wavefront is proposed. The model is based upon previous models and the definition of M2 and the SR in a simple manner. This work provides qualitative and quantitative estimates for the interplay of M2 and the SR on the effectively focusable spot size. The novelty of this work is providing analytical (yet simple) closed-form equations to account for M2 and the SR effects in photochemical and laser–tissue interaction models.
2. Materials and Methods
M2 has a value > 1, with a hypothetical, perfectly unaberrated beam having an M2 of 1. M2 is define as
where θ is the beam divergence, ω is the measured beam waist, and λ is the wavelength of light.
In other words,
where ωactual is the actual beam waist and ω0 is the theoretical minimum beam waist at focus under ideal conditions, and
where θactual is the actual beam divergence and θ0 is the theoretical minimum beam divergence under ideal conditions.
The SR has a value between 0 and 1, with a hypothetical, perfectly unaberrated optical system having a Strehl Ratio of 1.
Both M2 and the SR are thus related to a “redistribution” of the (constant) energy in a different (wider) region (the spread). For a super-Gaussian profile, the following equation applies for the intensity [12]:
where N is the super-Gaussian order of the beam profile (where N = 1 represents a simple Gaussian beam profile, and N = ∞ represents a flat-top beam profile), EPulse is the energy of the laser pulse, R0 is the spot size when the radiant exposure falls to 1/e2 its peak value, and Γ is the gamma function (the general factorial function for non-integer arguments).
In first-order approximation for not strongly aberrated beams, the intensity (related to the PSF and the SR) is approximately inversely proportional to the squared spot size (the waist at focus) (i.e., inversely proportional to the area of the spot).
From simple geometrical considerations, this relationship holds true also for any arbitrary shape other than super-Gaussian. We could scale the intensity by sz (affecting SR) and the radial distance of the spot by sx/y (along x-y-plane). To keep the volume constant (energy is redistributed) 1 = svol = sxsysz, we have to define the scaling factors as sz = 1/(sxsy). For a rotational symmetric scaling, sx = sy holds. Therefore, sz = 1/sr2.
In this work, the calculations have been made by “pen and paper”, and the figures have been simply generated using Microsoft Excel (Office 365, Redmond, WA, USA).
3. Results
3.1. Simple Estimate of the Impact of Strehl Ratio on the Effective Focusable Spot Size
From the methods (sz = 1/sr2) and from the explicit expression of the intensity for super-Gaussian beams, it follows that
i.e., in a first-order approximation, the SR (reduction in the peak PSF relative to the diffraction limited PSF) produces an increase in the spot size inversely proportional to the square root of the SR.
3.2. Quantitative Estimates
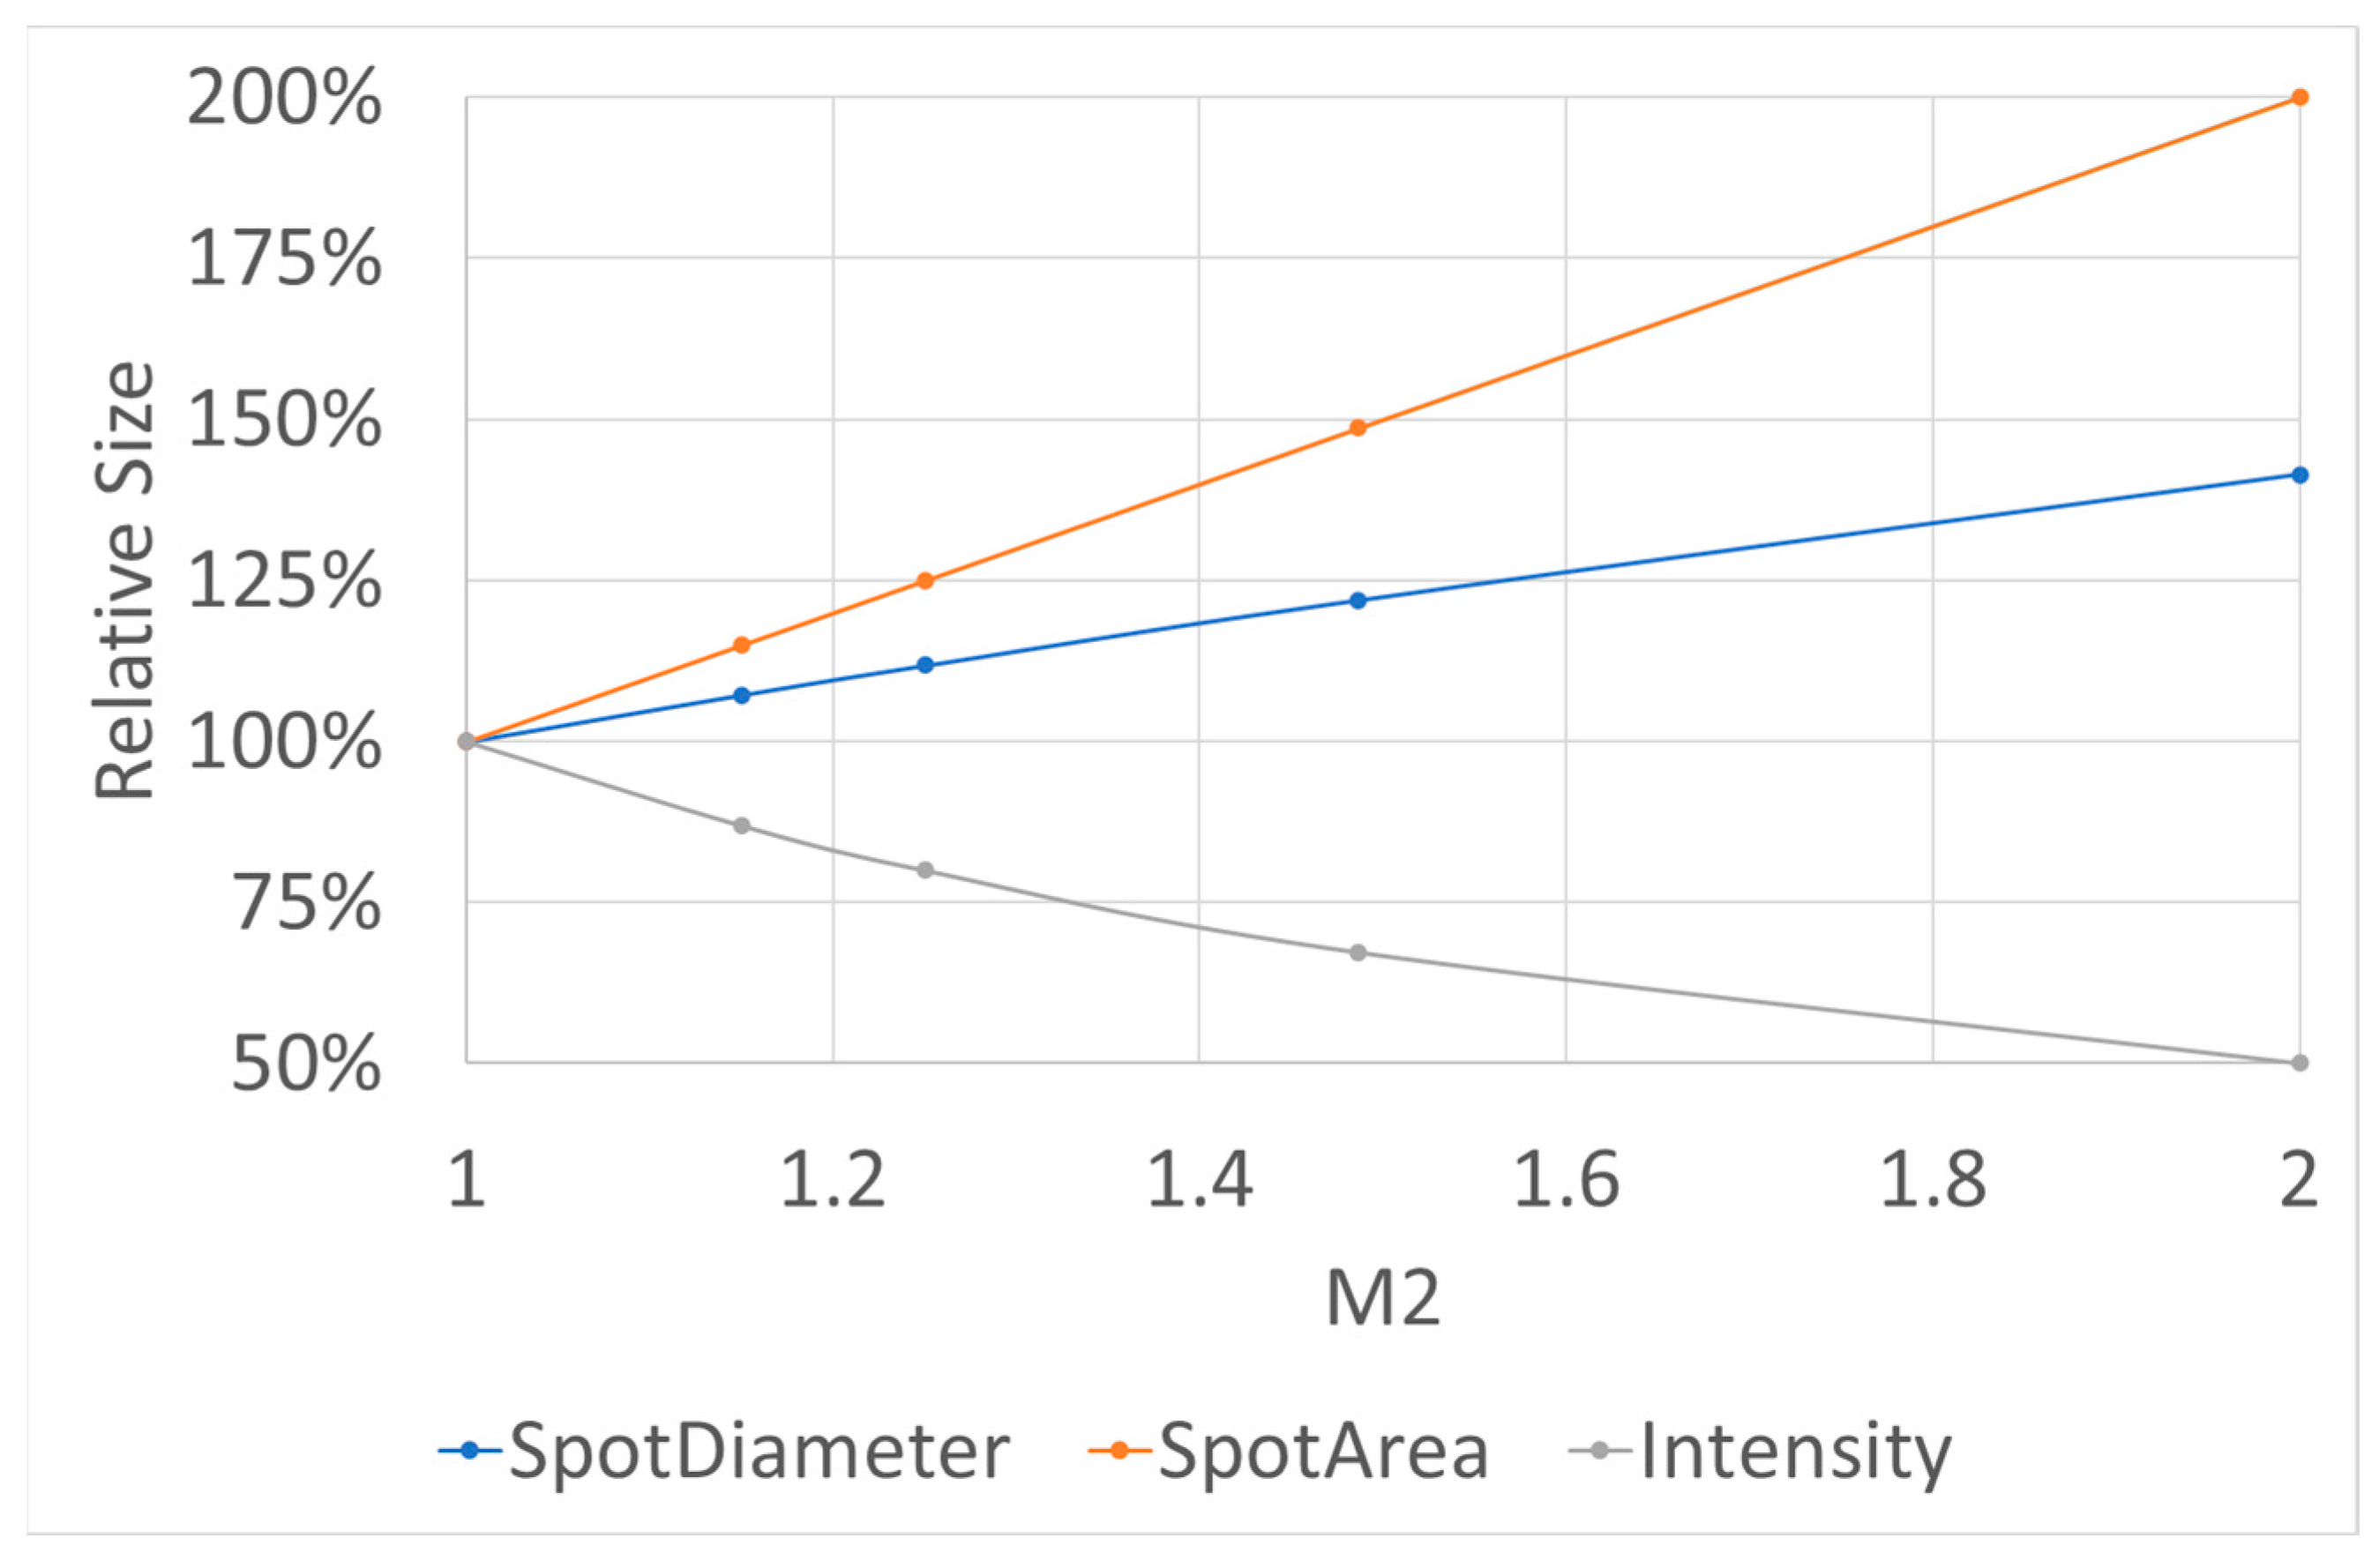
Usually, M2 values of 1.25 or below are considered excellent (and non-rigorously as “close to the diffraction-limit”) [9]. According to the results presented above, the M2 of 1.25 would increase the spot diameter by +12% (1.12×); the spot area by +25% (1.25×); and reduce the PSF intensity by −20% (0.80×). Figure 1 presents the simple estimate of the impact of M2 on the effective focusable spot size.
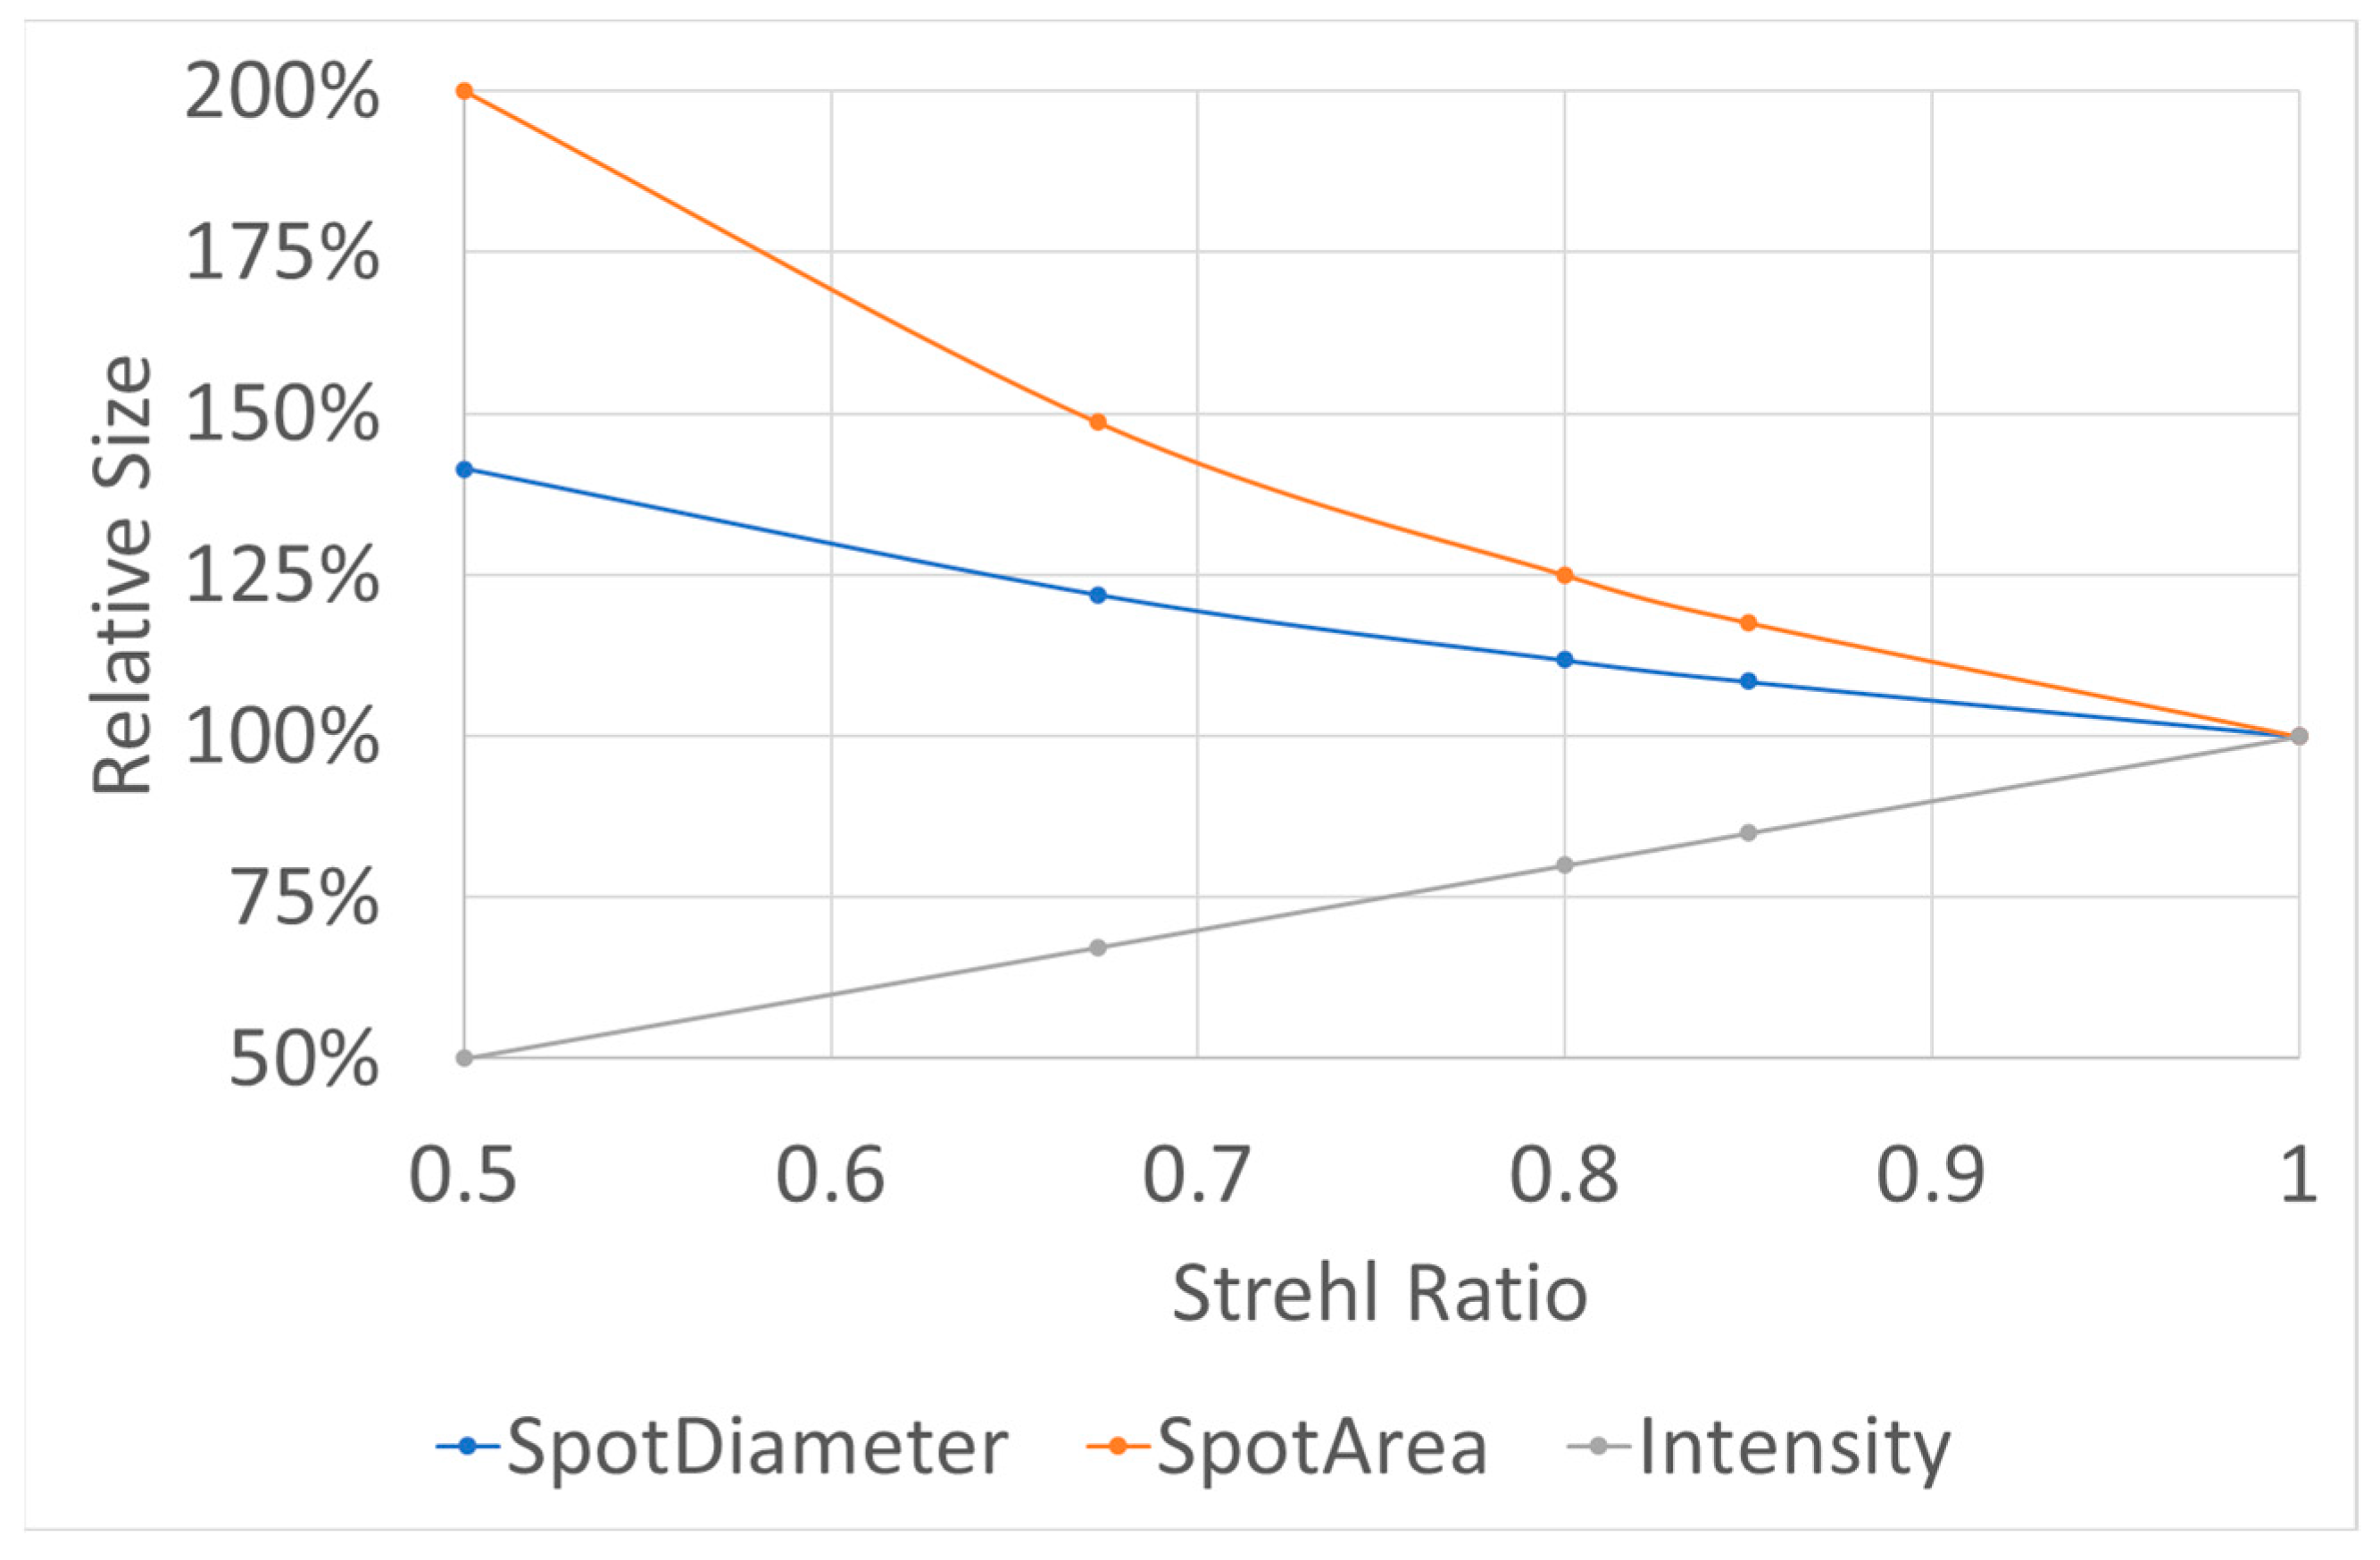
Similarly, optical systems with SR values of 0.8 or better are considered excellent (and non-rigorously as “close to the diffraction-limit”) [7]. According to the results presented above, an SR of 0.8 would increase spot diameter by +12% (1.12×); the spot area by +25% (1.25×); and reduce the PSF intensity by −20% (0.80×). Figure 2 presents the simple estimate of the impact of Strehl Ratio on the effective focusable spot size.
This suggests “equivalence” for both metric values considered excellent, since the focusability impact of an M2 of 1.25 approaches that of an SR of 0.8.
Combining a laser with M2 values of 1.25 or below into an optical system with SR values of 0.8 or better is considered excellent (and non-rigorously as “close to the diffraction-limit”). According to the results presented above, an M2 of 1.25 combined with an SR of the optical train of 0.8 would increase the spot diameter by +25% (1.25×); the spot area by +56% (1.56×); and reduce the PSF intensity by −36% (0.64×).
In a more typical engineering situation, combining a laser with M2 values of 1.15 into an optical system with SR values of 0.85 would increase the spot diameter by +16% (1.16×); the spot area by +35% (1.35×); and reduce the PSF intensity by −26% (0.74×).
4. Discussion
In this simple work, we have provided some useful explorations of the effects of M2 and SR on intensity. The laser intensity (close to the focus) is the driving force for many laser–tissue interaction processes including laser-induced optical breakdown (LIOB) [10] and laser-induced refractive index change (LIRIC) [11].
In a sense, this model provides an analogy between M2, SR, and NA, since, ultimately, (for the same pulse energy) all three affect both the spot size and laser intensity. A priori, a relationship between M2, SR, and NA does not seem intuitive. M2 is simply a property of the laser beam, and the NA of the focusing lens is determined by the lens and input beam size. The M2 of the laser beam affects its divergence and would affect the size of the beam going into the focusing lens; the effects may be evaluated by a full aberrated Gaussian beam analysis instead of simplified to a single-value M2 property.
For some cases, M2 may be “high” despite good focusing properties. A clear example would be a uniform beam (top-hat or flat-top) [13]. An exact top-hat has an angular intensity distribution that follows a sinc-squared function and thus has a Δθ that diverges and is not well defined. It has been theoretically found that M2 = N√(Γ(3/N)Γ(2 − 1/N))/Γ(1/N) ≈ √(N/3), where the approximation is valid for a large N. A smooth top-hat can be approximated for a super-Gaussian order N > 10, leading to a theoretical M2 > 2. This may well represent a sort of soft limit for the application of this simple model.
The effects of M2 are subtle and not easily accounted for with precision, but the general idea at least captures (perhaps only to first order) the effects of imperfect beams. Therefore, to simplify things, the case of diffraction-limited beams (i.e., removing M2 and the SR from all the equations) is generally considered. Most of the literature on laser–tissue interaction processes assumes an ideal scenario for both parameters (M2 = 1; SR = 1). This clearly overestimates the laser intensity in focus, and is then re-normalized to empirical values using different sorts of gain factors [14]. From an engineering point of view, a “realistic ideal”/“proper optimum” would be more in the range of M2 < 1.25 (~1.15); SR > 0.8 (~0.85). As shown in the results, this means a spot size +16% larger than ideal, a spot area +35% larger than ideal, and an intensity in the focus only 74% from ideal.
Interestingly, in the proposed model, the isolated effects derived from both “close to diffraction-limited” values (M2 < 1.25 and SR > 0.8) are equivalent to one another (although, rigorously, this is strongly dependent on the mix of modes included in the laser beam).
The M2, SR vs. NA analogy is based on the idea that the effects depend on the number of photons combined in the material in space and time [15]. The beam waist in the focus is proportional to M and inversely proportional to the NA. This is the reason why the parameters are considered in the same manner. It may be (and it is likely) that the provided equations are oversimplified, and the cross effects of M2 and the SR are much more complex.
Importantly, it is debatable whether the SR and M2 (both related to the focusing abilities) shall be combined, since it is likely that the SR may already include the effect of M2 (and vice versa). A second limitation is the use of a first-order approximation. The presented approximation is consistent with Gaussian beam propagation (of “quasi-perfect” beams) [16]. M2 and the SR are both convenient single-figure parameters to represent generic aberrated beam propagation and focusing. However, the actual PSF in general may not preserve the shape (in a xyz scaled version) of the diffraction-limited PSF. It may be that the assumption 1/√SR is actually “punishing” the spot size too little.
Yet, there are other approximations in optical aberrations theory which provide a reasonable estimate of the SR based simply on the root mean square (RMS) of the beam aberrations, regardless of the specific waveform of the aberration [8]. These approximations (including the presented model) eliminate the complexity of a formal beam caustic measurement for generic aberrated beams (both from the laser source and from the optical system).
Multiple different combinations of aberrated beams (from the source and from the optical system) may lead to the same M2 and SR figures, and yet to different behaviours in focus. The presented first-order approximation, although it cannot replace a rigorous formal approach, shall provide better estimates than ignoring the effects of M2 and the SR (in other words, assuming all beams are perfect, and all optical systems are ideal, meaning diffraction-limited focusing conditions are assumed to apply).
Probably, the proposed equations hold for “small” levels of aberrations and break down for larger magnitudes. An interesting question is “where the transition from small aberration to large aberration lies”, what determines this transition point, how it depends on spatial frequency, the type of aberration, phase reversals, and so on.
The RMS to SR approximation holds valid for an SR as low as ~0.3 [8], and yet, as mentioned before, an SR > 0.8 is considered reasonably diffraction limited [7]. The proposed approximation model is not meant for a low SR (<0.5) or for a large M2 (>2), and probably works best limited to an SR > 0.67 (~0.82; ~0.50.5) or M2 < 1.5 (~1.252; ~20.5).
The relation between M2, the SR, and beam aberrations causing a different spot size would be a study on its own. However, it made sense to assume a simple linear contribution instead of taking the beam quality as not influencing the beam size at all (confirmed in light of the relevant reductions in intensity and increases in the spot size obtained even for excellent beam and optical qualities, M2 < 1.25 and SR > 0.8).
In principle, M2 and the SR could be ignored as an approximation, and an aberrated wavefront on the focused beam should be incorporated instead, and (photochemical) models with an arbitrarily aberrated wavefront beam should be developed.
For a variety of laser–tissue interaction processes, it is not only the laser pulse intensity which comes from the focus size, but the pulse overlapping as well [17]. Thus, the focus size and the overlapping factor are both influenced by the NA as well as the beam quality (M2 and the SR in our model).
In the limiting case for which the laser–tissue interaction process is only driven by the applied dose (in the presence of tight pulse overlapping, average energy per unit of area) [18], the effects of M2 and the SR vanish (since the reduction in intensity is compensated by the cumulative overlap effect) and the results are identical to those obtained under the diffraction-limited assumption.
At the other end of the limiting case for which the laser–tissue interaction process is a single pulse effect (i.e., no pulse overlapping or cumulative effects play a relevant role), the effects of M2 and the SR are maximized compared to the results obtained under the diffraction-limited assumption [10].
In between, there is a corridor of increasing/decreasing importance for the effects of M2 and the SR. For multiphoton absorption (non-linear) processes for which both the single pulse intensity I (suprathreshold process) and pulse overlapping are involved, a formal estimate can be derived [19].
where m is the multiphoton order, ωx/y the spot size, and ∆x and ∆y the interspot distance. Since
The effect can be rewritten as
As it could be expected for two-photon processes, the reduction in the intensity due to M2 and the SR is fully compensated by the increase in pulse overlapping. But for increasing orders of the multiphoton process, the reduction due to M2 and the SR dominates over the increase in the pulse overlapping. For the engineering optimum described before (M2 ~1.15 and SR ~0.85), the actual effect would be 74% of the diffraction-limited effect for a three-photon process; but further reduce to 55%, 40%, and 30% of the diffraction-limited effect for four-photon, five-photon, and six-photon processes, respectively. Figure 3 presents the simple estimate of the impact of M2 and Strehl Ratio for different multiphoton orders on the effect of photochemical models for laser tissue interaction accounting for spot overlapping.
These values hint that numerical modelling under the assumption of diffraction-limited setups may largely miss the empirical findings. However, it would be of value to establish a convenient “rule of thumb”, like the one proposed in this model.
Further, this model may help one to understand differences among the units of the same design (as a plausible explanation), when clearly distinct behaviours are observed at different units which should be otherwise identical. The use of “semi-empirical” gain factors [14] may work (and seems to work, since this is the conventional approach) to describe the process for a particular model setup (provided that model setup can be reasonably replicated); yet static “semi-empirical” gain factors fail when it comes to explaining subtle differences in the behaviours for units which were identical in design, but different within the spread of the normal optical quality ranges.
Table 1 summarizes all the findings.
This work emphasizes the need for a conscious and driven selection of the adequate wavelength to drive the aimed for process. In general, the shortest feasible wavelength to drive the process is advisable. This has at least two positive implications: on the one hand, the efficiency of the process will be increased (due to the lower multiphoton order), and on the other hand, the detrimental effects of M2 and the SR may be strongly reduced.
For corneal work (the expertise domain of the authors), most intracorneal laser–tissue interactions are currently performed with ~1 µm wavelengths (representing a five-photon process). Increasing the wavelength to ~1.2–1.3 µm (representing a six-photon process) would be detrimental since the statistical likelihood of six photons reaching the effect volume will be strongly reduced (compared to five photons) and is more sensitive to optical imperfections in terms of M2, the SR, or aberrations. On the contrary, shortening the wavelength to ~760 nm (representing a four-photon processes) would enhance the effect since the statistical likelihood of four photons reaching the effect volume will be higher (compared to five photons) and less sensitive to optical imperfections in terms of M2, the SR, or aberrations. Further shortening the wavelength to ~570 nm (representing a three-photon process) would enhance it even further, yet it may not be clinically feasible due to the strong irradiation falling in the visible spectrum. Finally, shortening the wavelength to ~370 nm (representing a two-photon process) would “optimize” and “stabilize” the effect, since just two photons are required in the effect volume and the process may be insensitive to M2 and the SR.
Corneal processes which may benefit from a proper selection of the wavelength include the LIOB [10] and LIRIC [11] processes. For LIOB [10], a reduction from ~1035 nm (five-photon process) down to ~345 nm (two-photon process) suggests an almost ~5-fold decrease in the LIOB threshold (but the same sensitivity to M2 and the SR, due to the single pulse nature of the effect). For LIRIC [11], the same reduction suggests an over ~1000-fold increase (over three orders of magnitude) in efficiency (plus improved stability against M2 and the SR, as shown in this work).
Since the NA and focusability are very important for many applications, in terms of other possible factors affecting the beam quality, i.e., the spot size, in this case, M2 and the SR have been considered in the model. The main idea behind the model is to explain and support actual experimental data which are produced using real-life systems which do not have perfect beams.
Previous works have considered the effects of or provided refined methods to determine M2 or the SR. For the single-pulse machining of glass with ultrashort pulses at near-infrared wavelength, a theoretical calculation and corrections based on M2 was provided for the ablation of glass inferred from experimental results [20]. Beam quality measurements with a Shack–Hartmann wavefront sensor and M2 sensor were compared in another work. With a Shack–Hartmann wavefront sensor, the wavefront of the beam can be easily measured and M2 can be determined from the wavefront [21]. In another work, for spatio-temporal coupling distortion cases, the Strehl Ratios showed a trend of improvement as the F-number decreases [22]. A previous publication corrected the wavefront distortion induced during the post-compression of a 100-TW Ti:Sapphire laser. By compensating for the wavefront aberrations with an adaptive optics system, the Strehl Ratio of the post-compressed beam was improved from 0.37 to 0.52 and the focused intensity of the post-compressed beam could be enhanced by a factor of 1.5 [23].
How the NA, SR, and M2 crosstalk in different systems is a different story, because it depends on both the M2 of the laser source and the SR modifications along the specific optical train.
Of note, the combined use of M2 and SR corrections is only granted if the SR is calculated for an ideal beam, and it does not intrinsically/implicitly incorporate the effects of the M2 of the actual beam. Otherwise, the provided corrections shall only consider the SR (of the system) and ignore M2 (since M2 is “embedded” into the system’s SR).
5. Conclusions
Adding M2 and the SR as parameters into photochemical models to consciously deviate from the diffraction-limited assumptions could explain the empirical findings observed/determined with real-world experiences, in particular, using commercially available systems. This work provides analytical (yet simple) close-form equations to account for the M2 and SR effects in photochemical and laser–tissue interaction models.
Author Contributions
Conceptualization, S.A.-M.; Methodology, S.A.-M. and S.S.; Validation, S.S.; Formal analysis, S.A.-M. and P.N.; Resources, P.N.; Writing—original draft, S.A.-M.; Writing—review & editing, P.N. and S.S. All authors have read and agreed to the published version of the manuscript.
Funding
This research received no external funding.
Institutional Review Board Statement
Not applicable.
Informed Consent Statement
Not applicable.
Data Availability Statement
Data are contained within the article.
Conflicts of Interest
Authors S.A.-M and P.N. are employees of SCHWIND eye-tech-solutions, author S.S. is employee of Light Conversion. The authors declare that the research was conducted in the absence of any commercial or financial relationships that could be construed as a potential conflict of interest.
References
- Essien, M.; Schanwald, P.L.; Fuerschbach, P.W. Spot-size measurements of a focused cw Nd:YAG laser. In Beam Control, Diagnostics, Standards, and Propagation; SPIE: Bellingham, WA, USA, 1995; Volume 2375. [Google Scholar] [CrossRef]
- Urmoneit, U.; Hotz, A.; Fröhlich, T.; Krauß, H.-J. Influence of Laser Beam Diameter on the Resistance of Laser Protection Filters to Laser Radiation. Phys. Procedia 2014, 56, 1377–1383. [Google Scholar] [CrossRef]
- Siegman, A.E. How to (Maybe) Measure Laser Beam Quality. In Proceedings of the Tutorial presentation at the Optical Society of America Annual Meeting, Long Beach, CA, USA, October 1997. [Google Scholar]
- Mahajan, V.N. Strehl ratio for primary aberrations in terms of their aberration variance. J. Opt. Soc. Am. 1983, 73, 860–861. [Google Scholar] [CrossRef]
- Ross, T.S.; Latham, W.P. Appropriate measures and consistent standard for high energy laser beam quality. J. Direct Energy 2006, 2, 22–58. [Google Scholar]
- Eichler, J.; Dünkel, L.; Eppich, B. Die Strahlqualität von Lasern—Wie bestimmt man Beugungsmaßzahl und Strahldurchmesser in der Praxis? Laser Tech. J. 2004, 1, 63–66. [Google Scholar] [CrossRef]
- Strehl, K. Aplanatische und fehlerhafte Abbildung im Fernrohr. Z. Instrumentenkunde 1895, 15, 362–370. [Google Scholar]
- Vladimir, S. 6.5. Strehl Ratio. Notes on Amateur Telescope Optics. 2006. Available online: https://www.telescope-optics.net/Strehl.htm (accessed on 30 June 2021).
- Available online: https://mpbcommunications.com/en/site/products/fiber_laser/MPBC-Why%20M2%20is%20Important.pdf (accessed on 1 July 2021).
- Arba-Mosquera, S.; Naubereit, P.; Sobutas, S.; Verma, S. Analytical optimization of the cutting efficiency for generic cavitation bubbles. Biomed. Opt. Express 2021, 12, 3819–3835. [Google Scholar] [CrossRef] [PubMed]
- Arba-Mosquera, S.; Krüger, L.; Naubereit, P.; Sobutas, S.; Verma, S.; Zheleznyak, L.; Knox, W.H. Analytical optimization of the laser induced refractive index change (LIRIC) process: Maximizing LIRIC without reaching the damage threshold. Adv. Opt. Technol. 2021, 10, 363–373. [Google Scholar] [CrossRef]
- Arba-Mosquera, S.; Verma, S. Analytical optimization of the ablation efficiency at normal and non-normal incidence for generic super Gaussian beam profiles. Biomed. Opt. Express 2013, 4, 1422–1433. [Google Scholar] [CrossRef] [PubMed]
- Griessmann, M.H.; Martinez-Becerril, A.C.; Lundeen, J.S. A method to determine the M2 beam quality from the electric field in a single plane. Opt. Contin. 2023, 2, 1833. [Google Scholar] [CrossRef]
- Huang, R.; Knox, W.H. Quantitative photochemical scaling model for femtosecond laser micromachining of ophthalmic hydrogel polymers: Effect of repetition rate and laser power in the four photon absorption limit. Opt. Mater. Express 2019, 9, 1049–1061. [Google Scholar] [CrossRef]
- Noack, J.; Vogel, A. Laser-induced plasma formation in water at nanosecond to femtosecond time scales: Calculation of thresholds, absorption coefficients, and energy density. IEEE J. Quantum Electron. 1999, 35, 1156–1167. [Google Scholar] [CrossRef]
- Javier, A. Laser and Gaussian beam propagation and transformation. In Encyclopedia of Optical Engineering; Marcel Dekker, Inc.: New York, NY, USA, 2003; Volume 999. [Google Scholar]
- Tinne, N.; Lübking, E.; Lubatschowski, H.; Krüger, A.; Ripken, T. The influence of a spatial and temporal pulse-overlap on the laser-tissue-interaction of modern ophthalmic laser systems. Biomed. Tech. 2012, 57 (Suppl. 1), 302–305. [Google Scholar] [CrossRef] [PubMed]
- Abuarra, A.; Abuarra, B.; Abur, B.S.; Singh, G.K.; AlSadi, Z.; Mahmood, T.L.; Omar, K.; MatJafri, M.Z. The effects of different laser doses on skin. Int. J. Phys. Sci. 2012, 7, 400–407. [Google Scholar] [CrossRef]
- Huang, R.; Knox, W.H. Femtosecond micro-machining of hydrogels: Parametric study and photochemical model including material saturation. Opt. Mater. Express 2019, 9, 3818–3834. [Google Scholar] [CrossRef]
- Campbell, S.; Dear, F.C.; Hand, D.P.; Reid, D.T. Single-pulse femtosecond laser machining of glass. J. Opt. A Pure Appl. Opt. 2005, 7, 162. [Google Scholar] [CrossRef]
- Sheldakova, J.V.; Kudryashov, A.V.; Zavalova, V.Y.; Cherezova, T.Y. Beam quality measurements with Shack-Hartmann wavefront sensor and M2-sensor: Comparison of two methods. In Laser Resonators and Beam Control IX; SPIE: Bellingham, WA, USA, 2007; Volume 645207. [Google Scholar] [CrossRef]
- Kim, J.I.; Yoon, J.W.; Yang, J.M.; Kim, Y.G.; Sung, J.H.; Lee, S.K.; Nam, C.H. Wavefront-corrected post-compression of a 100-TW Ti:sapphire laser. Opt. Express 2022, 30, 26212–26219. [Google Scholar] [CrossRef] [PubMed]
- Shi, B.; Yu, L.; Liang, X. Spatio-temporal characterization of tightly focused femtosecond laser fields formed by paraboloidal mirrors with different F-numbers. Opt. Express 2023, 31, 33299–33311. [Google Scholar] [CrossRef] [PubMed]
Figure 1.
M2 is a heuristic parameter of the laser beam related to the spot size in focus. M2 has a value > 1, with a hypothetical, perfectly unaberrated beam having an M2 of 1. M2 is defined as M2 = θπω/λ, where θ is the beam divergence, ω is the measured beam waist, and λ is the wavelength of light. In other words, ωactual = ω0M, where ωactual is the actual beam waist and ω0 is the theoretical minimum beam waist at focus under ideal conditions; θactual = θ0M, where θactual is the actual beam divergence and θ0 is the theoretical minimum beam divergence under ideal conditions. M2 is related to a “redistribution” of the (constant) energy in a different (wider) region (the spread). Usually, M2 values of 1.25 or below are considered excellent (and non-rigorously as “close to the diffraction-limit”). M2 of 1.25 would increase spot diameter by +12% (1.12×); spot area by +25% (1.25×); and reduce the PSF intensity by −20% (0.80×).

Figure 2.
The SR is a measure of the quality of optical image formation. The SR has a value between 0 and 1, with a hypothetical, perfectly unaberrated optical system having a Strehl Ratio of 1. The SR is frequently defined as the ratio of the peak aberrated image intensity from a point source compared to the maximum attainable intensity using an ideal optical system limited only by diffraction over the system’s aperture: SR = max(PSFactual)/max(PSFdiffraction-limited). SR is related to a “redistribution” of the (constant) energy in a different (wider) region (the spread). It follows that ωactual = ω0/√SR, i.e., in a first-order approximation, the SR (reduction in the peak PSF relative to the diffraction limited PSF) produces an increase in the spot size inversely proportional to the square root of SR. Optical systems with SR values of 0.8 or better are considered excellent (and non-rigorously as “close to the diffraction-limit”). SR of 0.8 would increase spot diameter by +12% (1.12×); spot area by +25% (1.25×); and reduce PSF intensity by −20% (0.80×).

Figure 3.
For 2-photon processes, the reduction in intensity due to M2 and SR is fully compensated for by the increase in pulse overlapping. But for increasing orders of the multiphoton process, the reduction due to M2 and SR dominates over the increase in pulse overlapping. For the engineering optimum described before (M2 ~1.15 and SR ~0.85), the actual effect would be 74% of the diffraction-limited effect for a 3-photon process, but further reduce to 55%, 40%, and 30% of the diffraction-limited effect for 4-photon, 5-photon, and 6-photon processes, respectively.


Table 1.
Summary of all findings in relative terms.
| M2 | SR | m | Spot Diameter | Spot Area | Intensity | Effect |
|---|---|---|---|---|---|---|
| 1 | 1 | 4 | 100% | 100% | 100% | 100% |
| 1.15 | 1 | 4 | 107% | 115% | 87% | 76% |
| 1 | 0.85 | 4 | 108% | 118% | 85% | 72% |
| 1.15 | 0.85 | 4 | 116% | 135% | 74% | 55% |
| 1.49 | 1 | 4 | 122% | 149% | 67% | 45% |
| 1 | 0.67 | 4 | 122% | 149% | 67% | 45% |
| 1.15 | 0.85 | 2 | 116% | 135% | 74% | 100% |
| 1.15 | 0.85 | 6 | 116% | 135% | 74% | 30% |
Disclaimer/Publisher’s Note: The statements, opinions and data contained in all publications are solely those of the individual author(s) and contributor(s) and not of MDPI and/or the editor(s). MDPI and/or the editor(s) disclaim responsibility for any injury to people or property resulting from any ideas, methods, instructions or products referred to in the content. |
© 2024 by the authors. Licensee MDPI, Basel, Switzerland. This article is an open access article distributed under the terms and conditions of the Creative Commons Attribution (CC BY) license (https://creativecommons.org/licenses/by/4.0/).
Share and Cite
MDPI and ACS Style
Arba-Mosquera, S.; Naubereit, P.; Sobutas, S. Simple Estimate of the Impact of M2 and Strehl Ratio on the Effective Focusable Spot Size. Optics 2024, 5, 56-65. https://0-doi-org.brum.beds.ac.uk/10.3390/opt5010004
AMA Style
Arba-Mosquera S, Naubereit P, Sobutas S. Simple Estimate of the Impact of M2 and Strehl Ratio on the Effective Focusable Spot Size. Optics. 2024; 5(1):56-65. https://0-doi-org.brum.beds.ac.uk/10.3390/opt5010004
Chicago/Turabian StyleArba-Mosquera, Samuel, Pascal Naubereit, and Simas Sobutas. 2024. "Simple Estimate of the Impact of M2 and Strehl Ratio on the Effective Focusable Spot Size" Optics 5, no. 1: 56-65. https://0-doi-org.brum.beds.ac.uk/10.3390/opt5010004