Article

A Cross-Sectional Study of Bitter-Taste Receptor Genotypes, Oral Health, and Markers of Oral Inflammation

1
School of Environmental and Life Sciences, The University of Newcastle, Ourimbah, NSW 2258, Australia
2
School of Biomedical Sciences & Pharmacy, The University of Newcastle, Ourimbah, NSW 2258, Australia
3
School of Medicine & Public Health, The University of Newcastle, Ourimbah, NSW 2258, Australia
4
School of Dentistry, Faculty of Medicine and Health, The University of Sydney, Westmead, NSW 2145, Australia
5
School of Health Sciences, The University of Newcastle, Ourimbah, NSW 2258, Australia
6
Hunter Medical Research Institute, New Lambton Heights, NSW 2305, Australia
7
Priority Research Centre for Physical Activity and Nutrition, The University of Newcastle, Callaghan, NSW 2308, Australia
*
Author to whom correspondence should be addressed.
Submission received: 1 April 2021 / Revised: 1 May 2021 / Accepted: 14 May 2021 / Published: 18 May 2021

Abstract

:
(1) Background: The aetiology of oral disease is multifactorial, involving genetic and environmental factors, including dietary ones. Bitter taste genetics may be related to oral health through dietary modulation or non-gustatory roles, including modulation of inflammation. Investigations of bitter taste and oral health associations to date have been restricted to specific polymorphisms, limited outcomes (caries), and age-groups (children), and links to inflammation remain to be elucidated. (2) Methods: A cross-sectional study (n = 65) investigated the correlations between bitter taste genotypes, oral health outcomes, and oral inflammation markers. Oral examinations were conducted, including saliva testing with evaluation of flow rate, pH, and buffering and antioxidant capacity (FRAP) and IL-1β, TNF-α, IL-6 levels. DNA was collected via buccal swabs and used to evaluate the presence of multiple bitter-taste receptor gene polymorphisms. (3) Results: The major allele for TAS2R4-rs2233998, TAS2R5-rs2227264, TAS2R50-rs1376251, and TAS2R9-rs3741845 was associated with a higher mean of unstimulated salivary flow rate, FRAP, TNF-α, IL-1β, and likelihood of filled teeth. Presence of the major allele for TAS2R4-rs2234001 and TAS2R9-rs3741845 was associated with lower means FRAP, TNF-α, IL-1β, DMFT index, and likelihood of missing teeth. (4) Conclusions: These findings suggest relationships between bitter-taste genotypes, oral health outcomes, and inflammatory markers. These findings justify the need for further studies that could help identify risk groups and develop novel agents for maintaining oral health.

1. Introduction

Oral health is a growing public health concern worldwide [1]. In 2017, 3.60 billion people were affected globally by chronic oral conditions, including untreated dental caries, periodontal disease, and complete tooth loss [2]. Oral diseases are also highly prevalent in Australia, contributing up to 2.3% of the total health burden in 2015 [3]. Poor oral health may also impact general well-being [4]. The consequences of chronic, untreated oral diseases include pain, discomfort, and tooth loss, which impact quality of life [5,6]. Loss of functionality associated with tooth loss has also been associated with poor diet quality and compromised nutritional intake [7]. Oral inflammatory diseases, including periodontal disease, are potential risk factors for chronic systemic diseases, including diabetes, pregnancy-related complications, rheumatoid arthritis, dementia, and cardiovascular diseases [8,9,10,11,12,13]. Oral diseases are multifactorial [14,15,16], involving the interplay of host-immune responses and numerous environmental factors, such as type of microorganisms, dietary and oral hygiene habits, physical and chemical changes in saliva, and genetics [17,18,19,20,21,22,23]. Variation in taste genetics may be involved in the modulation of both dietary factors and inflammatory response [24]. To date, research investigating links between oral diseases and bitter taste receptor genotypes have been limited to specific single-nucleotide polymorphisms (SNPs) associated with bitter-taste genes and dental caries [17,25]. A large study conducted in the United States involving both children and adults found that caries protection was linked to polymorphisms in the TAS2R38 gene in primary dentition only [17]. A case-control study of Turkish adults (n = 154) that examined multiple gene-environment interactions in the aetiology of dental caries found that polymorphisms in TAS2R38 genes were associated with dental caries risk in the presence of certain environmental factors [25]. Moreover, children who were 6-n-propylthiouracil (PROP) non-tasters were more prone to dental caries than tasters [26,27,28]. However, these investigations were confined to dental caries and did not assess salivary inflammatory mediators, with research restricted to specific populations/groups.
A variety of studies, including human, animal, and cell culture studies, have examined the role of taste receptors in innate immunity [29,30,31,32,33,34,35,36,37,38,39,40]. A study investigating the effects of TAS2R activation on leukocyte function found that bitter agonists such as chloroquine and denatonium were associated with inhibition of release of certain lipopolysaccharide-induced inflammatory mediators in 12 Swedish adults with asthma [29]. Moreover, in humans, genitourinary bitter-taste receptors may also play an important role in preventing genital and urinary infection by activation of anti-inflammatory pathways [30]. In murine models, where many bitter-taste receptors have human orthologs, bitter-taste receptors are present in sinonasal solitary chemosensory cells. In these cells, bitter-taste receptors are activated by acyl-homoserine lactones (AHLs) produced by gram-negative bacteria or the bitter agonist, denatonium. Receptor activation via these compounds was associated with inflammatory mediator release influenced by acetylcholine [31,32]. Furthermore, a study using two different murine models of asthma demonstrated that bitter-taste receptor agonists, including chloroquine and quinine, were associated with anti-inflammatory activity in the lungs [33]. Moreover, a murine study involving C57BL/6N mice with dietary-induced obesity showed that chronic treatment using a bitter agonist KDT501 targeting TAS2R108 induced broad suppression of pro-inflammatory cytokines and chemokines along with other metabolic changes [34].
Collectively, these studies suggest that local innate immune responses mediated by extra-oral taste receptors usually involve either the production of calcium-dependent nitric oxide, which induces microbicidal effects or the activation of anti-inflammatory pathways [30,35,36]. However, the research remains limited, with no data on bitter-taste receptors and oral innate immunity. A cell culture study investigating the TAS2R38 genotype in gingival epithelial cells concluded that secretion of IL-1α and IL-8 were genotype-specific [37]. Likewise, a very recent cell culture study involving TAS2R43 and TAS2R50 taste genotypes and artificial bitter compounds demonstrated that the TAS2R50 genotype was associated with the IL-6 targeting pathway in human gingival cells [38]. Furthermore, another recent cell culture study concluded that knockdown of the TAS2R14 might alter the secretion of IL-6, IL-8, and TNF-α in gingival epithelial cells [39]. An animal study involving TNF knockout mice and wild-type control mice (C57BL/6) found that TNF modulated bitter-taste response [40]. However, these studies were restricted to examining the role of certain host-pathogen interactions and used artificial bitter compounds and were restricted to cell-culture and animal models.
To our knowledge, there are no human cohort studies investigating relationships between polymorphisms in bitter-taste genes and inflammatory mediators associated with oral outcomes. Furthermore, the relationships between bitter-taste genotypes and oral health outcomes other than dental caries and inflammatory markers of oral health remain to be fully elucidated. A better understanding of these relationships might assist in the development of novel therapeutic aids by targeting associated inflammatory pathways in treating oral diseases. Therefore, in this current study, we assessed the relationship between bitter-taste genotypes, oral health outcomes, and markers of oral health, including physical and chemical properties of saliva and inflammatory mediators. This study utilises a cross-sectional cohort.

2. Materials and Methods

2.1. Study Design and Ethics Approval

A cross-sectional study was conducted, approved by the Human Research Ethics Committee (HREC), University of Newcastle, Australia (approval number H-2019-0200). All participants provided written informed consent.

2.2. Study Population and Participant Recruitment

The study population was adults undergoing routine dental checks or care. The participants were recruited from general oral health clinic patients at the University of Newcastle, Central Coast Campus. The inclusion criteria for recruitment included being 18 years of age or over. Those who had taken any antibiotics in the last six months were excluded from the study. Participants were asked not to eat or drink anything for at least half an hour prior to sample collection.

2.3. Questionnaires

Participants completed a questionnaire with questions on demographics, including age, sex, education level, household income, height, weight (used to calculate body mass index (BMI) using the equation weight (kg)/height (m)2), and smoking history. Self-reported dietary habits were also evaluated using a previously validated short dietary questionnaire [41]. Each question in the dietary questionnaire had 3 options, with the healthiest choice scored as 3 and the least healthy choice scored as 1; scores were added to calculate the dietary index, with the maximum score available being 24.

2.4. Sample Collection and Processing

Sample collection was conducted before commencing any clinical procedure. A buccal swab sample was collected using an Isohelix SK-1S buccal swab by rubbing the inside of the cheek for 1 min as per the manufacturer’s instructions (Isohelix DNA buccal swabs, Cell projects, Kent, UK) [42]. Resting unstimulated, whole saliva samples were collected for 5 min via the passive drool method using cryovial tubes 2 mL (5004.06) and Saliva Collection Aid (SCA) 5016.02 as per user’s guide by Salimetrics (Salimetrics, LLC, Carlsbad, CA, USA) [43]. All samples were collected by the oral health therapy students in the oral health clinic at the University of Newcastle, Central Coast Campus, using standardised protocols. Saliva samples were discarded and repeated if they were contaminated or discoloured, indicating the presence of blood. The samples were stored on ice and transported to the adjacent lab within 2 h of sample collection. Buccal samples were stored at −80 °C until further analysis. Saliva samples were processed by vortexing and centrifuging at 1500× g for 15 min at room temperature [44]. The processed samples were aliquoted in Eppendorf tubes and stored at −80 °C for further analysis.

2.5. Saliva Testing and Oral Examination

Clinical saliva testing was conducted to check the quality, pH, and buffering capacity of both unstimulated and stimulated saliva using a commercial Saliva-check Buffer kit (GC Corporation) [45]. A complete oral examination for both hard and soft tissues as per the University of Newcastle oral health clinic’s clinical guidelines, Central Coast. DMFT (decayed, missing, and filled permanent teeth) index was calculated from the clinical charting using WHO’s modification of DMFT Index [46]. The number of individual decayed, missing, and filled teeth were also calculated. Periodontal tissues were assessed using periodontal screening, and perio-charting protocols and periodontal diagnosis were made according to the highest PSR (periodontal screening and recording) score in any sextant [47,48].
Small (50 μL–150 μL) volumes of processed saliva were aliquoted for salivary analysis, avoiding repeated freezing-thawing cycles. The salivary flow rate of unstimulated saliva was calculated by weighing the cryovials before and after the saliva collection and expressed as mL/min [21]. The total antioxidant capacity (TAC) of saliva was calculated using a previously validated FRAP (Ferric reducing antioxidant power) assay [20,49]. Inflammatory markers, including salivary IL-1β, were measured using Salimetrics IL-1β ELISA kit (Salimetrics, LLC, cat. no. 1–3902) as per manufacturer’s instructions [50]; salivary TNF-α and IL-6 were measured using Quantikine® HS Human TNF-α and IL-6 ELISA (Enzyme-linked immunosorbent assay) kits as per the user’s guidelines provided with the kits (R&D Systems, Inc., Minneapolis, MN, USA).

2.6. Genotyping

DNA was extracted from frozen buccal swabs using Xtreme DNA kits following the manufacturer’s instructions (Isohelix DNA buccal swabs, Cell projects, Kent, UK) [51]. The DNA samples were stored at −20 °C before genotyping. Genotyping was completed via qPCR (QuantStudio 7 Flex Real-Time PCR) with TaqMan SNP Genotyping assays (Applied Biosystems™, Thermo-Fisher Scientific, Waltham, MA, USA) and TaqMan™ Genotyping Master mix as per the TaqMan™ user’s guide [52,53]. Complete genotyping was a mandatory inclusion criterion for this study.

2.7. Statistical Analysis

Statistical analyses were completed using JMP (Pro 14.2.0, SAS Institute Inc., Cary, NC, USA) and GraphPad prism (v9.0, GraphPad Software Inc., San Diego, CA, USA). Age, BMI, dietary index, and oral health outcomes (including DMFT index, individual number of dental caries, missing and filled teeth, and highest PSR score and salivary biomarkers such as salivary flow rate, FRAP value, TNF-α, IL-6, and IL-1β concentrations) were treated as continuous variables and reported as the minimum and maximum ranges, means, and standard deviations (SD) with 95% confidence intervals as appropriate. Sex, household income, education, smoking status, clinical markers of oral health, and genotypes (presence or absence of the major allele) were treated as categorical variables and reported as numbers and percentage. Bitter-taste genotypes were combined to examine the presence vs absence of the major allele according to the TOPMED database. Genotypes were modelled together for all analyses and adjusted for the presence of other variants. The continuous outcomes were presented as adjusted least-squares means, with 95% confidence intervals and p-values obtained from student t-tests. Categorical outcomes were assessed using nominal logistic regression, and χ2 and p-values are presented. All analyses were adjusted for potential confounders as these may affect the oral health outcomes, including age, sex, income, education, smoking status, and dietary index score [54,55,56,57,58,59]. The p-value threshold for significance was 0.05.

3. Results

3.1. Descriptive Statistics

A total of 65 participants provided written consent and completed the study. For genotyping, a total of 63 participants were included in the analysis as 2 samples were discarded due to labelling error. Participants were aged between 20–84 years (mean = 36.72 ± 15.17; Table 1), and the majority (91%) were female. The mean BMI score of participants was (24.25 ± 5.89; Table 1). The dietary index distribution was slightly skewed (mean = 17.97 ± 2.18; Table 1).
About a third of the participants reported an income of $20,000–$60,000 and a TAFE or technical qualification level education (Table 2). Due to a small number of responses in $60,000–$80,000, $80,000–$100,000, and higher income brackets, categories were collapsed to $60,000–$100,000 and >$100,000 for analysis. Similarly, categories for education level, including primary school, year 10, and year 12 or equivalent, were merged to one category ≤year 12 or equivalent for analysis. The majority of the participants never smoked and had normal BMI (calculated from weight and height; Table 2). Due to the small number of smoking status responses, categories were also collapsed into “never” and “ever” groups, with ever including those who currently smoke and those who formerly smoked (Table 2).
Six bitter-taste genetic variants were assessed. The minor allele frequency (MAF) TOPMED and the allelic frequencies of these genetic variants in the study population are shown in Table 3.
The mean values for the outcome variables were: FRAP value, 0.76 ± 0.24 μmoles/L; TNF-α, 3.67 ± 5.03 pg/mL; IL-1β, 12.28 ± 13.34 pg/mL, and IL-6, 0.68 ± 1.22 pg/mL (Table 4). The mean salivary flow rate (unstimulated saliva) was 0.28 ± 0.22 mL/min. The mean DMFT score was 7.23 ± 7.22; the mean values for dental caries, missing teeth, and filled teeth were 0.66 ± 1.76, 2.82 ± 4.28 and 3.80 ± 4.41, respectively, Table 4. The distribution of the highest PSR score was normal (mean = 1.87 ± 0.97, Table 4).
The analyses of clinical salivary biomarkers of oral health showed that the majority of the participants had high saliva flow rate (resting) or hydration (visual assessment of saliva production), i.e., <30 s, watery/clear saliva, and healthy pH for resting saliva (6.8–7.8; Table 5); a total of 86% of the participants had healthy saliva (pH = 6.8–7.8), and 92% of the participants produced >5 mL of saliva upon stimulation (Table 2). The buffering capacity of saliva was also normal (10–12 points; Table 5). Several categories were collapsed due to the smaller number of participants in each group for clinical salivary biomarkers.
The oral health outcomes evaluated from DMFT index and PSR/Perio-charting scores were also categorised into binary groups as presence vs. absence of disease. A total of 83.61% of the participants had no dental caries, 55% had one or more missing teeth, and 73.77% had one or more filled teeth (Table 5). About 91.53% of the participants had any periodontal disease, including gingivitis (localised or generalised) and periodontitis (acute or chronic and mild, moderate, or severe); Table 5.

3.2. Relationships between Bitter-Taste Genotypes and Oral Health Outcomes

Only the TAS2R4-rs2234001 polymorphism was associated with DMFT index (p = 0.051); those with the major allele had lower DMFT index (Table 6). Results did not remain significant when adjusted for age, sex, income, education, smoking status, and dietary index for any bitter-taste receptor genotype. No significant associations were found between other bitter-taste receptor genotypes and the DMFT index. No significant associations were found between bitter-taste receptor gene polymorphisms and the reported number of dental caries (Table 6). No changes in the results were observed when adjusted for age, sex, income, education, and smoking status. Results also did not vary when the dietary index was added to the adjustment model.
Those with the homozygous minor allele (AA) for the TAS2R9-rs3741845 polymorphism had a higher number of missing teeth than those with the major allele (p = 0.025; Table 6). The results did not remain significant (p = 0.06) when adjusted for age, sex, income, education, and smoking status. However, results remained significant when the dietary index was added to the adjustment model (see Supplementary Material, Figure S1B). No significant results were observed between other bitter-taste receptor genotypes and missing teeth in unadjusted models. However, following adjustments for age, sex, income, education, and smoking status, a significant association was found between the TAS2R4-rs2233998 polymorphism (p = 0.028). Those with the major allele had a higher mean score for missing teeth than those with the homozygous minor allele (Figure S1A). No significant result was found (p = 0.07) when adjustment for the dietary index was added to the adjustment model.
The significant associations were only observed for those with the TAS2R4-rs2234001 polymorphism; a higher mean value for filled teeth was observed than those with the major allele (p = 0.005, Table 6), and results did not vary when adjusted for the potential confounders (Figure S2A,B; respectively). No associations were seen between the highest PSR scores and bitter-taste receptor genotypes (Table 6). The results did not vary when adjusted for age, sex, income, education, and smoking status. No changes were observed when the dietary index was incorporated in the adjustment model.

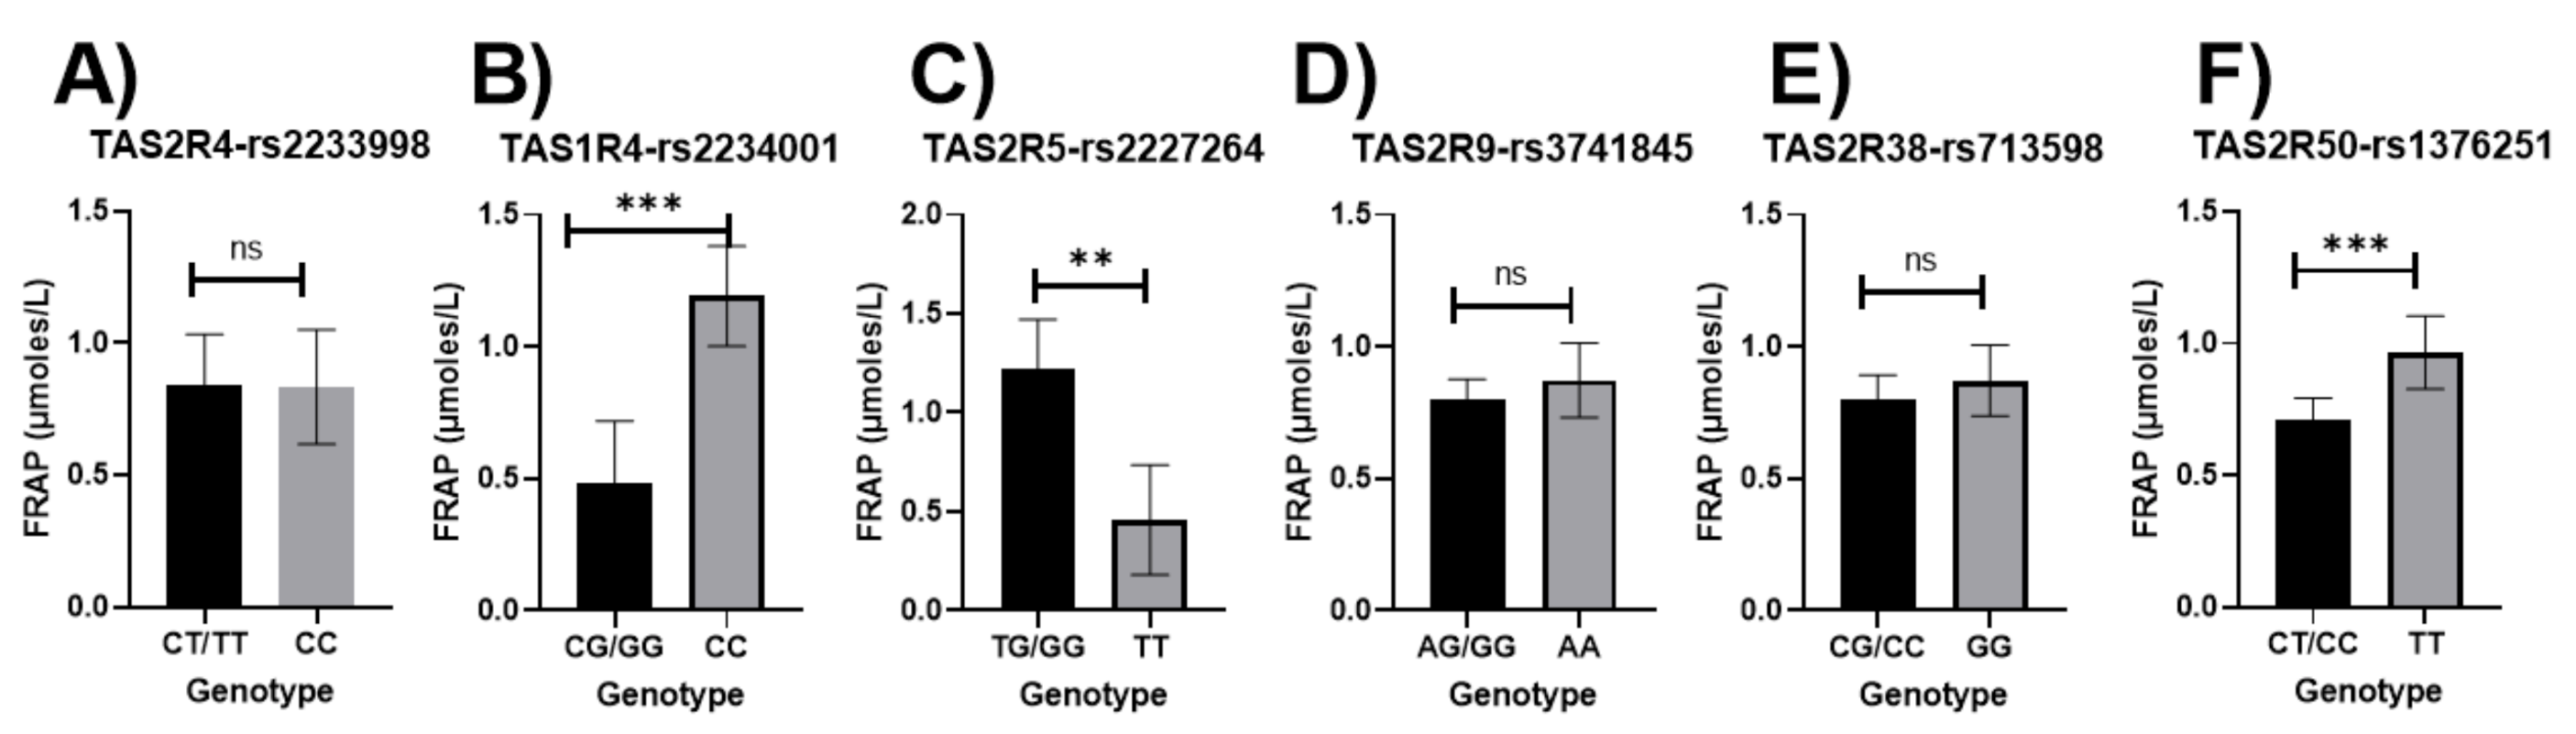
3.3. Relationships between Bitter-Taste Receptor Genotypes and Clinical Markers of Oral Health

Analyses did not show any correlations between bitter-taste receptor genotypes and clinical markers of oral health, including hydration, the viscosity of saliva, pH of resting and stimulated saliva, the quantity of stimulated saliva, and buffering capacity of saliva (Table 7). The results did not vary when adjustments were applied for age, sex, income, education, smoking status, and dietary index.
The unstimulated salivary flow rate was significantly correlated with the TAS2R9-rs3741845 polymorphism; those with the major allele had a higher unstimulated salivary flow rate than those with the homozygous minor allele (p = 0.033; Figure 1D). The results did not vary when adjusted for age, sex, income, education, and smoking status (p = 0.05; Figure S3A). However, following adjustments with the dietary index, these results were no longer significant (p = 0.059). No other significant associations were observed between unstimulated salivary flow rate and the other bitter-taste receptor genotypes in unadjusted models (Figure 3). However, a significant association was observed between the TAS2R50-rs1376251 polymorphism and unstimulated salivary flow rate; when adjusted for age, sex, income, education, and smoking status, those with the major allele had a higher unstimulated salivary flow rate than those with the homozygous minor allele (p = 0.049; Figure S3B). Results did not remain significant when the dietary index was added to the adjustment model (p = 0.06).

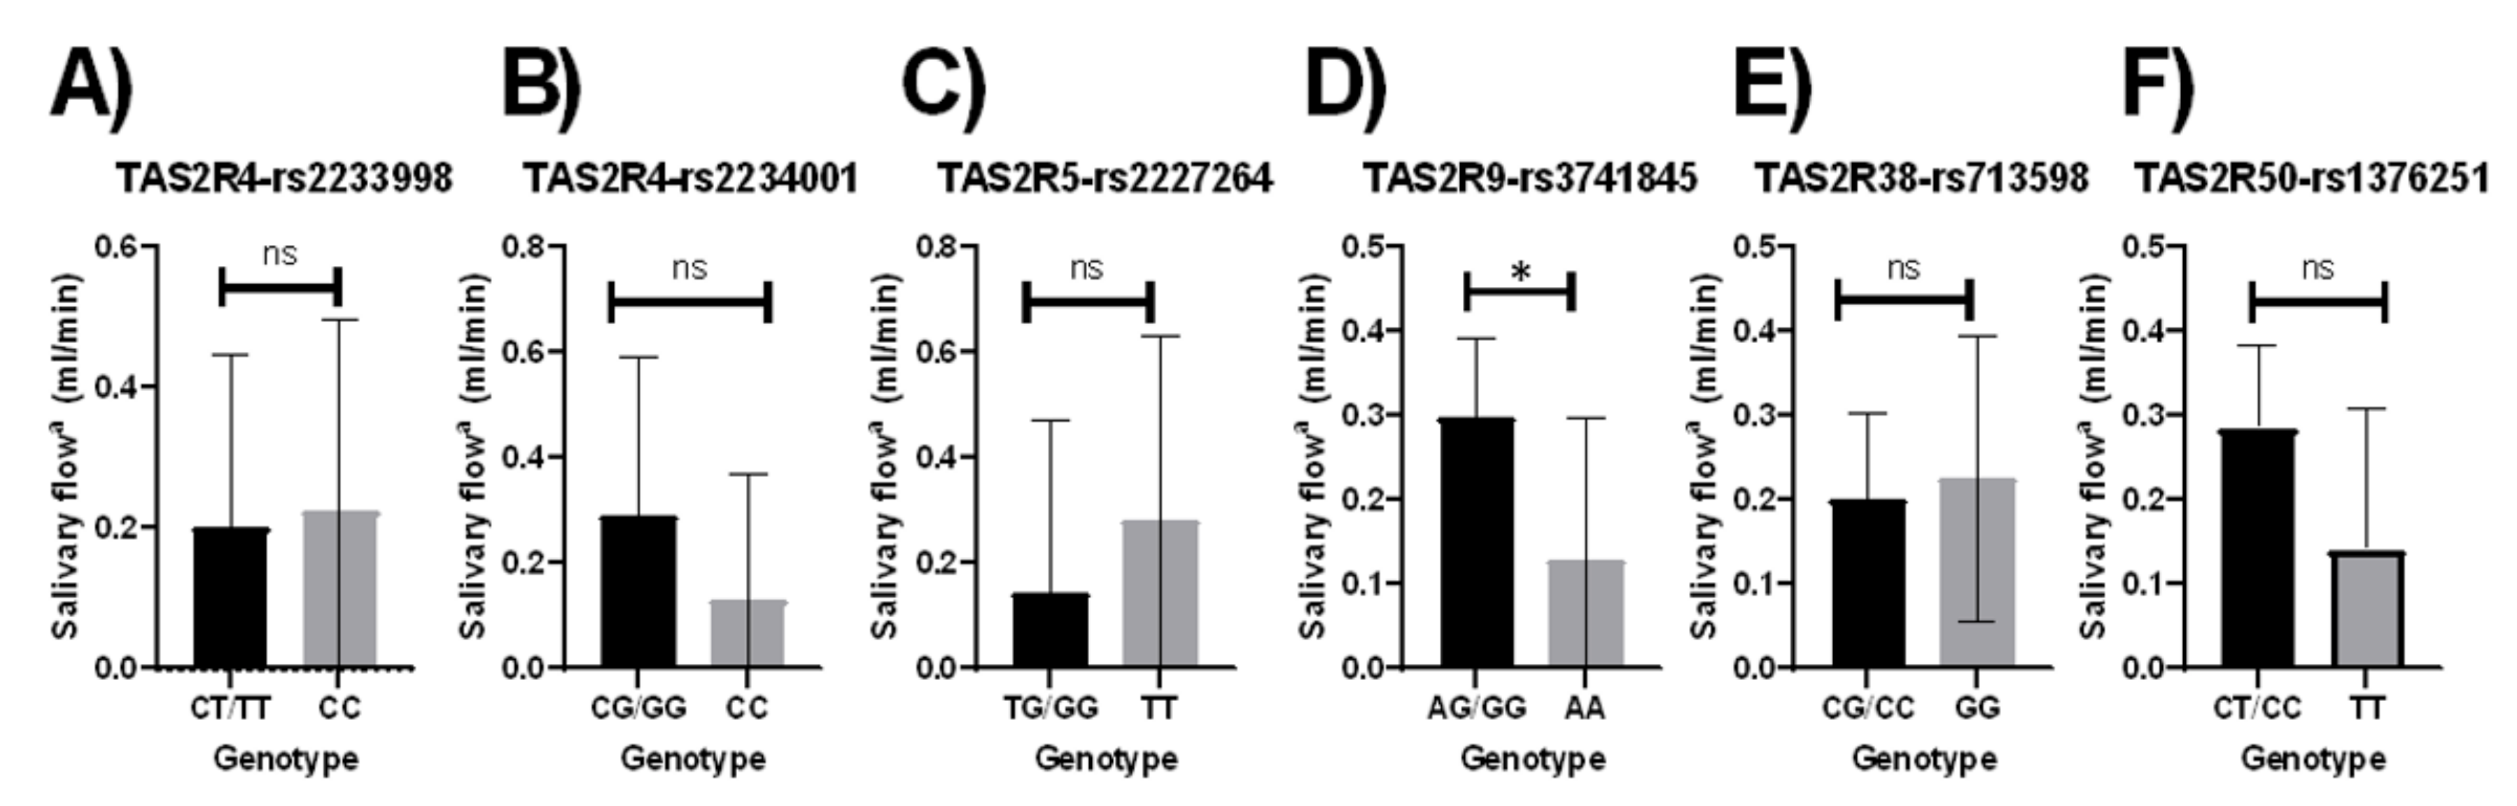
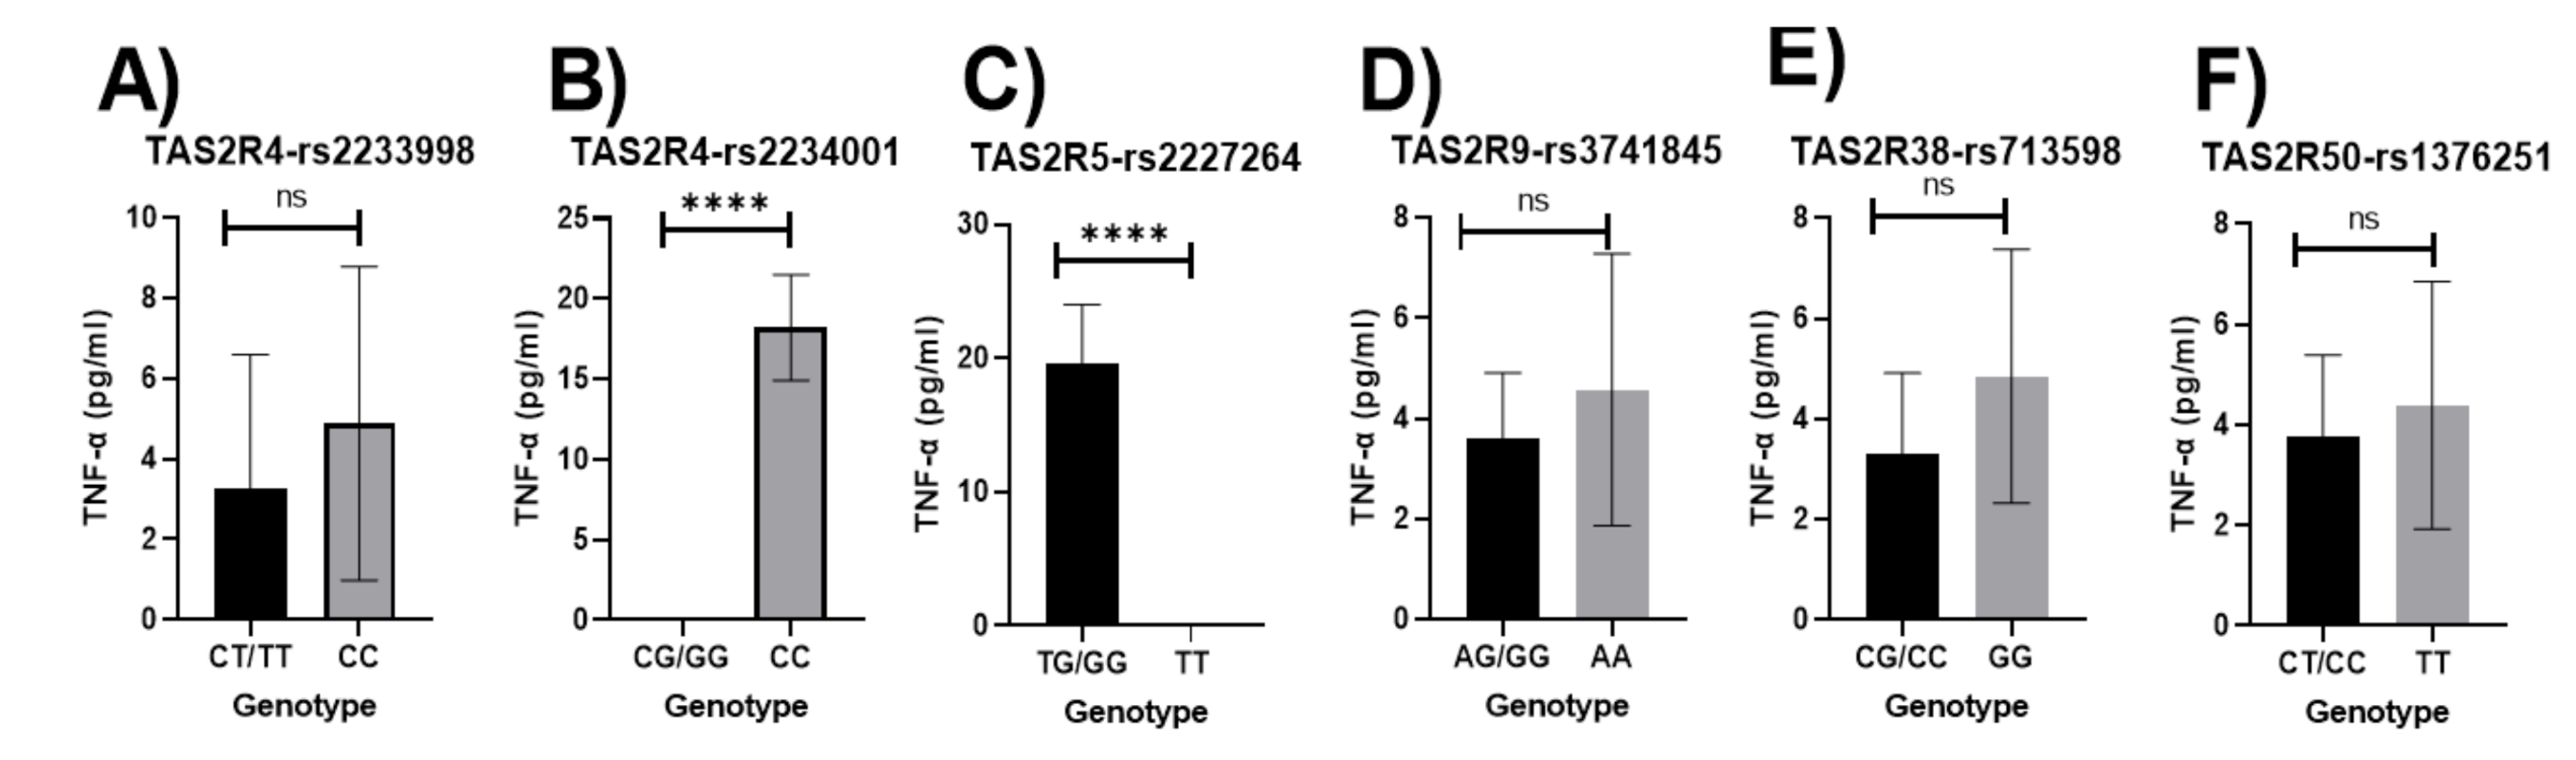
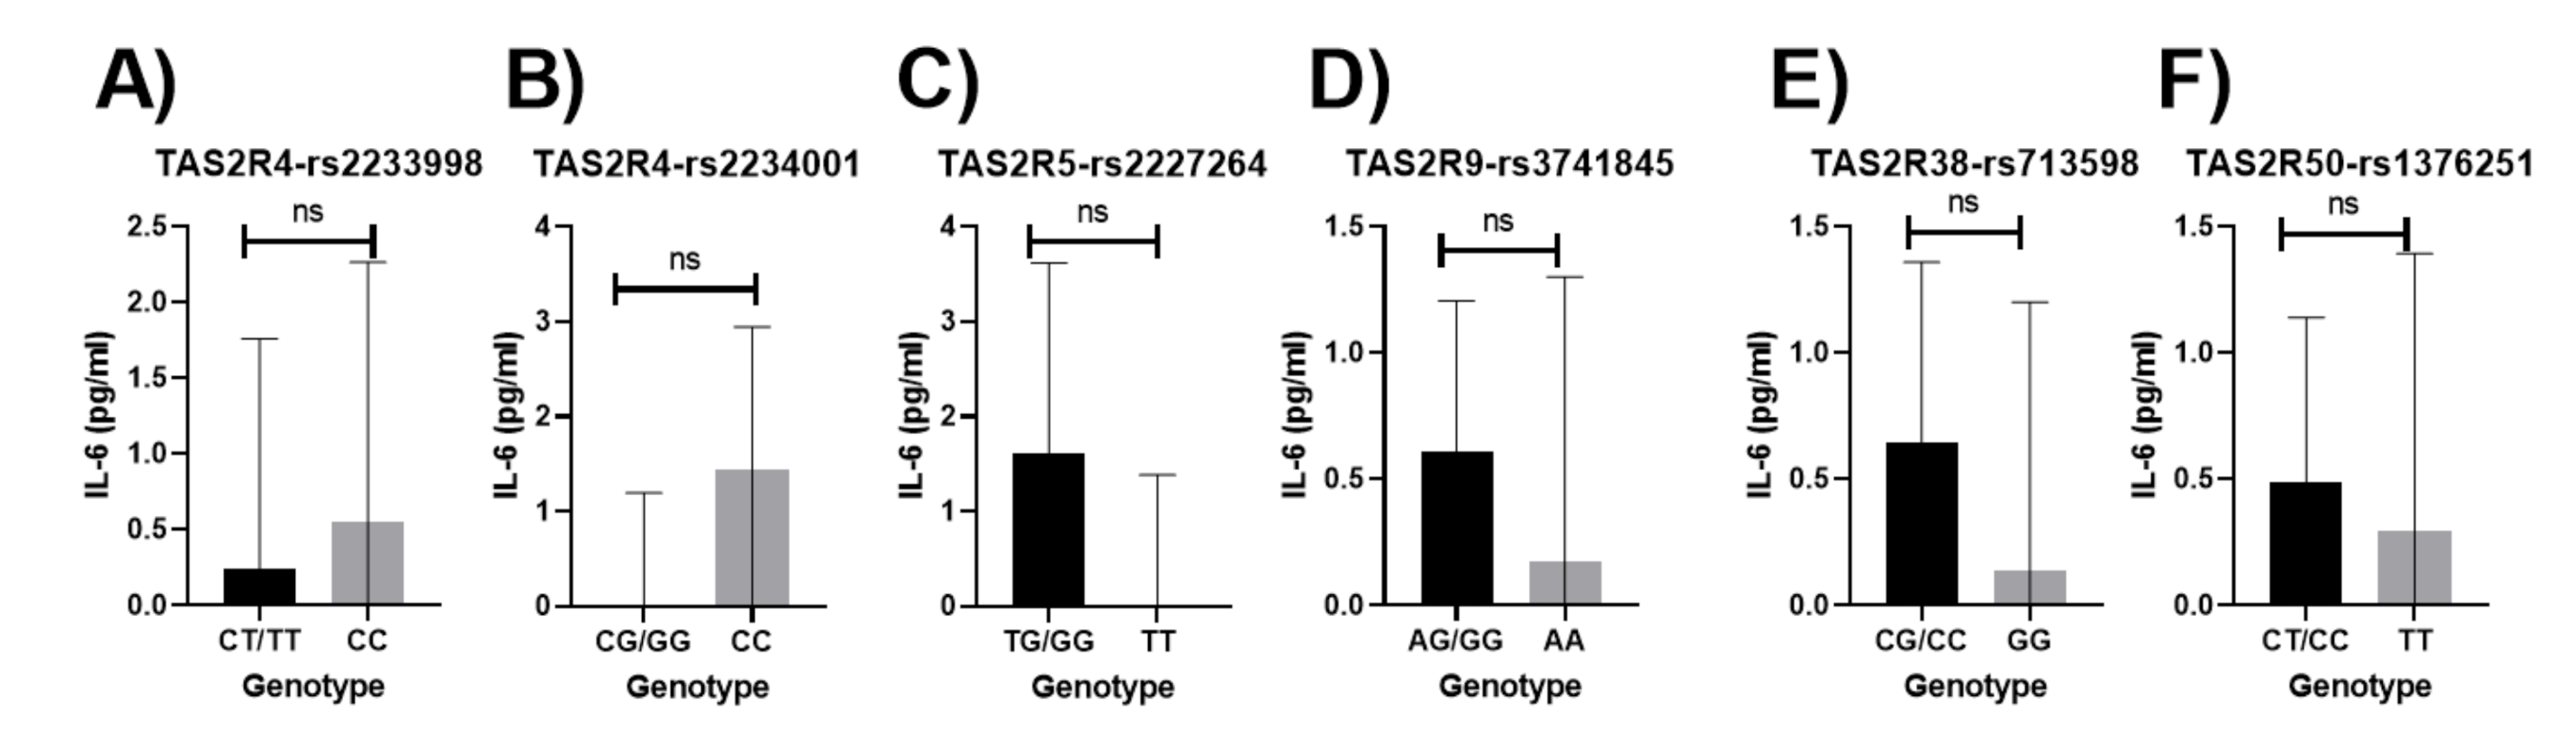
3.4. Relationships between Bitter-Taste Receptor Genotypes and Salivary Inflammatory Mediators

Participants carrying the major allele for the TAS2R4-rs2234001 polymorphism had significantly lower FRAP values than those with the homozygous minor allele (p = 0.006; Figure 2B). Those with the major allele present for the TAS2R5-rs2227264 and the TAS2R50-rs1376251 polymorphism had significantly higher FRAP values (p = 0.003, p = 0.004, respectively; Figure 2C,F, respectively). Results remained significant when adjusted for age, sex, income, education, and smoking status (Figure S4A). No changes in the results were reported when the dietary index was added to the adjustment model (Figure S4B).
Participants with the major allele for the TAS2R4-rs2234001 polymorphism had significantly lower concentrations of TNF-α than those with the homozygous minor allele (p < 0.0001; Figure 3B). Significantly higher concentrations of TNF-α were observed in those with the major allele for the TAS2R5-rs2227264 (p < 0.0001; Figure 3C). The results did not vary when adjusted for age, sex, education, income, and smoking status both without and with the dietary index (Figure S5A,B).
Higher concentrations of IL-1β were significantly associated with the homozygous minor allele for the TAS2R4-rs2234001 polymorphisms, and the presence of the major allele for the TAS2R5-rs2227264 polymorphism was significantly associated with higher concentrations of IL-1β (p = 0.023, p = 0.017, respectively; Figure 4B,C, respectively). These associations did not remain significant when adjusted for potential confounders.
No significant associations were observed between bitter-taste receptor genotypes and concentrations of IL-6 in the unadjusted models (Figure 5). Results did not vary when adjusted for age, sex, income, education, and smoking status. No changes were observed when adjustment for dietary index was applied to the model.

4. Discussion

This study is the first to concurrently investigate multiple bitter-taste receptor genotypes related to oral health outcomes and inflammatory mediators. The presence of the major allele was related to increased inflammation and other outcomes for some genotypes, while outcomes were decreased in other genotypes. The presence of the major alleles in bitter-taste receptor genotypes, including TAS2R4-rs2233998, TAS2R5-rs2227264, TAS2R50-rs1376251, and TAS2R9-rs3741845, were associated with increased FRAP values, TNF-α, IL-1β, unstimulated salivary flow rate, and the number of filled teeth. By contrast, the major alleles of TAS2R4-rs2234001 and TAS2R9-rs3741845 were associated with decreased FRAP, TNF-α, IL-1β, number of missing teeth, and DMFT index.
Carriers of the major G allele within the TAS2R4-rs2234001 genotype had lower TNF-α and IL-1β concentrations. On the other hand, the presence of the major G allele for the TAS2R5-rs2227264 genotype was associated with higher concentrations of TNF-α and IL-β. These significant associations may suggest relevance for bitter-taste receptor genotype in the modulation of innate immunity and inflammatory pathways [29,30,34,37,38,39]. Moreover, the bitter agonist, epicatechin (detected by TAS2R4-rs2234001 and TAS2R5-rs2227264 [53]), may be associated with the modulation of inflammatory pathways [60]. However, further studies are needed to evaluate these associations in oral inflammation. Furthermore, our finding of no significant associations between any inflammatory mediator and TAS2R38 in this cohort agrees with a previous study suggesting TAS2R38 activation did not result in cytokine secretion in the upper respiratory epithelium [61]. Those with the major G allele within the TAS2R4-rs2234001 genotype had lower FRAP concentrations. The reduced total antioxidant capacity of saliva may also be associated with dental caries, which may be due to the increased collection of neutrophils and monocytes in response to pathogenic bacteria followed by accumulation of reactive oxygen species intensification of oxidative stress [62]. Therefore, these associations may be due to the possible role of taste genotypes in innate immunity similar to upper respiratory epithelium [63]. However, the research remains limited with no data regarding the possible role of bitter-taste receptor genotypes in oral innate immunity and possible interactions with the salivary microbiome and the metabolites produced. Moreover, the total antioxidant capacity of saliva can be influenced by numerous factors, including diet and sex [64,65]. Females had lower TAC indicative of hormonal changes [65]. Furthermore, higher FRAP values were related to the presence of the major allele for the TAS2R50-rs1376251 and TAS2R5-rs2227264 genes. These interactions could be due to the potential roles of bitter-taste genes in the regulation of innate immunity and downregulation of inflammatory pathways, but research remains limited. Moreover, increased secretion of unstimulated saliva and inflammatory mediators has been associated with severity of gingival diseases, poor oral hygiene, and development of periodontal disease [66,67,68,69].
The current study found no significant associations between bitter-taste receptor genotypes, clinical salivary markers, and periodontal disease except for unstimulated salivary flow rate. This might be due to the smaller sample size and the examined individuals having good overall health and healthy saliva. The significant correlations between the TAS2R9-rs3741845 and TAS2R50-rs1376251 genotype and the higher unstimulated salivary flow rate found in this cohort might suggest possible roles of TAS2R9 and TAS2R50 genotype in modulating inflammatory pathways, as increased salivary flow is associated with increased inflammation and poor oral hygiene [66]. However, to our knowledge, there are no data to support these possible interactions. Moreover, the salivary flow rate can also be influenced by dietary changes [70]. Thus, changes in dietary factors influenced by genetic variation in taste preferences can also affect the salivary flow rate. Therefore, future studies considering these possible interactions are indicated to understand these associations better.
The presence of major allele for bitter-taste receptor genotypes, including TAS2R4-rs2234001, TAS2R4-rs2233998, and TAS2R9-rs3741845, was associated with DMFT index, the number of filled and missing teeth. These associations might suggest the links between dental caries and bitter taste receptor genotypes as DMFT index, filled and missing teeth, indicate both current and past caries experience [71]. These results support the findings of a previous study stating the links between bitter-taste genes and dental caries; however, the associated SNPs were different to those examined in this study [17]. Moreover, no significant associations were found between TAS2R38 genes and dental caries or any indicator of current/past dental caries experience in this study, unlike the previous research [17]. These associations might be because the present study involved a younger adult cohort and used a multifactorial analysis responsible for the differences in outcomes. Further studies are needed with a larger cohort of older adults to investigate these associations. In prior studies, TAS2R4-rs2234001 and TAS2R9-rs3741845 genotypes were associated with the bitter perception of artificial, non-nutritive sweeteners such as Stevia Acesulfame-K, respectively [72,73], and it has also been found that the artificial sweeteners do not cause dental caries in laboratory experiments [74]. Thus, the associations between the TAS2R4-rs2234001 and higher likelihood of filled teeth could be due to increased bitter perception and dislike for non-nutritive sweeteners and, therefore, avoidance of these substances. However, the correlation between the TAS2R9-rs3741845 genotype and lower number of missing teeth cannot be explained by the same logic. Thus, further studies are needed with a temporal element and dietary habits to explore these relationships. Future studies involving larger cohorts are also needed to define the actual link between bitter-taste receptor genotype and dental caries. Moreover, the research has shown that unstimulated salivary flow rate and inflammatory mediators, including FRAP value, TNF-α, IL-6, and IL-1β concentrations, associate with oral diseases, including dental caries and periodontal disease [66,75,76,77,78,79,80,81]. Therefore, the role of inflammation in oral diseases and interaction with bitter-taste receptor genotype and agonists require further study similar to the previous cell culture studies [38,39].
The study’s cross-sectional design allowed randomised recruitment of participants in the study, which is a strength of the study. Also, unstimulated whole saliva samples were collected using the passive drool method, a better representative of biomarkers in saliva than the stimulated samples or other saliva collection methods [82,83]. However, due to COVID-19, social distancing, and a mandatory mouthwash-use protocol for all patients attending the oral clinic, recruitment was disrupted. Thus, small sample size is a limitation of this study. Moreover, most participants were female, and BMI distribution was normal, which might not be truly representative of the general Australian population. However, the data still help inform and rationalise future studies with a more representative sample of the general population with a balanced distribution of gender and BMI.

5. Conclusions

This study is the first to examine the relationships between bitter-taste receptor genotype, oral health outcomes, and inflammatory markers of oral health. Results show that limited associations were found between the bitter-taste receptor genotypes and oral health outcomes, and salivary biomarkers. Nevertheless, there were significant correlations between the bitter-taste receptor genotypes and markers of oral inflammation. These might be due to the recruitment of a relatively younger and overall healthy cohort. Most oral inflammatory diseases, including periodontal disease, manifest at later life stages and with increased severity. Therefore, this study should be repeated with an elderly cohort to address this question. Although the current results may indicate the possible risk/or protective action of the bitter genotypes against oral diseases, this cannot be determined based on the findings of this study. Future longitudinal studies with larger cohorts and a temporal element are needed to study these relationships extensively. Also, therapeutic aids for blocking the inflammatory mediators have been proposed to prevent periodontal disease [81]. Thus, future studies are recommended to study the link between bitter-taste receptor genotypes and oral inflammatory mediators to identifying the population/groups at risk for certain diseases and develop novel therapeutic aids targeting oral inflammatory diseases, including periodontal disease.

Supplementary Materials

The following are available online at https://0-www-mdpi-com.brum.beds.ac.uk/article/10.3390/oral1020013/s1. Figure S1. Relationship between bitter taste genotypes and missing teeth, Least-square adjusted means for (A) age, sex, income, education, and smoking status (B) Age, sex, income, education, smoking status and the dietary index; Significant p-values are represented as asterisks * ≤ 0.05, ** ≤ 0.01, *** ≤ 0.001, **** ≤ 0.0001 and ns-non-significant; Error bars mark 95% confidence intervals. Figure S2. Relationship between bitter taste genotypes and Filled teeth, Least-square adjusted means for (A) age, sex, income, education, and smoking status (B) age, sex, income, education, smoking status and the dietary index; Significant p-values are represented as asterisks ** ≤ 0.01, Error bars mark 95% confidence intervals. Figure S3. Relationship between bitter taste genotypes and salivary flow rate (mL/min), Least-square adjusted means (age, sex, income, education, and smoking status); (A) TAS2R9-rs3741845 (B) TAS2R50-rs1376251 Significant p-values are represented as asterisks * ≤ 0.05, ** ≤ 0.01, *** ≤ 0.001, **** ≤ 0.0001 and ns-non-significant; Error bars mark 95% confidence intervals. Figure S4. Relationship between bitter taste genotypes and FRAP (μmoles/L), Least-square adjusted means (age, sex, income, education, and smoking status) (A) TAS2R4-rs2234001, (B) TAS2R5-rs2227264, (C) TAS2R50-rs1376251. Least-square adjusted means (age, sex, income, education, smoking status and the dietary index) (D) TAS2R4-rs2234001,) (E) TAS2R5-rs2227264,) (F) TAS2R50-rs1376251. Significant p-values are represented as asterisks * ≤ 0.05, ** ≤ 0.01; Error bars mark 95% confidence intervals. Figure S5. Relationship between bitter taste genotypes and TNF-α (pg/mL), Least-square adjusted means (age, sex, income, education, and smoking status) (A) TAS2R4-rs2234001, (B) TAS2R5-rs2227264. Least-square adjusted means (age, sex, income, education, smoking status and the dietary index) (C) TAS2R4-rs2234001, (D) TAS2R5-rs2227264; Significant p-values are represented as asterisks **** ≤ 0.0001; Error bars mark 95% confidence intervals.

Author Contributions

Conceptualization, E.L.B., D.S., and J.W.; methodology K.K., E.L.B., D.S., J.W., and A.T.; formal analysis, K.K., E.L.B., A.T., and P.J.; investigation, K.K., E.L.B., A.T., and P.J.; resources, M.L. and M.V.; data curation, K.K., E.L.B., A.T., and P.J.; writing—original draft preparation, K.K. and E.L.B.; writing—review and editing, K.K., E.L.B., A.T., P.J., M.L., M.V., D.S., and J.W.; supervision, E.L.B., M.L., M.V., D.S., and J.W. All authors have read and agreed to the published version of the manuscript.

Funding

Emma Beckett received funding from the National Health and Medical Research Council.

Institutional Review Board Statement

The study was conducted according to the guidelines of the Declaration of Helsinki and approved by the Human Research Ethics Committee (HREC), University of Newcastle, Australia (approval number H-2019-0200).

Informed Consent Statement

Informed consent was obtained from all subjects involved in the study.

Data Availability Statement

Data is available upon request, providing ethical considerations are met.

Acknowledgments

We would like to express our special thanks of gratitude to the entire oral health therapy staff and students at the University of Newcastle, Central Coast campus, for collection of samples. Also, many thanks to all participants who took part in the study and enabled this research to be possible.

Conflicts of Interest

The authors declare no conflict of interest.

References

  1. Kassebaum, N.J.; Smith, A.G.C.; Bernabé, E.; Fleming, T.D.; Reynolds, A.E.; Vos, T.; Murray, C.J.L.; Marcenes, W. Global, Regional, and National Prevalence, Incidence, and Disability-Adjusted Life Years for Oral Conditions for 195 Countries, 1990–2015: A Systematic Analysis for the Global Burden of Diseases, Injuries, and Risk Factors. J. Dent. Res. 2017, 96, 380–387. [Google Scholar] [CrossRef] [PubMed]
  2. Disease, G.B.D.; Injury, I.; Prevalence, C. Global, Regional, and National Incidence, Prevalence, and Years Lived with Disability for 354 Diseases and Injuries for 195 Countries and Territories, 1990–2017: A Systematic Analysis for the Global Burden of Disease Study 2017. Lancet 2018, 392, 1789–1858. [Google Scholar] [CrossRef] [Green Version]
  3. AIHW. Oral Health and Dental Care in Australia; AIHW: Canberra, Australia, 2020. [Google Scholar]
  4. Griffin, S.O.; Jones, J.A.; Brunson, D.; Griffin, P.M.; Bailey, W.D. Burden of Oral Disease among Older Adults and Implications for Public Health Priorities. Am. J. Public Health 2012, 102, 411–418. [Google Scholar] [CrossRef] [PubMed]
  5. Peres, M.A.; Macpherson, L.M.D.; Weyant, R.J.; Daly, B.; Venturelli, R.; Mathur, M.R.; Listl, S.; Celeste, R.K.; Guarnizo-Herreño, C.C.; Kearns, C.; et al. Oral Diseases: A Global Public Health Challenge. Lancet 2019, 394, 249–260. [Google Scholar] [CrossRef]
  6. Jamieson, L.M.; Paradies, Y.C.; Gunthorpe, W.; Cairney, S.J.; Sayers, S.M. Oral Health and Social and Emotional Well-being in a Birth Cohort of Aboriginal Australian Young Adults. BMC Public Health 2011, 11, 656. [Google Scholar] [CrossRef] [Green Version]
  7. Savoca, M.R.; Arcury, T.A.; Leng, X.; Chen, H.; Bell, R.A.; Anderson, A.M.; Kohrman, T.; Frazier, R.J.; Gilbert, G.H.; Quandt, S.A. Severe Tooth Loss in Older Adults as a Key Indicator of Compromised Dietary Quality. Public Health Nutr. 2010, 13, 466–474. [Google Scholar] [CrossRef] [PubMed] [Green Version]
  8. Chapple, I.L.; Genco, R. Diabetes and Periodontal Diseases: Consensus Report of the Joint EFP/AAP Workshop on Periodontitis and Systemic Diseases. J. Periodontol. 2013, 84, S106–S112. [Google Scholar] [CrossRef] [PubMed]
  9. Ide, M.; Papapanou, P.N. Epidemiology of Association between Maternal Periodontal Disease and Adverse Pregnancy Outcomes—Systematic Review. J. Periodontol. 2013, 84, S181–S194. [Google Scholar] [CrossRef]
  10. Humphrey, L.L.; Fu, R.; Buckley, D.I.; Freeman, M.; Helfand, M. Periodontal Disease and Coronary Heart Disease Incidence: A Systematic Review and Meta-analysis. J. Gen. Intern. Med. 2008, 23, 2079–2086. [Google Scholar] [CrossRef] [PubMed] [Green Version]
  11. Sanz, M.; D’Aiuto, F.; Deanfield, J.; Fernandez-Avilés, F. European Workshop in Periodontal Health and Cardiovascular Disease—Scientific Evidence on the Association between Periodontal and Cardiovascular Diseases: A Review of the Literature. Eur. Heart J. Suppl. 2010, 12, B3–B12. [Google Scholar] [CrossRef]
  12. Lamster, I.B.; Lalla, E.; Borgnakke, W.S.; Taylor, G.W. The Relationship between Oral Health and Diabetes Mellitus. J. Am. Dent. Assoc. 2008, 139, 19S–24S. [Google Scholar] [CrossRef] [PubMed] [Green Version]
  13. Pazos, P.; Leira, Y.; Domínguez, C.; Pías-Peleteiro, J.M.; Blanco, J.; Aldrey, J.M. Association between Periodontal Disease and Dementia: A Literature Review. Neurologia 2018, 33, 602–613. [Google Scholar] [CrossRef] [PubMed]
  14. AlJehani, Y.A. Risk Factors of Periodontal Disease: Review of the Literature. Int. J. Dent. 2014, 2014, 182513. [Google Scholar] [CrossRef] [PubMed] [Green Version]
  15. Najeeb, S.; Zafar, M.S.; Khurshid, Z.; Zohaib, S.; Almas, K. The Role of Nutrition in Periodontal Health: An Update. Nutrients 2016, 8, 530. [Google Scholar] [CrossRef] [PubMed]
  16. Kaur, K.; Sculley, D.; Wallace, J.; Turner, A.; Ferraris, C.; Veysey, M.; Lucock, M.; Beckett, E.L. Micronutrients and Bioactive Compounds in Oral Inflammatory Diseases. J. Nutr. Intermed. Metab. 2019, 18, 100105. [Google Scholar] [CrossRef]
  17. Wendell, S.; Wang, X.; Brown, M.; Cooper, M.E.; DeSensi, R.S.; Weyant, R.J.; Crout, R.; McNeil, D.W.; Marazita, M.L. Taste Genes Associated with Dental Caries. J. Dent. Res. 2010, 89, 1198–1202. [Google Scholar] [CrossRef] [PubMed]
  18. Leone, C.W.; Oppenheim, F.G. Physical and Chemical Aspects of Saliva as Indicators of Risk for Dental Caries in Humans. J. Dent. Educ. 2001, 65, 1054–1062. [Google Scholar] [CrossRef]
  19. Syrjälä, A.M.; Raatikainen, L.; Komulainen, K.; Knuuttila, M.; Ruoppi, P.; Hartikainen, S.; Sulkava, R.; Ylöstalo, P. Salivary Flow Rate and Periodontal Iinfection-a Study among Subjects Aged 75 Years or Older. Oral Dis. 2011, 17, 387–392. [Google Scholar] [CrossRef]
  20. Sculley, D.; Langley-Evans, S. Salivary Antioxidants and Periodontal Disease Status. Proc. Nutr. Soc. 2002, 61, 137–143. [Google Scholar] [CrossRef] [Green Version]
  21. Preethi, B.P.; Reshma, D.; Anand, P. Evaluation of Flow Rate, pH, Buffering Capacity, Calcium, Total Proteins and Total Antioxidant Capacity Levels of Saliva in Caries Free and Caries Active Children: An In Vivo Study. Indian J. Clin. Biochem. 2010, 25, 425–428. [Google Scholar] [CrossRef] [Green Version]
  22. Animireddy, D.; Reddy Bekkem, V.T.; Vallala, P.; Kotha, S.B.; Ankireddy, S.; Mohammad, N. Evaluation of pH, Buffering Capacity, Viscosity and Flow Rate Levels of Saliva in Caries-free, Minimal Caries and Nursing Caries Children: An in Vivo Study. Contemp. Clin. Dent. 2014, 5, 324–328. [Google Scholar] [CrossRef]
  23. Pan, W.; Wang, Q.; Chen, Q. The Cytokine Network Involved in the Host Immune Response to Periodontitis. Int. J. Oral Sci. 2019, 11, 30. [Google Scholar] [CrossRef] [Green Version]
  24. Feeney, E.; O’Brien, S.; Scannell, A.; Markey, A.; Gibney, E.R. Genetic Variation in Taste Perception: Does it have a Role in Healthy Eating? Proc. Nutr. Soc. 2011, 70, 135–143. [Google Scholar] [CrossRef] [Green Version]
  25. Yildiz, G.; Ermis, R.B.; Calapoglu, N.S.; Celik, E.U.; Türel, G.Y. Gene-environment Interactions in the Etiology of Dental Caries. J. Dent. Res. 2016, 95, 74–79. [Google Scholar] [CrossRef] [PubMed]
  26. Lin, B.P. Caries Experience in Children with Various Genetic Sensitivity Levels to the Bitter Taste of 6-n-propylthiouracil (PROP): A Pilot Study. Pediatr. Dent. 2003, 25, 37–42. [Google Scholar]
  27. Furquim, T.R.; Poli-Frederico, R.C.; Maciel, S.M.; Gonini-Júnior, A.; Walter, L.R. Sensitivity to Bitter and Sweet Taste Perception in Schoolchildren and Their Relation to Dental Caries. Oral Health Prev. Dent. 2010, 8, 253–259. [Google Scholar] [PubMed]
  28. Pidamale, R.; Sowmya, B.; Thomas, A.; Jose, T. Genetic Sensitivity to Bitter Taste of 6-n Propylthiouracil: A Useful Diagnostic Aid to Detect Early Childhood Caries in Pre-school Children. Indian J. Hum. Genet. 2012, 18, 101–105. [Google Scholar] [CrossRef] [PubMed] [Green Version]
  29. Orsmark-Pietras, C.; James, A.; Konradsen, J.R.; Nordlund, B.; Söderhäll, C.; Pulkkinen, V.; Pedroletti, C.; Daham, K.; Kupczyk, M.; Dahlén, B.; et al. Transcriptome Analysis Reveals Upregulation of Bitter Taste Receptors in Severe Asthmatics. Eur. Respir. J. 2013, 42, 65. [Google Scholar] [CrossRef] [PubMed] [Green Version]
  30. Welcome, M.O. The Bitterness of Genitourinary Infections: Properties, Ligands of Genitourinary Bitter Taste Receptors and Mechanisms Linking Taste Sensing to Inflammatory Processes in the Genitourinary Tract. Eur. J. Obstet. Gynecol. Reprod. Biol. 2020, 247, 101–110. [Google Scholar] [CrossRef]
  31. Tizzano, M.; Gulbransen, B.D.; Vandenbeuch, A.; Clapp, T.R.; Herman, J.P.; Sibhatu, H.M.; Churchill, M.E.A.; Silver, W.L.; Kinnamon, S.C.; Finger, T.E. Nasal Chemosensory Cells Use Bitter Taste Signaling to Detect Irritants and Bacterial Signals. Proc. Natl. Acad. Sci. USA 2010, 107, 3210. [Google Scholar] [CrossRef] [PubMed] [Green Version]
  32. Saunders, C.J.; Christensen, M.; Finger, T.E.; Tizzano, M. Cholinergic Neurotransmission Links Solitary Chemosensory Cells to Nasal Inflammation. Proc. Natl. Acad. Sci. USA 2014, 111, 6075. [Google Scholar] [CrossRef] [PubMed] [Green Version]
  33. Sharma, P.; Yi, R.; Nayak, A.P.; Wang, N.; Tang, F.; Knight, M.J.; Pan, S.; Oliver, B.; Deshpande, D.A. Bitter Taste Receptor Agonists Mitigate Features of Allergic Asthma in Mice. Sci. Rep. 2017, 7, 46166. [Google Scholar] [CrossRef] [PubMed]
  34. Kok, B.P.; Galmozzi, A.; Littlejohn, N.K.; Albert, V.; Godio, C.; Kim, W.; Kim, S.M.; Bland, J.S.; Grayson, N.; Fang, M.; et al. Intestinal Bitter Taste Receptor Activation Alters Hormone Secretion and Imparts Metabolic Benefits. Mol. Metab. 2018, 16, 76–87. [Google Scholar] [CrossRef]
  35. Patel, N.N.; Workman, A.D.; Cohen, N.A. Role of Taste Receptors as Sentinels of Innate Immunity in the Upper Airway. J. Pathog. 2018, 2018, 9541987. [Google Scholar] [CrossRef] [PubMed] [Green Version]
  36. Carey, R.M.; Adappa, N.D.; Palmer, J.N.; Lee, R.J.; Cohen, N.A. Taste Receptors: Regulators of Sinonasal Innate Immunity. Laryngoscope Investig. Otolaryngol. 2016, 1, 88–95. [Google Scholar] [CrossRef]
  37. Gil, S.; Coldwell, S.; Drury, J.L.; Arroyo, F.; Phi, T.; Saadat, S.; Kwong, D.; Chung, W.O. Genotype-specific Regulation of Oral Innate Immunity by T2R38 Taste Receptor. Mol. Immunol. 2015, 68, 663–670. [Google Scholar] [CrossRef] [Green Version]
  38. Tiroch, J.; Sterneder, S.; Di Pizio, A.; Lieder, B.; Hoelz, K.; Holik, A.-K.; Pignitter, M.; Behrens, M.; Somoza, M.; Ley, J.P.; et al. Bitter Sensing TAS2R50 Mediates the Trans-Resveratrol-Induced Anti-inflammatory Effect on Interleukin 6 Release in HGF-1 Cells in Culture. J. Agric. Food Chem. 2021. [Google Scholar] [CrossRef]
  39. Medapati, M.R.; Singh, N.; Bhagirath, A.Y.; Duan, K.; Triggs-Raine, B.; Batista, E.L., Jr.; Chelikani, P. Bitter Taste Receptor T2R14 Detects Quorum Sensing Molecules from Cariogenic Streptococcus Mutans and Mediates Innate Immune Responses in Gingival Epithelial Cells. FASEB J. 2021, 35, e21375. [Google Scholar] [CrossRef]
  40. Feng, P.; Jyotaki, M.; Kim, A.; Chai, J.; Simon, N.; Zhou, M.; Bachmanov, A.A.; Huang, L.; Wang, H. Regulation of Bitter Taste Responses by Tumor Necrosis Factor. Brain Behav. Immun. 2015, 49, 32–42. [Google Scholar] [CrossRef] [Green Version]
  41. Paxton, A.E.; Strycker, L.A.; Toobert, D.J.; Ammerman, A.S.; Glasgow, R.E. Starting The Conversation: Performance of a Brief Dietary Assessment and Intervention Tool for Health Professionals. Am. J. Prev. Med. 2011, 40, 67–71. [Google Scholar] [CrossRef]
  42. Isohelix. Instructions for Use of Isohelix SK-1S/MS-01 Buccal Swabs. Available online: https://isohelix.com/wp-content/uploads/2020/06/ROW-SK-1S-and-MS-01-instructions-June-2019.pdf (accessed on 1 June 2019).
  43. Salimetrics. Collection Methods: Passive Drool Using the Saliva Collection Aid. Available online: https://salimetrics.com/wp-content/uploads/2018/02/passive-drool-saliva-collection-instructions.pdf (accessed on 1 June 2019).
  44. Salimetrics. Salimetrics Collection Handbook. Available online: https://salimetrics.com/saliva-collection-handbook/ (accessed on 1 June 2019).
  45. GC America Corporation, Saliva-Check BUFFER Testing Mat. Available online: http://www.gcamerica.com/products/preventive/Saliva_Check_BUFFER/Saliva_Check_TestingMat.pdf (accessed on 1 June 2019).
  46. WHO. Mean Number of Decayed, Missing, and Filled Permanent Teeth (Mean DMFT) among the 12-year-old Age Group. Available online: https://www.who.int/data/gho/indicator-metadata-registry/imr-details/3812 (accessed on 1 December 2020).
  47. Primal, K.S.; Esther, S.R.; Boehm, T.K. Periodontal Screening and Recording (PSR) Index Scores Predict Periodontal Diagnosis. J. Dent. Appl. 2014, 1, 8–12. [Google Scholar]
  48. Landry, R.G.; Jean, M. Periodontal Screening and Recording (PSR) Index: Precursors, Utility and Limitations in a Clinical Setting. Int. Dent. J. 2002, 52, 35–40. [Google Scholar] [CrossRef] [PubMed]
  49. Benzie, I.F.; Strain, J.J. The Ferric Reducing Ability of Plasma (FRAP) as a Measure of “Antioxidant Power”: The FRAP Assay. Anal. Biochem. 1996, 239, 70–76. [Google Scholar] [CrossRef] [PubMed] [Green Version]
  50. Salimetrics. Salimetrics IL-1β ELISA Kit. Available online: https://salimetrics.com/wp-content/uploads/2018/03/il-1-beta-saliva-elisa-kit.pdf (accessed on 1 April 2020).
  51. Isohelix. Instructions for Isohelix Xtreme DNA Kit: XME-5/50. Available online: https://isohelix.com/wp-content/uploads/2020/06/XME-5-50-Xtreme-DNA-kit-Instructions-FD-PK-Version-Dec-2017.pdf (accessed on 1 June 2019).
  52. ThermoFisher. TaqMan® SNP Genotyping Assays USER GUIDE. Available online: https://assets.thermofisher.com/TFS-Assets/LSG/manuals/4454239_IntrotoGeneEx_GSG.pdf (accessed on 1 December 2019).
  53. Turner, A.; Veysey, M.; Keely, S.; Scarlett, C.J.; Lucock, M.; Beckett, E.L. Genetic Variation in the Bitter Receptors Responsible for Epicatechin Detection Are Associated with BMI in an Elderly Cohort. Nutrients 2021, 13, 571. [Google Scholar] [CrossRef] [PubMed]
  54. Winn, D.M. Tobacco Use and Oral Disease. J. Dent. Educ. 2001, 65, 306–312. [Google Scholar] [CrossRef]
  55. Moynihan, P. The Interrelationship between Diet and Oral Health. Proc. Nutr. Soc. 2005, 64, 571–580. [Google Scholar] [CrossRef] [Green Version]
  56. Rheu, G.B.; Ji, S.; Ryu, J.J.; Lee, J.B.; Shin, C.; Lee, J.Y.; Huh, J.B.; Shin, S.W. Risk Assessment for Clinical Attachment Loss of Periodontal Tissue in Korean Adults. J. Adv. Prosthodont. 2011, 3, 25–32. [Google Scholar] [CrossRef]
  57. Hodge, P.; Binnie, V. Smoking Cessation and Periodontal Health—A Missed Opportunity? Evid. Based Dent. 2009, 10, 18–19. [Google Scholar] [CrossRef] [PubMed]
  58. Hernández-Palacios, R.D.; Ramírez-Amador, V.; Jarillo-Soto, E.C.; Irigoyen-Camacho, M.E.; Mendoza-Núñez, V.M. Relationship between Gender, Income and Education and Self-perceived Oral Health among Elderly Mexicans. An Exploratory Study. Ciência Saúde Coletiva 2015, 20, 997–1004. [Google Scholar] [CrossRef] [Green Version]
  59. Sabbah, W.; Tsakos, G.; Sheiham, A.; Watt, R.G. The Effects of Income and Education on Ethnic Differences in Oral Health: A Study in US Adults. J. Epidemiol. Community Health 2009, 63, 516. [Google Scholar] [CrossRef]
  60. Bettaieb, A.; Cremonini, E.; Kang, H.; Kang, J.; Haj, F.G.; Oteiza, P.I. Anti-inflammatory Actions of (-)-epicatechin in the Adipose Tissue of Obese Mice. Int. J. Biochem. Cell Biol. 2016, 81, 383–392. [Google Scholar] [CrossRef] [Green Version]
  61. Lee, R.J.; Xiong, G.; Kofonow, J.M.; Chen, B.; Lysenko, A.; Jiang, P.; Abraham, V.; Doghramji, L.; Adappa, N.D.; Palmer, J.N.; et al. T2R38 Taste Receptor Polymorphisms Underlie Susceptibility to Upper Respiratory Infection. J. Clin. Investig. 2012, 122, 4145–4159. [Google Scholar] [CrossRef] [PubMed] [Green Version]
  62. Krawczyk, D.; Błaszczak, J.; Borowicz, J.; Mielnik-Błaszczak, M. Life Style and Risk of Development of Dental Caries in a Population of Adolescents. Ann. Agric. Environ. Med. 2014, 21, 576–580. [Google Scholar] [CrossRef] [PubMed] [Green Version]
  63. Hariri, B.M.; Cohen, N.A. New Insights into Upper Airway Innate Immunity. Am. J. Rhinol. Allergy 2016, 30, 319–323. [Google Scholar] [CrossRef] [PubMed] [Green Version]
  64. Hegde, M.; Hegde, N.; Ashok, A.; Shetty, S. Evaluation of Total Antioxidant Capacity of Saliva and Serum in Caries-free and Caries-active Adults: An in-Vivo Study. Indian J. Dent. Res. 2013, 24, 164–167. [Google Scholar] [CrossRef]
  65. Ahmadi-Motamayel, F.; Goodarzi, M.T.; Hendi, S.S.; Kasraei, S.; Moghimbeigi, A. Total Antioxidant Capacity of Saliva and Dental Caries. Med. Oral Patol. Oral Cir. Bucal 2013, 18, e553–e556. [Google Scholar] [CrossRef]
  66. Idrees, M.; Nassani, M.; Kujan, O. Assessing the Association between Unstimulated Whole Salivary Flow Rate (UWSFR) and Oral Health Status among Healthy Adult Subjects: A Cross-sectional Study. Med. Oral Patol. Oral Cir. Bucal 2018, 23, e384–e390. [Google Scholar] [CrossRef]
  67. Sinor, Z.; Azirrawani, A. Association between Salivary Parameters and Periodontal. Int. Med. J. 2013, 20, 1–5. [Google Scholar]
  68. Rajesh, K.S.; Zareena, H.S.; Arun Kumar, M.S. Assessment of Salivary Calcium, Phosphate, Magnesium, pH, and Flow Rate in Healthy Subjects, Periodontitis, and Dental Caries. Contemp. Clin. Dent. 2015, 6, 461–465. [Google Scholar] [CrossRef]
  69. Yucel Lindberg, T.; Båge, T. Inflammatory Mediators in the Pathogenesis of Periodontitis. Expert Rev. Mol. Med. 2013, 15, e7. [Google Scholar] [CrossRef] [Green Version]
  70. Jain, S.; Bansal, K.; Marwaha, M.; Sehrawat, N.; Singla, S. Effect of Diet Modification on Salivary Parameters and Oratest in High-caries-risk Individuals. Int. J. Clin. Pediatr. Dent. 2018, 11, 34–39. [Google Scholar] [CrossRef] [PubMed]
  71. Shulman, J.D.; Cappelli, D.P. Chapter 1-Epidemiology of Dental Caries. In Prevention in Clinical Oral Health Care; Cappelli, D.P., Mobley, C.C., Eds.; Mosby: Saint Louis, MO, USA, 2008; pp. 2–13. [Google Scholar] [CrossRef]
  72. Methven, L.; Ellis, L.; Kavaliauskaite, G. Investigating Perception and Liking of Non-nutritiven Sweeteners in Individuals Representing Different Taste Receptor Genotypes. In Proceedings of the 15th Weurman Flavour Research Symposium, Graz, Austria, 18–22 September 2017; pp. 193–198. [Google Scholar] [CrossRef]
  73. Allen, A.L.; McGeary, J.E.; Hayes, J.E. Rebaudioside A and Rebaudioside D Bitterness do not Covary with Acesulfame K Bitterness or Polymorphisms in TAS2R9 and TAS2R31. Chemosens. Percept. 2013, 6, 109–117. [Google Scholar] [CrossRef] [PubMed] [Green Version]
  74. Rezaei-Soufi, L.; Raedi, S.; Alikhani, M.; Vahdatinia, F.; Farazyani, A.; Hosseini, S.M.; Jazaeri, M. Comparison the Effect of Stevia Extract with Glucose and Fructose on Dental Enamel Caries Formation. J. Chem. Pharm. Sci. 2016, 9, 685–689. [Google Scholar]
  75. Rai, K.; Hegde, A.M.; Jose, N. Salivary Antioxidants and Oral Health in Children with Autism. Arch. Oral Biol. 2012, 57, 1116–1120. [Google Scholar] [CrossRef]
  76. Ahmadi-Motamayel, F.; Goodarzi, M.T.; Jamshidi, Z.; Kebriaei, R. Evaluation of Salivary and Serum Antioxidant and Oxidative Stress Statuses in Patients with Chronic Periodontitis: A Case-Control Study. Front. Physiol. 2017, 8, 189. [Google Scholar] [CrossRef] [Green Version]
  77. Zhang, T.; Andrukhov, O.; Haririan, H.; Müller-Kern, M.; Liu, S.; Liu, Z.; Rausch-Fan, X. Total Antioxidant Capacity and Total Oxidant Status in Saliva of Periodontitis Patients in Relation to Bacterial Load. Front. Cell Infect. Microbiol. 2015, 5, 97. [Google Scholar] [CrossRef]
  78. Vahabi, S.; Sattari, M.; Taheraslani, M.; Bagheban, A. Correlation between Interleukin-42, Interleukin-6 and Tumor Necrosis Factor 0± and Clinical Parameters in Chronic and Aggressive Periodontal Disease. J. Periodontol. Implant. Dent. 2012, 3, 51–56. [Google Scholar]
  79. Batool, H.; Nadeem, A.; Kashif, M.; Shahzad, F.; Tahir, R.; Afzal, N. Salivary Levels of IL-6 and IL-17 Could Be an Indicator of Disease Severity in Patients with Calculus Associated Chronic Periodontitis. BioMed Res. Int. 2018, 2018, 8531961. [Google Scholar] [CrossRef] [Green Version]
  80. Irwin, C.R.; Myrillas, T.T. The Role of IL-6 in the Pathogenesis of Periodontal Disease. Oral Dis. 1998, 4, 43–47. [Google Scholar] [CrossRef]
  81. Cheng, R.; Wu, Z.; Li, M.; Shao, M.; Hu, T. Interleukin-1β is a Potential Therapeutic Target for Periodontitis: A Narrative Review. Int. J. Oral Sci. 2020, 12, 2. [Google Scholar] [CrossRef] [Green Version]
  82. Williamson, S.; Munro, C.; Pickler, R.; Grap, M.J.; Elswick, R.K. Comparison of Biomarkers in Blood and Saliva in Healthy Adults. Nurs. Res. Pract. 2012, 2012, 246178. [Google Scholar] [CrossRef] [PubMed]
  83. Munro, C.L.; Grap, M.J.; Jablonski, R.; Boyle, A. Oral Health Measurement in Nursing Research: State of the Science. Biol. Res. Nurs. 2006, 8, 35–42. [Google Scholar] [CrossRef] [PubMed] [Green Version]
Figure 1. Relationship between bitter-taste receptor genotypes and salivary flow rate (mL/min), unadjusted means (A) TAS2R4-rs2233998, (B) TAS2R4-rs2234001, (C) TAS2R5-rs2227264, (D) TAS2R9-rs3741845, (E) TAS2R38-rs713598, (F) TAS2R50-rs1376251; Salivary flow a, Unstimulated salivary flow rate; Significant p-values are represented as asterisks * ≤ 0.05, and ns (non-significant); Error bars mark 95% confidence intervals.
Oral 01 00013 g001
Figure 2. Relationship between bitter-taste receptor genotypes and FRAP values (μmoles/L), unadjusted means (A) TAS2R4-rs2233998, (B) TAS2R4-rs2234001, (C) TAS2R5-rs2227264, (D) TAS2R9-rs3741845, (E) TAS2R38-rs713598, (F) TAS2R50-rs1376251; Significant p-values are represented as asterisks ** ≤ 0.01, *** ≤ 0.001, and ns (non-significant); Error bars mark 95% confidence intervals.
Oral 01 00013 g002
Figure 3. Relationship between bitter-taste receptor genotypes and TNF-α (pg/mL), unadjusted means (A) TAS2R4-rs2233998, (B) TAS2R4-rs2234001, (C) TAS2R5-rs2227264, (D) TAS2R9-rs3741845, (E) TAS2R38-rs713598, (F) TAS2R50-rs1376251; Significant p-values are represented as asterisks **** ≤ 0.0001, and ns (non-significant); Error bars mark 95% confidence intervals.
Oral 01 00013 g003
Figure 4. Relationship between bitter-taste receptor genotypes and IL-1β (pg/mL), unadjusted means (A) TAS2R4-rs2233998, (B) TAS2R4-rs2234001, (C) TAS2R5-rs2227264, (D) TAS2R9-rs3741845, (E) TAS2R38-rs713598, (F) TAS2R50-rs1376251; Significant p-values are represented as asterisks * ≤ 0.05, and ns (non-significant); Error bars mark 95% confidence intervals.
Oral 01 00013 g004
Figure 5. Relationship between bitter-taste receptor genotypes and IL-6 (pg/mL), unadjusted means (A) TAS2R4-rs2233998, (B) TAS2R4-rs2234001, (C) TAS2R5-rs2227264, (D) TAS2R9-rs3741845, (E) TAS2R38-rs713598, (F) TAS2R50-rs1376251; Non-significant p-values are represented as ns (non-significant); Error bars mark 95% confidence intervals.
Oral 01 00013 g005
Table 1. Distribution of continuous variables (n = 65).
VariablesDistribution (Mean ± SD)
Age (years)36.72 ± 15.17
Body mass index (BMI)24.25 ± 5.89
Dietary index17.97 ± 2.18
Table 2. Distribution of categorical variables (n = 65).
VariableDistribution (n, %)
Sex
Females59 (90.77%)
Males6 (9.23%)
Income
<$20,00018 (30.00%)
$20,000–$60,00020 (33.33%)
$60,000–$100,0009 (15.00%)
>$100,00013 (21.67%)
Education
≤Year 12 or equivalent16 (26.23%)
Bachelor’s degree18 (29.51%)
TAFE or technical qualification21 (34.43%)
Post-graduate degree6 (9.84%)
BMI Status
Underweight2 (0.04%)
Normal41 (71.93%)
Overweight5 (0.09%)
Obese9 (0.16%)
Smoking Status
Never47 (78.33%)
Ever13 (21.67%)
Table 3. Genotypic distribution of bitter-taste genes (presence of major allele).
Gene/SNPMajor/Minor AlleleMAF% Major Allele Presence
TAS2R4-rs2233998T/C0.4271.19
TAS2R4rs2234001G/C0.4867.24
TAS2R5-rs2227264G/T0.4471.67
TAS2R9-rs3741845G/A0.4977.05
TAS2R38-rs713598C/G0.4680.70
TAS2R50-rs1376251C/T0.2981.67
SNP, single nucleotide polymorphism; MAF, minor allele frequency (TOPMED).
Table 4. Distribution of continuous outcome variables.
VariablesDistribution (Mean ± SD)
FRAP value (μmoles/L)0.76 ± 0.24
TNF-α (pg/mL)3.67 ± 5.03
IL-1β (pg/mL)12.28 ± 13.34
IL-6 (pg/mL)0.68 ± 1.22
Salivary flow rate a (mL/min)0.28 ± 0.22
DMFT Index7.23 ± 7.22
Dental caries0.66 ± 1.76
Missing teeth2.82 ± 4.28
Filled teeth3.80 ± 4.41
Highest PSR Score1.87 ± 0.97
FRAP, ferric reducing antioxidant power; TNF-α, tumour necrosis factor-alpha; IL-1β, interleukin 1-beta; IL-6, interleukin-6; Salivary a, unstimulated saliva; DMFT Index, decayed, missing, and filled teeth index; Highest PSR score, highest periodontal screening and recording score in any sextant.
Table 5. Distribution of categorical outcome variables.
VariableDistribution (n, %)
Hydration a
<30 s35 (70.00%)
>30 s15 (30.00%)
Viscosity of saliva
Frothy/Bubbly13 (26.00%)
Watery/Clear37 (74.00%)
pH (Unstimulated saliva)
6.0–6.69 (17.65%)
6.8–7.842 (82.35%)
Quantity (Stimulated saliva)
<5 mL4 (8.00%)
>5 mL46 (92.00%)
pH (Stimulated saliva)
6.0–6.67 (14.00%)
6.8–7.843 (86.00%)
Buffering capacity
6–9 points8 (16.00%)
10–12 points42 (84.00%)
Dental Caries
Yes10 (16.39%)
No51 (83.61%)
Missing teeth
Yes33 (55.00%)
No27 (45.00%)
Filled teeth
Yes45 (73.77%)
No16 (26.23%)
Periodontal disease b
Yes54 (91.53%)
No5 (8.48%)
Hydration a, visual assessment of saliva production (resting flow rate); Periodontal disease b, any periodontal disease, including gingivitis (localised/generalised) and acute or chronic periodontitis (mild/severe).
Table 6. Relationships between bitter-taste receptor genotypes and oral health outcomes.
LS Means a
(95% CI)
pLS Means a
(95% CI)
pLS Means a
(95% CI)
pLS Means a
(95% CI)
pLS Means a
(95% CI)
pLS Means a
(95% CI)
p
TAS2R4-
rs2233998
Major Allele
TAS2R4-
rs2234001
Major Allele
TAS2R5-
rs2227264
Major allele
TAS2R9-
rs3741845
Major allele
TAS2R38-
rs713598
Major allele
TAS2R50-
rs1376251
Major allele
+ + + + + +
DMFT11.05
(2.91–
19.1)
5.04
(−4.18–
14.27)
0.4−0.08
(−10.11–9.94)
16.18
(8.28–
24.07)
0.0511.69
(0.86–
22.53)
4.39
(−7.33–
16.13)
0.55.79
(2.59–
8.99)
10.30
(4.57–
16.04)
0.19.47
(5.97–
12.98)
6.62
(0.78–
12.46)
0.38.19
(4.77–
11.62)
7.89
(2.25–
13.55)
0.9
Dental caries−0.33
(−2.25–1.60)
1.04
(−1.15–
3.22)
0.50.59
(−1.78–
2.97)
0.12
(−1.75–
1.99)
0.80.63
(−1.93–
3.20)
0.08
(−2.69–
2.8)
0.80.76
(0.01–
1.53)
−0.05
(−1.41–
1.30)
0.20.20
(−0.63–
1.03)
0.51
(−0.87–
1.89)
0.70.63
(−0.18–
1.45)
0.08
(−1.26–1.42)
0.4
Missing teeth7.19
(2.23–
12.15)
0.11
(−5.48–
5.70)
0.12.69
(−3.44–
8.83)
4.61
(−0.18–
9.39)
0.70.85
(−5.72–
7.41)
6.46
(−0.70–
13.62)
0.41.79
(−0.18–
3.76)
5.51
(2.02–
9.01)
0.034.43
(2.27–
6.59)
2.87
(−0.68–
6.42)
0.43.35
(1.27–
5.42)
3.96
(0.42–
7.49)
0.7
Filled teeth4.35
(−0.61–9.30)
3.93
(−1.69–
9.56)
0.9−3.13
(−9.24–
2.98)
11.41
(6.59–
16.22)
0.00510.17
(3.56–
16.78)
−1.89
(−9.04–
5.26)
0.073.34
(1.39–
5.29)
4.94
(1.44–
8.43)
0.34.95
(2.82–
7.09)
3.33
(−0.24–
6.89)
0.44.17
(2.08–
6.26)
4.11
(0.67–
7.55)
0.9
Highest PSR score1.53
(0.31–
2.75)
2.56
(1.66–
3.96)
0.41.43
(−0.10–
2.97)
2.66
(1.47–
3.85)
0.33.04
(1.41–4.66)
1.06
(−0.70–
2.82)
0.21.89
(1.39–
2.39)
2.19
(1.32–
3.07)
0.52.04
(1.51–
2.57)
2.05
(1.12–
2.98)
0.92.04
(1.51–
2.57)
2.06
(1.19–
2.92)
0.9
LS-means a, unadjusted least square means; bold italic represents significant.
Table 7. Relationships between bitter-taste receptor genotypes (presence of major allele) and clinical salivary biomarkers of oral health.
Gene/SNPTAS2R4-
rs2233998
TAS2R4-
rs2234001
TAS2R5-
rs2227264
TAS2R9-
rs3741845
TAS2R38-
rs713598
TAS2R50-
rs1376251
χ2pχ2pχ2pχ2pχ2pχ2p
Hydration a0.000.9940.000.9950.001.000.020.8852.380.1232.070.150
Viscosity of saliva0.000.9950.000.9950.001.000.000.9990.610.4350.180.668
pH b0.000.9970.000.9970.001.000.180.6750.000.9960.000.996
Quantity c0.000.9950.000.9950.001.000.550.4580.350.5540.990.320
pH d0.000.9950.000.9950.001.001.220.2690.000.9930.000.994
Buffering capacity0.000.9970.000.9980.001.003.020.0821.580.2090.000.997
a visual assessment of saliva production/resting salivary flow rate; b pH of resting saliva; c quantity of stimulated saliva; d pH of stimulated saliva.
Publisher’s Note: MDPI stays neutral with regard to jurisdictional claims in published maps and institutional affiliations.

