
Approaches to Measuring Direct Photon Yield in A–A Collisions


NRC “Kurchatov Institute”, Kurchatov sq., 1, 123182 Moscow, Russia
Particles 2022, 5(2), 188-197; https://0-doi-org.brum.beds.ac.uk/10.3390/particles5020017
Submission received: 4 May 2022
/
Revised: 6 June 2022
/
Accepted: 7 June 2022
/
Published: 9 June 2022
(This article belongs to the Special Issue Selected Papers from "Physics Performance Studies at FAIR and NICA")
Abstract
:An overview of experimental methods for measuring direct photon spectra in pp, p–A and A–A collisions is presented. The advantages and limitations of each method are discussed and illustrated by the results of various experiments.
1. Introduction
Direct photons are created in interactions of charged particles in pp, p–A or A–A collisions and not in decays of final hadrons. Due to the large free path length, direct photons freely escape from the hot and dense region and deliver information about all stages of the collision. In pp collisions, direct photons are mostly produced in scatterings of partons of incoming protons. Therefore, the measurement of the direct photon spectrum provides information about the proton structure functions. In p–A collisions, direct photons allow us to explore the initial stage of the collision and in particular to study the modification of nucleon structure functions in nuclei. In A–A collisions, one can expect the creation of hot matter. Therefore, in addition to photons created in scatterings of partons of incoming nucleons, there is thermal radiation of the hot matter, so that these thermal direct photons provide information about the temperature of hot matter, its space-time dimensions and the development of collective flow of the hot matter in these collisions.
Unfortunately, direct photons contribute only a few percent to the total photon yield, while the main part of photons created in pp or A–A collisions comes from the decays of final hadrons, mainly and -mesons. Measurement of the direct photon spectrum is a very complicated experimental task. This is why several approaches have been developed, suitable for various conditions. Below we discuss some of the proposed methods, consider their advantages and restrictions, and review available experimental results.
2. Isolated Direct Photons
One of the most widely used approaches in pp, p–A and A–A collisions is the measurement of the spectrum of isolated photons, which, as we will see later, are closely related to direct photons. An isolated photon is a photon which does not have hadronic activity in some region around it:
where is the sum of energies of all particles in the cone around the photon in the azimuthal () and pseudorapidity () directions. Typically, a cone radius of 0.4–0.6 is used, which is compatible to the jet size. The threshold energy usually used is GeV above the underlying event contribution , based on the estimated energy density of the underlying event. The main idea of this approach is that, at high , most of hadrons are created as a part of a jet, and therefore photons created in decays of such hadrons are surrounded by hadrons belonging to the same jet. In contrast, direct photons originated in Compton scattering or in quark annihilation do not have accompanying hadrons. The advantages and limitations of the method follow directly from this idea: this method works well at high in pp and p–A collisions, but at medium and especially at small , the contribution of large-angle decays increases, and more and more decay photons can pass the isolation criterion. Another complication arises in A–A collisions where the underlying event contribution can be subtracted in average, but large fluctuations entail serious complications at low . To illustrate this, let us consider an expression for the isolated photon spectrum calculation:
where is the integrated luminosity, is the spectrum of reconstructed isolated photons, P is the purity of the isolated photon spectrum and is the efficiency of the isolated photon reconstruction. An example of the purity of an isolated photon spectrum, calculated in pp and p–Pb collisions at TeV [1], is shown in Figure 1. The purity rapidly decreases with the decrease in , with a rapid increase in relative systematic uncertainties. As a result, most measurements of the isolated photon spectrum are restricted by high –20 GeV/c.
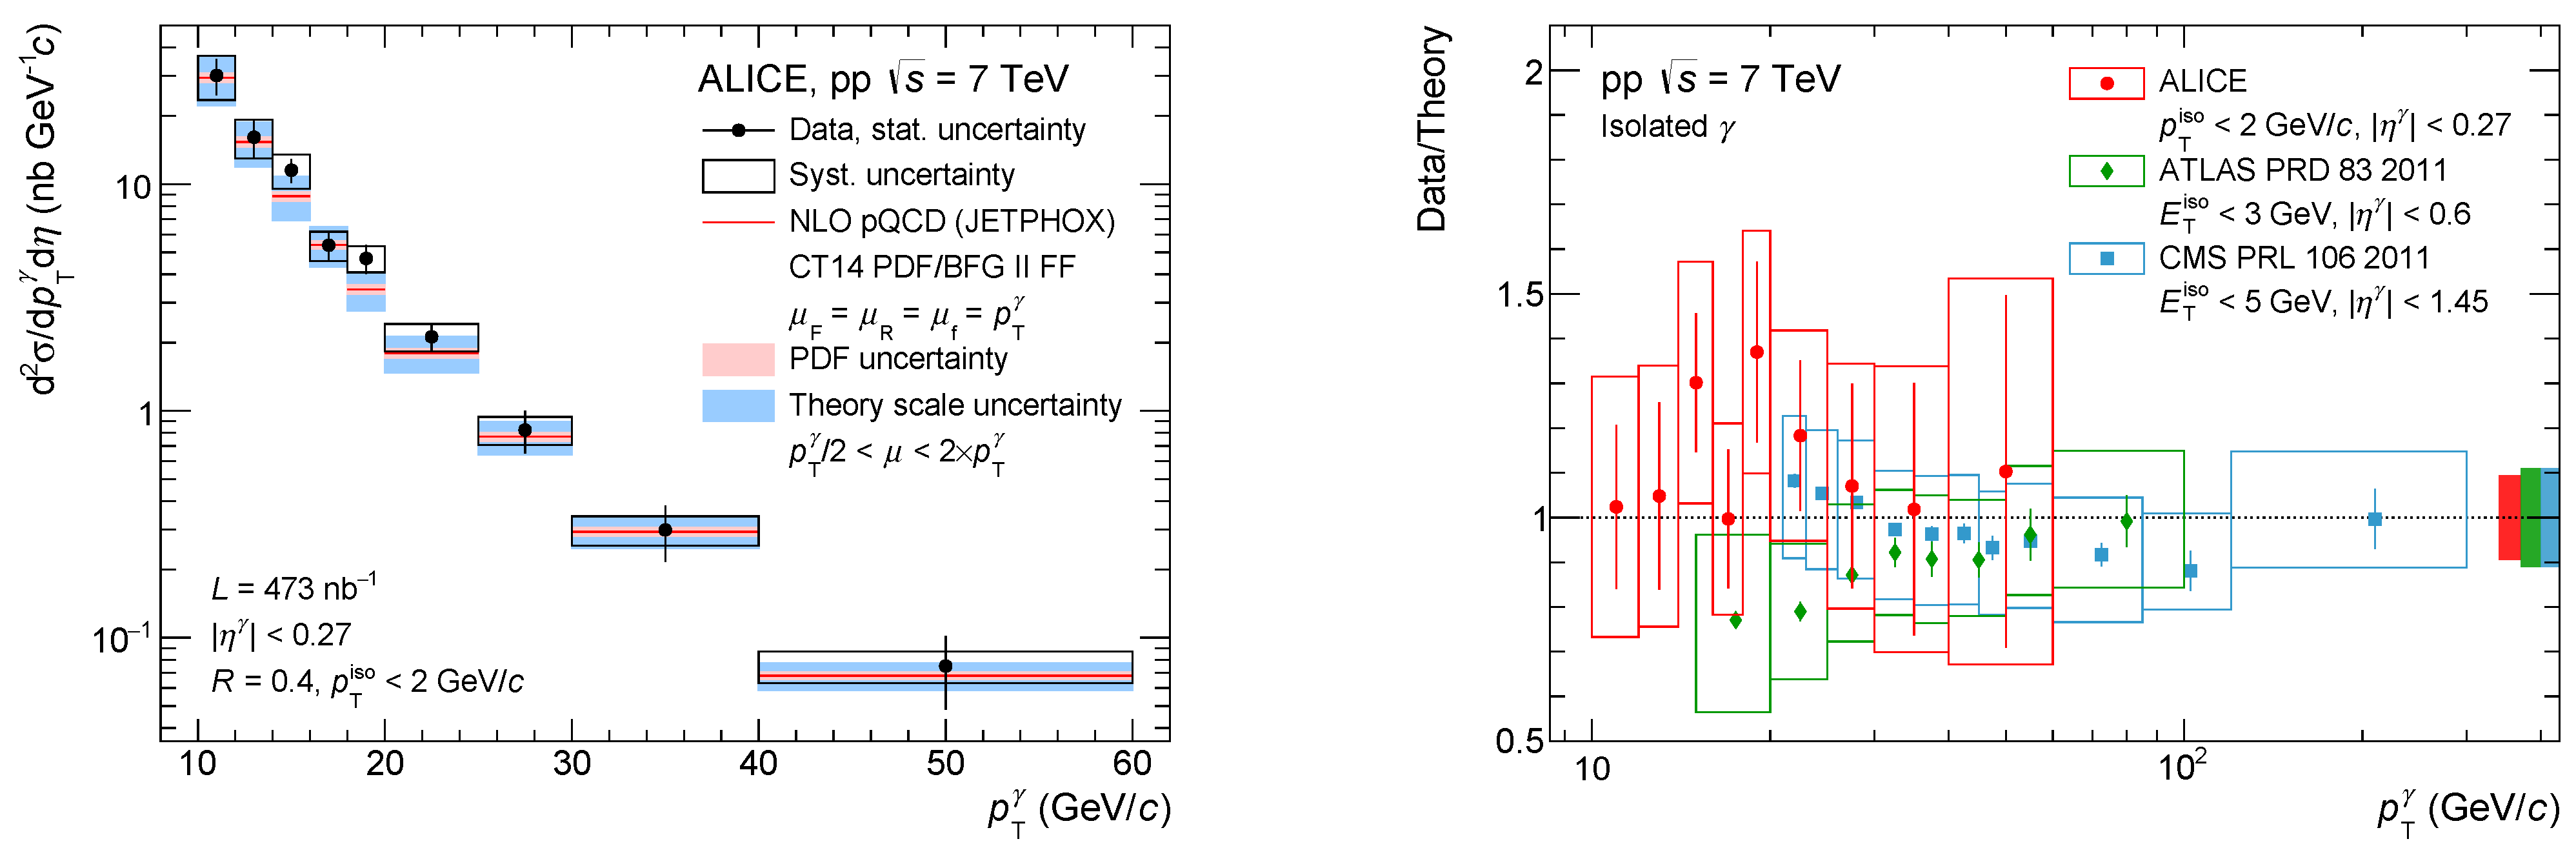
Nevertheless, at high , the measurement of isolated photon spectra provides valuable information on the validity of pQCD calculations and structure functions in pp collisions and their modifications in p–A collisions. It provides tools to control the initial stage in A–A collisions and can check the applicability of the Glauber model for description of the number of nucleon–nucleon collisions and the absence of strong modifications of nucleon structure functions in nuclei. The collaborations ALICE [1], ATLAS [2] and CMS [3] have measured isolated photon spectra in pp and p–A collisions and found reasonably good agreement with NLO pQCD calculations; see Figure 2.
3. Statistical Method
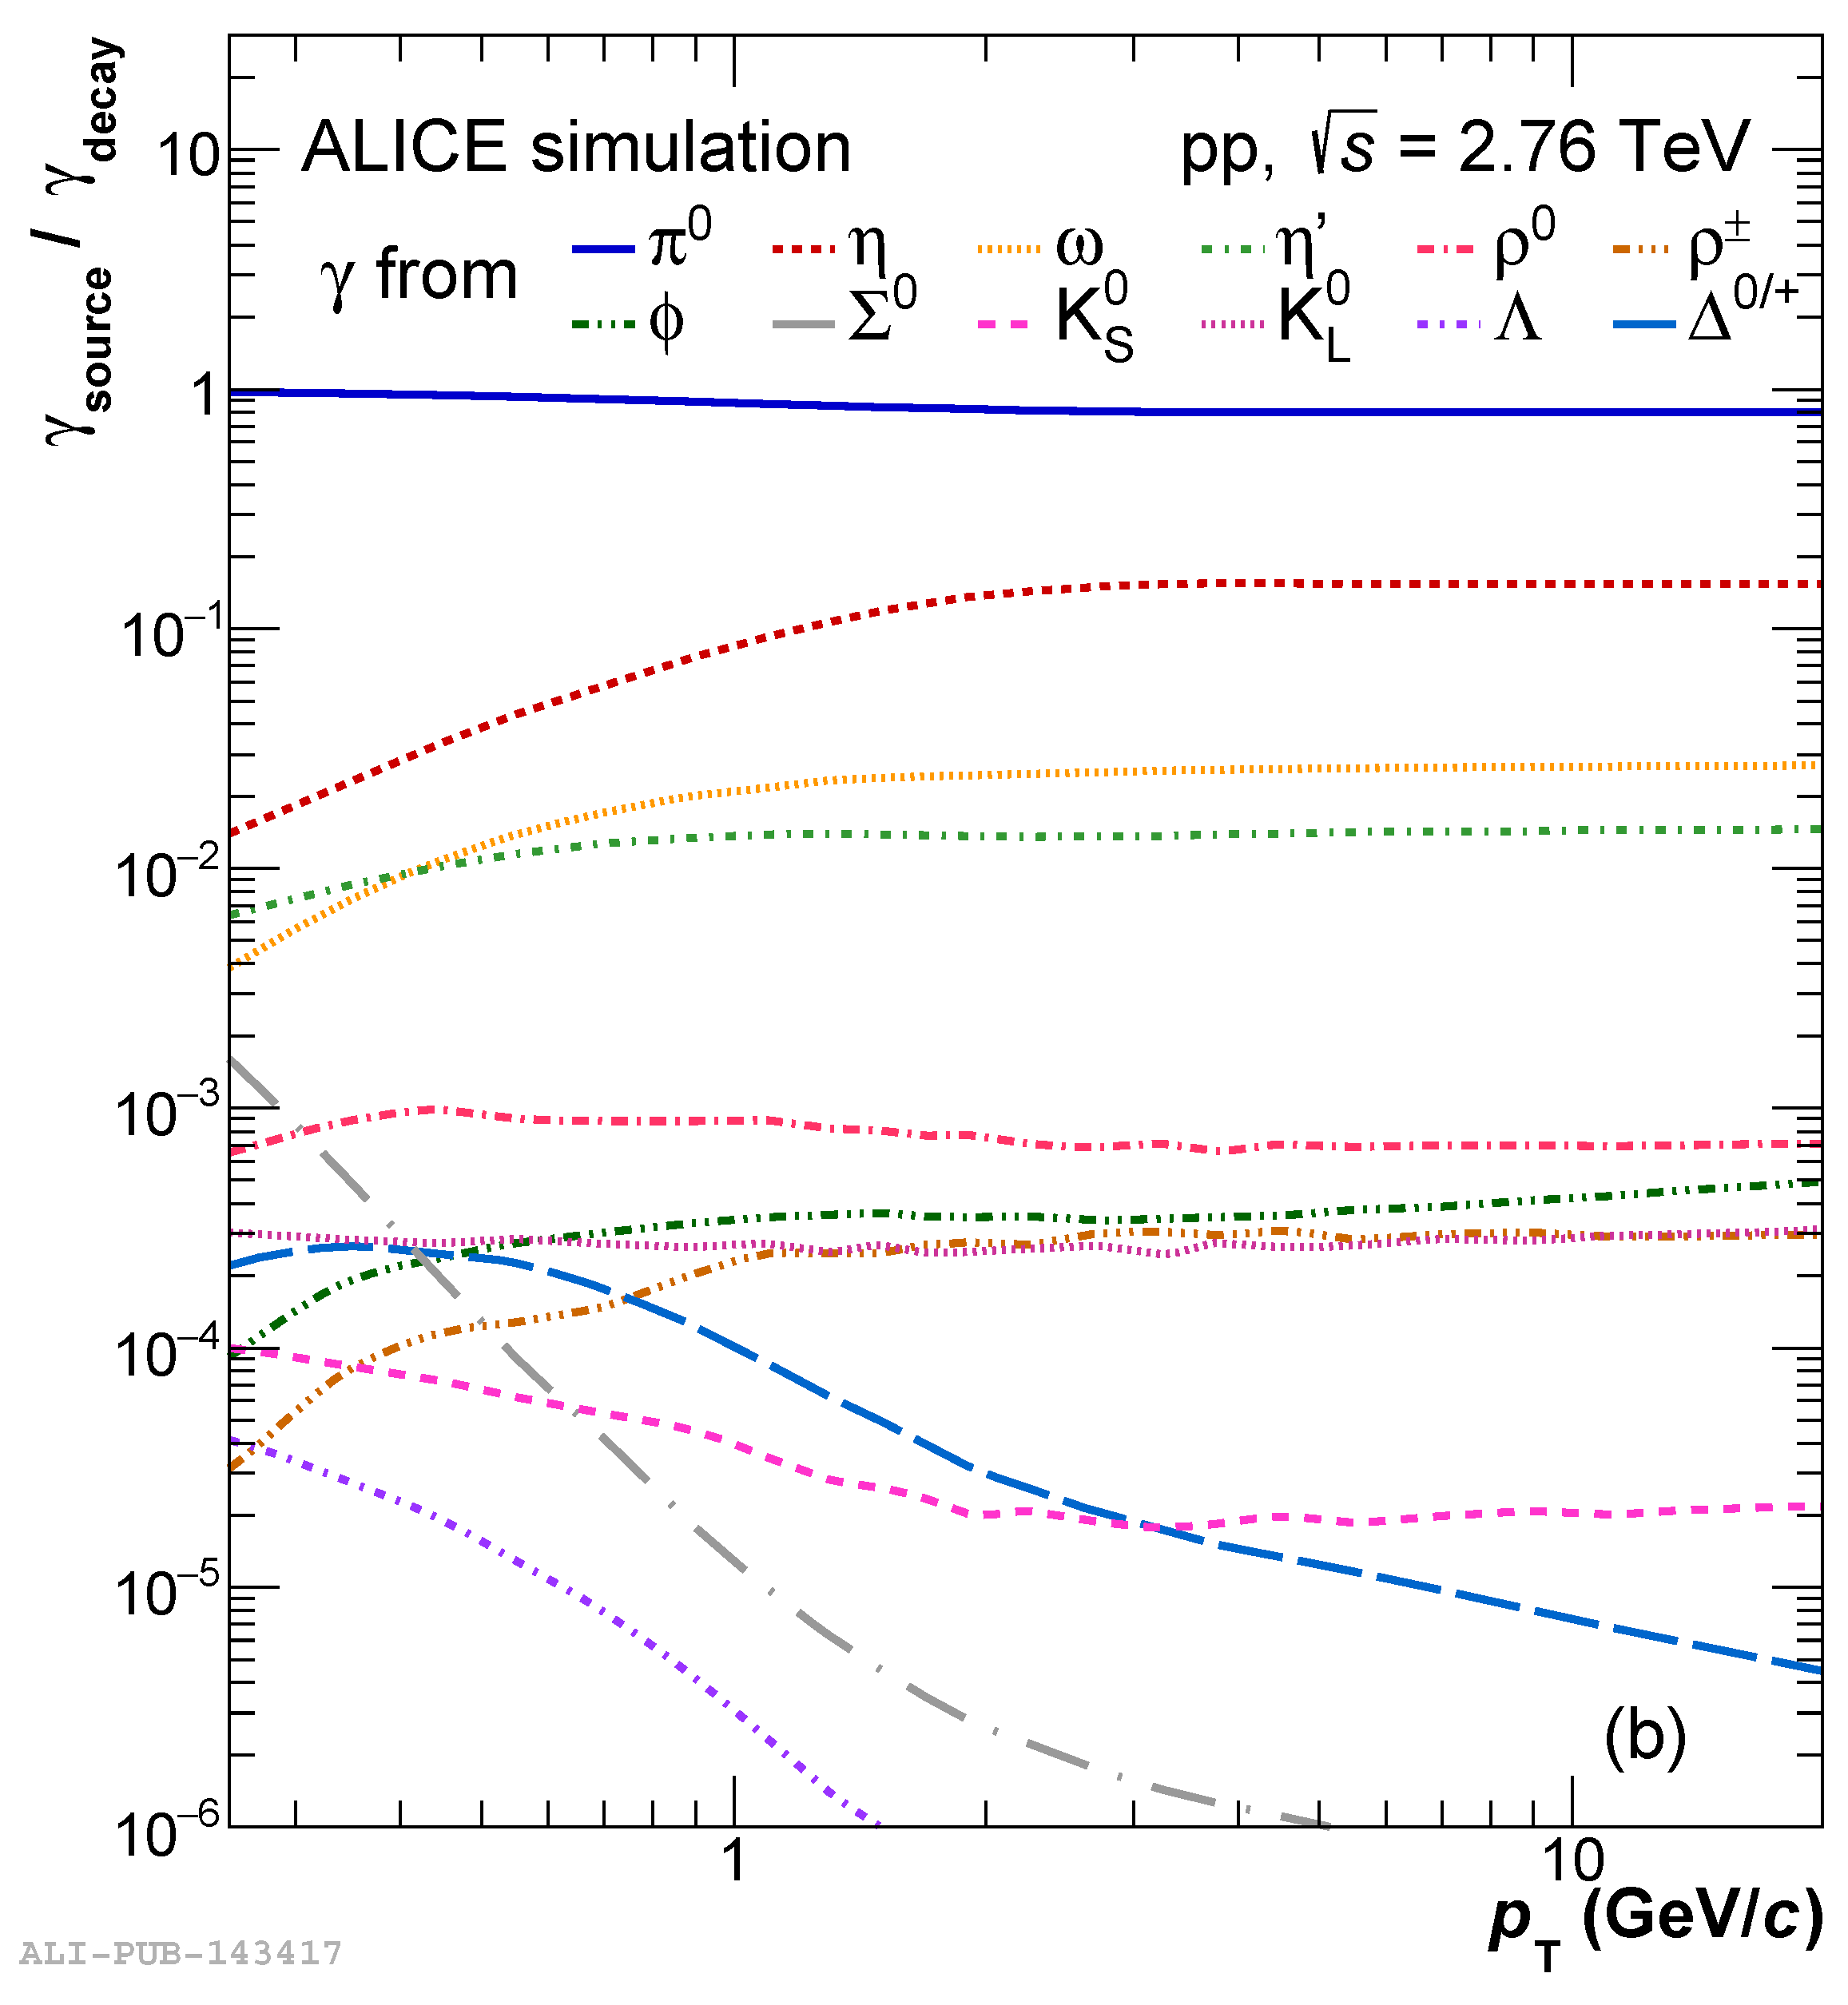
The statistical method for the measurement of the direct photon spectrum immediately follows from the definition: one measures the spectrum of inclusive photons, the spectrum of hadrons with the highest yields and the branching ratios of decays to photons, calculates the expected yield of decay photons and subtracts the decay photon spectrum from the inclusive photon one. Typical relative contributions of different hadrons to the decay photon spectrum, calculated in pp collisions at TeV, are shown in Figure 3.
The dominant contribution, more than ∼85%, comes from the decays, the second most important contribution comes from -meson decays. To minimize systematic uncertainties, it is important to measure both the inclusive photon spectrum and neutral meson spectra in the same detector. To eliminate some of the largest systematic uncertainties, it is convenient to construct a double ratio :
where and are the measured spectra of inclusive photons and neutral mesons, respectively, is some parameterization of the measured neutral meson spectrum, and is the calculated yield of decay photons (including decays of all hadrons) based on this parameterization. An increase of above the unity signifies the presence of a direct photon contribution.
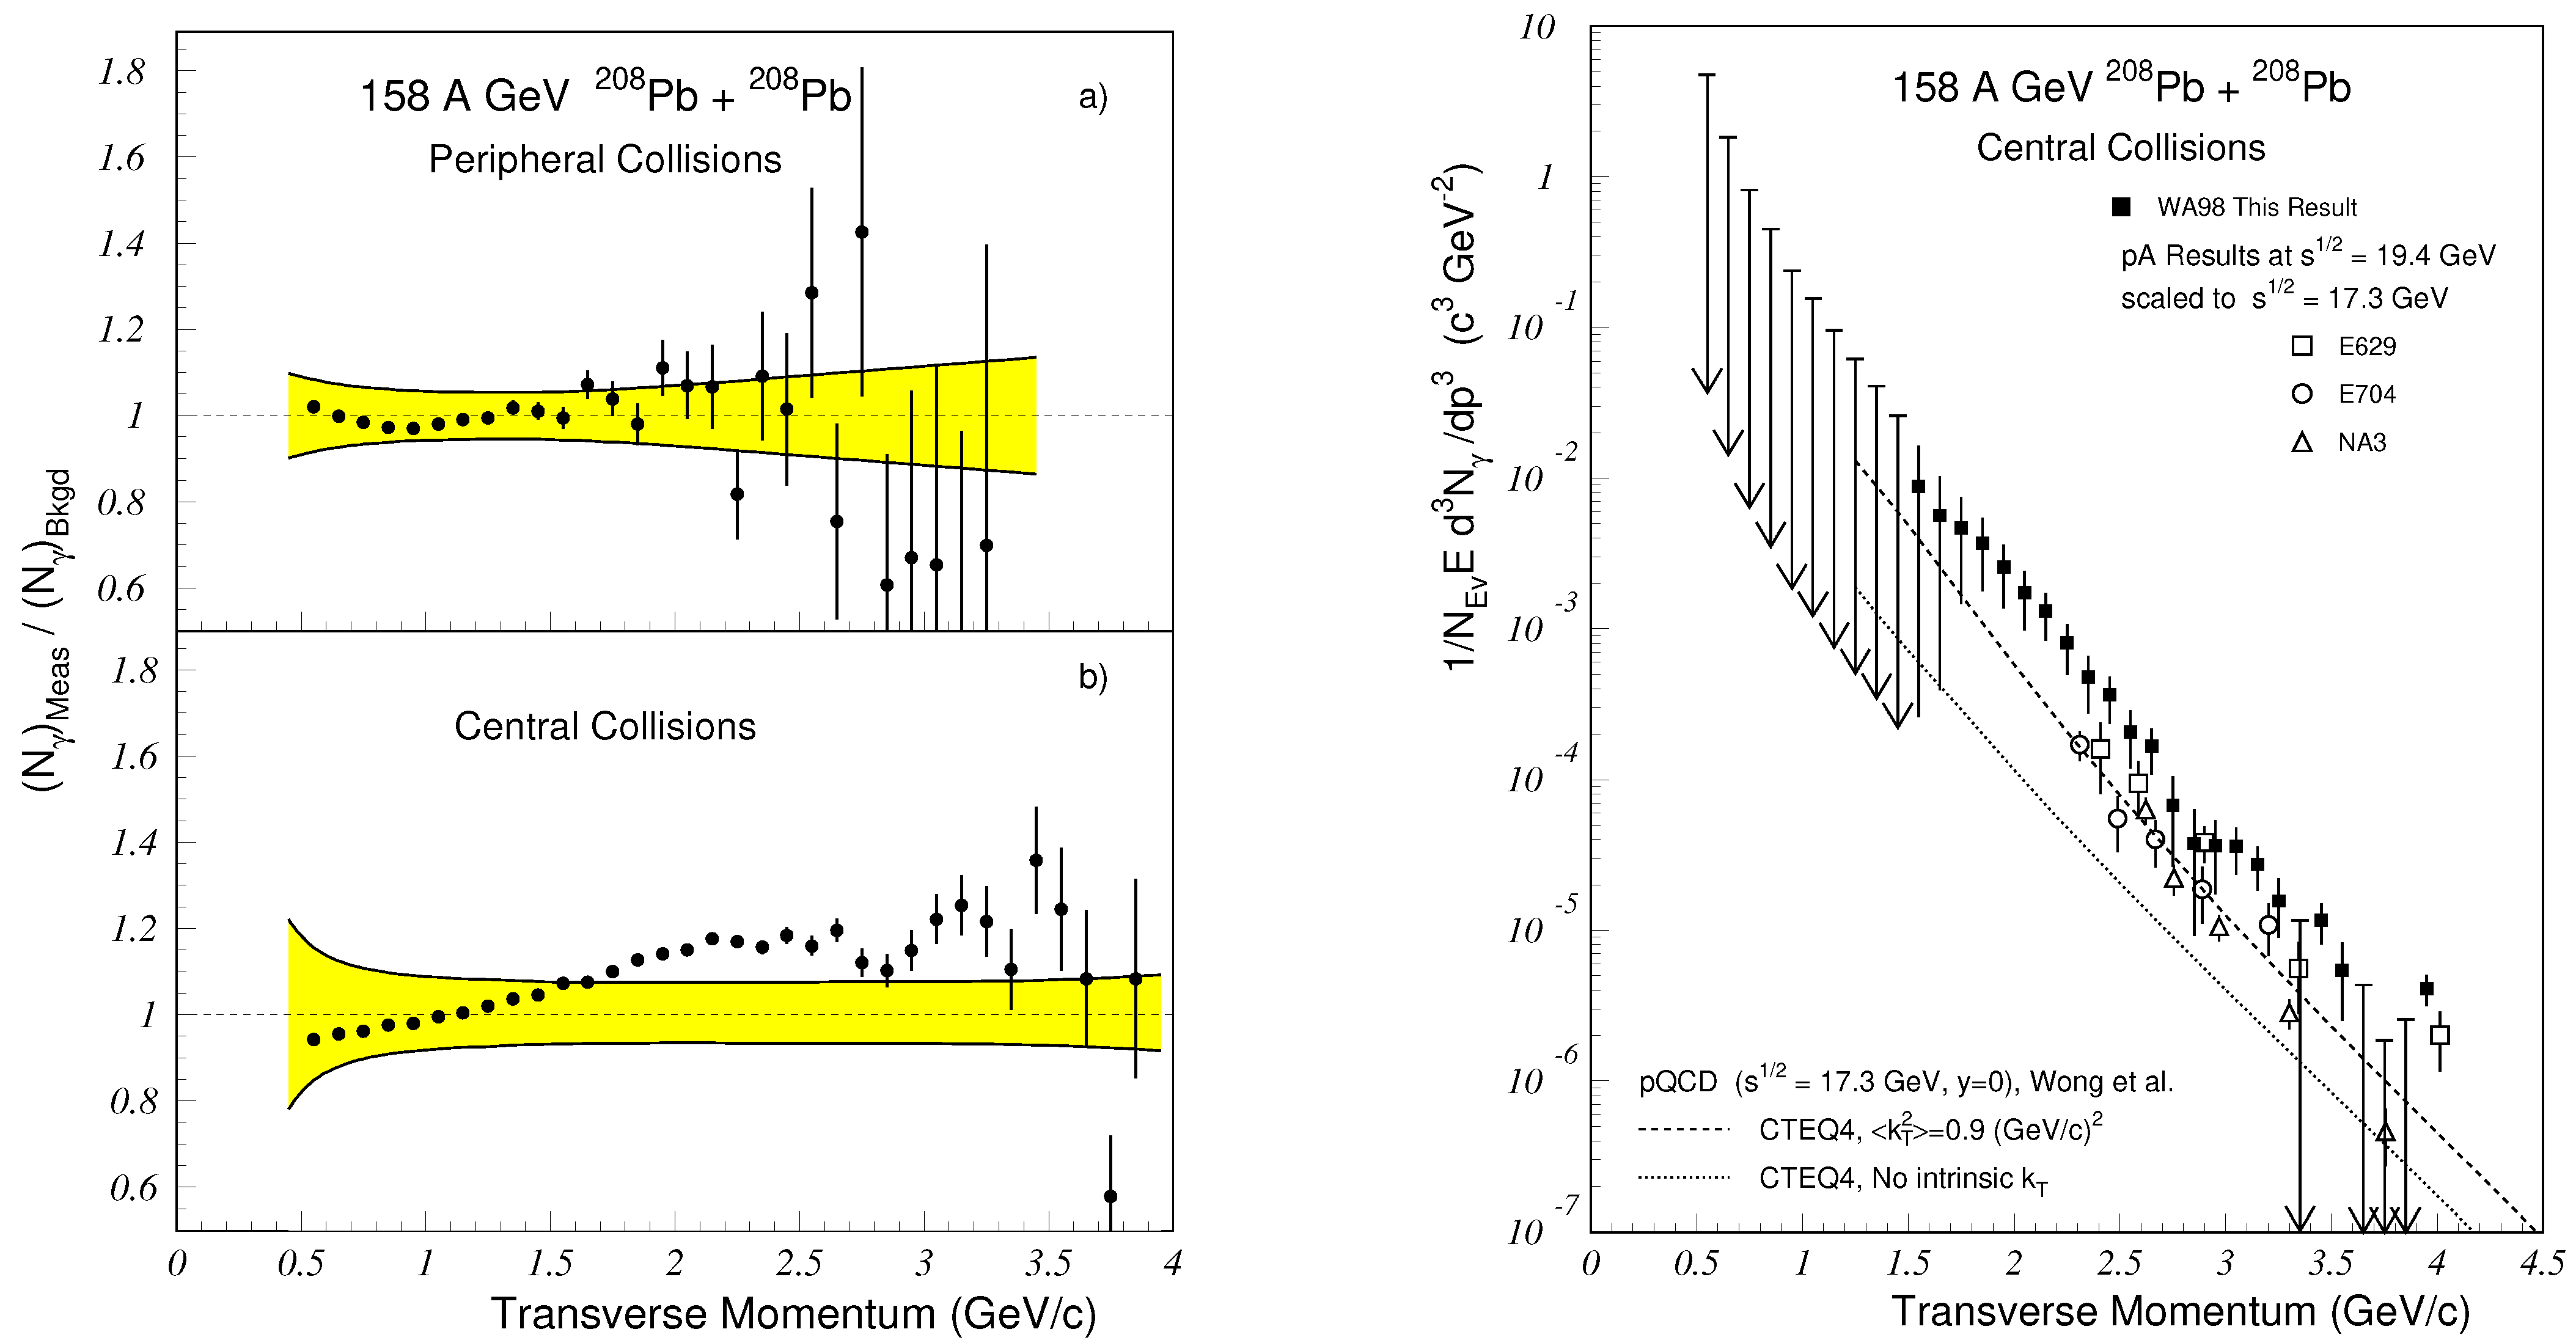
The first successful attempt at extracting the direct photon yield was by the WA98 collaboration [6]; see Figure 4. In central collisions, an excess of direct photons exceeded the systematic uncertainties represented by the yellow band, which allowed the measurement of the direct photon spectrum, while in peripheral collisions, systematic uncertainties were too large and only upper limits were established. Later, this method was used by all experiments that measured direct photon spectra. This method can be applied to any kind of collision, with high or low multiplicity, however, it requires an excellent quality of the electromagnetic calorimeter and precise measurement of neutral meson spectra. At low , the proportion of direct photons decreases as meson decays, resulting in the appearance of factor in the decay photon spectrum. This makes the application of the statistical method for low extremely difficult.
4. Photon Conversion Method
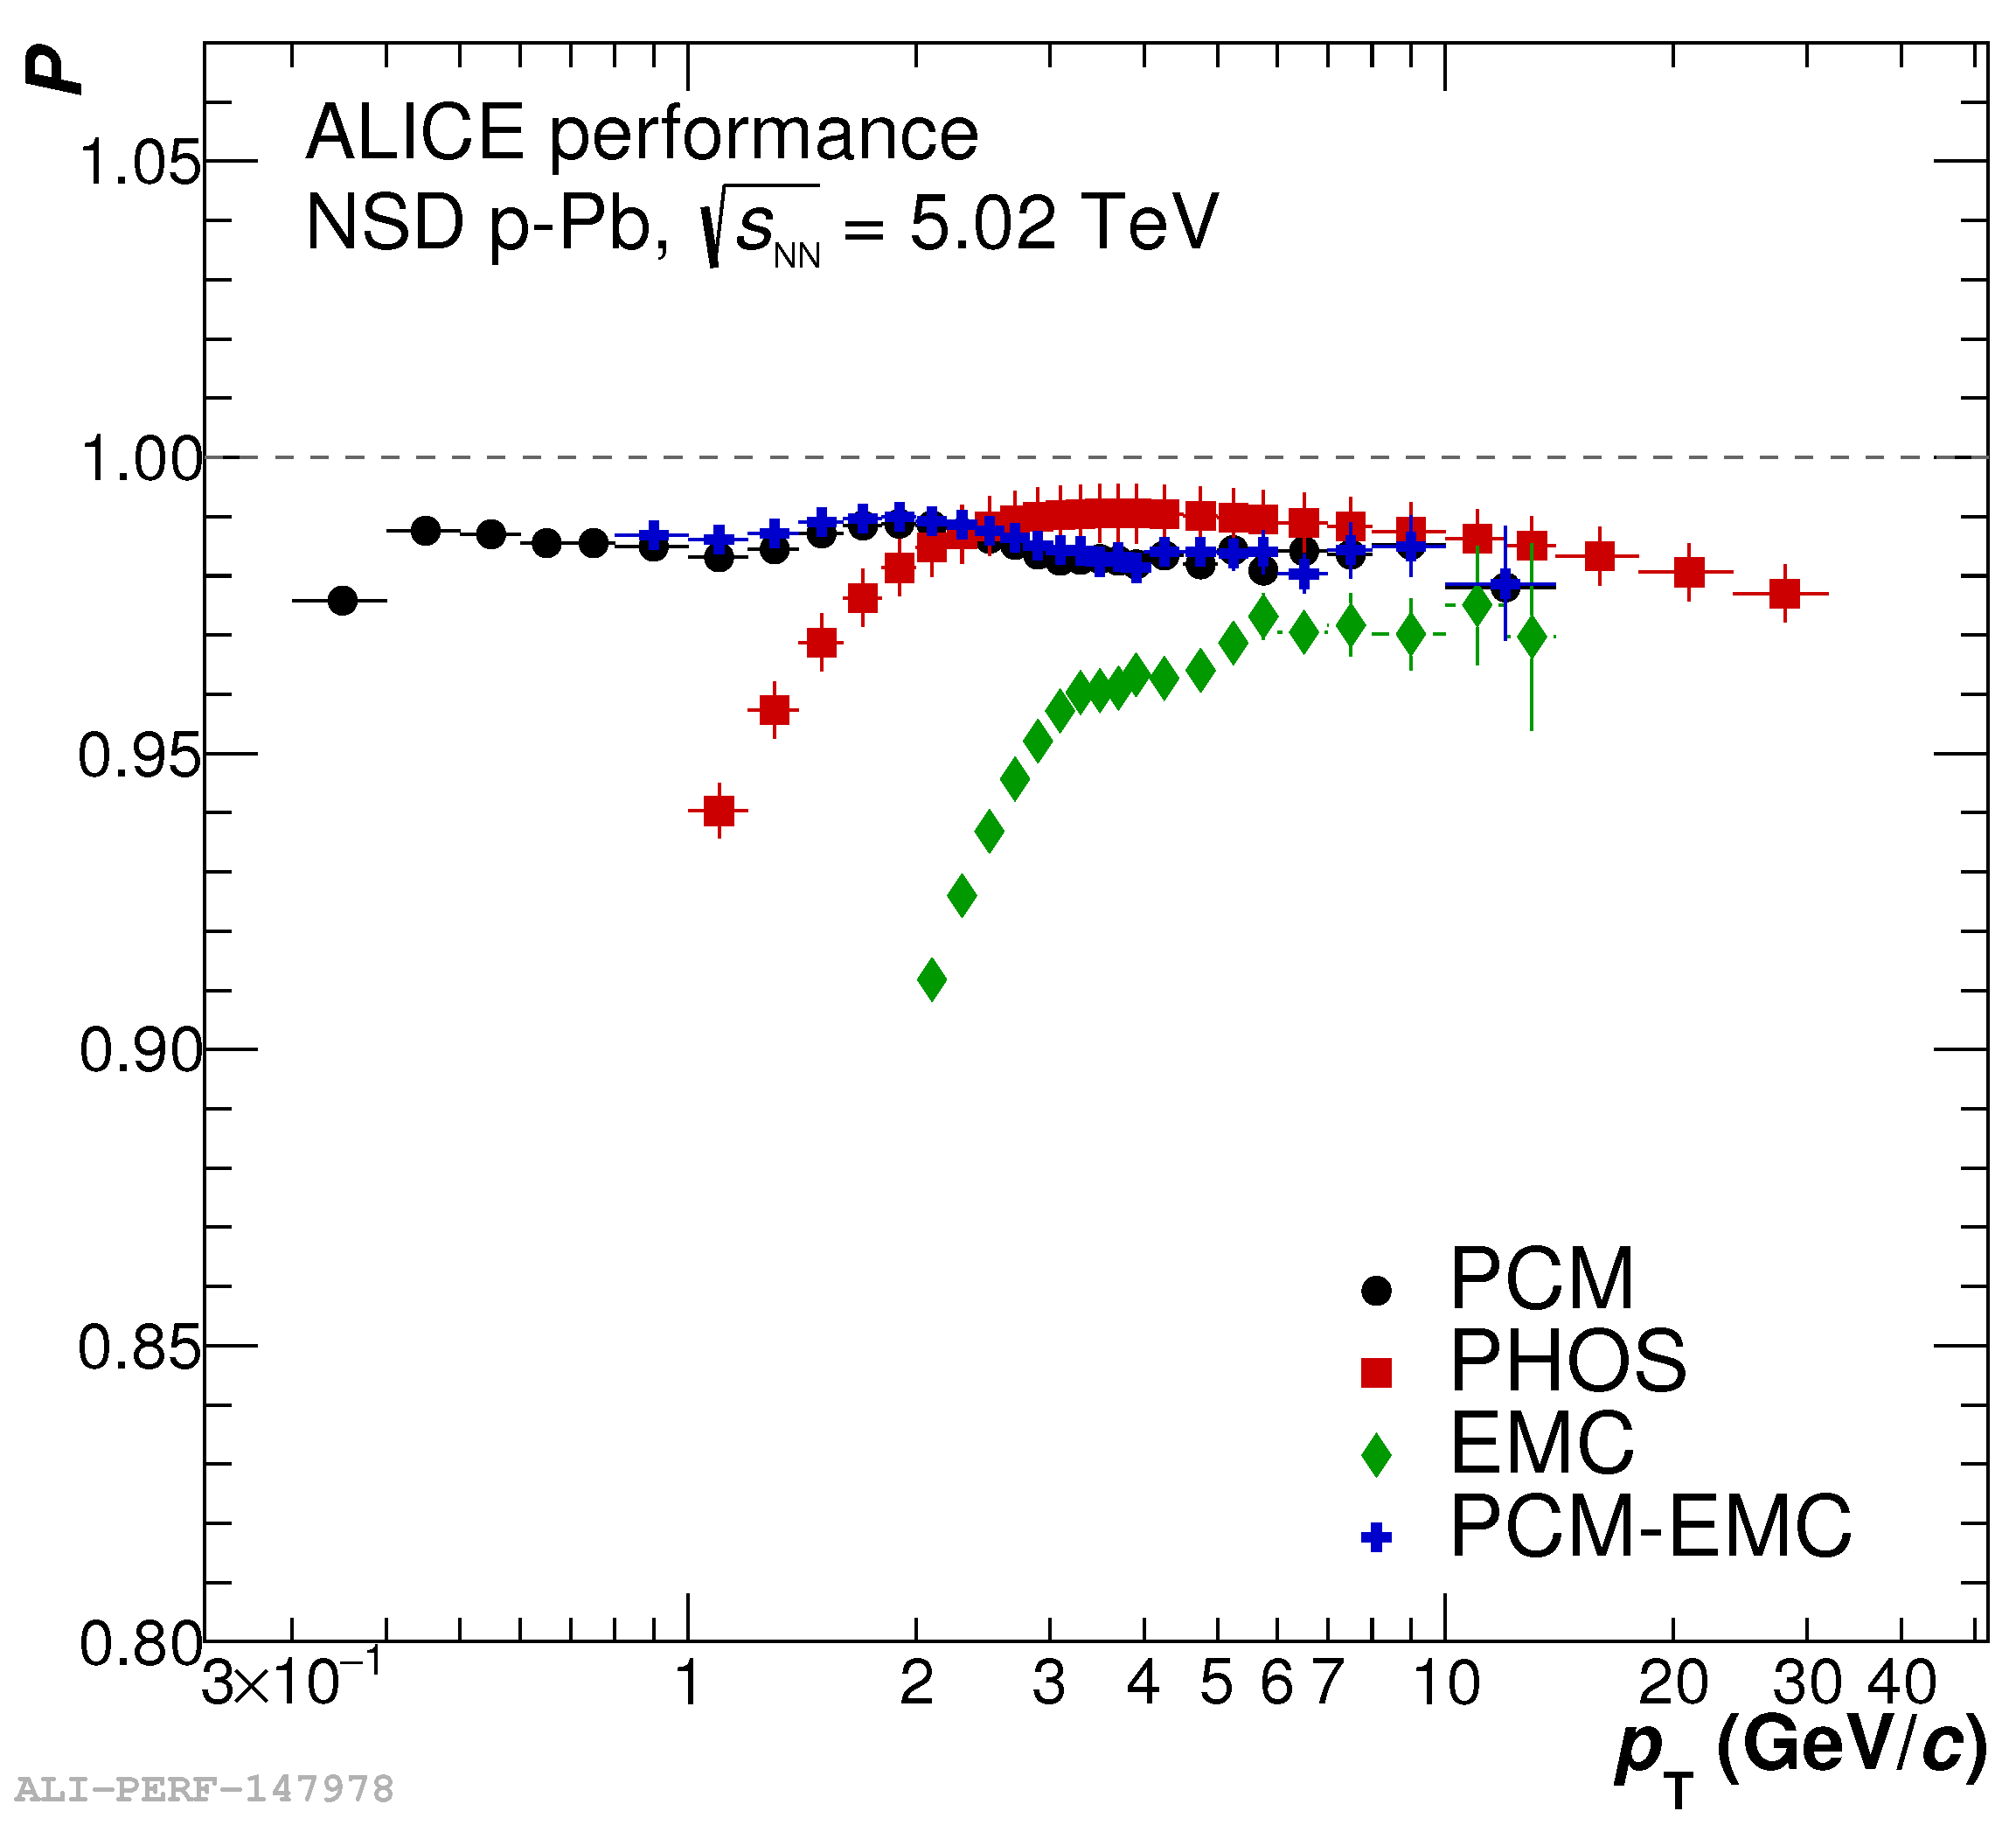
The energy and position resolutions of electromagnetic calorimeters improve with increasing energy of the reconstructed photon. In addition, the purity of the photon sample improves with increasing photon energy: on the one hand, hadrons rarely deposit their full energy in a thin electromagnetic calorimeter, so that the spectrum of the hadron contamination is softer. On the other hand, the shower shape analysis works better for larger clusters consisting of large number of cells. Finally, high energy clusters can be created only by hard charged particles, for which an extrapolation of tracks from the tracking system to the calorimeter is more reliable. However, at low energies, the performance of calorimeters is poor. To extend the measurement of the inclusive and direct photon spectrum to lower energies, one can use the conversion method: reconstruct photons via their conversion to pairs on the material of inner detectors or of the beam pipe, where tracks are measured in the tracking system of the experiment. This allows for a significant improvement in the purity of the inclusive photon spectrum, as demonstrated by the comparison of the photon sample purity provided by three detectors in the ALICE experiment; see Figure 5. The Photon Spectrometer (PHOS) [7] is a high-resolution electromagnetic calorimeter built of PbWO crystals of size cm, the Electromagnetic Calorimeter (EMCAL) [8] is built with Shashlyk technology with a tower size of cm. The PHOS is able to extend the measurement of the photon sample with high purity to a somewhat lower compared to EMCAL. The conversion method provides the best purity at very low . Note that the contamination of the conversion method is completely different from the one in the calorimeter, which is important for cross-checking of the results. The reduction of contamination uncertainties in the conversion method is achieved at the price of lower photon reconstruction efficiency and a large sensitivity to uncertainties related to the description of the material budget of the detector. As a result, the final uncertainties of the two methods are comparable. The conversion method is widely used in PHENIX [9] and ALICE [5] experiments.
5. Internal Conversion Method
The idea behind the internal conversion method, to measure the direct photon yield, is based on the decomposition of the invariant mass distribution of pairs into a hadron and a direct (virtual) photon contribution. Thanks to the Kroll–Wada formula [11], one can relate the yield of pairs coming from the same source at different pair masses and even extrapolate to the yield of real photons emitted by that source:
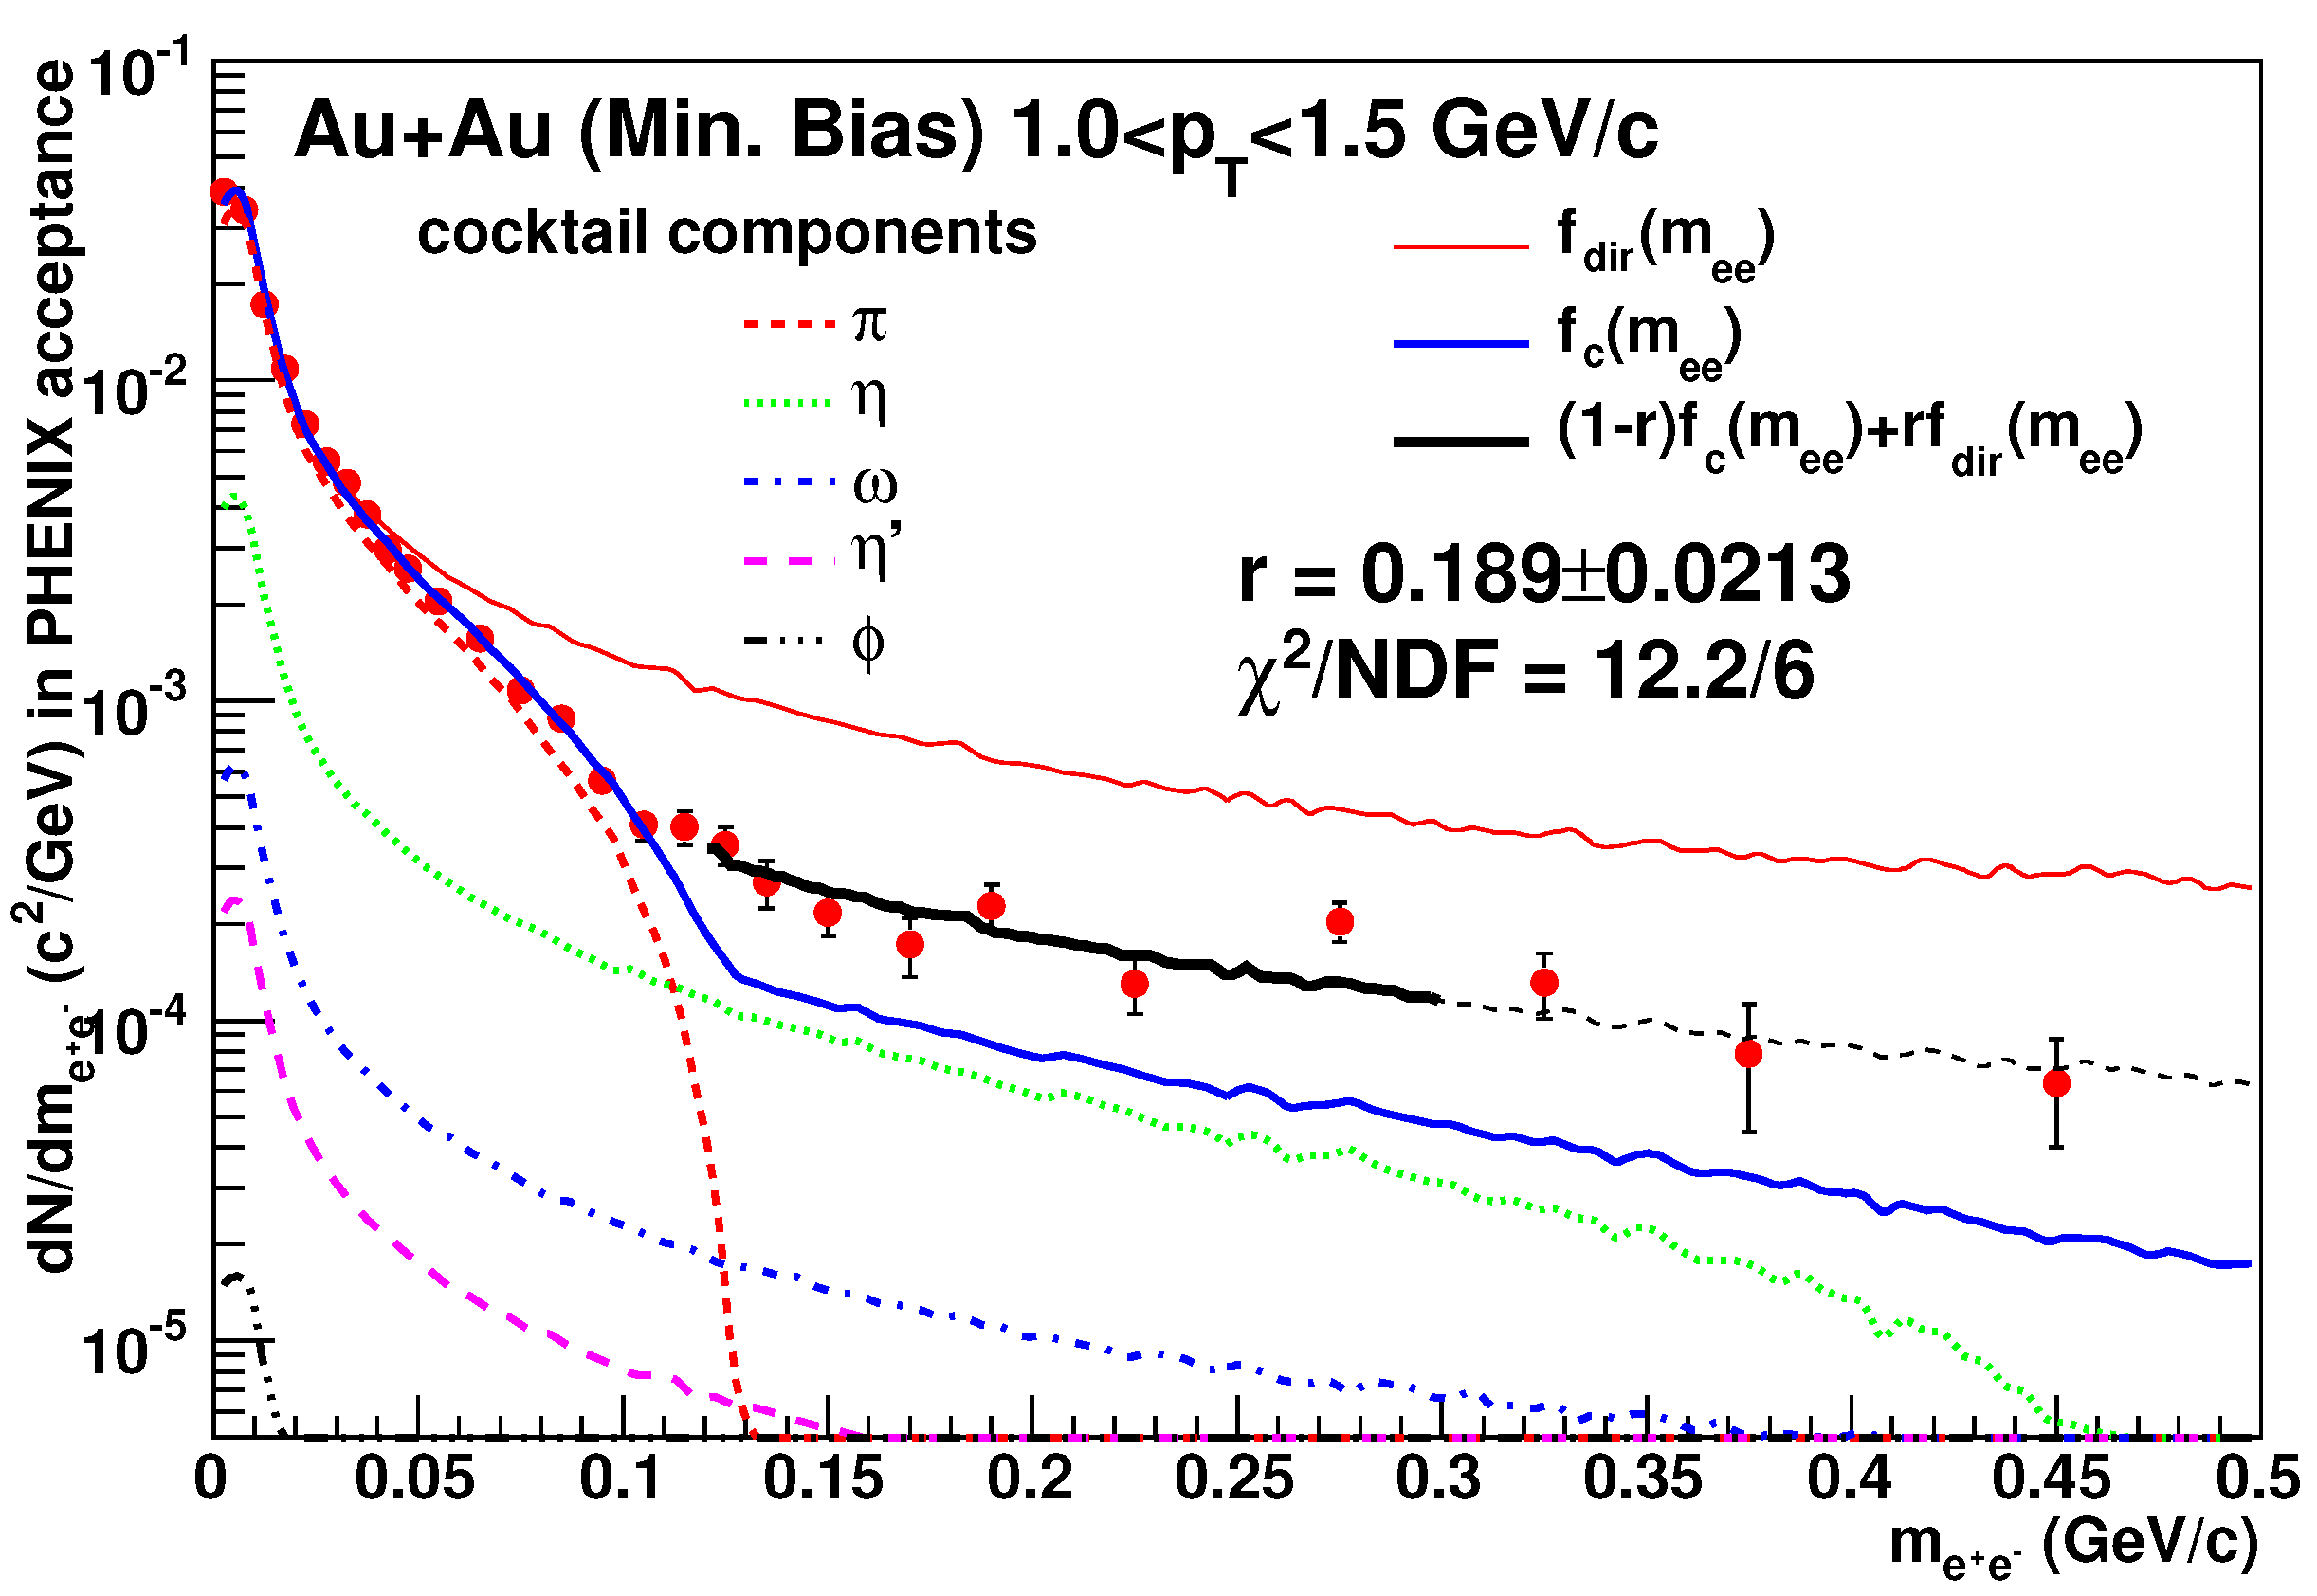
where is the number of real photons emitted by this source, is the invariant mass of the pair, is the electron mass, M is the total mass () of the decaying/emitting system, and is the form factor. This method solves two problems: first, one gets rid of the contamination of the photon spectrum that is common in photon detection with calorimeters, and second, by choosing a proper region of pair masses, one can considerably reduce the contribution of hadron decays to the photon spectrum. For example, looking at the region MeV/, one gets rid of the decay contribution. Technically, the invariant mass distribution, , calculated for each bin, is fitted by the sum of expected contributions of hadron decays (cocktail) and direct photon contribution , with the only fit parameter, r, defining the relative contribution of direct photons and decay photons. Figure 6 shows and together with the fit result for Au + Au minimun bias data for GeV/c and the cocktail components. One can see an excellent description of the shape of the measured invariant mass distribution, and that the cocktail contribution is dramatically reduced just above the mass. However, this method also has drawbacks: First, one should estimate and subtract combinatorial background of pairs. The signal-to-background ratio decreases rapidly with increasing collision multiplicity and is of the order of ∼– for A–A collisions. Precise subtraction of the combinatorial background requires a lot of effort and introduces considerable systematic uncertainties. Second, one has to exclude the contribution of the pairs created in real photon conversion on detector material and to estimate the contribution of decays of mesons with heavy flavors and , the mass and/or width of which can be modified in hot and dense matter.
6. Bose–Einstein Correlations of Direct Photons
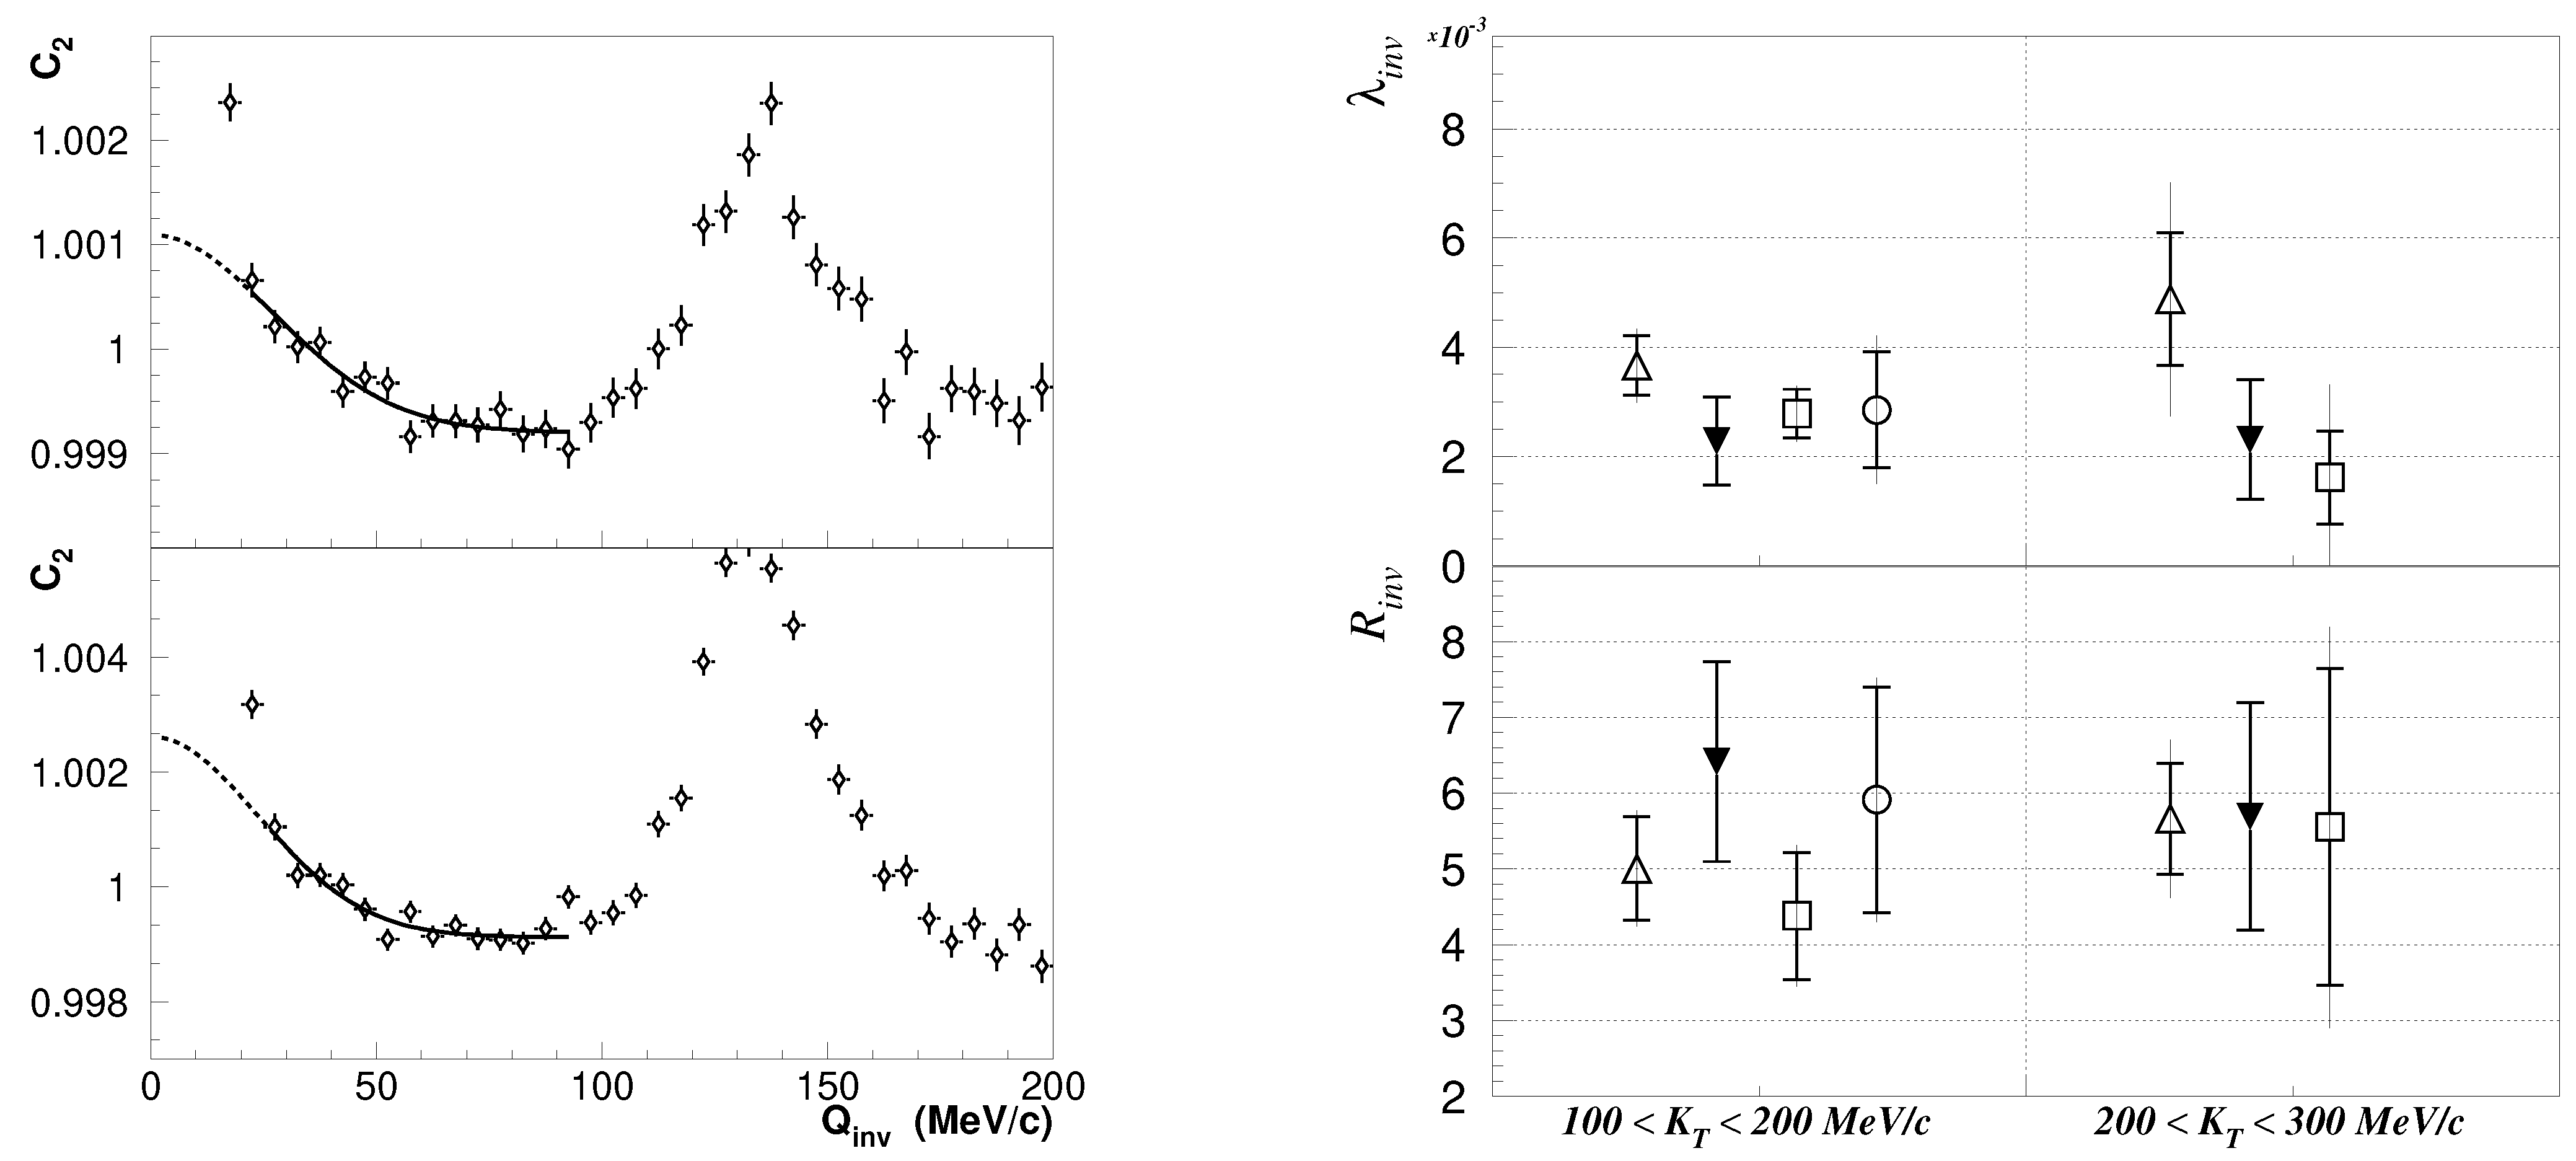
Direct photon intensity interferometry can be used to explore the space-time dimensions of the hottest part of the collision and also to extract the direct photon yield. As the lifetime of hadrons, making main contributions to the decay photon yield, is relatively large, the two-photon correlation function constructed from all photons in the event has an increase at zero relative momentum, corresponding to the correlations only between direct photons. Correlations between direct photons and decay ones or between decay photons would result in an extremely narrow correlation which can not be observed in an experiment. Full information about space-time dimensions of the hot matter can be extracted using a 3-dimensional correlation function, but in the case of limited statistics, one can use a correlation function depending on the invariant relative momentum
with correlation strength , and radius parameter . The invariant correlation strength can be related to the correlation strength of the full 3-dimensional correlation function, and the latter can be related to the squared proportion of direct photons:
where factor appears due to photon spin. Note that due to the massless nature of photons, the relation between and is more complicated than for massive particles, for which they coincide [13]. So far the only successful attempt to extract direct photon Bose–Einstein correlations was made in the WA98 experiment [13]; see Figure 7. This experiment was perfect for this type of measurement. It was a fixed-target experiment, and thanks to the Lorentz boost, the photon energy reconstructed in the calorimeter was high enough to reliably identify photons. In addition, since the electromagnetic calorimeter was 21 m from the interaction point, photon showers with small opening angles could be separated. Finally, the material budged in front of the calorimeter was very low, which reduced the contribution of photon conversion at low relative momentum. The direct photon spectrum was extracted in two low bins. It was not possible to extend measurements to higher because of limited statistics.
7. Method Comparison
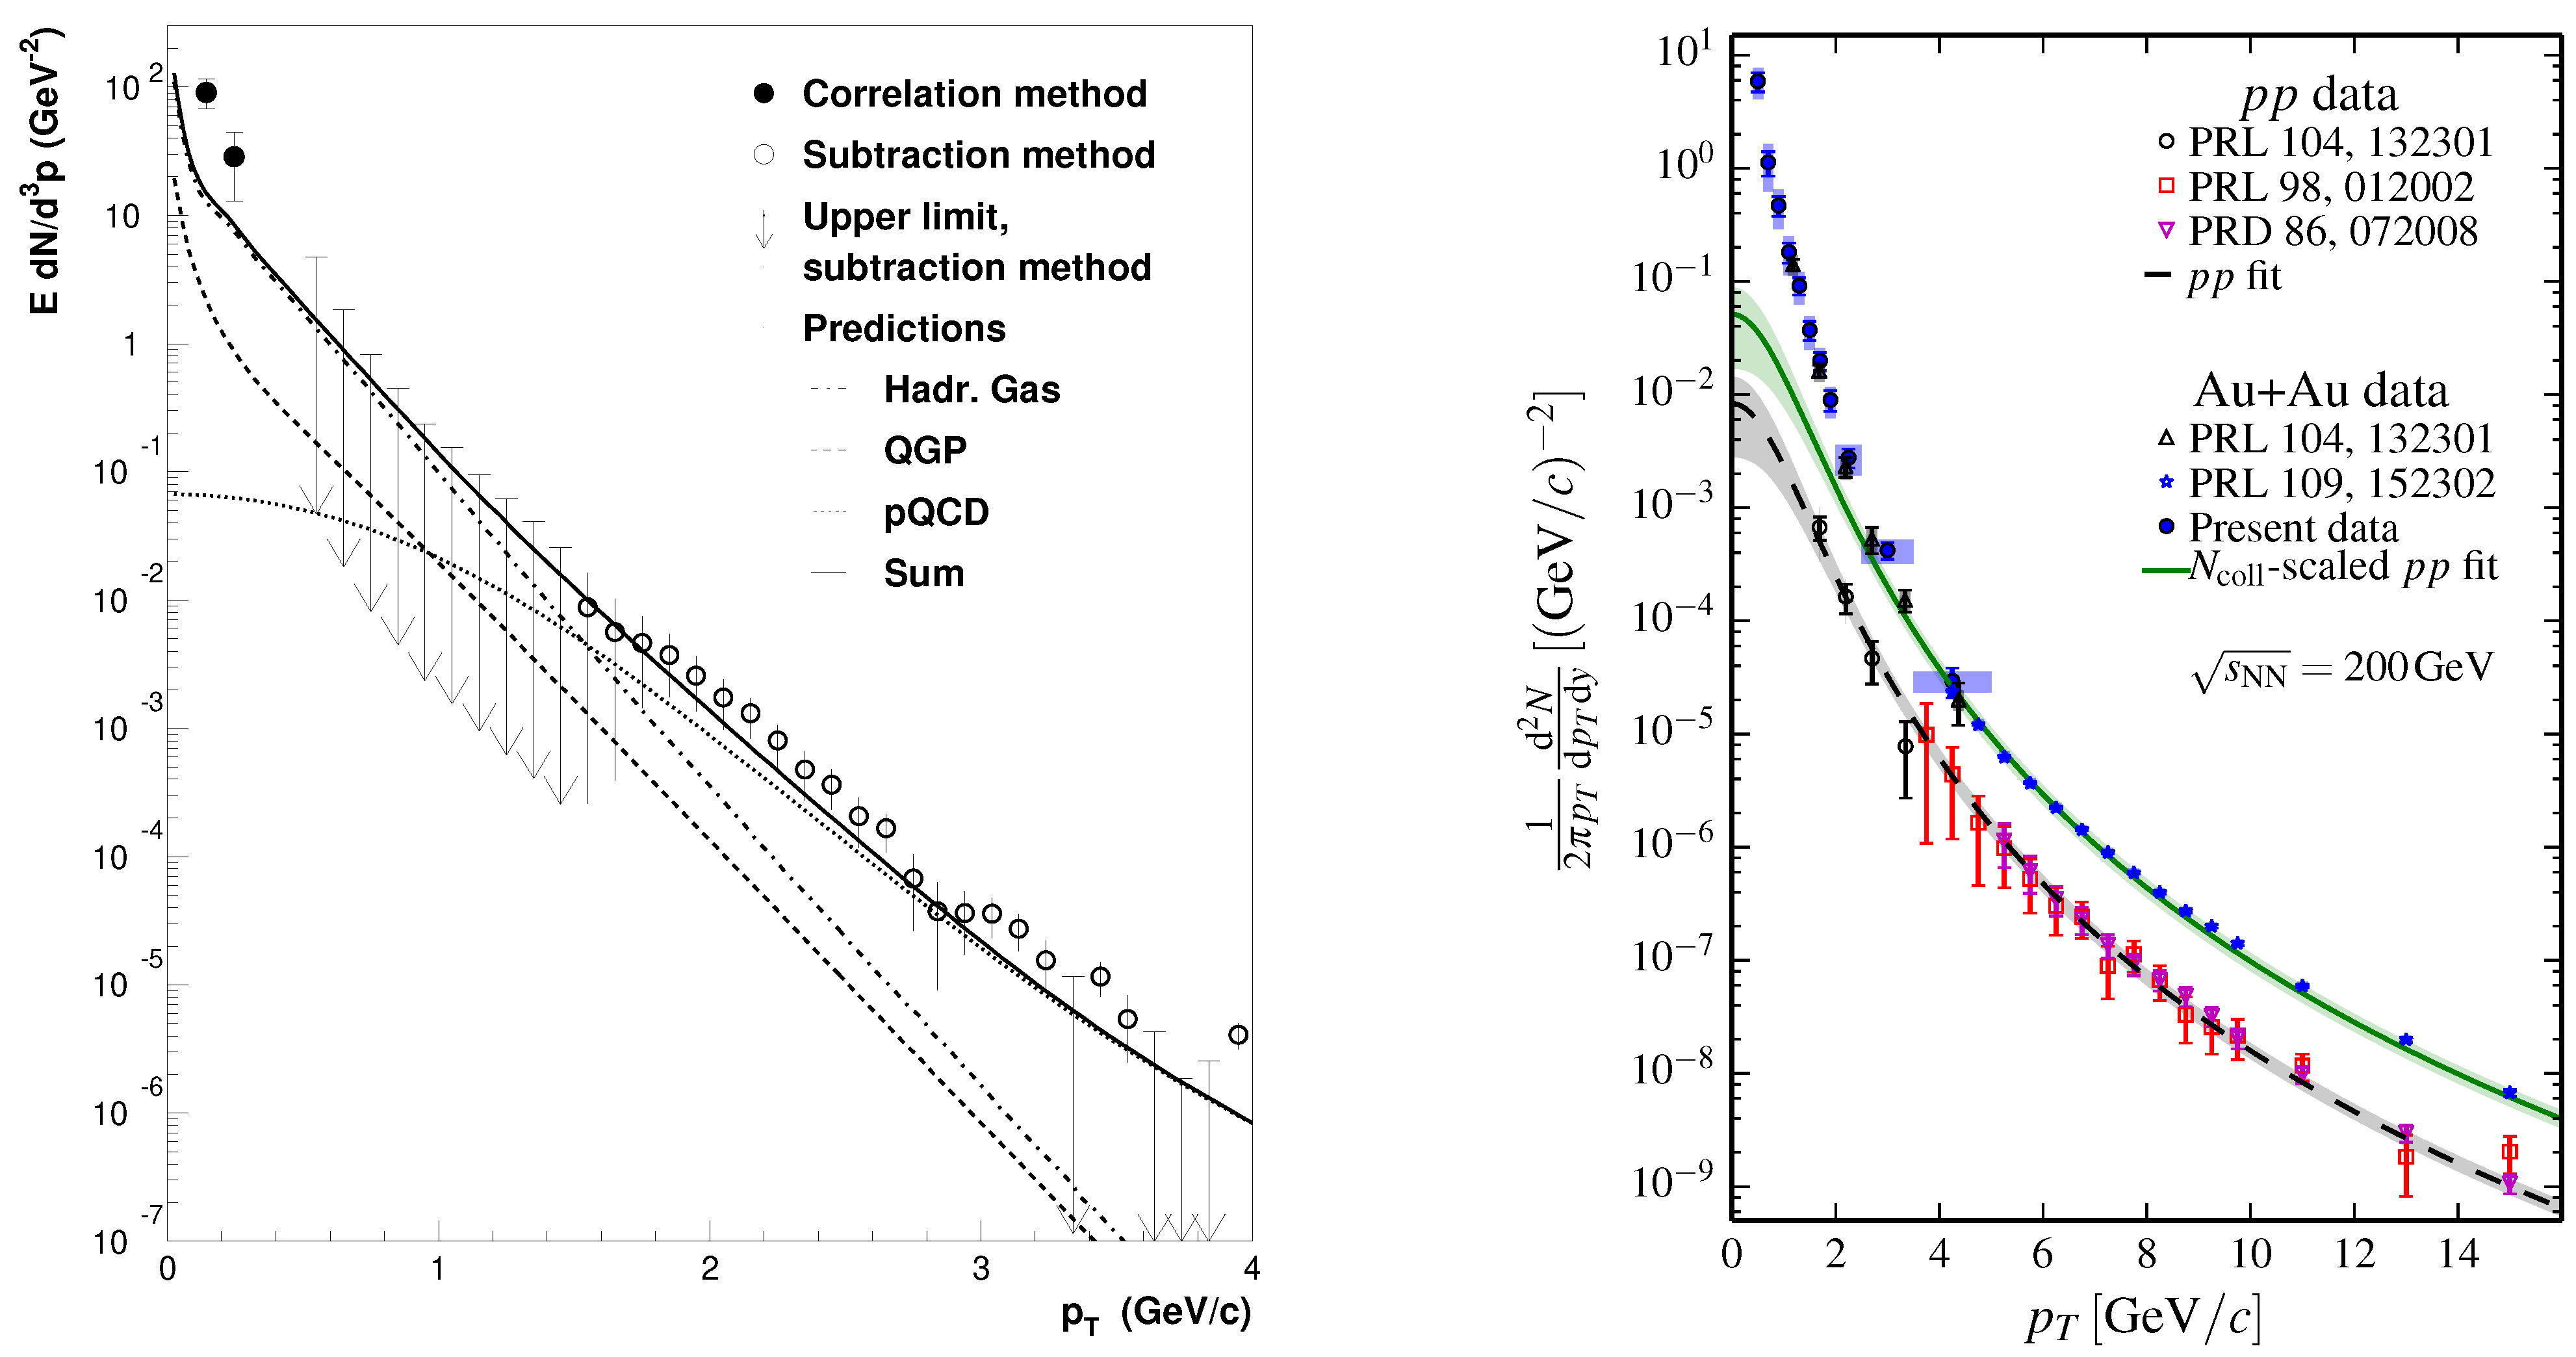
Finally we present a comparison of results produced with different approaches. In Figure 8, left plot, we compare direct photon yield measured with a method based on Bose–Einstein correlations and with a statistical method. The softest region can be explored only with the Bose–Einstein correlations method, which, however, can not be extended to higher . The statistical method provides results at high regions. Note the considerably larger systematic uncertainties of the statistical method. The right plot in Figure 8 shows a summary of measurements of the PHENIX experiment, which provides the unique possibility to compare results produced by different methods for the same colliding system. Points marked as ‘PRL 104’ (empty circles and empty triangles) were measured by internal conversion method. Points marked as ‘PRL 98’ (red empty boxes) and ‘present data’ (blue circles) used the external conversion method and points marked ‘PRD 86’ (magenta triangles) and ‘PRL109’ (blue stars) were measured with the statistical method. The internal conversion method can be applied to lower , and generally provides small systematic uncertainties, but is limited to low due to statistics. The external conversion and statistical methods cover similar ranges and provide comparable systematic uncertainties, but the external conversion method has slightly smaller uncertainties at lower due to the higher purity of the inclusive photon spectrum.
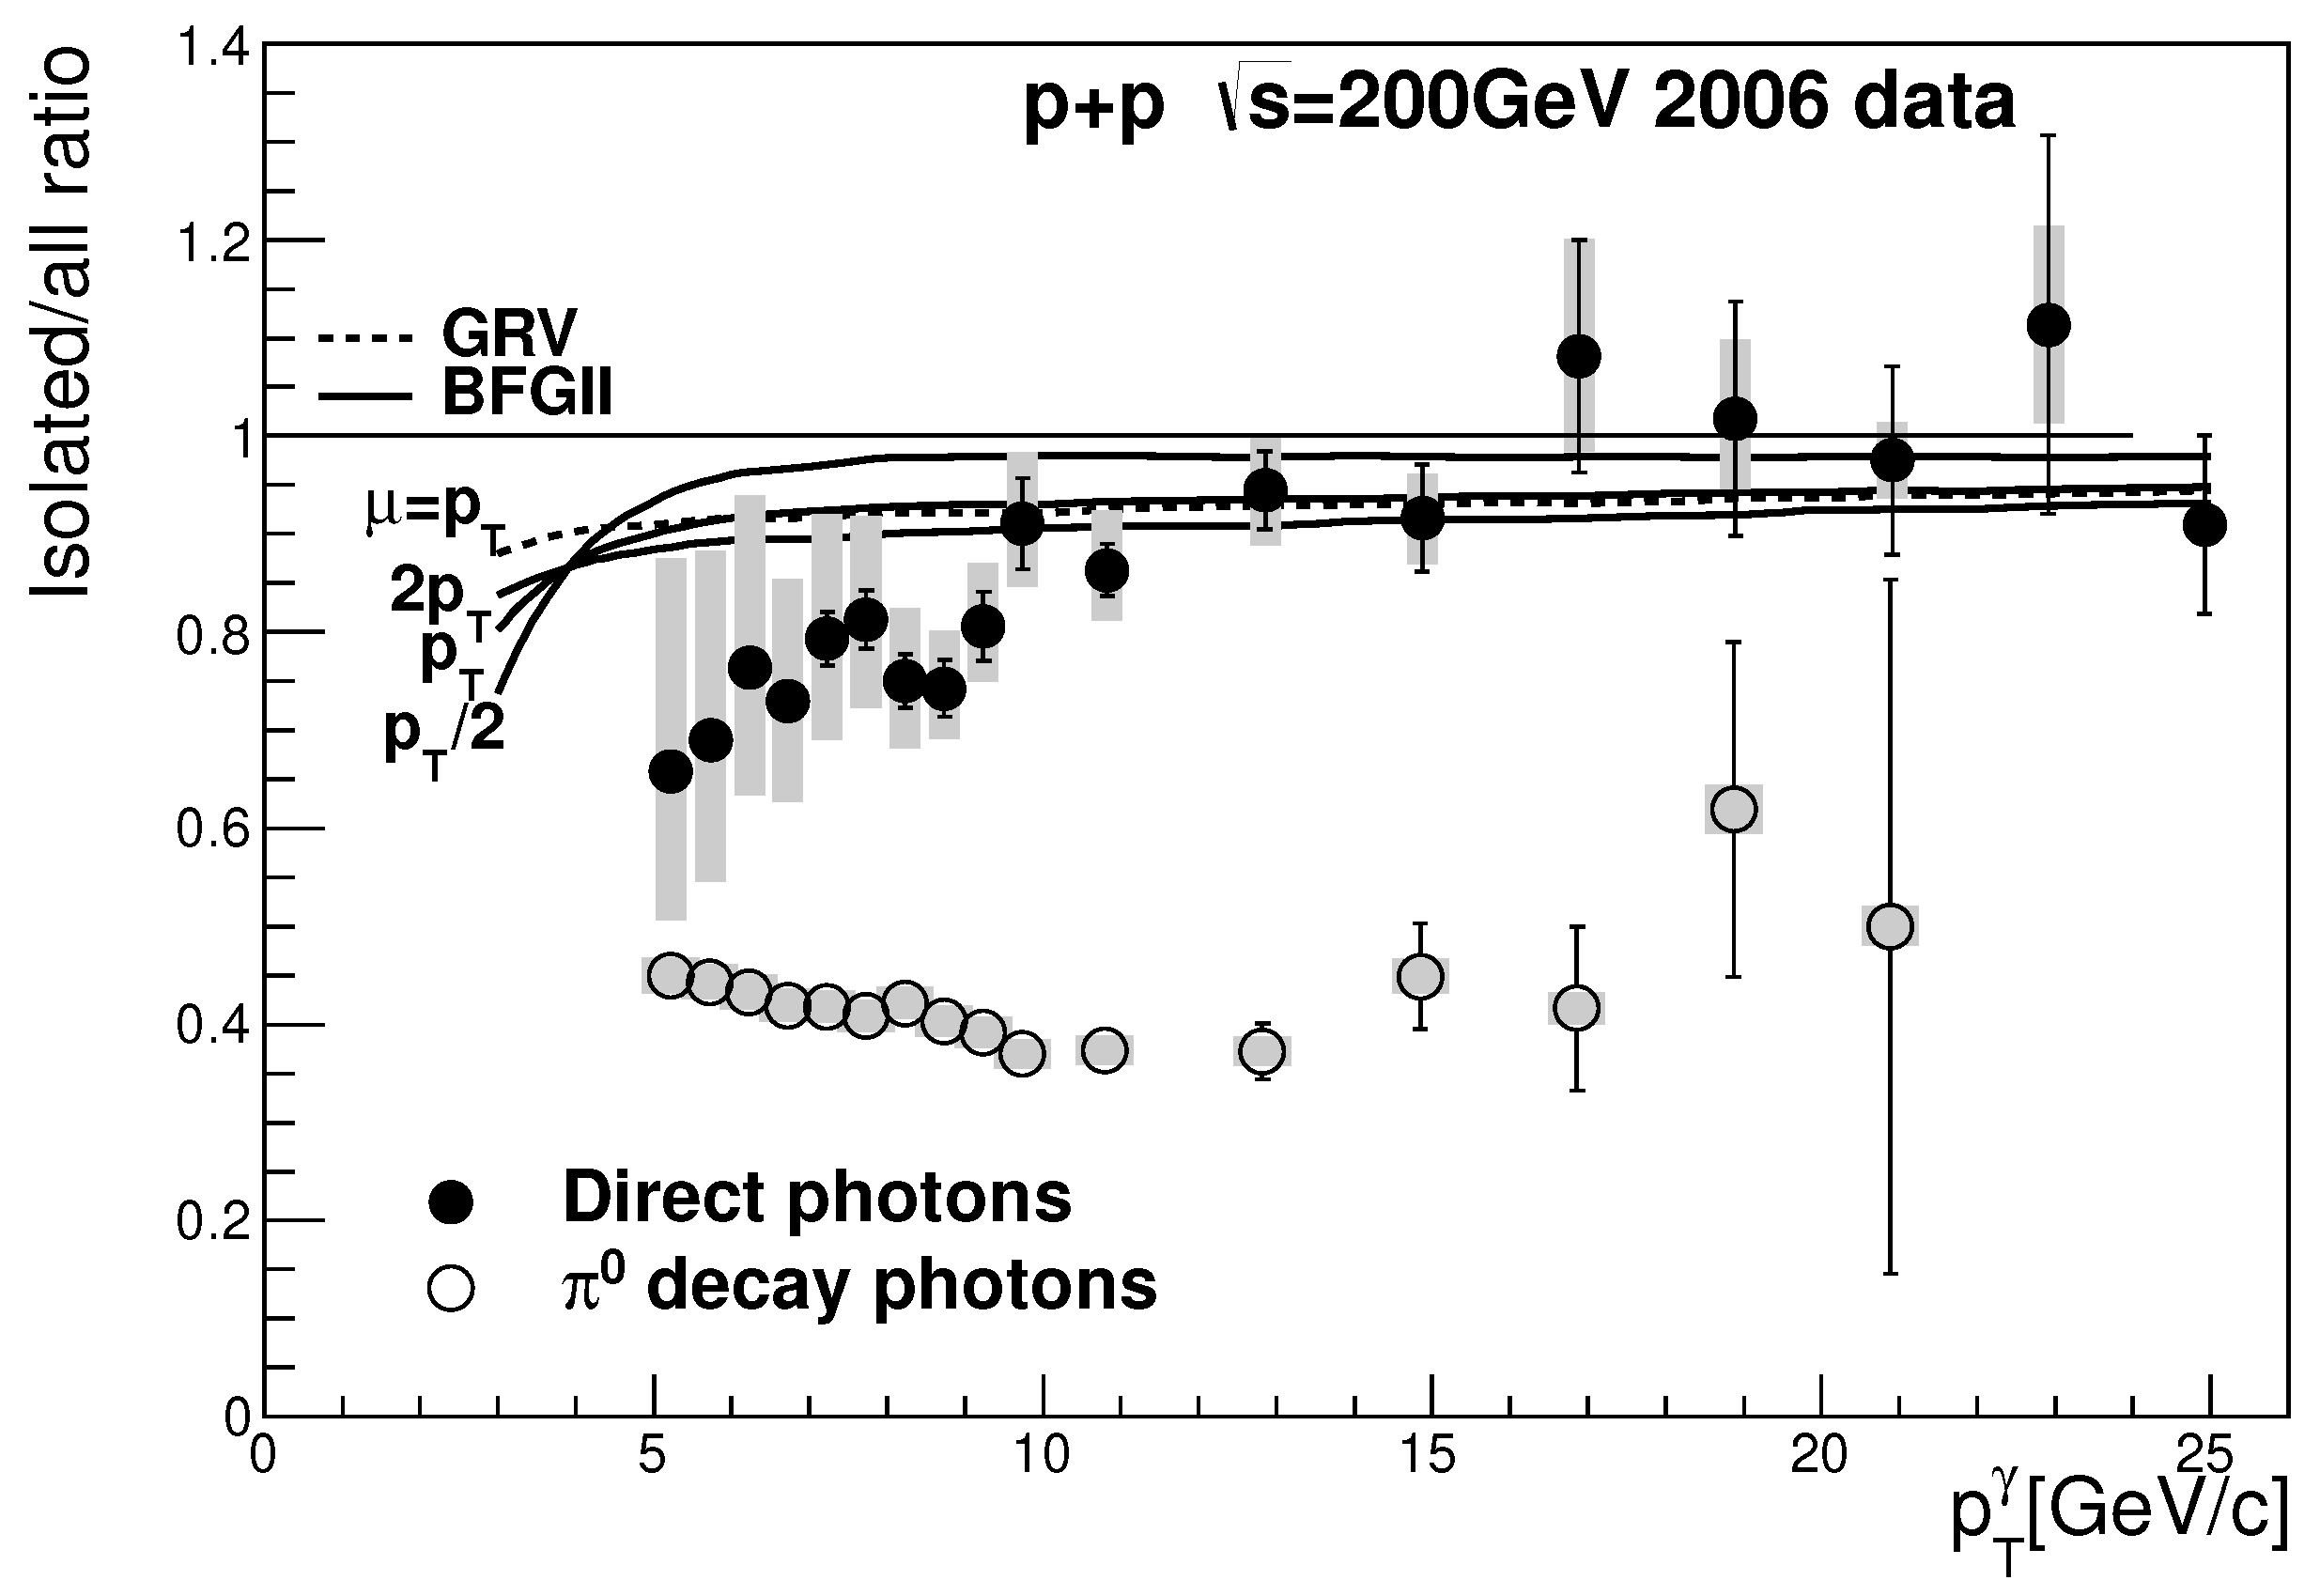
A comparison of the direct and isolated photon spectrum measured in pp collisions at GeV is shown in Figure 9. At lower GeV/c, only ∼50% of direct photons pass the isolation criterion, while the rest of the direct photons originate from quark and gluon fragmentation. At higher , the difference between isolated and direct photons diminishes. Decay photons have a considerable probability of meeting the isolation criterion even at high , which limits the purity of isolated photons to modest values; see Figure 1.
8. Summary and Conclusions
Direct photons provide unique and valuable information about the nucleon structure functions in pp and p–A collisions, as well as about the temperature, space-time dimensions, and development of the collective flow in hot matter created in A–A collisions. However, the fraction of direct photons is small, while the main source of final photons is hadron decays. This has resulted in the development of various techniques of direct photon extraction. Several methods have been proposed, with different advantages and restrictions. We considered the most widely used methods, discussed their applicability in different cases and compared the results.
Funding
This research was supported by the Russian Science Foundation grant 17-72-20234.
Institutional Review Board Statement
Not applicable.
Informed Consent Statement
Not applicable.
Conflicts of Interest
The authors declare no conflict of interest.
References
- Acharya, S.; Adamová, D.; Adler, A.; Adolfsson, J.; Aggarwal, M.M.; Aglieri Rinella, G.; Agnello, M.; Agrawal, N.; Ahammed, Z.; Ahmad, S.; et al. Measurement of isolated photon-hadron correlations in = 5.02 TeV pp and p-Pb collisions. Phys. Rev. C 2020, 102, 044908. [Google Scholar] [CrossRef]
- Aad, G.; Abajyan, T.; Abbott, B.; Abdallah, J.; Khalek, S.A.; Abdelalim, A.A.; Abdinov, O.; Aben, R.; Abi, B.; Abolins, M.; et al. Measurement of the inclusive isolated prompt photon cross section in pp collisions at = 7 TeV with the ATLAS detector. Phys. Rev. D 2011, 83, 052005. [Google Scholar] [CrossRef] [Green Version]
- Khachatryan, V.; Sirunyan, A.M.; Tumasyan, A.; Adam, W.; Bergauer, T.; Dragicevic, M.; Erö, J.; Fabjan, C.; Friedl, M.; Fruehwirth, R.; et al. Measurement of the Isolated Prompt Photon Production Cross Section in pp Collisions at = 7~TeV. Phys. Rev. Lett. 2011, 106, 082001. [Google Scholar] [CrossRef] [PubMed] [Green Version]
- Acharya, S.; Adamová, D.; Adhya, S.P.; Adler, A.; Adolfsson, J.; Aggarwal, M.M.; Rinella, G.A.; Agnello, M.; Agrawal, N.; Ahammed, Z.; et al. Measurement of the inclusive isolated photon production cross section in pp collisions at = 7 TeV. Eur. Phys. J. C 2019, 79, 896. [Google Scholar] [CrossRef]
- Acharya, S.; Acosta, F.T.; Adamova, D.; Adolfsson, J.; Aggarwal, M.M.; Rinella, G.A.; Agnello, M.; Agrawal, N.; Ahammed, Z.; Ahn, S.U.; et al. Direct photon production at low transverse momentum in proton-proton collisions at = 2.76 and 8 TeV. Phys. Rev. C 2019, 99, 024912. [Google Scholar] [CrossRef] [Green Version]
- Aggarwal, M.M.; Agnihotri, A.; Ahammed, Z.; Angelis, A.L.S.; Antonenko, V.; Arefiev, V.; Astakhov, V.; Avdeitchikov, V.; Awes, T.C.; Baba, P.V.K.S.; et al. Observation of direct photons in central 158-A-GeV Pb-208 + Pb-208 collisions. Phys. Rev. Lett. 2000, 85, 3595–3599. [Google Scholar] [CrossRef] [PubMed] [Green Version]
- Dellacasa, G.; Ramello, L.; Scalas, E.; Sitta, M.; Soave, C.; Ahmad, N.; Ahmad, S.; Ahmad, T.; Baritak, W.; Irfan, M.; et al. ALICE Technical Design Report of the Photon Spectrometer (PHOS). 1999. Available online: https://www.researchgate.net/publication/247768400_Alice_Technical_Design_Report_of_the_Photon_Spectrometer_PHOS (accessed on 3 May 2022).
- Cortese, P.; Dellacasa, G.; Gemme, R.; Ramello, L.; Sitta, M.; Ahmad, A.; Ahmad, N.; Danish Azmi, M.; Irfan, M.; Kamal, A.; et al. ALICE Electromagnetic Calorimeter Technical Design Report. 2008. Available online: https://cds.cern.ch/record/1121574 (accessed on 3 May 2022).
- Adare, A.; Afanasiev, S.; Aidala, C.; Ajitanand, N.N.; Akiba, Y.; Akimoto, R.; Al-Bataineh, H.; Al-Ta’ani, H.; Alexander, J.; Angerami, A.; et al. Centrality dependence of low-momentum direct-photon production in Au+Au collisions at = 200 GeV. Phys. Rev. C 2015, 91, 064904. [Google Scholar] [CrossRef] [Green Version]
- Schmidt, N. Direct Photon and Light Neutral Meson Production in Hadron Collisions at the LHC with ALICE. Ph.D. Thesis, Goethe University, Frankfurt am Main, Germany, 2021. [Google Scholar]
- Kroll, N.M.; Wada, W. Internal pair production associated with the emission of high-energy gamma rays. Phys. Rev. 1955, 98, 1355–1359. [Google Scholar] [CrossRef]
- Adare, A.; Afanasiev, S.; Aidala, C.; Ajitanand, N.N.; Akiba, Y.; Al-Bataineh, H.; Alexander, J.; Al-Jamel, A.; Aoki, K.; Aphecetche, L.; et al. Detailed measurement of the e+e− pair continuum in p+p and Au+Au collisions at = 200 GeV and implications for direct photon production. Phys. Rev. C 2010, 81, 034911. [Google Scholar] [CrossRef] [Green Version]
- Aggarwal, M.M.; Ahammed, Z.; Angelis, A.L.S.; Antonenko, V.G.; Arefev, V.; Astakhov, V.A.; Avdeichikov, V.; Awes, T.C.; Baba, P.V.K.S.; Badyal, S.K.; et al. Interferometry of direct photons in central Pb-208+Pb-208 collisions at 158-A-GeV. Phys. Rev. Lett. 2004, 93, 022301. [Google Scholar] [CrossRef] [PubMed] [Green Version]
- Bourhis, L.; Fontannaz, M.; Guillet, J.P. Quarks and gluon fragmentation functions into photons. Eur. Phys. J. C 1998, 2, 529–537. [Google Scholar] [CrossRef]
- Gluck, M.; Reya, E.; Vogt, A. Parton fragmentation into photons beyond the leading order. Phys. Rev. D 1993, 48, 116, Erratum in Phys. Rev. D 1995, 51, 1427. [Google Scholar] [CrossRef] [PubMed]
- Adare, A.; Afanasiev, S.; Aidala, C.; Ajitanand, N.N.; Akiba, Y.; Al-Bataineh, H.; Alexander, J.; Aoki, K.; Aphecetche, L.; Asai, J.; et al. Direct-Photon Production in p+p Collisions at = 200 GeV at Midrapidity. Phys. Rev. D 2012, 86, 072008. [Google Scholar] [CrossRef] [Green Version]
Figure 1.
Purity of the isolated photon sample as a function of transverse momentum for pp and p–Pb data. The error bars represent statistical uncertainties only. The red shaded area represents systematic uncertainties in pp, the blue empty boxes represent systematic uncertainties in p–Pb [1].
Figure 1.
Purity of the isolated photon sample as a function of transverse momentum for pp and p–Pb data. The error bars represent statistical uncertainties only. The red shaded area represents systematic uncertainties in pp, the blue empty boxes represent systematic uncertainties in p–Pb [1].

Figure 2.
Left plot: Isolated photon differential cross section measured in pp collisions at TeV [4]. Error bars represent statistical and boxes represent systematic uncertainties. The bands correspond to pQCD calculations with JETPHOX. Right plot: Ratio between differential cross section measurements and theory predictions for ATLAS [2], CMS [3] and ALICE [1]. Error bars are statistical and boxes are the quadratic sum of statistical and systematic uncertainties. The normalisation uncertainty of each experiment is presented as an overall box around unity.

Figure 3.
Ratio of decay photons from different sources to all decay photons in the decay photon simulation of pp collisions at TeV [5].
Figure 3.
Ratio of decay photons from different sources to all decay photons in the decay photon simulation of pp collisions at TeV [5].

Figure 4.
Left plot: the ratio as a function of transverse momentum for peripheral (part (a)) and central (part (b)) 158 A GeV Pb+Pb collisions. The errors on the data points indicate the statistical errors only. The -dependent systematical errors are indicated by the shaded bands (). (Note: upper and lower errors are inverted for display purposes.) Right plot: the invariant direct photon multiplicity for central 158 A GeV Pb+Pb collisions. The error bars indicate the combined statistical and systematical errors. Data points with downward arrows indicate unbounded CL upper limits.

Figure 5.
Purity of the inclusive photon sample in Non-Single-Diffractive (NSD) p–Pb collisions at TeV for different reconstruction techniques [10].
Figure 5.
Purity of the inclusive photon sample in Non-Single-Diffractive (NSD) p–Pb collisions at TeV for different reconstruction techniques [10].

Figure 6.
Dilectron mass distribution for Au–Au (min. bias) events for GeV/c. The two-component fit with function is explained in the text. The fit range is GeV/. The dashed black curve at greater shows outside of the fit range [12].
Figure 6.
Dilectron mass distribution for Au–Au (min. bias) events for GeV/c. The two-component fit with function is explained in the text. The fit range is GeV/. The dashed black curve at greater shows outside of the fit range [12].

Figure 7.
Left plot: the two-photon correlation function for average photon momenta MeV/c (top) and MeV/c (bottom) measured in 0–20% central 158 A GeV Pb+Pb collisions and fitted with Equation (5) [13]. Right plot: Comparison of parameters of correlation functions measured with different particle identification criteria: △—all clusters, ▼—narrow electromagnetic, □—all neutral, ◯—narrow neutral electromagnetic (no significant result for high ).

Figure 8.
Left plot: direct photon spectrum in 0–20% central 158 A GeV Pb+Pb collisions extracted with two methods: from the strength of the two-photon correlation (closed circles) and by the statistical method (open circles, or arrows indicating upper limits) [13]. Total statistical plus systematical errors are shown. Right plot: direct photon spectrum measured in pp and Au–Au collisions at GeV with different methods, see text.

Figure 9.
The effect of isolation cut on direct photons and decay photons. Solid circles: ratio of isolated direct photons to inclusive-direct photons. The statistical uncertainties are shown as black error bars and the systematic uncertainties are plotted as shaded bars. The solid and dashed curves are NLO pQCD calculations with three theory scales for BFGII [14] and one scale for the GRV [15] parton to photon fragmentation functions. Open circles: ratio of isolated photons from decays to all photons from decays [16].

Publisher’s Note: MDPI stays neutral with regard to jurisdictional claims in published maps and institutional affiliations. |
© 2022 by the author. Licensee MDPI, Basel, Switzerland. This article is an open access article distributed under the terms and conditions of the Creative Commons Attribution (CC BY) license (https://creativecommons.org/licenses/by/4.0/).
Share and Cite
MDPI and ACS Style
Peresunko, D. Approaches to Measuring Direct Photon Yield in A–A Collisions. Particles 2022, 5, 188-197. https://0-doi-org.brum.beds.ac.uk/10.3390/particles5020017
AMA Style
Peresunko D. Approaches to Measuring Direct Photon Yield in A–A Collisions. Particles. 2022; 5(2):188-197. https://0-doi-org.brum.beds.ac.uk/10.3390/particles5020017
Chicago/Turabian StylePeresunko, Dmitri. 2022. "Approaches to Measuring Direct Photon Yield in A–A Collisions" Particles 5, no. 2: 188-197. https://0-doi-org.brum.beds.ac.uk/10.3390/particles5020017