
HIF-α Activation Impacts Macrophage Function during Murine Leishmania major Infection

 and
and 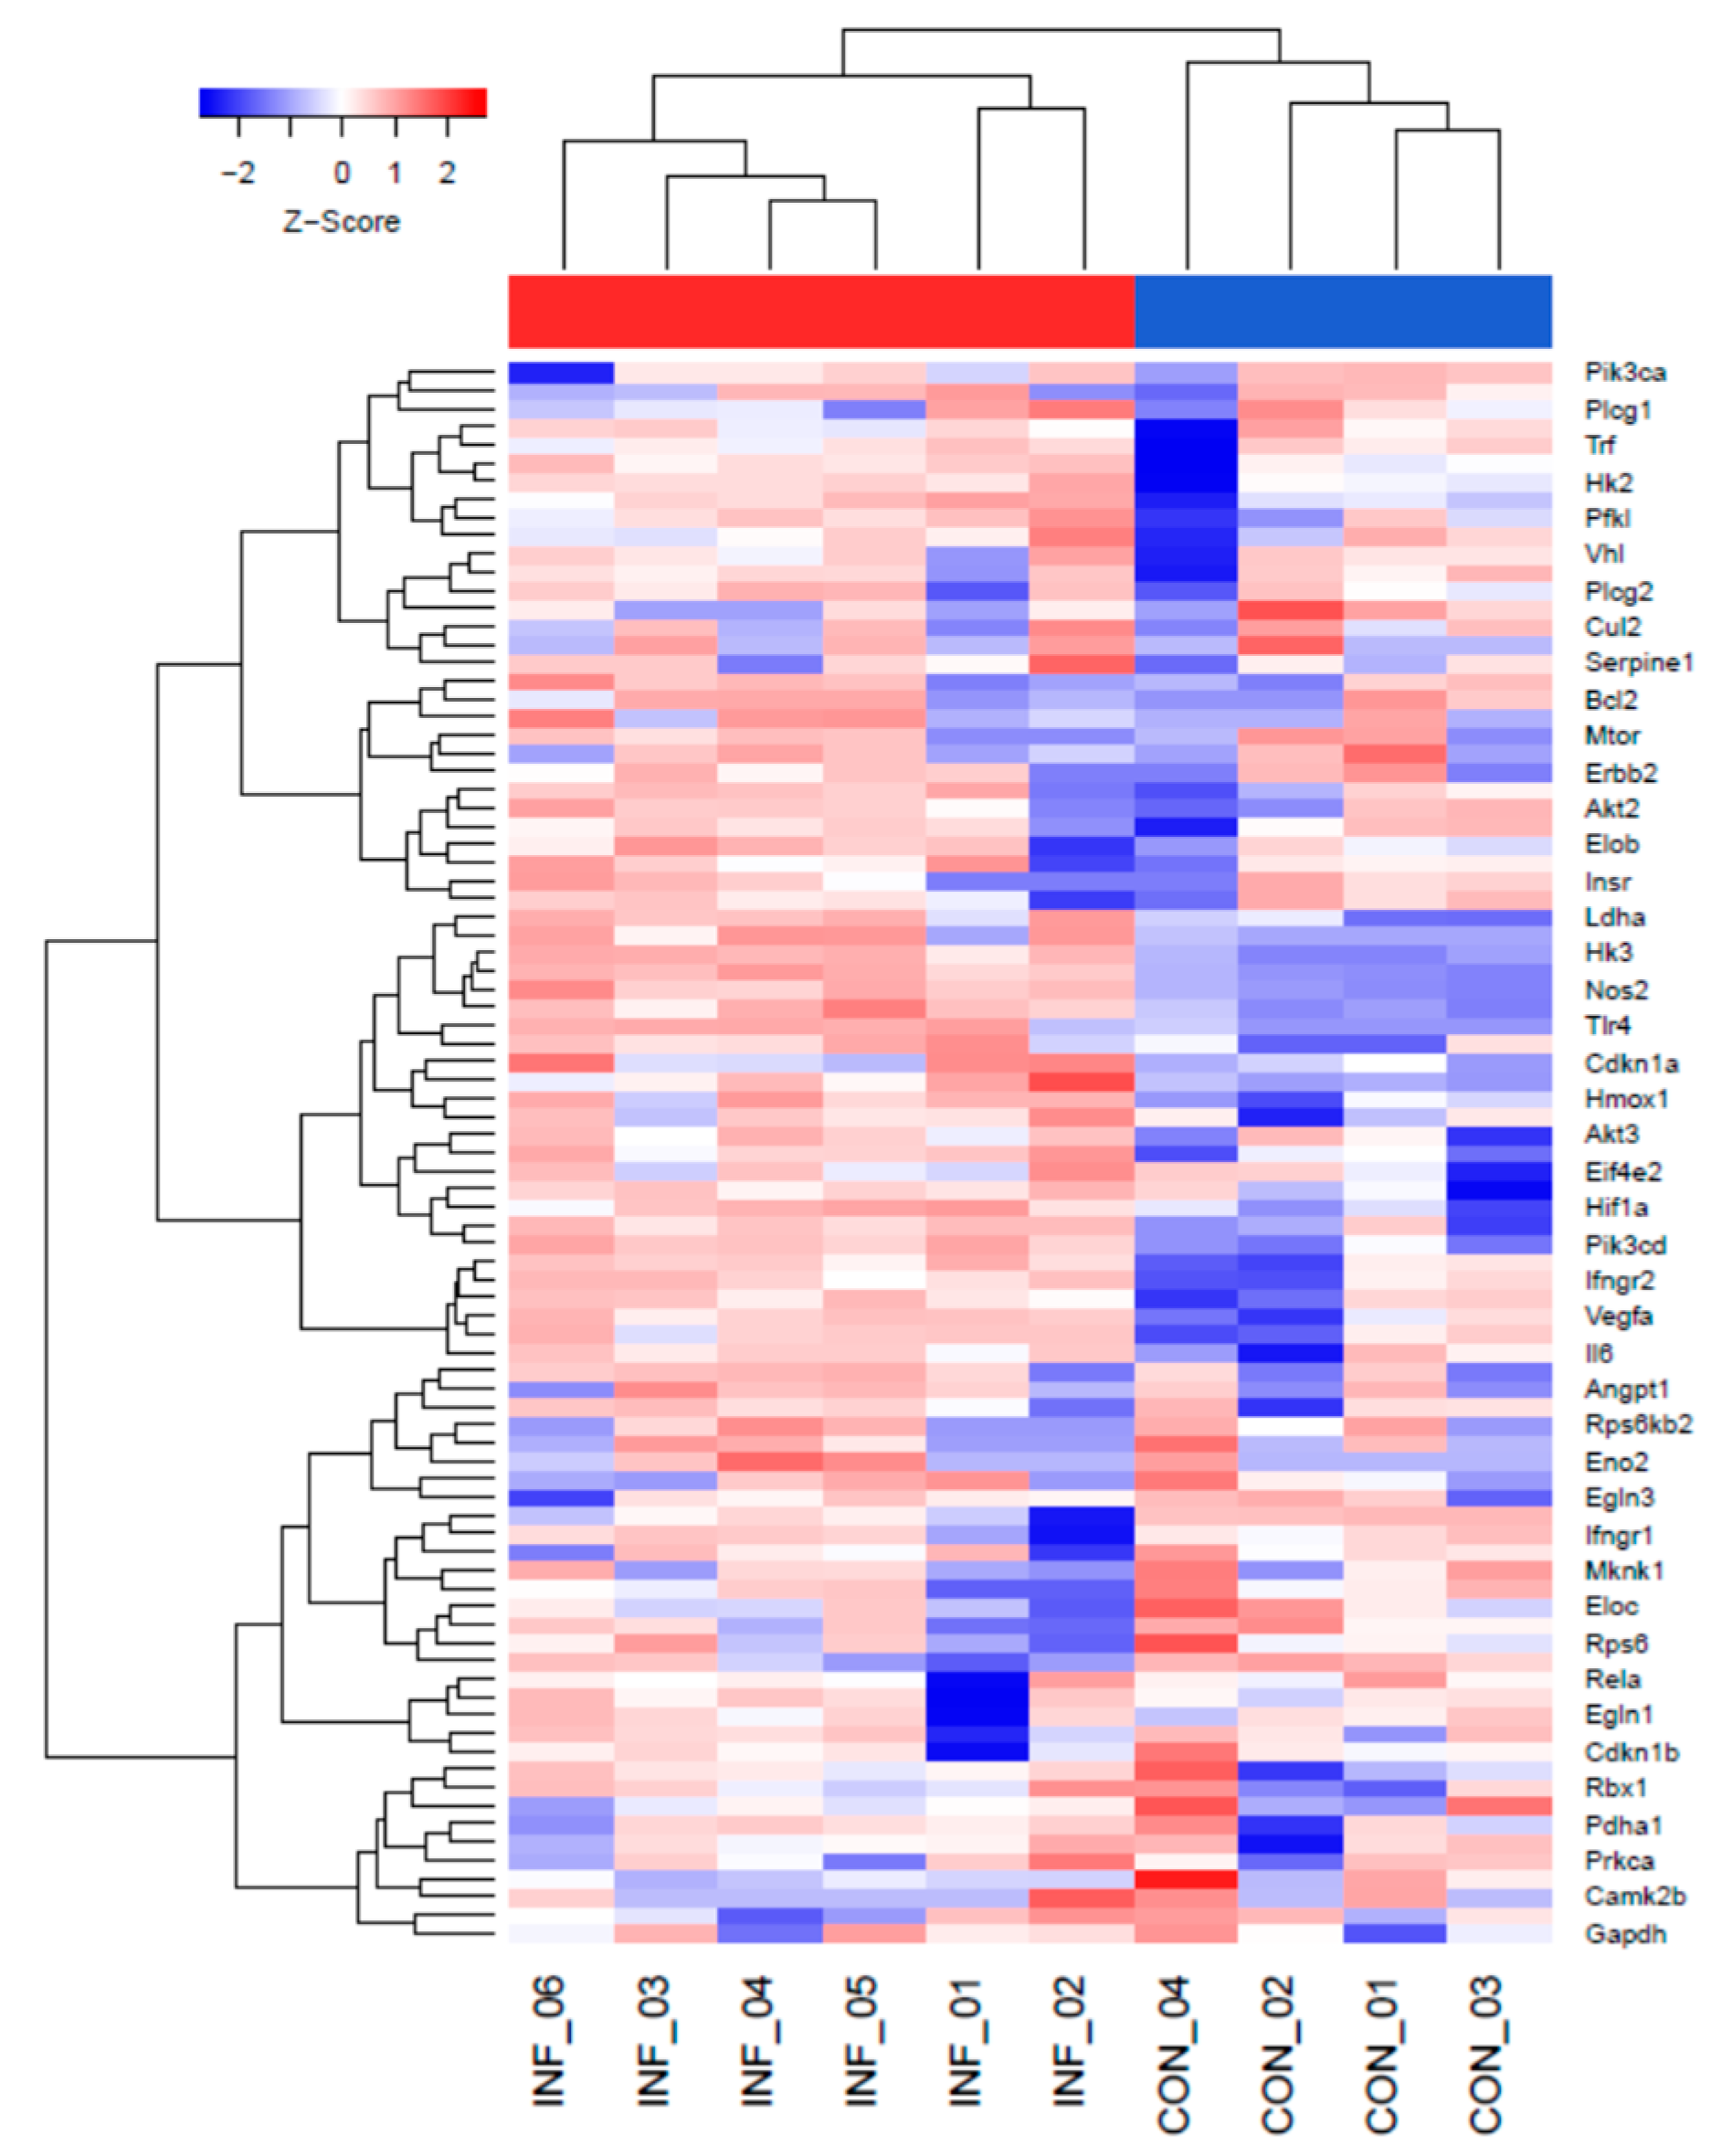
Abstract
:1. Introduction
2. Results
2.1. The HIF-1α Signaling Pathway Is Increased during L. major Infection In Vivo
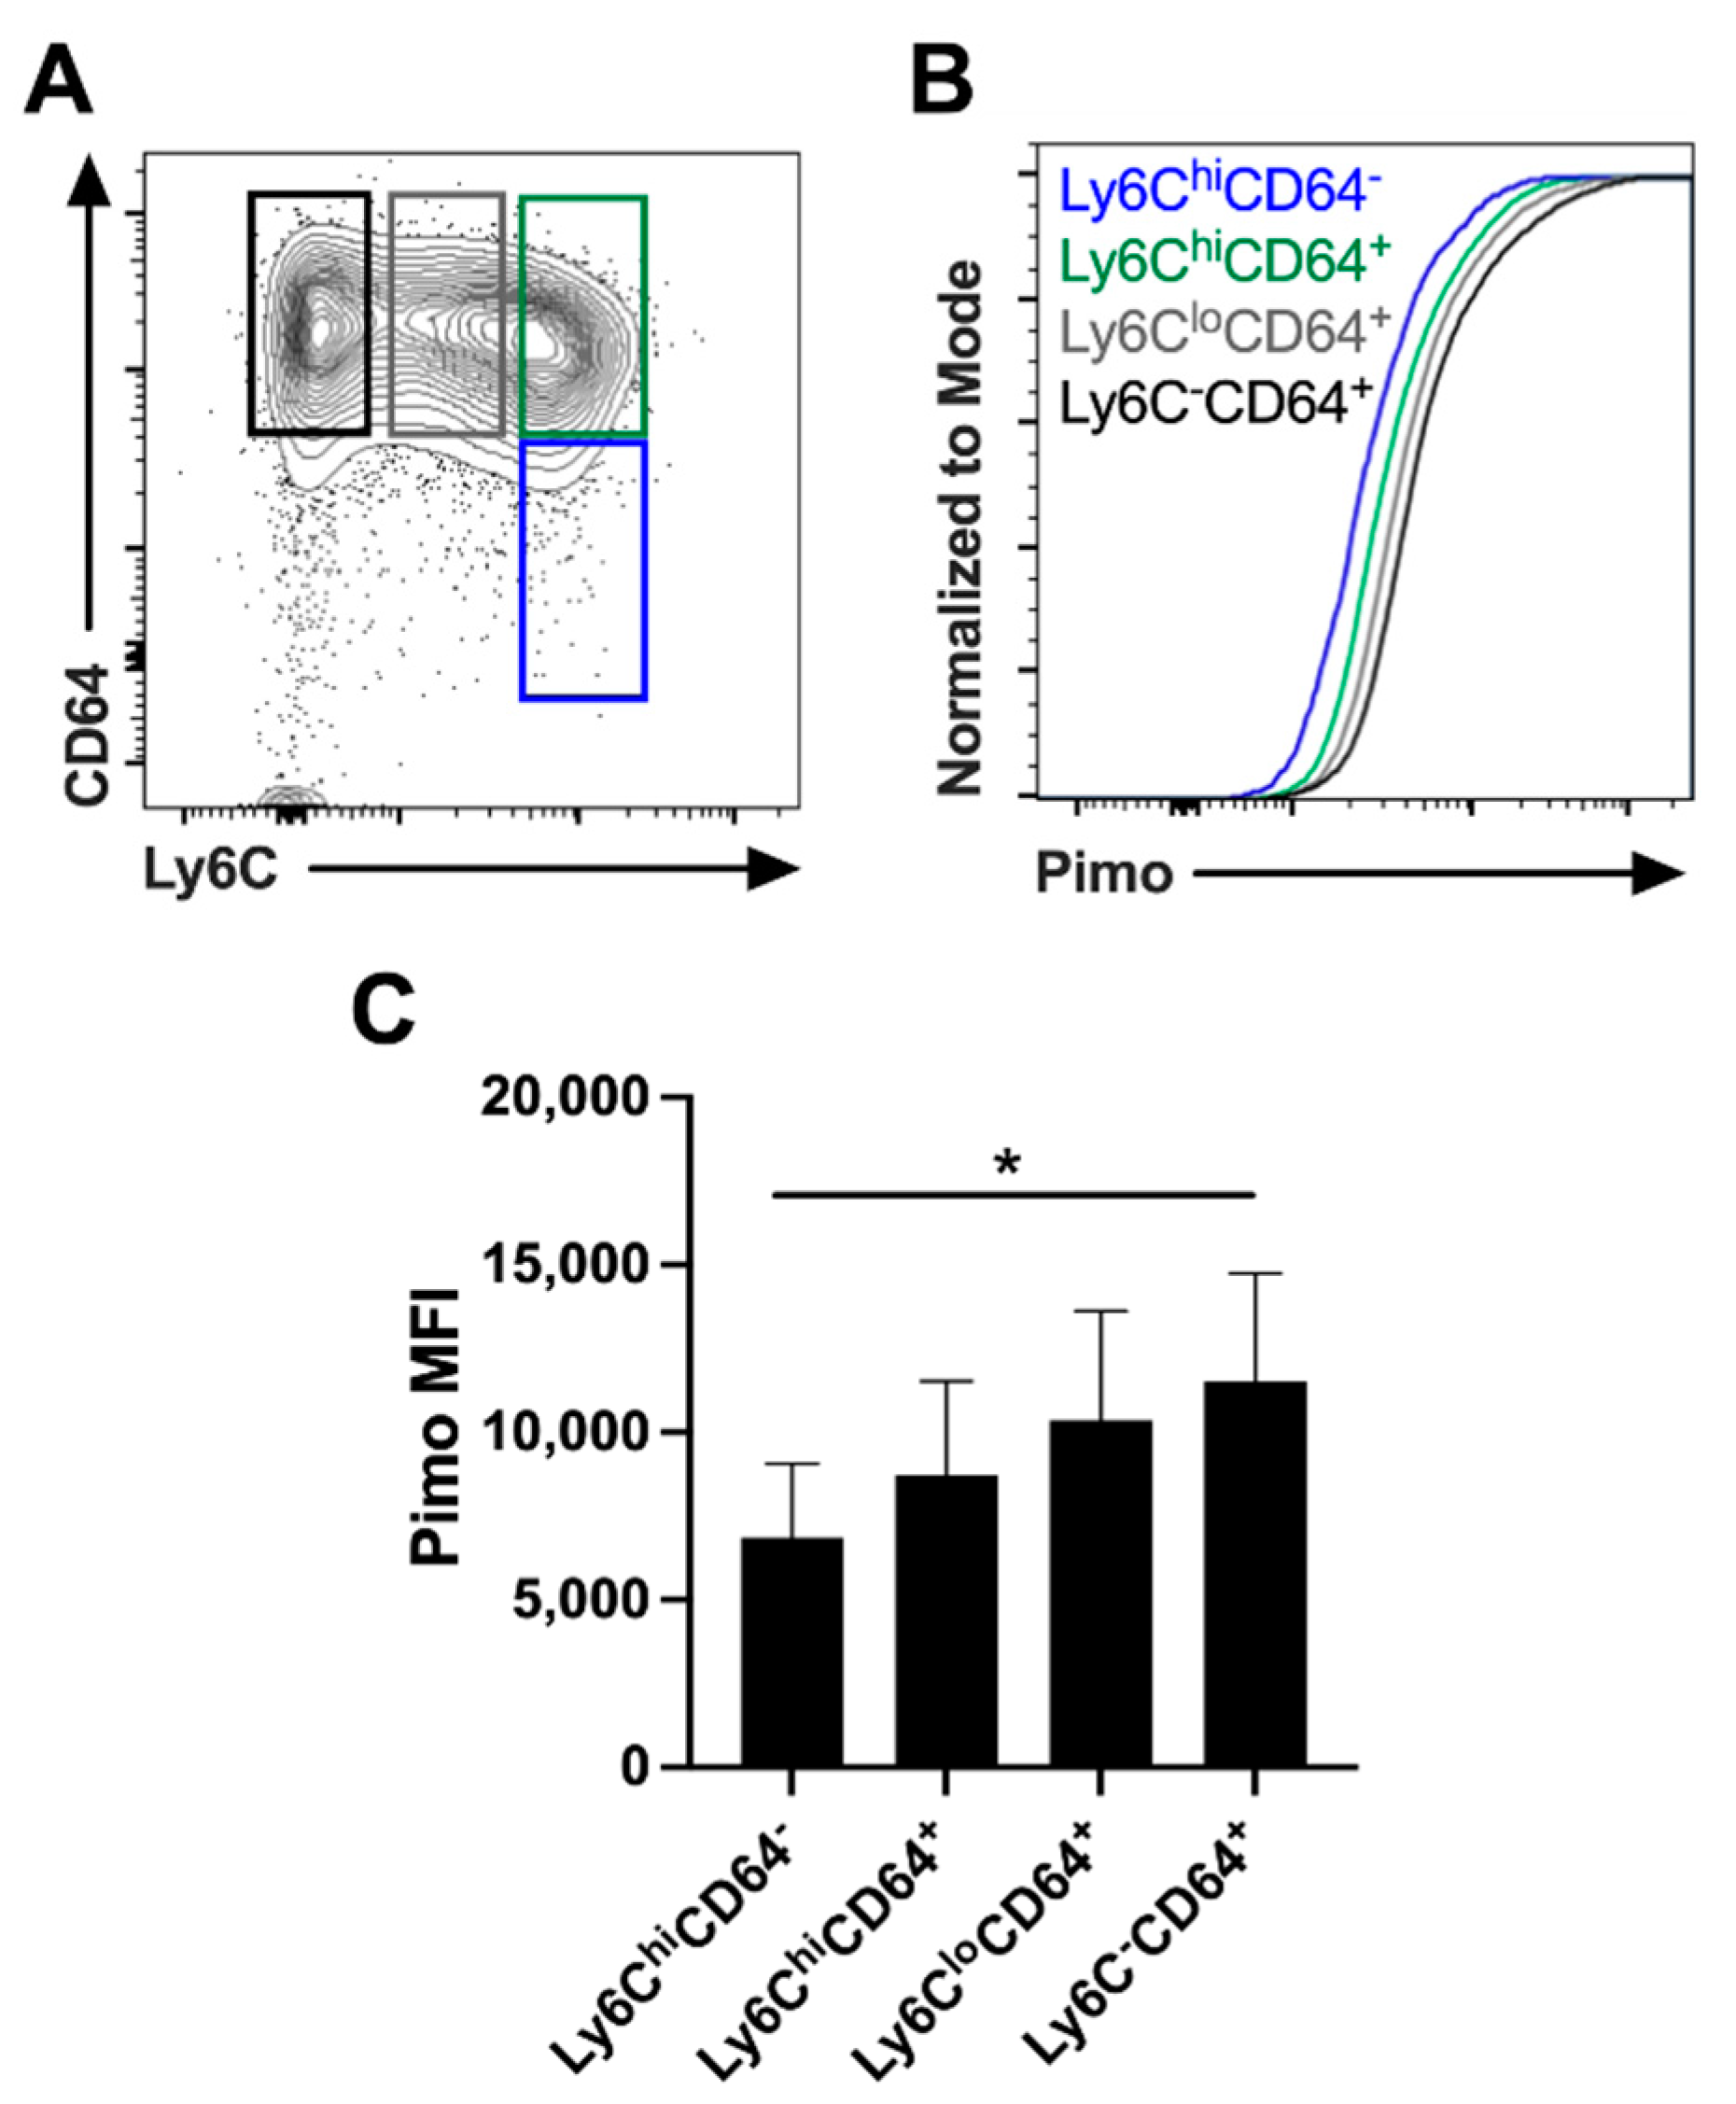
2.2. Myeloid Cells Experience Inflammatory Hypoxia in Leishmanial Lesions
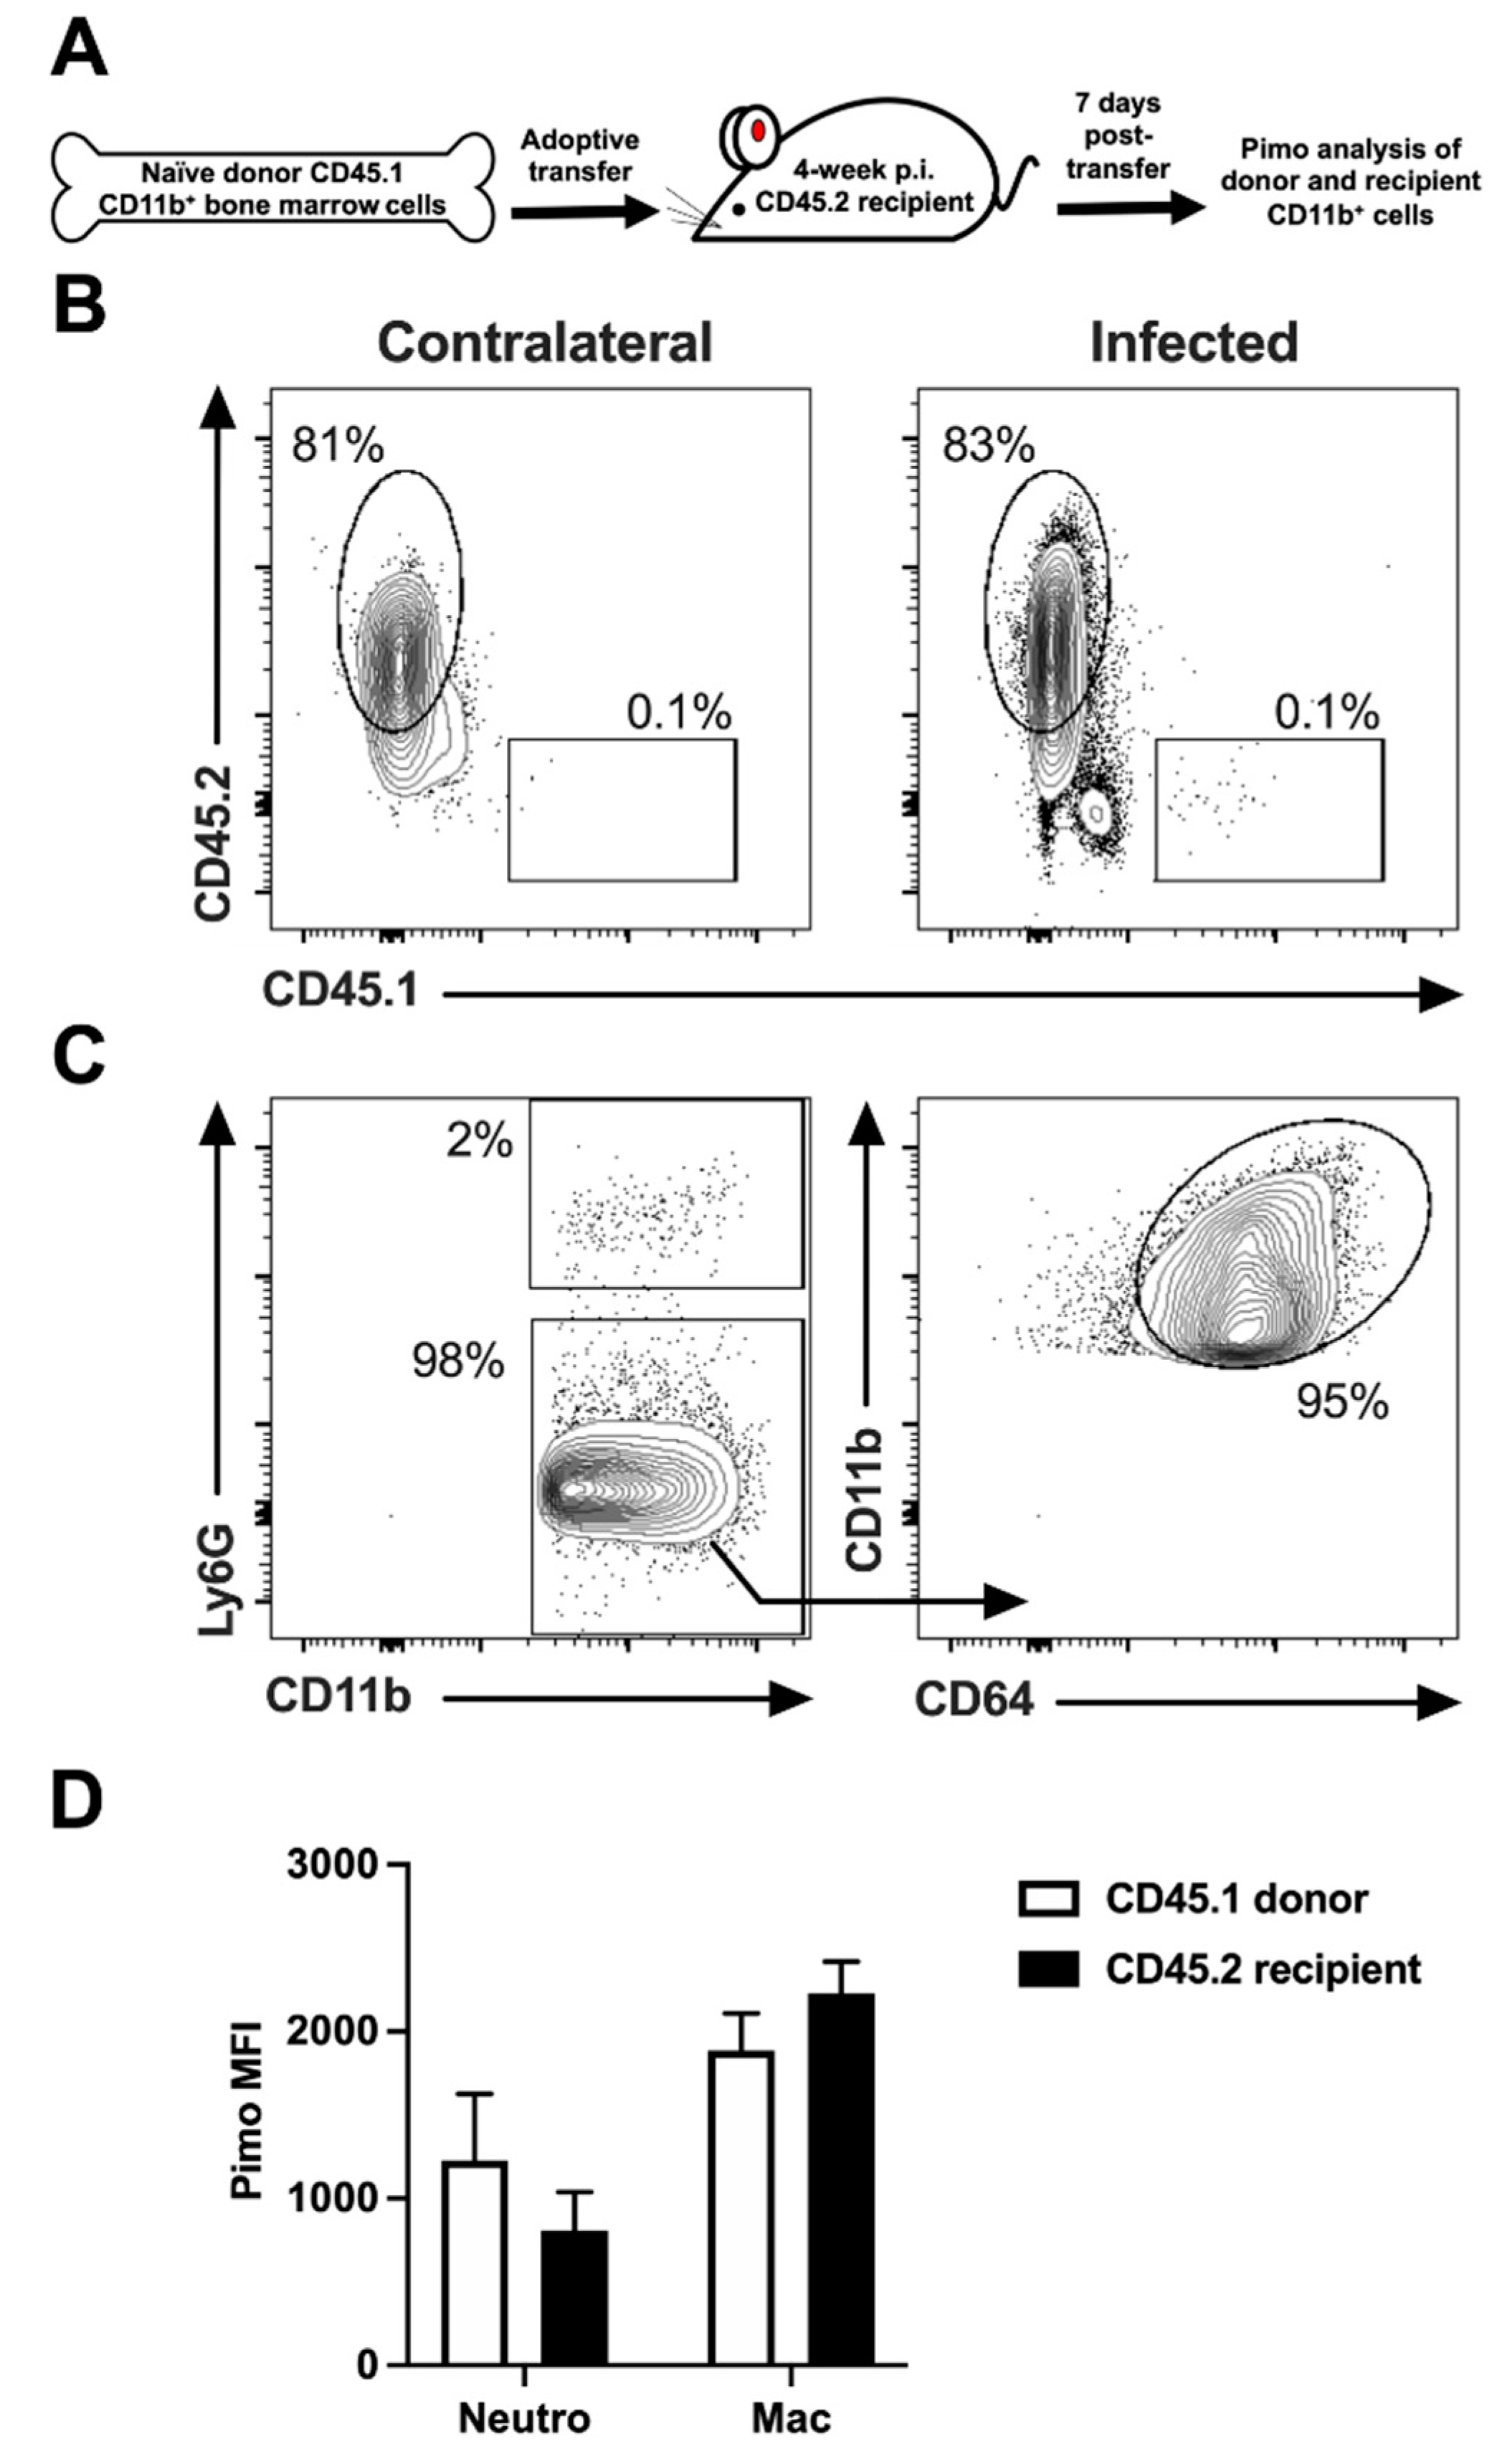
2.3. The Length of Time a Myeloid Cell Spends in Leishmanial Lesions Dictates the Hypoxic Signature of That Cell
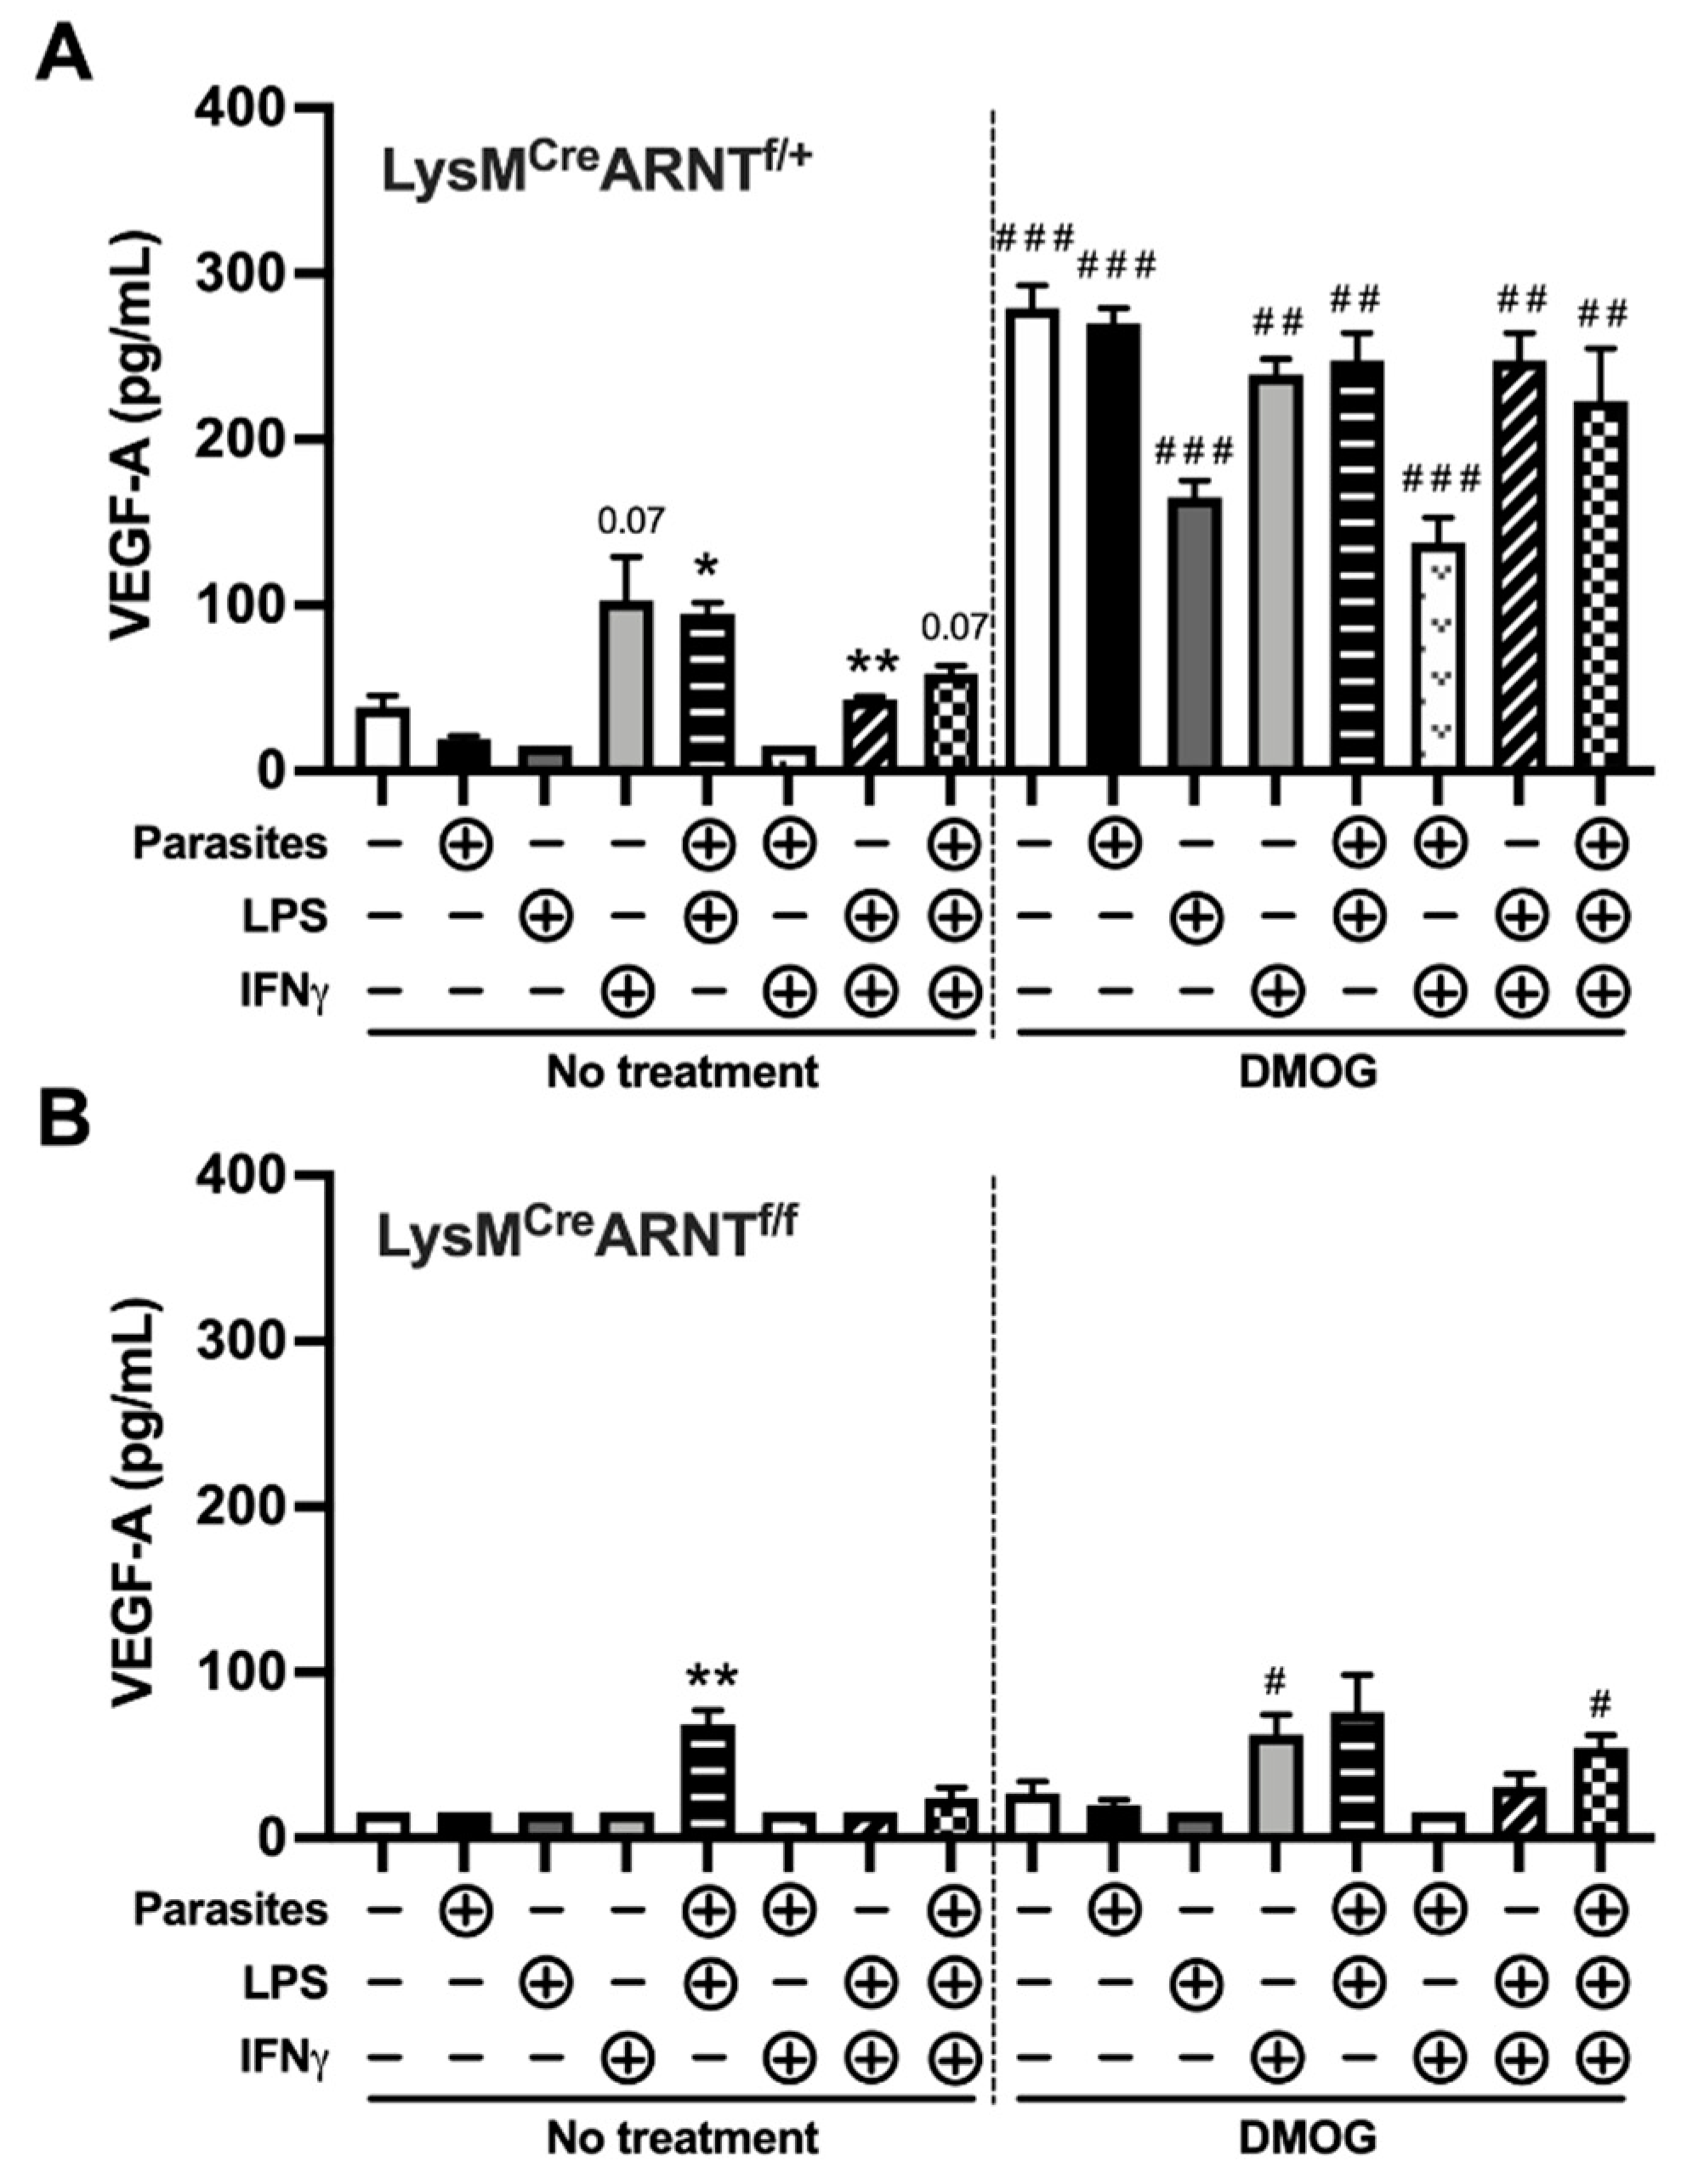
2.4. Proinflammatory Stimuli and HIF-α Stabilization Induce Macrophage VEGF-A Production in an ARNT/HIF-Dependent Manner during L. major Infection
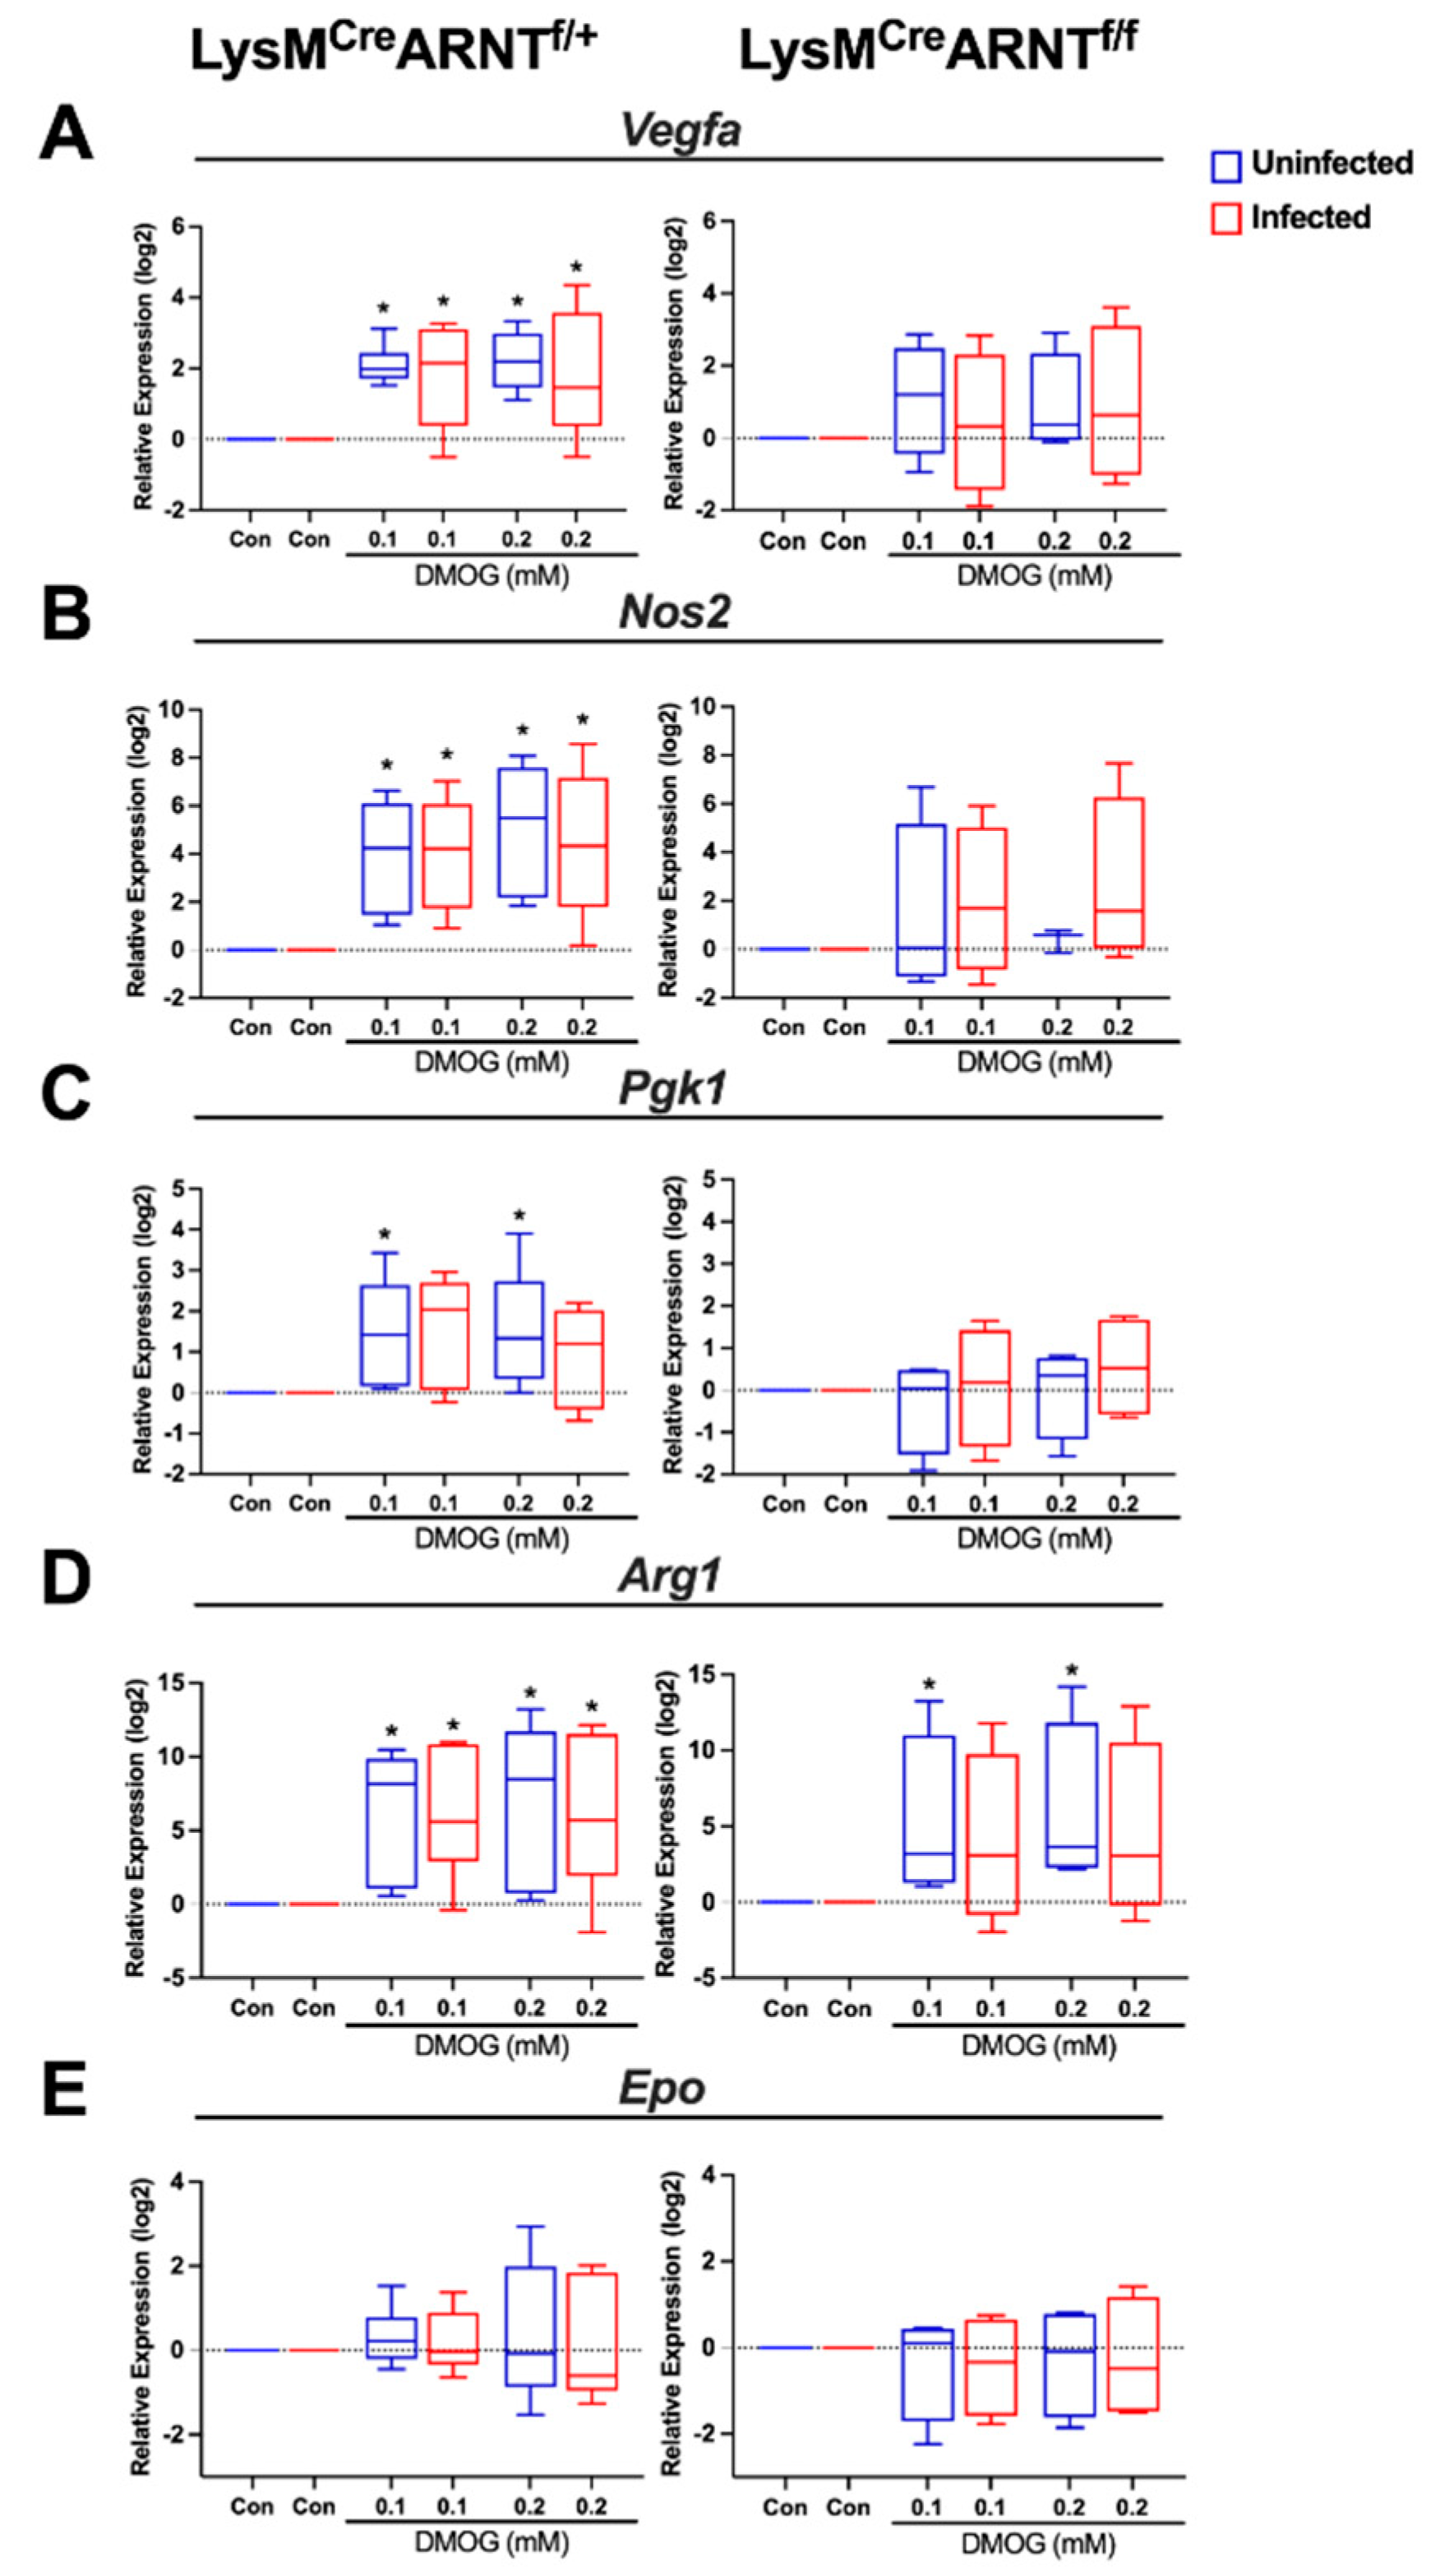
2.5. DMOG Induces HIF-1α and HIF-2α Activation during L. major Infection
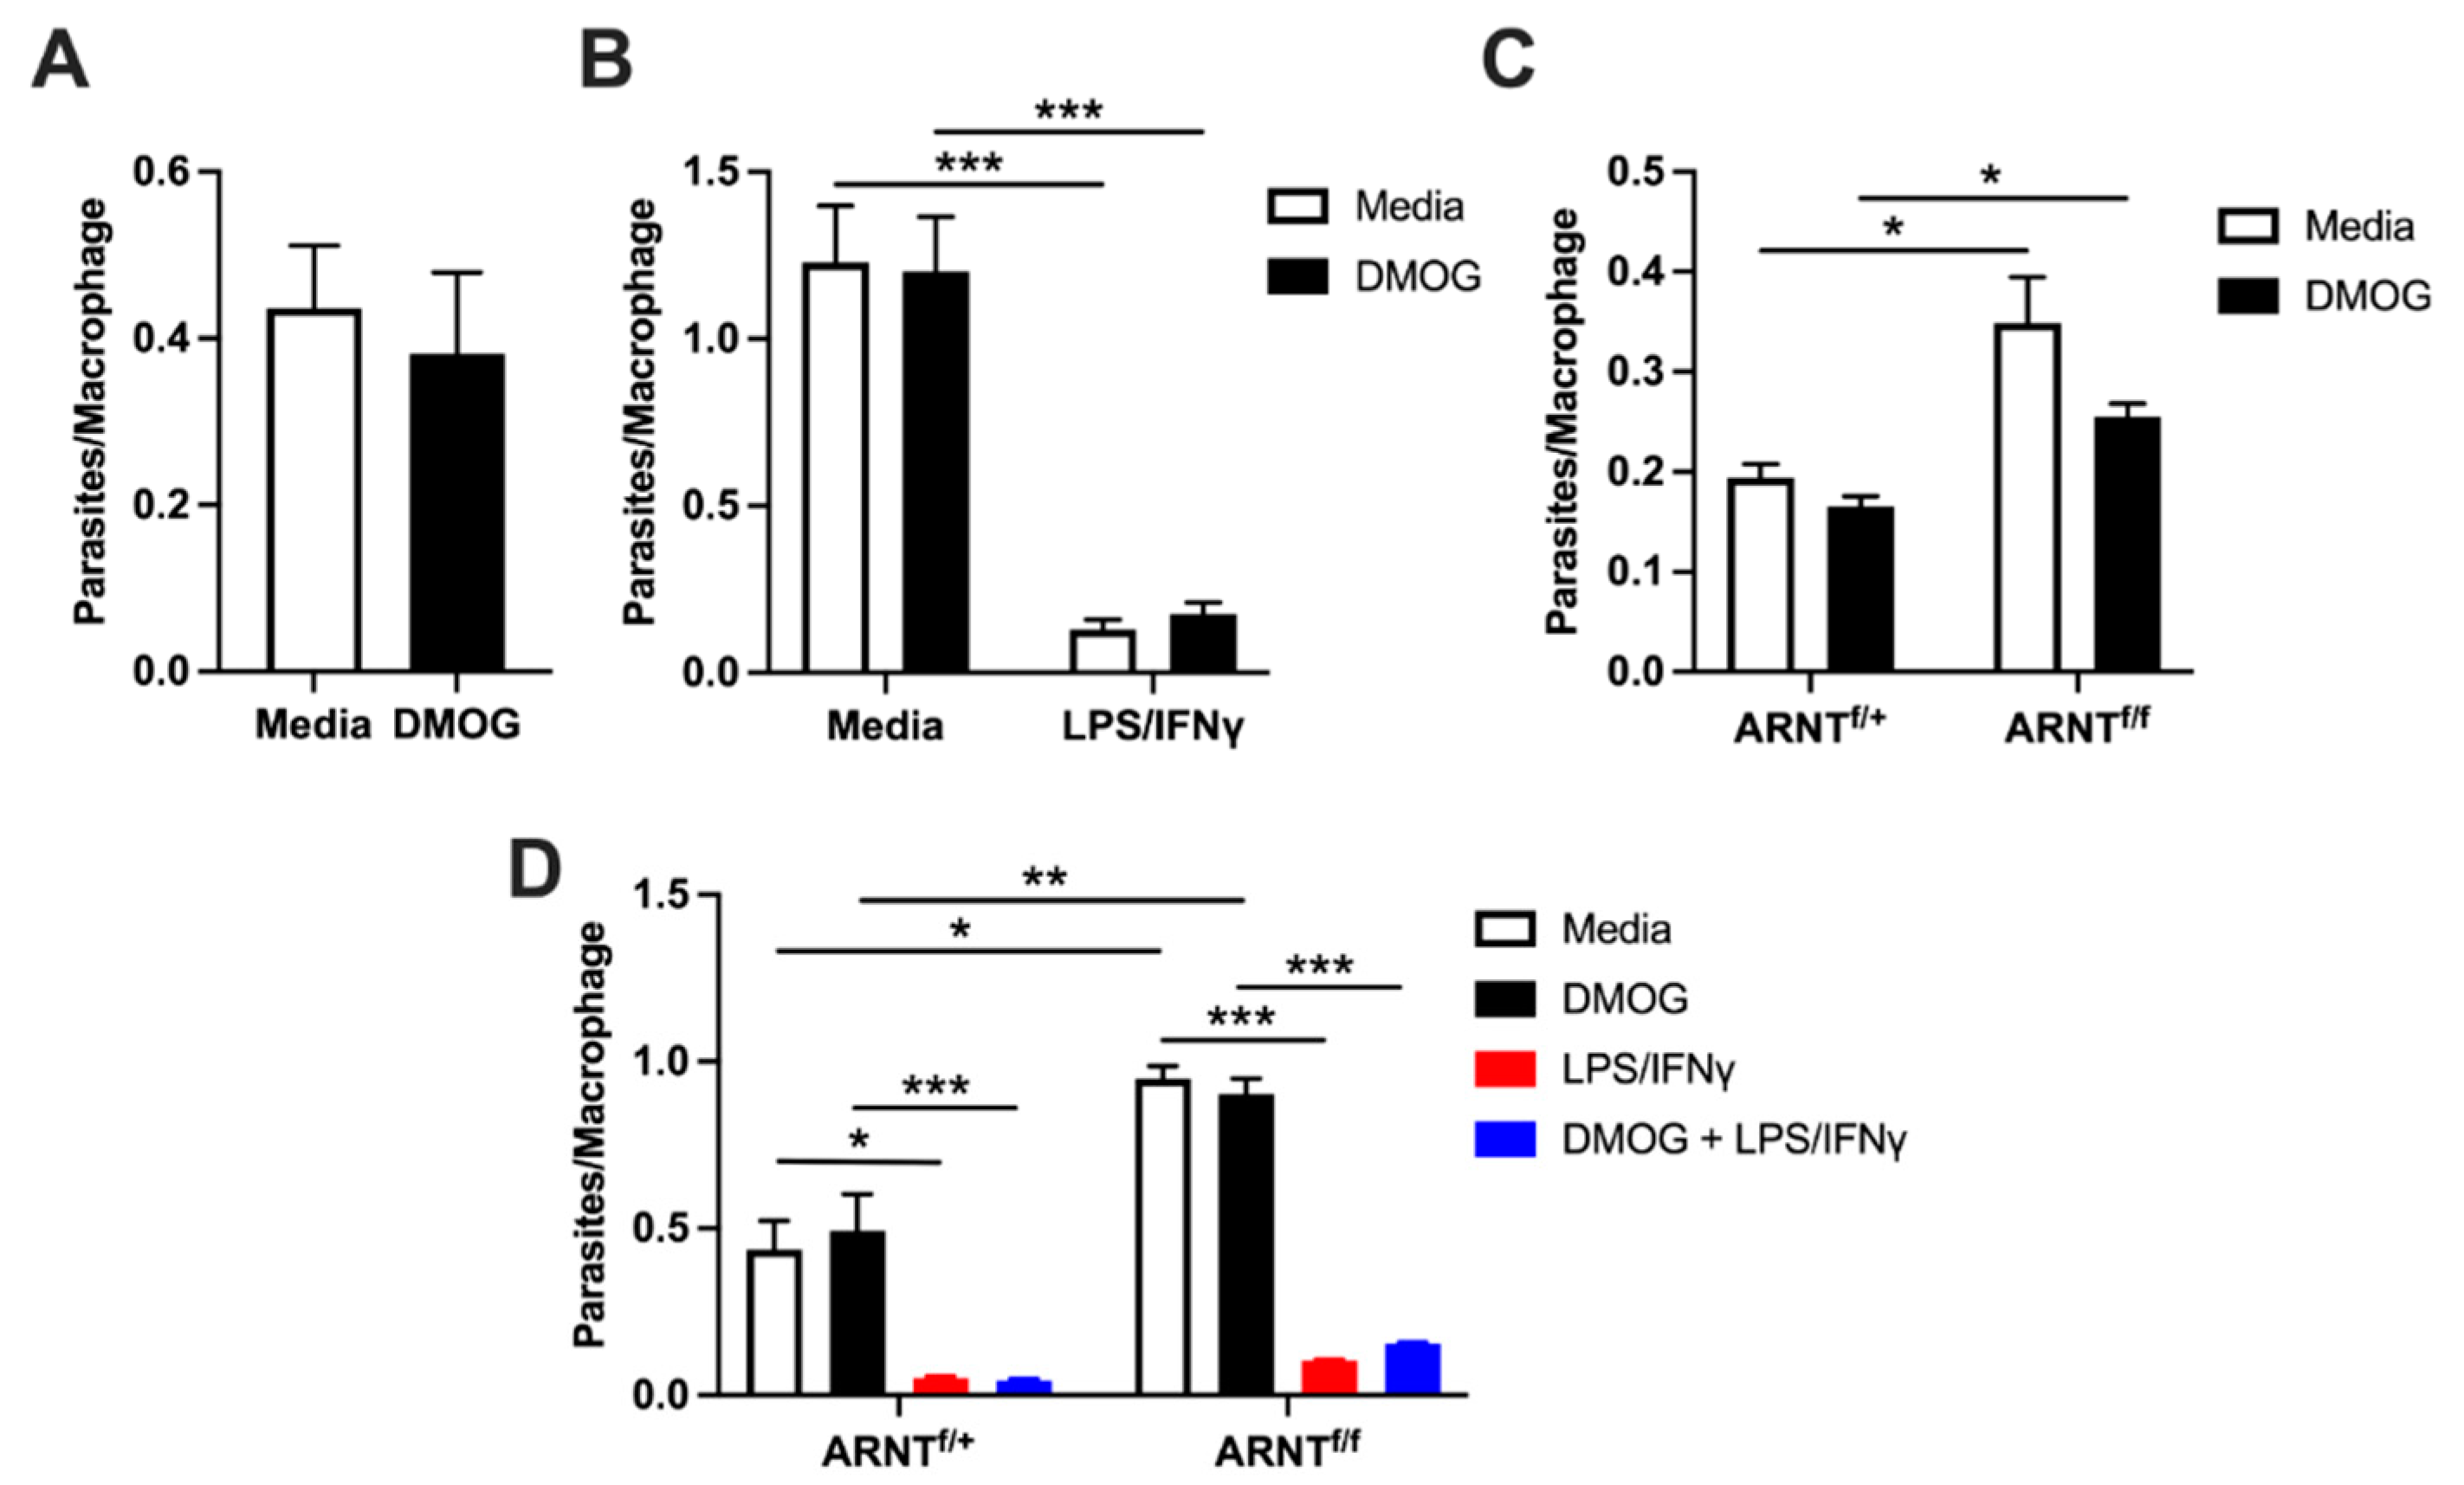
2.6. Macrophage HIF-α Deletion and Stabilization during L. major Internalization and Killing
3. Discussion
4. Materials and Methods
4.1. Mice
4.2. Parasites
4.3. In Vivo Infections
4.4. Isolation of CD11b+ Cells and Adoptive Transfer
4.5. Flow Cytometry
4.6. Pimonidazole
4.7. mRNA Extraction and Real-Time PCR
4.8. RNA Sequencing (RNA-Seq): Data Analysis
4.9. Generation of Bone Marrow-Derived Macrophages
4.10. In Vitro Infections with DMOG Treatment
4.11. Microscopy for Parasite Quantification In Vitro
4.12. VEGF-A Production
4.13. Statistics
Author Contributions
Funding
Institutional Review Board Statement
Data Availability Statement
Acknowledgments
Conflicts of Interest
References
- Alvar, J.; Velez, I.D.; Bern, C.; Herrero, M.; Desjeux, P.; Cano, J.; Jannin, J.; Boer, M.D. WHO Leishmaniasis Control Team. Leishmaniasis worldwide and global estimates of its incidence. PLoS ONE 2012, 7, e35671. [Google Scholar] [CrossRef]
- Zhang, W.W.; Karmakar, S.; Gannavaram, S.; Dey, R.; Lypaczewski, P.; Ismail, N.; Siddiqui, A.; Simonyan, V.; Oliveira, F.; Coutinho-Abreu, I.V.; et al. A second generation leishmanization vaccine with a markerless attenuated Leishmania major strain using CRISPR gene editing. Nat. Commun. 2020, 11, 3461. [Google Scholar] [CrossRef]
- Scott, P.; Novais, F.O. Cutaneous leishmaniasis: Immune responses in protection and pathogenesis. Nat. Rev. Immunol. 2016, 16, 581–592. [Google Scholar] [CrossRef]
- Postigo, J.A. Leishmaniasis in the World Health Organization Eastern Mediterranean Region. Int. J. Antimicrob. Agents. 2010, 36, S62–S65. [Google Scholar] [CrossRef] [PubMed]
- Fraga, C.A.; Oliveira, M.V.; Alves, L.R.; Viana, A.G.; Sousa, A.A.; Carvalho, S.F.; De Paula, A.M.; Botelho, A.C.; Guimarães, A.L. Immunohistochemical profile of HIF-1alpha, VEGF-A, VEGFR2 and MMP9 proteins in tegumentary leishmaniasis. An. Bras. Dermatol. 2012, 87, 709–713. [Google Scholar] [CrossRef]
- Schatz, V.; Strussmann, Y.; Mahnke, A.; Schley, G.; Waldner, M.; Ritter, U.; Wild, J.; Willam, C.; Dehne, N.; Brune, B.; et al. Myeloid Cell-Derived HIF-1alpha Promotes Control of Leishmania major. J. Immunol. 2016, 197, 4034–4041. [Google Scholar] [CrossRef] [Green Version]
- Weinkopff, T.; Konradt, C.; Christian, D.A.; Discher, D.E.; Hunter, C.A.; Scott, P. Leishmania major Infection-Induced VEGF-A/VEGFR-2 Signaling Promotes Lymphangiogenesis That Controls Disease. J. Immunol. 2016, 197, 1823–1831. [Google Scholar] [CrossRef] [Green Version]
- Weinkopff, T.; Roys, H.; Bowlin, A.; Scott, P. Leishmania Infection Induces Macrophage Vascular Endothelial Growth Factor A Production in an ARNT/HIF-Dependent Manner. Infect. Immun. 2019, 87, e00088-19. [Google Scholar] [CrossRef] [PubMed] [Green Version]
- Bowlin, A.; Roys, H.; Wanjala, H.; Bettadapura, M.; Venugopal, G.; Surma, J.; Simon, M.C.; Weinkopff, T. Hypoxia-Inducible Factor Signaling in Macrophages Promotes Lymphangiogenesis in Leishmania major Infection. Infect. Immun. 2021, 89, e0012421. [Google Scholar] [CrossRef]
- Degrossoli, A.; Bosetto, M.C.; Lima, C.B.; Giorgio, S. Expression of hypoxia-inducible factor 1alpha in mononuclear phagocytes infected with Leishmania amazonensis. Immunol. Lett. 2007, 114, 119–125. [Google Scholar] [CrossRef] [PubMed]
- Singh, A.K.; Mukhopadhyay, C.; Biswas, S.; Singh, V.K.; Mukhopadhyay, C.K. Intracellular pathogen Leishmania donovani activates hypoxia inducible factor-1 by dual mechanism for survival advantage within macrophage. PLoS ONE 2012, 7, e38489. [Google Scholar] [CrossRef]
- Arandjelovic, S.; Ravichandran, K.S. Phagocytosis of apoptotic cells in homeostasis. Nat. Immunol. 2015, 16, 907–917. [Google Scholar] [CrossRef] [PubMed] [Green Version]
- Greenberg, M.E.; Sun, M.; Zhang, R.; Febbraio, M.; Silverstein, R.; Hazen, S.L. Oxidized phosphatidylserine-CD36 interactions play an essential role in macrophage-dependent phagocytosis of apoptotic cells. J. Exp. Med. 2006, 203, 2613–2625. [Google Scholar] [CrossRef] [PubMed] [Green Version]
- Kima, P.E.; Soong, L.; Chicharro, C.; Ruddle, N.H.; McMahon-Pratt, D. Leishmania-infected macrophages sequester endogenously synthesized parasite antigens from presentation to CD4+ T cells. Eur. J. Immunol. 1996, 26, 3163–3169. [Google Scholar] [CrossRef] [PubMed]
- Liu, D.; Uzonna, J.E. The early interaction of Leishmania with macrophages and dendritic cells and its influence on the host immune response. Front. Cell. Infect. Microbiol. 2012, 2, 83. [Google Scholar] [CrossRef] [Green Version]
- Meier, C.L.; Svensson, M.; Kaye, P.M. Leishmania-induced inhibition of macrophage antigen presentation analyzed at the single-cell level. J. Immunol. 2003, 171, 6706–6713. [Google Scholar] [CrossRef] [PubMed] [Green Version]
- Von Stebut, E.; Belkaid, Y.; Jakob, T.; Sacks, D.L.; Udey, M.C. Uptake of Leishmania major amastigotes results in activation and interleukin 12 release from murine skin-derived dendritic cells: Implications for the initiation of anti-Leishmania immunity. J. Exp. Med. 1998, 188, 1547–1552. [Google Scholar] [CrossRef] [PubMed] [Green Version]
- Zhdanov, A.V.; Okkelman, I.A.; Collins, F.W.; Melgar, S.; Papkovsky, D.B. A novel effect of DMOG on cell metabolism: Direct inhibition of mitochondrial function precedes HIF target gene expression. Biochim. Biophys. Acta 2015, 1847, 1254–1266. [Google Scholar] [CrossRef] [PubMed] [Green Version]
- Leon, B.; Lopez-Bravo, M.; Ardavin, C. Monocyte-derived dendritic cells formed at the infection site control the induction of protective T helper 1 responses against Leishmania. Immunity 2007, 26, 519–531. [Google Scholar] [CrossRef] [PubMed] [Green Version]
- Petritus, P.M.; Manzoni-de-Almeida, D.; Gimblet, C.; Gonzalez Lombana, C.; Scott, P. Leishmania mexicana induces limited recruitment and activation of monocytes and monocyte-derived dendritic cells early during infection. PLoS Negl. Trop. Dis. 2012, 6, e1858. [Google Scholar] [CrossRef] [Green Version]
- Ribeiro-Gomes, F.L.; Peters, N.C.; Debrabant, A.; Sacks, D.L. Efficient capture of infected neutrophils by dendritic cells in the skin inhibits the early anti-leishmania response. PLoS Pathog. 2012, 8, e1002536. [Google Scholar] [CrossRef] [Green Version]
- Anand, R.J.; Gribar, S.C.; Li, J.; Kohler, J.W.; Branca, M.F.; Dubowski, T.; Sodhi, C.P.; Hackam, D.J. Hypoxia causes an increase in phagocytosis by macrophages in a HIF-1alpha-dependent manner. J. Leukoc. Biol. 2007, 82, 1257–1265. [Google Scholar] [CrossRef] [Green Version]
- Dehn, S.; DeBerge, M.; Yeap, X.Y.; Yvan-Charvet, L.; Fang, D.; Eltzschig, H.K.; Miller, S.D.; Thorp, E.B. HIF-2alpha in Resting Macrophages Tempers Mitochondrial Reactive Oxygen Species To Selectively Repress MARCO-Dependent Phagocytosis. J. Immunol. 2016, 197, 3639–3649. [Google Scholar] [CrossRef] [PubMed] [Green Version]
- Braverman, J.; Sogi, K.M.; Benjamin, D.; Nomura, D.K.; Stanley, S.A. HIF-1alpha Is an Essential Mediator of IFN-gamma-Dependent Immunity to Mycobacterium tuberculosis. J. Immunol. 2016, 197, 1287–1297. [Google Scholar] [CrossRef] [PubMed] [Green Version]
- Friedrich, D.; Zapf, D.; Lohse, B.; Fecher, R.A.; Deepe, G.S.; Rupp, J., Jr. The HIF-1alpha/LC3-II Axis Impacts Fungal Immunity in Human Macrophages. Infect. Immun. 2019, 87. [Google Scholar] [CrossRef] [PubMed] [Green Version]
- Sulser, P.; Pickel, C.; Gunter, J.; Leissing, T.M.; Crean, D.; Schofield, C.J.; Wenger, R.H.; Scholz, C.C. HIF hydroxylase inhibitors decrease cellular oxygen consumption depending on their selectivity. FASEB J. 2020, 34, 2344–2358. [Google Scholar] [CrossRef] [Green Version]
- Imtiyaz, H.Z.; Williams, E.P.; Hickey, M.M.; Patel, S.A.; Durham, A.C.; Yuan, L.J.; Hammond, R.; Gimotty, P.A.; Keith, B.; Simon, M.C.; et al. Hypoxia-inducible factor 2alpha regulates macrophage function in mouse models of acute and tumor inflammation. J. Clin. Investig. 2010, 120, 2699–2714. [Google Scholar] [CrossRef] [Green Version]
- Imtiyaz, H.Z.; Simon, M.C. Hypoxia-inducible factors as essential regulators of inflammation. Curr. Top. Microbiol. Immunol. 2010, 345, 105–120. [Google Scholar] [CrossRef] [Green Version]
- Peyssonnaux, C.; Cejudo-Martin, P.; Doedens, A.; Zinkernagel, A.S.; Johnson, R.S.; Nizet, V. Cutting edge: Essential role of hypoxia inducible factor-1alpha in development of lipopolysaccharide-induced sepsis. J. Immunol. 2007, 178, 7516–7519. [Google Scholar] [CrossRef]
- Zinkernagel, A.S.; Hruz, P.; Uchiyama, S.; von Kockritz-Blickwede, M.; Schuepbach, R.A.; Hayashi, T.; Carson, D.A.; Nizet, V. Importance of Toll-like receptor 9 in host defense against M1T1 group A Streptococcus infections. J. Innate Immun. 2012, 4, 213–218. [Google Scholar] [CrossRef] [Green Version]
- Halliday, A.; Bates, P.A.; Chance, M.L.; Taylor, M.J. Toll-like receptor 2 (TLR2) plays a role in controlling cutaneous leishmaniasis in vivo, but does not require activation by parasite lipophosphoglycan. Parasites Vectors 2016, 9, 532. [Google Scholar] [CrossRef] [Green Version]
- Abou Fakher, F.H.; Rachinel, N.; Klimczak, M.; Louis, J.; Doyen, N. TLR9-dependent activation of dendritic cells by DNA from Leishmania major favors Th1 cell development and the resolution of lesions. J. Immunol. 2009, 182, 1386–1396. [Google Scholar] [CrossRef] [Green Version]
- Palazon, A.; Goldrath, A.W.; Nizet, V.; Johnson, R.S. HIF transcription factors, inflammation, and immunity. Immunity 2014, 41, 518–528. [Google Scholar] [CrossRef] [Green Version]
- Salei, N.; Hellberg, L.; Kohl, J.; Laskay, T. Enhanced survival of Leishmania major in neutrophil granulocytes in the presence of apoptotic cells. PLoS ONE 2017, 12, e0171850. [Google Scholar] [CrossRef] [PubMed] [Green Version]
- Filardy, A.A.; Costa-da-Silva, A.C.; Koeller, C.M.; Guimaraes-Pinto, K.; Ribeiro-Gomes, F.L.; Lopes, M.F.; Heise, N.; Freire-de-Lima, C.G.; Nunes, M.P.; DosReis, G.A. Infection with Leishmania major induces a cellular stress response in macrophages. PLoS ONE 2014, 9, e85715. [Google Scholar] [CrossRef] [PubMed]
- Bonello, S.; Zahringer, C.; BelAiba, R.S.; Djordjevic, T.; Hess, J.; Michiels, C.; Kietzmann, T.; Goörlach, A. Reactive oxygen species activate the HIF-1alpha promoter via a functional NFkappaB site. Arterioscler. Thromb. Vasc. Biol. 2007, 27, 755–761. [Google Scholar] [CrossRef] [PubMed] [Green Version]
- Masson, N.; Singleton, R.S.; Sekirnik, R.; Trudgian, D.C.; Ambrose, L.J.; Miranda, M.X.; Tian, Y.-M.; Kessler, B.M.; Schofield, C.J.; Ratcliffe, P.J. The FIH hydroxylase is a cellular peroxide sensor that modulates HIF transcriptional activity. EMBO Rep. 2012, 13, 251–257. [Google Scholar] [CrossRef]
- Gimblet, C.; Meisel, J.S.; Loesche, M.A.; Cole, S.D.; Horwinski, J.; Novais, F.O.; Misic, A.M.; Bradley, C.W.; Beiting, D.P.; Rankin, S.C.; et al. Cutaneous Leishmaniasis Induces a Transmissible Dysbiotic Skin Microbiota that Promotes Skin Inflammation. Cell Host Microbe 2017, 22, 13–24. [Google Scholar] [CrossRef] [Green Version]
- Ferrara, N.; Gerber, H.P.; LeCouter, J. The biology of VEGF and its receptors. Nat. Med. 2003, 9, 669–676. [Google Scholar] [CrossRef]
- Seghezzi, G.; Patel, S.; Ren, C.J.; Gualandris, A.; Pintucci, G.; Robbins, E.S.; Shapiro, R.L.; Galloway, A.C.; Rifkin, D.B.; Mignatti, P. Fibroblast growth factor-2 (FGF-2) induces vascular endothelial growth factor (VEGF) expression in the endothelial cells of forming capillaries: An autocrine mechanism contributing to angiogenesis. J. Cell Biol. 1998, 141, 1659–1673. [Google Scholar] [CrossRef]
- Maloney, J.P.; Gao, L. Proinflammatory Cytokines Increase Vascular Endothelial Growth Factor Expression in Alveolar Epithelial Cells. Mediat. Inflamm. 2015, 2015, 387842. [Google Scholar] [CrossRef] [PubMed] [Green Version]
- Nauck, M.; Roth, M.; Tamm, M.; Eickelberg, O.; Wieland, H.; Stulz, P.; Perruchoud, A.P. Induction of vascular endothelial growth factor by platelet-activating factor and platelet-derived growth factor is downregulated by corticosteroids. Am. J. Respir. Cell Mol. Biol. 1997, 16, 398–406. [Google Scholar] [CrossRef] [PubMed]
- Gary Lee, Y.C.; Melkerneker, D.; Thompson, P.J.; Light, R.W.; Lane, K.B. Transforming growth factor beta induces vascular endothelial growth factor elaboration from pleural mesothelial cells in vivo and in vitro. Am. J. Respir. Crit. Care Med. 2002, 165, 88–94. [Google Scholar] [CrossRef] [PubMed]
- Jeon, S.H.; Chae, B.C.; Kim, H.A.; Seo, G.Y.; Seo, D.W.; Chun, G.T.; Kim, N.S.; Yie, S.W.; Byeon, W.H.; Eom, S.H.; et al. Mechanisms underlying TGF-beta1-induced expression of VEGF and Flk-1 in mouse macrophages and their implications for angiogenesis. J. Leukoc. Biol. 2007, 81, 557–566. [Google Scholar] [CrossRef] [PubMed]
- Hellwig-Burgel, T.; Rutkowski, K.; Metzen, E.; Fandrey, J.; Jelkmann, W. Interleukin-1beta and tumor necrosis factor-alpha stimulate DNA binding of hypoxia-inducible factor-1. Blood J. Am. Soc. Hematol. 1999, 94, 1561–1567. [Google Scholar]
- Martin, D.; Galisteo, R.; Gutkind, J.S. CXCL8/IL8 stimulates vascular endothelial growth factor (VEGF) expression and the autocrine activation of VEGFR2 in endothelial cells by activating NFkappaB through the CBM (Carma3/Bcl10/Malt1) complex. J. Biol. Chem. 2009, 284, 6038–6042. [Google Scholar] [CrossRef] [PubMed] [Green Version]
- Clausen, B.E.; Burkhardt, C.; Reith, W.; Renkawitz, R.; Forster, I. Conditional gene targeting in macrophages and granulocytes using LysMcre mice. Transgenic Res. 1999, 8, 265–277. [Google Scholar] [CrossRef]
- Lin, N.; Shay, J.E.S.; Xie, H.; Lee, D.S.M.; Skuli, N.; Tang, Q.; Zhou, Z.; Azzam, A.; Meng, H.; Wang, H.; et al. Myeloid Cell Hypoxia-Inducible Factors Promote Resolution of Inflammation in Experimental Colitis. Front. Immunol. 2018, 9, 2565. [Google Scholar] [CrossRef]
- Spath, G.F.; Beverley, S.M. A lipophosphoglycan-independent method for isolation of infective Leishmania metacyclic promastigotes by density gradient centrifugation. Exp. Parasitol. 2001, 99, 97–103. [Google Scholar] [CrossRef] [PubMed]
- Ewels, P.; Magnusson, M.; Lundin, S.; Kaller, M. MultiQC: Summarize analysis results for multiple tools and samples in a single report. Bioinformatics 2016, 32, 3047–3048. [Google Scholar] [CrossRef] [Green Version]
- Dobin, A.; Davis, C.A.; Schlesinger, F.; Drenkow, J.; Zaleski, C.; Jha, S.; Batut, P.; Chaisson, M.; Gingeras, T.R. STAR: Ultrafast universal RNA-seq aligner. Bioinformatics 2013, 29, 15–21. [Google Scholar] [CrossRef]
- Anders, S.; Pyl, P.T.; Huber, W. HTSeq-a Python framework to work with high-throughput sequencing data. Bioinformatics 2015, 31, 166–169. [Google Scholar] [CrossRef] [PubMed]
- Robinson, M.D.; Oshlack, A. A scaling normalization method for differential expression analysis of RNA-seq data. Genome Biol. 2010, 11, R25. [Google Scholar] [CrossRef] [PubMed] [Green Version]
- Liu, R.; Holik, A.Z.; Su, S.; Jansz, N.; Chen, K.; Leong, H.S.; Blewitt, M.E.; Asselin-Labat, M.-L.; Smyth, G.K.; Ritchie, M.E. Why weight? Modelling sample and observational level variability improves power in RNA-seq analyses. Nucleic Acids Res. 2015, 43, e97. [Google Scholar] [CrossRef] [PubMed]
- Benjamini, Y.; Hochberg, Y. Controlling the False Discovery Rate—A Practical and Powerful Approach to Multiple Testing. J. R. Stat. Soc. Ser. B 1995, 57, 289–300. [Google Scholar] [CrossRef]
- Alhamdoosh, M.; Law, C.W.; Tian, L.; Sheridan, J.M.; Ng, M.; Ritchie, M.E. Easy and efficient ensemble gene set testing with EGSEA. F1000Research 2017, 6, 2010. [Google Scholar] [CrossRef] [PubMed]


Publisher’s Note: MDPI stays neutral with regard to jurisdictional claims in published maps and institutional affiliations. |
© 2021 by the authors. Licensee MDPI, Basel, Switzerland. This article is an open access article distributed under the terms and conditions of the Creative Commons Attribution (CC BY) license (https://creativecommons.org/licenses/by/4.0/).
Share and Cite
Bettadapura, M.; Roys, H.; Bowlin, A.; Venugopal, G.; Washam, C.L.; Fry, L.; Murdock, S.; Wanjala, H.; Byrum, S.D.; Weinkopff, T. HIF-α Activation Impacts Macrophage Function during Murine Leishmania major Infection. Pathogens 2021, 10, 1584. https://0-doi-org.brum.beds.ac.uk/10.3390/pathogens10121584
Bettadapura M, Roys H, Bowlin A, Venugopal G, Washam CL, Fry L, Murdock S, Wanjala H, Byrum SD, Weinkopff T. HIF-α Activation Impacts Macrophage Function during Murine Leishmania major Infection. Pathogens. 2021; 10(12):1584. https://0-doi-org.brum.beds.ac.uk/10.3390/pathogens10121584
Chicago/Turabian StyleBettadapura, Manjunath, Hayden Roys, Anne Bowlin, Gopinath Venugopal, Charity L. Washam, Lucy Fry, Steven Murdock, Humphrey Wanjala, Stephanie D. Byrum, and Tiffany Weinkopff. 2021. "HIF-α Activation Impacts Macrophage Function during Murine Leishmania major Infection" Pathogens 10, no. 12: 1584. https://0-doi-org.brum.beds.ac.uk/10.3390/pathogens10121584