Article

Subtyping Options for Microsporum canis Using Microsatellites and MLST: A Case Study from Southern Italy

1
Dipartimento di Medicina Veterinaria, Università degli Studi Aldo Moro, 70010 Bari, Italy
2
Department of Veterinary Pathology and Microbiology, University of Nigeria, Nsukka 410001, Nigeria
3
Department of Botany, Faculty of Science, Charles University, 12801 Prague, Czech Republic
4
Laboratory of Fungal Genetics and Metabolism, Institute of Microbiology of the Czech Academy of Sciences, 14220 Prague, Czech Republic
5
Faculty of Veterinary Sciences, Bu-Ali Sina University, Hamedan 6517658978, Iran
*
Authors to whom correspondence should be addressed.
Submission received: 7 November 2021 / Revised: 17 December 2021 / Accepted: 20 December 2021 / Published: 22 December 2021
(This article belongs to the Special Issue New Insights into Fungal Infections of Companion Animals and Wildlife)

Abstract

:
Microsporum canis is considered one of the most common zoophilic dermatophyte species causing infections in animals and humans worldwide. However, molecular epidemiological studies on this dermatophyte are still rare. In this study, we aimed to analyse the population structure and relationships between M. canis strains (n = 66) collected in southern Italy and those isolated from symptomatic and asymptomatic animals (cats, dogs and rabbits) and humans. For subtyping purposes, using multilocus sequence typing (MLST) and multilocus microsatellite typing (MLMT), we first used a limited set of strains to screen for variability. No intraspecies variability was detected in six out of the eight reference genes tested and only the ITS and IGS regions showed two and three sequence genotypes, respectively, resulting in five MLST genotypes. All of eight genes were, however, useful for discrimination among M. canis, M. audouinii and M. ferrugineum. In total, eighteen microsatellite genotypes (A–R) were recognized using MLMT based on six loci, allowing a subdivision of strains into two clusters based on the Bayesian iterative algorithm. Six MLMT genotypes were from multiple host species, while 12 genotypes were found only in one host. There were no statistically significant differences between clusters in terms of host spectrum and the presence or absence of lesions. Our results confirmed that the MLST approach is not useful for detailed subtyping and examining the population structure of M. canis, while microsatellite analysis is a powerful tool for conducting surveillance studies and gaining insight into the epidemiology of infections due to this pathogen.

1. Introduction

Microsporum canis is considered one of the most common zoophilic dermatophytes causing infections in animals and humans worldwide [1,2]. The main natural habitat of this species is primarily the furred skin of cats, followed by dogs and horses, where it frequently resides without causing symptoms [3,4]. In Italy, M. canis is the dermatophyte that is most frequently isolated (over 80%) from dogs and cats and is a common cause of tinea capitis and tinea corporis in humans, who might acquire those infections after contact with infected animals [3,5]. The identification of the source of infection is an important step to prevent the spread of M. canis. An important method of evaluating the source of infection is using sensitive molecular markers that can differ among strains [6]. Typization may also be useful to track recurrence or reinfection after treatment and analyse connections between genotype/lineage and virulence or drug resistance [7]. However, epidemiological studies of M. canis infections that include the subtyping of strains remain rare. This is mainly due to a lack of polymorphic molecular markers [3,8] and a predominantly clonal spread and thus low intraspecies variability of this pathogen [9]. Restriction fragment length polymorphisms (RFLP) of mitochondrial DNA genes, random amplification of polymorphic DNA (RAPD) and multilocus sequence typing (MLST) of the internal transcribed spacer (ITS) and nontranscribed spacer (NTS) regions of ribosomal RNA genes (rDNA) have been employed for M. canis typing, usually resulting in insufficient differentiation among strains with different geographical provenance or host origin [3,10]. In addition, many of these techniques are obsolete and their utility is frequently constrained by their poor reproducibility [7,8].
Multilocus microsatellite typing (MLMT) is currently one of the most efficient typing tools available for dermatophytes because it is reproducible, easy to perform and suitable for large-scale epidemiological studies due to its advantages in terms of speed and cost. Microsatellites (short tandem repeats of two to six nucleotides) are known to be highly polymorphic and have been widely used for genotyping and studying the population structure of dermatophytes [6,11,12] and other pathogenic fungi (e.g., Aspergillus or Candida) [13,14]. However, studies on the genotyping and population structure of M. canis remain rare or were performed by using a low number of microsatellite markers or strains [3,4].
Although various techniques have been employed for typing M. canis, their discriminatory power is usually low, and each has been limited to a few studies. The aims of this study were to evaluate the possibilities of the genotypic characterization of M. canis strains isolated in southern Italy from different hosts by using (i) an MLST approach involving a total of eight phylogenetic markers commonly used in fungal taxonomy or population genetic studies and (ii) an MLMT approach with both novel microsatellite markers and those previously employed [3,4].

2. Results

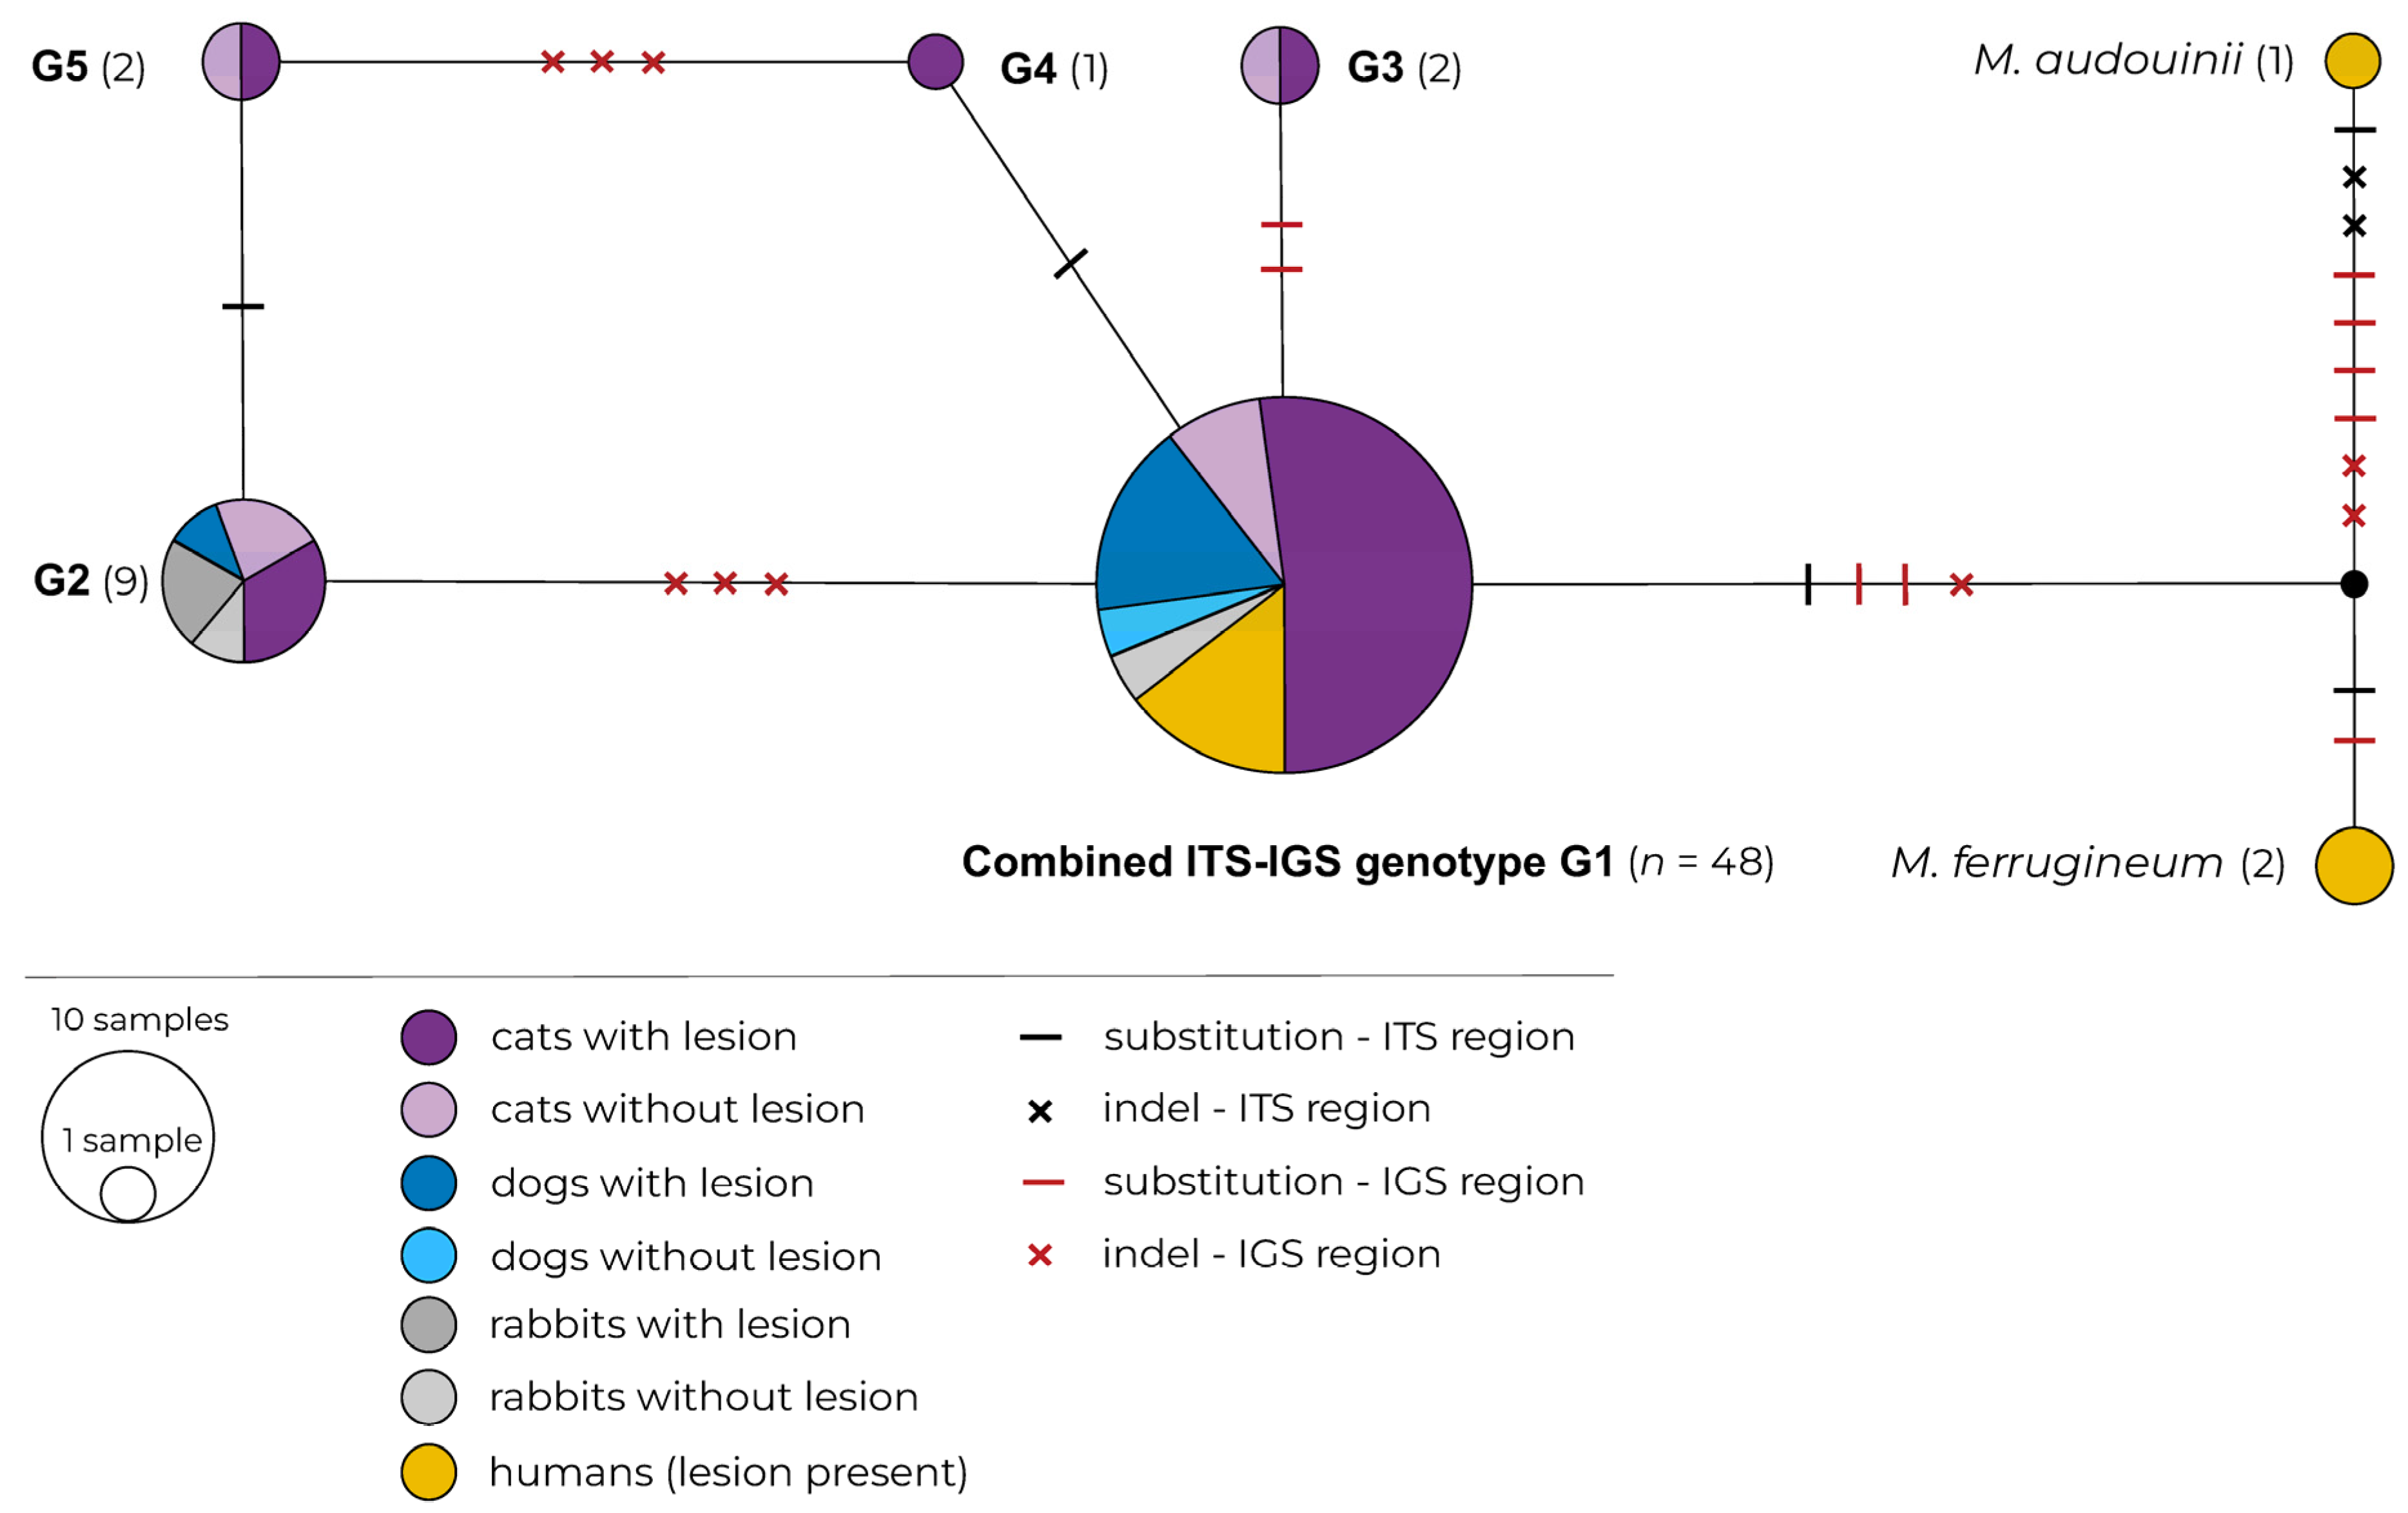
2.1. Multilocus Sequence Typing (MLST)

A total of six target genes (tubb, RPB2, tef1-α, CaM, act, gapdh, mcm7) out of the eight showed no intraspecies variability in the test set of eight strains from different hosts/localities. Only ITS and IGS rDNA showed variability between the tested isolates and were successfully amplified in 62 strains. All eight loci were useful for differentiation among M. canis, M. audouinii and M. ferrugineum and the accession numbers for the unique sequences are listed in Table S1.
In total, the MLST approach with two loci identified five combined ITS-IGS genotypes among the 62 strains (Table 1).
The ITS region showed two MLST genotypes differing from each other by a single substitution in the 5.8 S region; genotype ITS-G1 (GenBank accession: LR989561) was identical to the M. canis ex-type strain CBS 496.86 (MH861991) and was present in 59 out of the 62 strains. The genotype ITS-G2 (GenBank accession: LR989562) was found in only 3 strains. Three MLST genotypes were found in the IGS region. The most common genotype, IGS-G1 (GenBank accession: LR989270), was detected in 49 strains; IGS-G2 (GenBank accession: LR989271), with a single substitution compared to IGS-G1 (position 837 in the alignment), was present in 11 strains; and IGS-G3 (GenBank accession: LR989272), with a single substitution compared to IGS-G1 (position 838), was present in two strains.
The haplotype network of the combined ITS and IGS data with information on the host and the presence/absence of skin lesions is shown in Figure 1.
Strains with the MLST genotype G1 were found in different hosts with and without lesions, while MLST genotypes G3, G4 and G5 were found only in cats. The MLST genotype G2 was found in cats, dogs and rabbits with and without skin lesions. All human isolates were included among strains with MLST genotype G1.

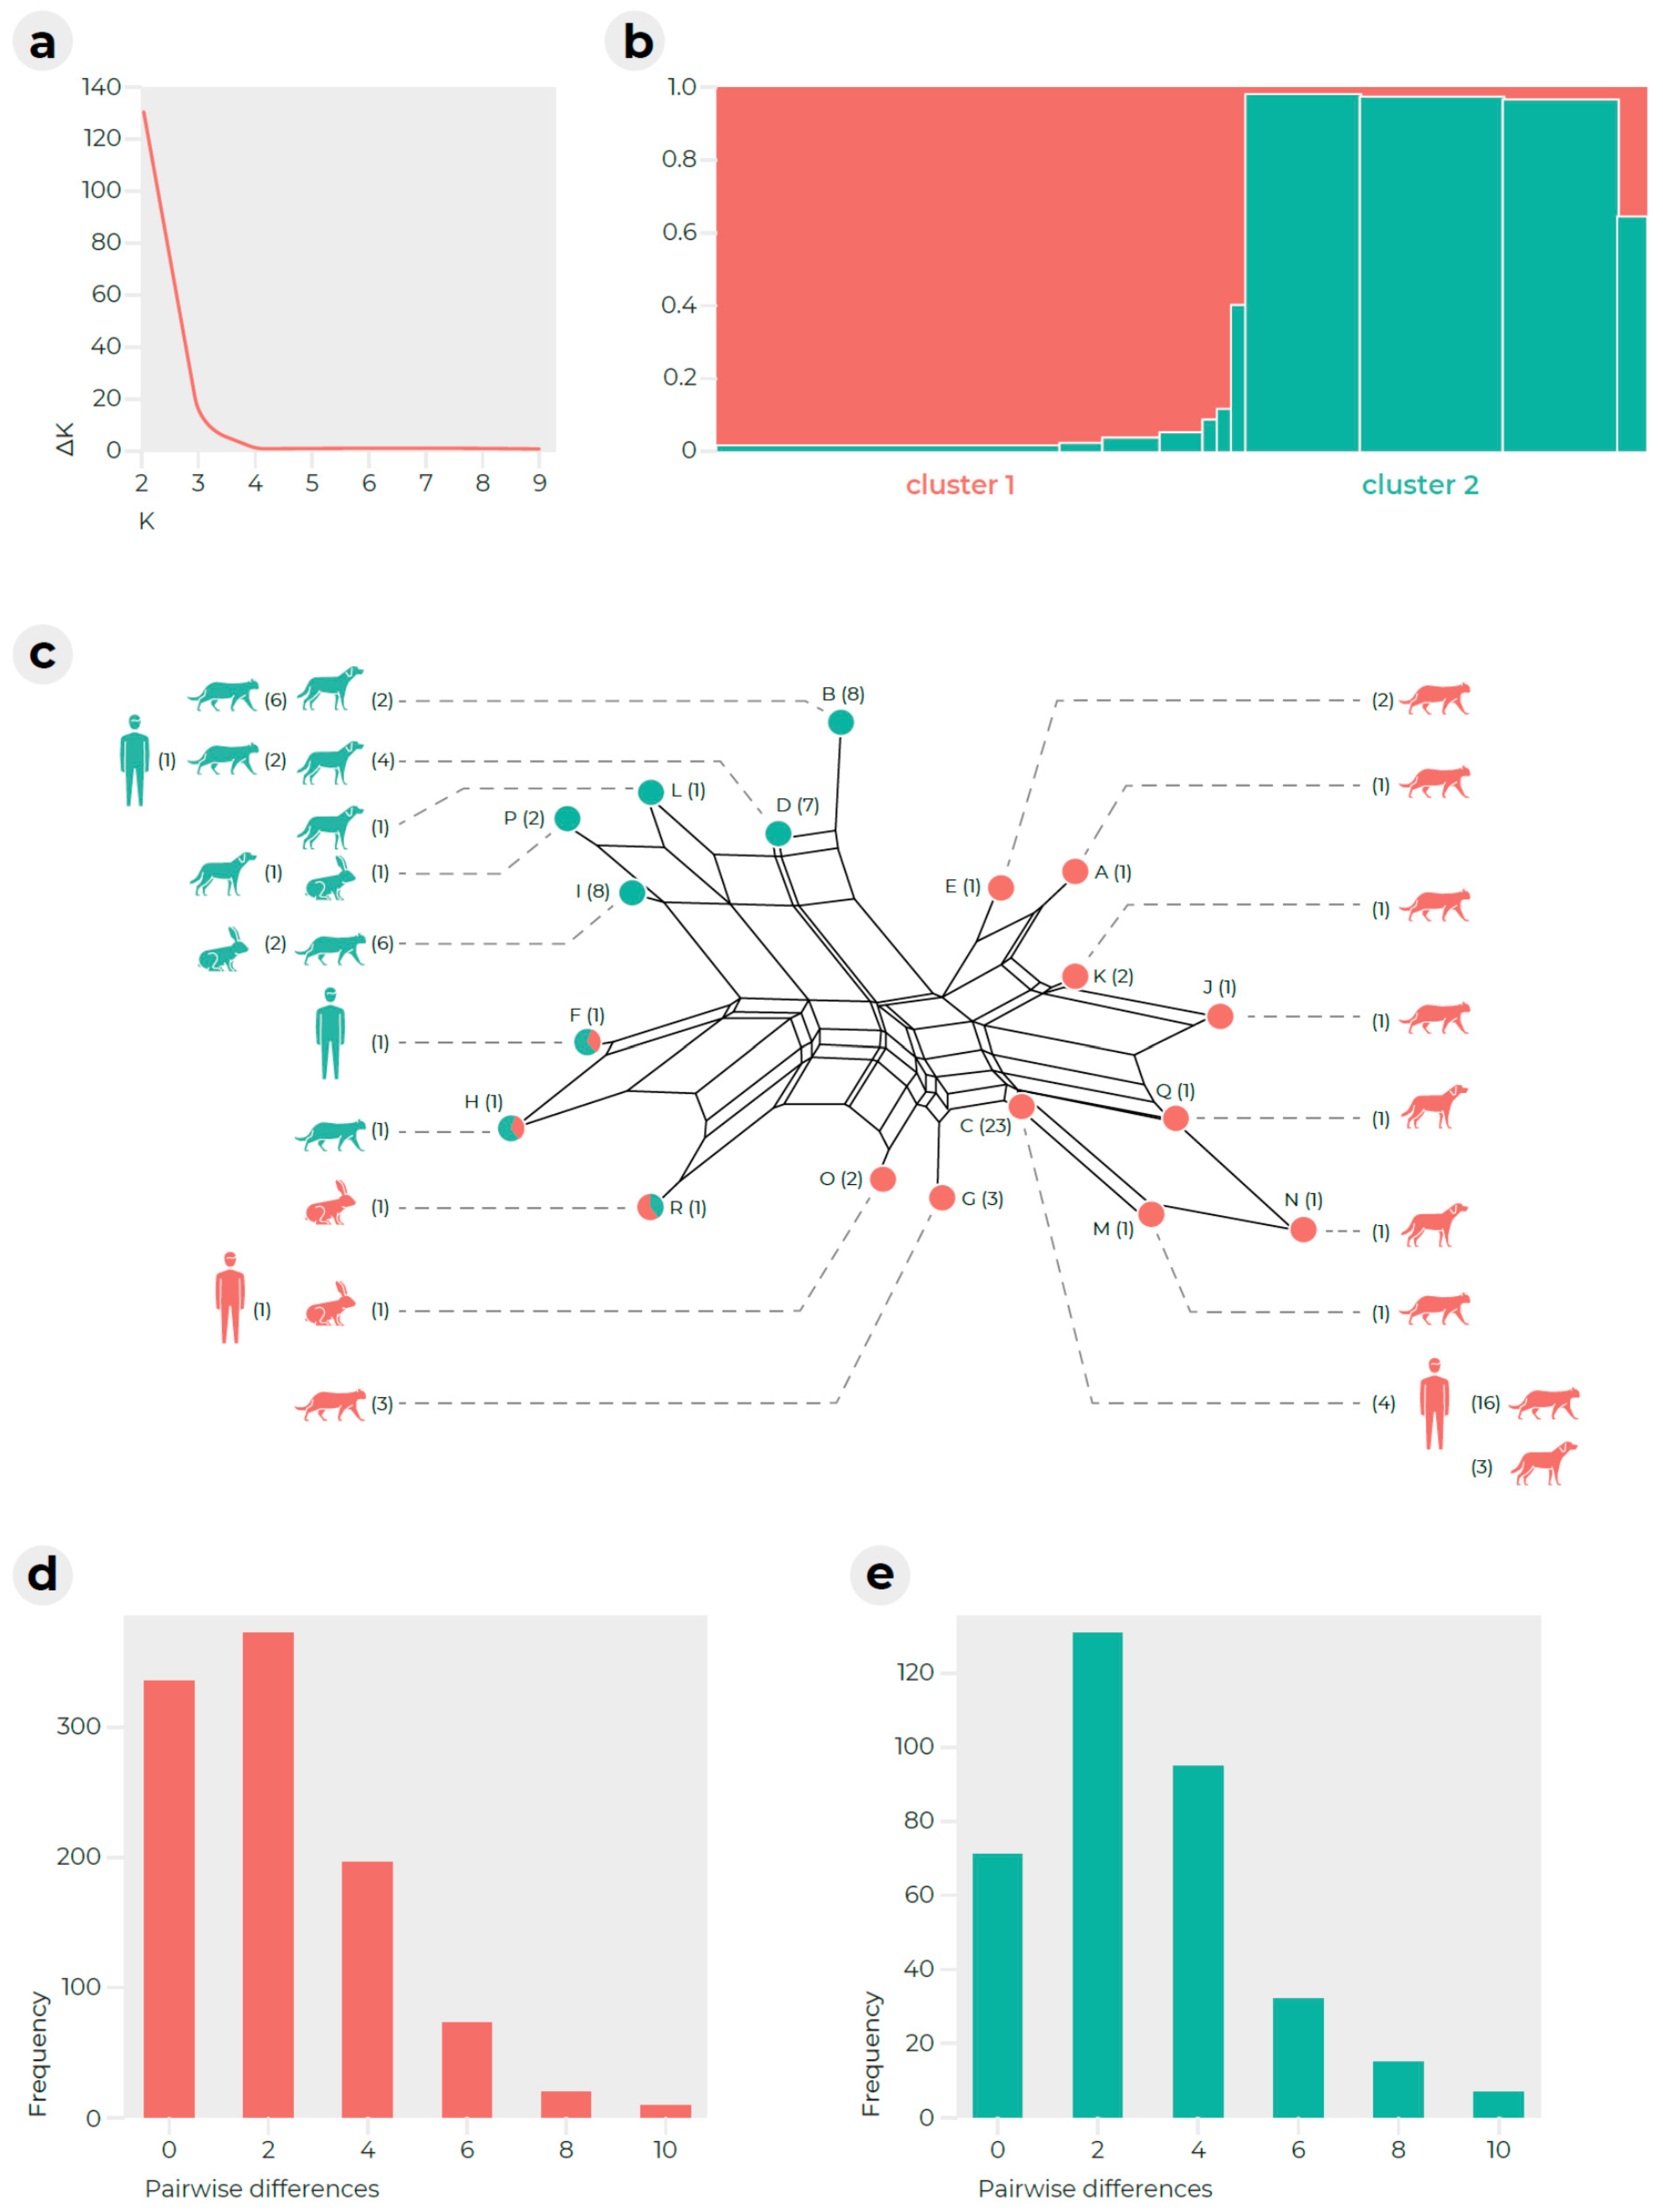
2.2. Multilocus Microsatellite Typing (MLMT)

Primer pairs for a total of 13 loci were newly designed and tested together with an additional eight markers from Pasquetti et al. [4]. Invariable loci, loci with interrupted repeats, or loci containing two or more repeat motifs within the fragments (verified by DNA sequencing) were excluded. This led to a final number of six markers with an even distribution in the genome and different lengths (for the purpose of multiplexing). These markers were successfully analysed in 65 M. canis strains from southern Italy.
Six markers exhibited polymorphic profiles, with GT17C, AG12, GT14 and CAT8 having two alleles each and TC10 and GT17B having four alleles each. In total, this MLMT scheme resulted in 18 multilocus genotypes (A–R) (Table 1) and the corresponding Simpson’s diversity index was 0.84.
Genotype C was shared by the highest number of strains (n = 23), followed by genotypes B (n = 8), I (n = 8), D (n = 7), G (n = 3), K, O and P (n = 2); the remaining genotypes were found in only one strain each (Table 1). Six genotypes were found in multiple host species, whereas 12 genotypes were found in only one host. In particular, genotypes C and D were isolated from dogs, cats and humans; B from cats and dogs; I from cats and rabbits; O from humans and rabbits; and P from dogs and rabbits. The other genotypes were present in only one host (Table 1).
A Bayesian model-based clustering algorithm implemented in STRUCTURE software was used to determine how many populations were included in the dataset [15]. The highest ΔK value was observed at K = 2 (Figure 2a,b), where K represents the number of genetic groups assumed. Cluster 1 (37 strains) and cluster 2 (28 strains) contained 11 and seven genotypes, respectively. High admixture between clusters was observed in three samples corresponding to MLMT genotypes F, H and R. The ratios of strains isolated from animals with symptomatic versus asymptomatic infections were similar between clusters: 25:7 in cluster 1 and 21:5 in cluster 2 (Table S2). This distribution was not significantly different (chi-squared, p < 0.05). Strains from cluster 1 were mainly isolated from cats (n = 25), followed by dogs (n = 5), humans (n = 5) and rabbits (n = 2). All hosts were also included in cluster 2 but in a slightly different ratio: cats (n = 15), dogs (8), rabbits (3) and humans (2). There were no statistically significant differences in the distribution of hosts between the two clusters according to the chi-squared test (p < 0.05).
The genetic diversity indices are listed in Table S3. The low value of Nei’s gene diversity (D) (0.07 in cluster 1 and 0.12 in cluster 2) showed that the populations were genetically uniform. This low value indicated that the populations are composed of abundant clones. Random mating was rejected in clusters 1 and 2 according to the index of association IA, with a significance level of p < 0.05; IA = 1.38 for cluster 1 (p < 0.01); IA = 1.0 for cluster 2 (p < 0.01). Low DW index values were observed for both clusters (0.24 and 0.26, respectively), showing that these populations with their unique sets of alleles have existed over a long period of time. The frequency of pairwise differences between individuals within clusters, indicating their clonality, is shown in Figure 2d,e. Analysis of molecular variance was performed to test cluster-specific differences (Table S4) and showed that the diversity between clusters contributed a total variability of ~62%, while the diversity within clusters contributed ~38% (p < 0.0001). This suggested that there was a relatively high level of genetic information exchange between clusters, as also observed by the low number of fixed alleles (fixation index, FST = 0.62, p < 0.0001).

3. Discussion

The results of this study showed that M. canis had a low level of intraspecies variability based on the DNA markers employed for subtyping. In particular, many of the employed DNA sequence markers (i.e., tubb, tef1-α, CaM, act, gapdh and mcm7) were unable to differentiate M. canis strains, thus precluding these markers from being applied to track the source of infections or being used in population genetic studies in general. It was shown previously that the ITS region, tubb and tef1-α genes provided sufficient sequence variations to be useful for the differentiation of M. ferrugineum and M. audouinii from the closely related M. canis [16]. In this study, we confirmed these observations and broadened the spectrum of genes that are useful for differentiating among these species to also include IGS, CaM, act, gapdh and mcm7 loci.
Among the 12 gene markers employed herein, only two gene markers (ITS and IGS) differentiated M. canis strains into five genotypes due to a single nucleotide polymorphism and indels. The discriminatory power of these loci was, however, too low. Gräser et al. [17] were the first researchers to find genetic variation between M. canis isolates in the ITS region and detect eight substitutions within the ITS1 and ITS2 regions. The lower level of variation reported herein probably reflected the origin of the strains from a small geographic area and a relatively short period of sampling, as previously suggested by other researchers [18,19].
The microsatellite-typing scheme that was updated in this study offers a higher discriminatory power than the MLST approaches. In this setting, M. canis strains were divided into 18 different genotypes with relatively high genetic diversity (Simpson’s diversity index of 0.84). This suggested that this typing scheme, which is easy and cost effective to use, may be a powerful discriminatory tool for subtyping in practice.
MLMT approaches were previously applied to 26 M. canis strains originating from 13 countries by Pasquetti et al. [4], who used eight markers and observed 22 genotypes. Additionally, Watanabe et al. [20] analysed 70 M. canis strains from Japan, 59 of which were from humans and 11 of which were from cats. The authors revealed 20 genotypes, thus confirming the high potential of microsatellite typing, as reported in our study. However, in our study, all the strains originated from one region in Italy, which probably contributed to the lower diversity detected here. In addition, we also excluded some microsatellite loci previously developed by Pasquetti et al. [4] from our typing scheme due to the presence of several motifs or interrupted repeats. Elimination of these hypervariable markers probably further reduced the observed diversity.
Using STRUCTURE software, we showed that the examined isolates belonged to two major subpopulations, i.e., cluster 1 and cluster 2. However, these populations were relatively poorly differentiated, with significant gene flow between them, as indicated by AMOVA and the relatively low number of fixed alleles in each cluster. This was also demonstrated by the presence of isolates with high admixture levels between clusters, namely, isolates CD1190, CD1192 and CD448 (MLST types F, H and R; Figure 2). There was no statistically significant difference in the distribution of hosts or symptomatic and asymptomatic animals between clusters. In conclusion, we were not able to find any link between these subpopulations and the biological characteristics of strains. This may reflect the fact that these populations were not clearly separated and were rather arbitrarily delimited. In addition, changes in the virulence level may be associated with genotypes rather than with the entire subpopulation. It may have also reflected different selection pressures that affected the studied loci and virulence factors (neutral evolution vs. positive selection).
Data from the present study showed that the MLST approach offers only very limited discriminatory power among M. canis strains and thus is not suitable for subtyping. Only a few markers, such as ITS and IGS regions, might be useful for the detection of limited genetic variability. In contrast, MLMT has a high discriminatory power, and the proposed typing scheme is useful for gaining insight into the dynamics of disease transmission, determining the source and routes of infections and confirming or ruling out outbreaks. In addition, MLMT might be useful for identifying virulent strains, identifying the regional and global distributions of genotype patterns and evaluating the effectiveness of control or preventive measures and interventions.

4. Materials and Methods

4.1. Source of Isolates

A total of 66 M. canis strains isolated from animal and human patients with dermatophytosis were employed. The strains were obtained from the Veterinary Mycology collection of the Department of Veterinary Medicine, University of Bari and all were isolated in Southern Italy.

4.2. Multilocus Sequence Typing (MLST)

Quick-DNATM Fungal/Bacterial Miniprep kit (Zymo research, Orange, CA, USA) was used to isolate genomic DNA from seven days old colonies grown on malt extract agar (MEA: HiMedia, Mumbai, India) as described by Hubka et al. [21]. Target loci, i.e., internal transcribed spacer region (ITS) of the rDNA, intergenic spacer region of the rDNA (IGS), the partial β-tubulin gene (tubb), translation elongation factor 1-α (tef1-α), calmodulin (CaM), actin (act), glyceraldehyde 3-phosphate dehydrogenase (gapdh) and minichromosome maintenance complex component 7 (mcm7) were amplified using primer combinations listed in Table S5. A set of eight strains from different hosts and localities was used for initial screening of intraspecies variability. Microsporum audouinii and Microsporum ferrugineum were also included to determine the applicability of these markers in distinguishing mentioned species from closely related M. canis.
Reaction volume (20 μL) contained 1 μL (50 ng μL−1) of DNA, 0.3 μL of both primers (25 pM), 0.2 μL of My Taq Polymerase and 4 μL of 5 × My Taq PCR buffer (Bioline, London, UK). PCR conditions followed previously described protocol [22]. The PCR products were visualized in an electrophoretogram (1% agarose gel with 0.5 μg mL−1 ethidium bromide). Automated sequencing was performed at Seqlab Sequencing Service (Charles University, Prague, Czech Republic) using both terminal primers. Obtained DNA sequences were inspected and assembled in Bioedit v. 7.0.5. The PCR reaction and DNA sequencing was repeated for samples representing rare genotypes. Alignments of genes were performed using the FFT-NS-i option implemented in MAFFT online service [23]. The unique DNA sequences were deposited into the European Nucleotide Archive (ENA) database under the numbers LR989561–LR989562, LR989270–LR989272, OU375165–OU375167, OU374853–OU374855, OU374996–OU374999, OU375053–OU375056, OU375000–OU375003, OU375004–OU375007, OU375008–OU375011, OU375012–OU375015.

4.3. Development of Microsatellite Markers

A BLAST (Basic Local Alignment Search Tool) search was conducted to identify microsatellite motifs using the available nucleotide sequence of M. canis CBS 113480 whole genome shotgun sequence (http://www.broadinstitute.org/) (accessed on 10 July 2020) using WebSat online software [24]. Thirteen loci with high number of di-, tri and tetranucleotide repeats were selected in addition to markers previously developed by Pasquetti et al. [4]. In total, 21 loci were used for further analyses. A test set of eight strains from different hosts and localities was used to ascertain presence of polymorphisms following the method of Schuelke [25]. PCR conditions were as follows: one cycle at 95 °C for 1 min; 27 cycles at 95 °C for 30 s, 55 °C for 30 s, 72 °C for 45 s, followed by eight cycles at 95 °C for 30 s, 53 °C for 30 s, 72 °C for 45 s and a final extension at 72 °C for 10 min. We checked the presence of undesirable polymorphisms in the microsatellite flanking regions and polymorphisms in the microsatellite regions by DNA sequencing using terminal primers. Interrupted repeats as well as loci containing two or more repeat motifs within the fragments were excluded. Emphasis was also placed on the selection of loci that were uniformly distributed in the available genomic sequence. Finally, six loci exhibiting some levels of polymorphism were selected for multilocus microsatellite typing (MLMT) (Table 2). Some markers (GT13, AC20–AC14, AT15, GT15) developed by Pasquetti et al. [4] were excluded because of the presence of interrupted repeats and some loci contained two or more repeat motifs within the fragments.
Using a Multiplex Primer Analyzer (www.thermoscientifcbio.com/webtools/multipleprimer) (accessed on 10 July 2020), primer-primer interactions were evaluated before assembling multiplexes. The forward primers of six selected loci were tagged with fluorescent dye and arranged into a single multiplex panel (Table 2). The reaction volume of 5 μL for multiplex PCR contained 1 μL DNA, 0.5 μL of water, 1 μL of the mixture of primers and 2.5 μL of Multiplex PCR Master Mix (QIAGEN, Hilden, Germany). The PCR conditions were chosen according to the manufacturer’s recommendations. The PCR products (diluted in water 1:50) were mixed with 10 μL of deionized formamide and 0.2 μL of the GeneScan™ 600 LIZ size standard (Applied Biosystems, Waltham, MA, USA) and denatured for 3 min at 95 °C, followed by analysis on an ABI 3100 Avant Genetic Analyzer in the Seqlab Sequencing Service (Charles University, Prague, Czech Republic). Peak sizes were scored with GeneMapper software and allele binning was performed with MsatAllele R package [26].

4.4. Statistical Analysis of Microsatellite Data

The discriminatory power of the typing scheme was calculated using Simpson’s index of diversity. A binary and allele data matrix was created using GeneMarker 3.0.1 software (SoftGenetics, LLC, State College, PA, USA) and genetic distances were calculated from the matrix and used for the construction of the NeighborNet network in the SplitsTree 4 [27]. A Bayesian model-based clustering algorithm with a clustering number K = 1–10 was applied to the allele data matrix using the software STRUCTURE [15]. Ten simulations were calculated at the www.bioportal.uio.no (accessed on 30 October 2021) server (Lifeportal, University of Oslo, Oslo, Norway) using the admixture model and 1 × 10⁶ MCMC replicates; 5 × 10⁸ replicates were discarded as burn-in. The optimal clustering number K was estimated using ΔK and similarity coefficients, [28] and both values were calculated using the script structure-sum [29] in the R version 3.3.4 [30].
The genetic variability within and between clusters was analysed via the analysis of molecular variance (AMOVA) [31] in the Arlequin [32]. The degree of gene flow among clusters was estimated using a pairwise fixation index (FST) calculated in Arlequin [32]. The degree of clonality or recombination within particular clusters was estimated by calculating the index of association (IA) in the program MultiLocus 1.3, [33] which is used for measuring the linkage disequilibrium between alleles and is useful in inferring the occurrence of cryptic recombination in putatively asexual populations [34]. Random mating is suggested if no linkage is detected between the alleles of different loci (randomly distributed alleles); in that case IA, it is expected to be nearly zero or zero. We tested for significant deviation from 10,000 random multilocus permutations of genotypes under a random mating model. To measure within-population diversity, Nei’s gene diversity (D) was calculated based on the frequencies of alleles at individual loci [35,36]. The degree of genetic divergence was investigated by the rarity index (DW; frequency down-weighted marker values) [37]. All mentioned population indexes (D, DW) were calculated from binary data matrix using script AFLPdat in R 3.0.2 [30]. Frequency histograms of pairwise differences between individuals were generated using the same software.

Supplementary Materials

The following are available online at https://0-www-mdpi-com.brum.beds.ac.uk/article/10.3390/pathogens11010004/s1 Table S1: Accession number for various genes of Microsporum strains generated in this study, Table S2: Distribution of hosts and animals with and without lesion between microsatellite clusters, Table S3: Indexes of genetic diversity and cluster rarity calculated for two populations from Microsporum canis, Table S4: Analysis of molecular variance design and results, Table S5: List of loci screened for variability in the present study and corresponding primer pairs [38,39,40,41,42,43,44,45,46].

Author Contributions

Conceptualization, C.I.A., A.Č. and V.H.; Data curation, C.I.A. and W.R.; Formal analysis, C.I.A., A.Č. and V.H.; Investigation, C.I.A., A.Č., W.R. and D.O.; Methodology, C.I.A., A.Č. and V.H.; Project administration, V.H.; Resources, V.H.; Software, C.I.A. and A.Č.; Supervision, A.Č., V.H. and C.C.; Validation, C.I.A., A.Č., V.H., D.O. and C.C.; Visualization, C.I.A. and V.H.; Writing—original draft, C.I.A., A.Č. and V.H.; Writing—review and editing, V.H., D.O. and C.C. All authors have read and agreed to the published version of the manuscript.

Funding

This research was supported by the International Society for Human and Animal Mycology (ISHAM) fellowship training fund to C.I.A. Contribution of V.H. was supported by the Charles University Research Centre program no. 204069 and Czech Academy of Sciences Long-term Research Development Project [RVO: 61388971].

Institutional Review Board Statement

Not applicable.

Informed Consent Statement

Not applicable.

Data Availability Statement

The DNA sequences obtained in this study were deposited into the European Nucleotide Archive (ENA) database.

Acknowledgments

The research reported in this publication was part of the long-term goals of the ISHAM working group Onygenales. We are grateful to Radek Zmítko for help with the graphical adjustments of analysis outputs.

Conflicts of Interest

The authors declare no conflict of interest.

References

  1. Uhrlaß, S.; Krüger, C.; Nenoff, P. Microsporum canis: Current data on the prevalence of the zoophilic dermatophyte in central Germany. Hautarzt 2015, 66, 855–862. [Google Scholar] [CrossRef] [PubMed]
  2. Aneke, C.I.; Otranto, D.; Cafarchia, C. Therapy and antifungal susceptibility profile of Microsporum canis. J. Fungi 2018, 4, 107. [Google Scholar] [CrossRef] [PubMed] [Green Version]
  3. Sharma, R.; De Hoog, G.S.; Presber, W.; Gräser, Y. Virulent genotype of Microsporum canis is responsible for the majority of human infections. J. Med. Microbiol. 2007, 56, 1377–1385. [Google Scholar] [CrossRef] [Green Version]
  4. Pasquetti, M.; Peano, A.; Soglia, D.; Min, A.R.M.; Pankewitz, F.; Ohst, T.; Gräser, Y. Development and validation of a microsatellite marker-based method for tracing infections by Microsporum canis. J. Dermatol. Sci. 2013, 70, 123–129. [Google Scholar] [CrossRef] [Green Version]
  5. Cafarchia, C.; Romito, D.; Capelli, G.; Guillot, J.; Otranto, D. Isolation of Microsporum canis from the hair coat of pet dogs and cats belonging to owners diagnosed with M. canis tinea corporis. Vet. Dermatol. 2006, 17, 327–333. [Google Scholar] [CrossRef]
  6. Gräser, Y.; Frohlich, J.; Presber, W.; de Hoog, G.S. Microsatellite markers reveal geographic population differentiation in Trichophyton rubrum. J. Med. Microbiol. 2007, 56, 1058–1065. [Google Scholar] [CrossRef]
  7. Abdel-Rahman, S.M. Strain differentiation of dermatophytes. Mycopathologia 2008, 166, 319–333. [Google Scholar] [CrossRef] [PubMed]
  8. Mochizuki, T.; Takeda, K.; Anzawa, K. Molecular markers useful for intraspecies subtyping and strain differentiation of dermatophytes. Mycopathologia 2017, 182, 57–65. [Google Scholar] [CrossRef]
  9. Taylor, J.W.; Hann-Soden, C.; Branco, S.; Sylvain, I.; Ellison, C.E. Clonal reproduction in fungi. Proc. Natl. Acad. Sci. USA 2015, 112, 8901–8908. [Google Scholar] [CrossRef] [Green Version]
  10. Dobrowolska, A.; Debska, J.; Kozlowska, M.; Staczek, P. Strains differentiation of Microsporum canis by RAPD analysis using (GACA)4 and (ACA)5 primers. Pol. J. Microbiol. 2011, 60, 145–148. [Google Scholar] [CrossRef]
  11. Čmoková, A.; Rezaei-Matehkolaei, A.; Kuklová, I.; Kolařík, M.; Shamsizadeh, F.; Ansari, S.; Gharaghani, M.; Miňovská, V.; Najafzadeh, M.J.; Nouripour-Sisakht, S. Discovery of new Trichophyton members, T. persicum and T. spiraliforme spp. nov., as a cause of highly inflammatory tinea cases in Iran and Czechia. Microbiol. Spectr. 2021, 2, e0028421. [Google Scholar] [CrossRef]
  12. Čmoková, A.; Kolařík, M.; Dobiáš, R.; Hoyer, L.L.; Janouškovcová, H.; Kano, R.; Kuklová, I.; Lysková, P.; Machová, L.; Maier, T.; et al. Resolving the taxonomy of emerging zoonotic pathogens in the Trichophyton benhamiae complex. Fungal Divers. 2020, 104, 333–387. [Google Scholar] [CrossRef]
  13. de Valk, H.A.; Meis, J.F.G.M.; Klaassen, C.H.W. Microsatellite based typing of Aspergillus fumigatus: Strengths, pitfalls and solutions. J. Microbiol. Methods 2007, 69, 268–272. [Google Scholar] [CrossRef] [PubMed]
  14. de Groot, T.; Puts, Y.; Berrio, I.; Chowdhary, A.; Meis, J.F. Development of Candida auris short tandem repeat typing and its application to a global collection of isolates. MBio 2020, 11, e02971-19. [Google Scholar] [CrossRef] [PubMed] [Green Version]
  15. Pritchard, J.K.; Stephens, M.; Donnelly, P. Inference of population structure using multilocus genotype data. Genetics 2000, 155, 945–959. [Google Scholar] [CrossRef] [PubMed]
  16. Rezaei-Matehkolaei, A.; Makimura, K.; de Hoog, G.S.; Shidfar, M.R.; Satoh, K.; Najafzadeh, M.J.; Mirhendi, H. Multilocus differentiation of the related dermatophytes Microsporum canis, Microsporum ferrugineum and Microsporum audouinii. J. Med. Microbiol. 2012, 61, 57–63. [Google Scholar] [CrossRef] [PubMed]
  17. Gräser, Y.; Scott, J.; Summerbell, R. The new species concept in dermatophytes—a polyphasic approach. Mycopathologia 2008, 166, 239–256. [Google Scholar] [CrossRef] [Green Version]
  18. White, T.C.; Oliver, B.G.; Gräser, Y.; Henn, M.R. Generating and testing molecular hypotheses in the dermatophytes. Eukaryot. Cell 2008, 7, 1238–1245. [Google Scholar] [CrossRef] [Green Version]
  19. da Costa, F.V.; Farias, M.R.; Bier, D.; de Andrade, C.P.; de Castro, L.A.; da Silva, S.C.; Ferreiro, L. Genetic variability in Microsporum canis isolated from cats, dogs and humans in Brazil. Mycoses 2013, 56, 582–588. [Google Scholar] [CrossRef]
  20. Watanabe, J.; Anzawa, K.; Mochizuki, T. Molecular Epidemiology of Japanese isolates of Microsporum canis based on multilocus microsatellite typing fragment analysis. Jpn. J. Infect. Dis. 2017, 70, 544–548. [Google Scholar] [CrossRef] [PubMed] [Green Version]
  21. Hubka, V.; Nováková, A.; Jurjević, Ž.; Sklenář, F.; Frisvad, J.C.; Houbraken, J.; Arendrup, M.C.; Jørgensen, K.M.; Siqueira, J.P.Z.; Gené, J.; et al. Polyphasic data support the splitting of Aspergillus candidus into two species; proposal of A. dobrogensis sp. nov. Int. J. Syst. Evol. Microbiol. 2018, 68, 995–1011. [Google Scholar] [CrossRef]
  22. Sklenář, F.; Jurjević, Ž.; Houbraken, J.; Kolařík, M.; Arendrup, M.C.; Jørgensen, K.M.; Siqueira, J.P.Z.; Gené, J.; Yaguchi, T.; Ezekiel, C.N.; et al. Re-examination of species limits in Aspergillus section Flavipedes using advanced species delimitation methods and proposal of four new species. Stud. Mycol. 2021, 99, 100120. [Google Scholar] [CrossRef]
  23. Katoh, K.; Rozewicki, J.; Yamada, K.D. MAFFT online service: Multiple sequence alignment, interactive sequence choice and visualization. Brief Bioinform. 2017, 20, 1160–1166. [Google Scholar] [CrossRef] [PubMed] [Green Version]
  24. Martins, W.S.; Lucas, D.C.S.; de Souza Neves, K.F.; Bertioli, D.J. WebSat-A web software for microsatellite marker development. Bioinformation 2009, 3, 282–283. [Google Scholar] [CrossRef] [PubMed] [Green Version]
  25. Schuelke, M. An economic method for the fuorescent labeling of PCR fragments. Nat. Biotechnol. 2000, 18, 233. [Google Scholar] [CrossRef]
  26. Alberto, F. MsatAllele_1.0: An R package to visualize the binning of microsatellite alleles. J. Hered. 2009, 100, 394–397. [Google Scholar] [CrossRef] [PubMed] [Green Version]
  27. Huson, D.H. SplitsTree: Analyzing and visualizing evolutionary data. Bioinformatics 1998, 14, 68–73. [Google Scholar] [CrossRef] [PubMed]
  28. Evanno, G.; Regnaut, S.; Goudet, J. Detecting the number of clusters of individuals using the software STRUCTURE: A simulation study. Mol. Ecol. 2005, 14, 2611–2620. [Google Scholar] [CrossRef] [PubMed] [Green Version]
  29. Ehrich, D. AFLPdat: A collection of R functions for convenient handling of AFLP data. Mol. Ecol. Notes 2006, 6, 603–604. [Google Scholar] [CrossRef]
  30. R Core Team. R: A Language and Environment for Statistical Computing; R Foundation for Statistical Computing: Vienna, Austria, 2016. [Google Scholar]
  31. Excofer, L.; Smouse, P.E.; Quattro, J.M. Analysis of molecular variance inferred from metric distances among DNA haplotypes: Application to human mitochondrial DNA restriction data. Genetics 1992, 131, 479–491. [Google Scholar] [CrossRef]
  32. Schneider, S.; Roessli, D.; Excofer, L. ARLEQUIN: A Software for Population Genetics Data Analysis; Version 2.000; University of Geneva: Geneva, Switzerland, 2000; Volume 2. [Google Scholar]
  33. Agapow, P.M.; Burt, A. Indices of multilocus linkage disequilibrium. Mol. Ecol. Notes 2001, 1, 101–102. [Google Scholar] [CrossRef]
  34. Burt, A.; Carter, D.A.; Koenig, G.L.; White, T.J.; Taylor, J.W. Molecular markers reveal cryptic sex in the human pathogen Coccidioides immitis. Proc. Natl. Acad. Sci. USA 1996, 93, 770–773. [Google Scholar] [CrossRef] [Green Version]
  35. Nei, M. Molecular Evolutionary Genetics; Columbia University Press: New York, NY, USA, 1987. [Google Scholar]
  36. Kosman, E. Nei’s gene diversity and the index of average differences are identical measures of diversity within populations. Plant Pathol. 2003, 52, 533–535. [Google Scholar] [CrossRef]
  37. Schonswetter, P.; Tribsch, A. Vicariance and dispersal in the alpine perennial Bupleurum stellatum L. (Apiaceae). Taxon 2005, 54, 725–732. [Google Scholar] [CrossRef] [Green Version]
  38. White, T.J.; Bruns, T.; Lee, S.; Taylor, J.W.; Innis, M.A.; Gelfand, D.H.; Sninsky, J. Amplification and direct sequencing of fungal ribosomal RNA genes for phylogenetics. In PCR Protocols: A Guide to Methods and Applications; Academic Press Inc.: New York, NY, USA, 1990; pp. 315–322. [Google Scholar]
  39. Gardes, M.; Bruns, T.D. ITS primers with enhanced specificity for basidiomycetes-application to the identification of mycorrhizae and rusts. Mol. Ecol. 1993, 2, 113–118. [Google Scholar] [CrossRef] [PubMed]
  40. Kumar, M.; Shukla, P.K. Use of PCR targeting of internal transcribed spacer regions and single-stranded conformation polymorphism analysis of sequence variation in different regions of rRNA genes in fungi for rapid diagnosis of mycotic keratitis. J. Clin. Microbiol. 2005, 43, 662–668. [Google Scholar] [CrossRef] [Green Version]
  41. Glass, N.L.; Donaldson, G.C. Development of primer sets designed for use with the PCR to amplify conserved genes from filamentous ascomycetes. Appl. Environ. Microbiol. 1995, 61, 1323–1330. [Google Scholar] [CrossRef] [PubMed] [Green Version]
  42. Mirhendi, H.; Makimura, K.; de Hoog, G.S. Translation elongation factor 1-α gene as a potential taxonomic and identification marker in dermatophytes. Med. Mycol. 2015, 53, 215–224. [Google Scholar] [CrossRef] [PubMed] [Green Version]
  43. Peterson, S.W. Phylogenetic analysis of Aspergillus species using DNA sequences from four loci. Mycologia 2008, 100, 205–226. [Google Scholar] [CrossRef]
  44. Carbone, I.; Kohn, L.M. A method for designing primer sets for speciation studies in filamentous ascomycetes. Mycologia 1999, 91, 553–556. [Google Scholar] [CrossRef]
  45. Kawasaki, M.; Anzawa, K.; Ushigami, T.; Kawanishi, J.; Mochizuki, T. Multiple gene analyses are necessary to understand accurate phylogenetic relationships among Trichophyton species. Med. Mycol. J. 2011, 52, 245–254. [Google Scholar] [CrossRef] [PubMed] [Green Version]
  46. Schmitt, I.; Crespo, A.; Divakar, P.K.; Fankhauser, J.D.; Herman-Sackett, E.; Kalb, K.; Nelsen, M.P.; Nelson, N.A.; Rivas-Plata, E.; Shimp, A.D.; et al. New primers for promising single-copy genes in fungal phylogenetics and systematics. Persoonia 2009, 23, 35–40. [Google Scholar] [CrossRef] [PubMed] [Green Version]
Figure 1. Haplotype network of Microsporum canis based on combined sequence data from ITS and IGS regions. Haplotypes are indicated by circles and their sizes correspond to the number of strains sharing this haplotype. Dashes on the connecting lines indicate substitutions and crosses indels; hosts and presence/absence of lesion are indicated by various colours. Strains of M. ferrugineum (CBS 497.48, SK 1775/19) and M. audouinii (CBS 404.61) were used as outgroups.
Pathogens 11 00004 g001
Figure 2. The population structure of Microsporum canis strains revealed by the analysis of six microsatellite loci. The population structure was examined using STRUCTURE software based on the Bayesian clustering algorithm and the peak of ΔK was observed at K = 2 (a). Individual strains are represented by bar plots generated in STRUCTURE that summarize Q values, i.e., the proportional membership of each individual to inferred clusters (b). A NeighborNet network was inferred with FAMD software and visualized in SplitsTree (c) using the Jaccard index-based distance matrix (Delta score = 0.08402, Q-residual score = 0.09745). The assignment of strains to clusters is indicated by red or green colour; the hosts of the individual haplotypes are indicated by icons (c). Histograms showing the frequency of pairwise genetic differences among individuals within populations of cluster 1 (d) and cluster 2 (e).
Pathogens 11 00004 g002
Table 1. A detailed overview of subtyping results using sequence and microsatellite markers in 66 Microsporum canis strains.
SampleSourceLesionTyping Using ITS and IGS LociMultilocus Microsatellite Typing
ITS-GTIGS-GTMLSTTC10GT17CAG12GT17BCAT8GT14MLMTCluster
CD367dognoG1G1G1NANANANANANANANA
CD1131catyesG1G1G1109370374108396102A1
CD1133catyesNANANA103368374108396102C1
CD1134catnoG1G3G3103368374108396102C1
CD1149catyesG1G1G1103368374108396102C1
CD1150humanyesG1G1G1103368374108396102C1
CD1151catyesG1G1G1103368374108396102C1
CD1152humanyesG1G1G1103368374108396102C1
CD1171dogyesNANANA103368374108396102C1
CD1194catyesG1G1G1103368374108396102C1
CD1195catyesG1G1G1103368374108396102C1
CD1196humanyesG1G1G1103368374108396102C1
CD1211catyesG1G1G1103368374108396102C1
CD1233catyesG1G1G1103368374108396102C1
CD1595catnoG1G1G1103368374108396102C1
CD1601catyesG1G1G1103368374108396102C1
CD1602catyesG1G1G1103368374108396102C1
CD368dogyesNANANA103368374108396102C1
CD382catyesG1G1G1103368374108396102C1
CD396humanyesG1G1G1103368374108396102C1
CD441dogyesG1G1G1103368374108396102C1
CD975catyesG1G1G1103368374108396102C1
CD976catyesG1G1G1103368374108396102C1
CD979catyesG1G1G1103368374108396102C1
CD980catyesG1G1G1103368374108396102C1
CD1145catnoG1G1G1109368374108396102E1
CD1191catyesG1G1G1103368374108394102G1
CD383catnoG1G1G1103368374108394102G1
CD978catn0G1G1G1103368374108394102G1
CD1235catyesG1G1G1103370374108396104J1
CD1242catyesG1G1G1103370374108396102K1
CD1289catyesG2G1G4103370374108396102K1
CD1565catyesG1G1G1103368368108396102M1
CD366dogyesNANANA103368368108396104N1
CD384humanyesG1G1G1103368374106396102O1
CD415rabbitnoG1G1G1103368374106396102O1
CD416dogyesG1G1G1103368374108396104Q1
CD448rabbitnoG1G1G1107368374106394102R1
CD1132dogyesG1G1G1105368374110396104B2
CD1135catyesG1G1G1105368374110396104B2
CD1146dogyesG1G1G1105368374110396104B2
CD1148catyesG1G1G1105368374110396104B2
CD1320catyesG1G1G1105368374110396104B2
CD1598catyesG1G3G3105368374110396104B2
CD1600catyesG1G1G1105368374110396104B2
CD761catyesG1G1G1105368374110396104B2
CD1143humanyesG1G1G1105368374110396102D2
CD1153dogyesG1G1G1105368374110396102D2
CD1229dogyesG1G1G1105368374110396102D2
CD1230catyesG1G1G1105368374110396102D2
CD1231dognoG1G1G1105368374110396102D2
CD1232catyesG1G1G1105368374110396102D2
CD1567dogyesG1G1G1105368374110396102D2
CD1190humanyesG1G1G1107370374112396102F2
CD1192catnoG1G2G2107370374112394102H2
CD1193catyesG1G2G2105370374110396102I2
CD1209catyesG1G2G2105370374110396102I2
CD1306catyesG1G2G2105370374110396102I2
CD1307catyesG2G2G5105370374110396102I2
CD1308catnoG2G2G5105370374110396102I2
CD409rabbitnoG1G2G2105370374110396102I2
CD412rabbityesG1G2G2105370374110396102I2
CD760catnoG1G2G2105370374110396102I2
CD1279dogyesG1G1G1105368374110394102L2
CD387rabbityesG1G2G2105370374110394102P2
CD430dogyesG1G2G2105370374110394102P2
ITS-GT, ITS genotype; IGS-GT, IGS genotype; MLST, combined genotype resulting from ITS and IGS loci; MLMT, combined haplotype resulting from multilocus microsatellite typing, NA, not available (markers were were not amplified despite repeated attempts).
Table 2. Microsatellite markers used for multilocus microsatellite typing of Microsporum canis in this study.
LocusPrimerSequence (5′–3′)5′-Fluorescent DyeProduct Size (bp)Reference
AG12forwardCCGAATCCCAAGAACAAGAACNED368–374this study
reverseCATGACCTCCAAGACCATCAC
TC10forwardTATACGATGTGTACGGCGAGAGVIC103–109this study
reverseGTTACAGAGGAACGAACAACCC
CAT8forwardTTCAAGTCAAAGGAGAGCTGTGPET394–396this study
reverseTGCAGTGTATTTGGGTCAAGTC
GT17BfowardGAAGGAGGTATATATGGGTGTGNED106–112[4]
reverseGATAAGGTGTTTGGCACTGA
GT17CfowardAGGTGTTTGGCACTGAGCVIC368–370[4]
reverseCGAAGAGAAGGAGGTATATATGG
GT14fowardGGTTTACACGCAGCATGAPET102–104[4]
reverseCGTGGCTGAAGAAGTCTACC
Publisher’s Note: MDPI stays neutral with regard to jurisdictional claims in published maps and institutional affiliations.

