Article

What Is the Impact of Early and Subsequent Epidemic Characteristics on the Pre-delta COVID-19 Epidemic Size in the United States?

1
China-Australia Joint Research Center for Infectious Diseases, School of Public Health, Xi’an Jiaotong University Health Science Center, Xi’an 710061, China
2
SESH (Social Entrepreneurship to Spur Health) Global, University of North Carolina at Chapel Hill Project-China, Guangzhou 510095, China
3
Key Laboratory for Disease Prevention and Control and Health Promotion of Shaanxi Province, Xi’an 710061, China
4
Artificial Intelligence and Modelling in Epidemiology Program, Melbourne Sexual Health Centre, Alfred Health, Melbourne, VIC 3053, Australia
5
Central Clinical School, Faculty of Medicine, Monash University, Melbourne, VIC 3800, Australia
6
Department of Epidemiology and Biostatistics, College of Public Health, Zhengzhou University, Zhengzhou 450001, China
*
Author to whom correspondence should be addressed.
These authors contributed equally to this work.
Submission received: 6 April 2022 / Revised: 6 May 2022 / Accepted: 11 May 2022 / Published: 13 May 2022
(This article belongs to the Special Issue Emerging and Re-emerging Viral Infectious Diseases)

Abstract

:
It is still uncertain how the epidemic characteristics of COVID-19 in its early phase and subsequent waves contributed to the pre-delta epidemic size in the United States. We identified the early and subsequent characteristics of the COVID-19 epidemic and the correlation between these characteristics and the pre-delta epidemic size. Most (96.1% (49/51)) of the states entered a fast-growing phase before the accumulative number of cases reached (30). The days required for the number of confirmed cases to increase from 30 to 100 was 5.6 (5.1–6.1) days. As of 31 March 2021, all 51 states experienced at least 2 waves of COVID-19 outbreaks, 23.5% (12/51) experienced 3 waves, and 15.7% (8/51) experienced 4 waves, the epidemic size of COVID-19 was 19,275–3,669,048 cases across the states. The pre-delta epidemic size was significantly correlated with the duration from 30 to 100 cases (p = 0.003, r = −0.405), the growth rate of the fast-growing phase (p = 0.012, r = 0.351), and the peak cases in the subsequent waves (K1 (p < 0.001, r = 0.794), K2 (p < 0.001, r = 0.595), K3 (p < 0.001, r = 0.977), and K4 (p = 0.002, r = 0.905)). We observed that both early and subsequent epidemic characteristics contribute to the pre-delta epidemic size of COVID-19. This identification is important to the prediction of the emerging viral infectious diseases in the primary stage.

1. Introduction

Coronavirus 19 disease (COVID-19) has led to a worldwide pandemic [1,2]. As of 31 March 2021, the pandemic disease was affecting people in over 200 countries and territories, with more than 127 million confirmed cases and 4 million deaths reported globally [3]. At the same time, in the United States (US), there were over 30 million confirmed cases and 550,354 deaths attributed to COVID-19 [4,5]. The cumulative incidence of COVID-19 in the United States at that time exceeded 9000/100,000. Whereas, at that time, only 16% of Americans were completely vaccinated, and the delta variant was just beginning to spread in the United States [6,7,8]. It can be considered that the epidemic of COVID-19 in the United States was in an early stage up to that time. Exploring the factors related to the early epidemic in the United States may provide new knowledge and insights for COVID-19 control and the other emerging viral infectious diseases.
After experiencing the early small-scale spread of the COVID-19 epidemic, many areas in the United States still experienced multiple outbreaks and spatiotemporal changes despite the government’s interventions, such as repeated lockdowns and the wide use of face masks [9,10,11,12]. Previous studies have demonstrated that early epidemiological characteristics, such as the basic reproduction ratio, could determine the subsequent epidemic level [13,14]. Furthermore, early epidemiological characteristics (such as the number of days from 30 to 100 cases) have been hypothesized as significant predictors of the subsequent epidemic of COVID-19 in China [15]. It is still uncertain whether this hypothesis can be confirmed in the United States from the available epidemiological data.
Various mathematical methods have been used to describe and predict the trend of the COVID-19 epidemic in the United States [16,17,18,19], with a lot of critical mathematical indicators produced. However, most studies focused on the prediction by models, as to whether the correlation between subsequent epidemic characteristics involved in these methods and the epidemic size needs to be further investigated. Quite a few studies have explored the influence of non-drug intervention measures such as lockdown, mask use, and mass-testing on the epidemic of COVID-19 by methods such as the dynamics model [20,21,22,23,24,25,26]. Nevertheless, to further investigate the role of the non-pharmacological interventions, it is also important to examine the impacts of the factors in interventions such as residents’ adherence to lockdown (represented as the new cases on the day of restriction) on the epidemic size in the United States.
We hypothesized that the severity of the COVID-19 epidemic could be characterized by epidemiological indicators in the early stage and subsequent waves of the epidemic. To address this question, we collected publicly available COVID-19 epidemic data from 51 states (including Washington, DC, USA) in the United States. We also conducted the correlation analysis after identifying the epidemic characteristics by the Joinpoint software and multi-logistic fitting. As the high vaccine coverage and delta variant represent different transmission patterns, we limit our data collection and analysis to 31 March 2021. This study aims to identify the impact of the epidemic characteristics in the early stage and subsequent waves on the pre-delta epidemic size in 51 states of the US.

2. Results

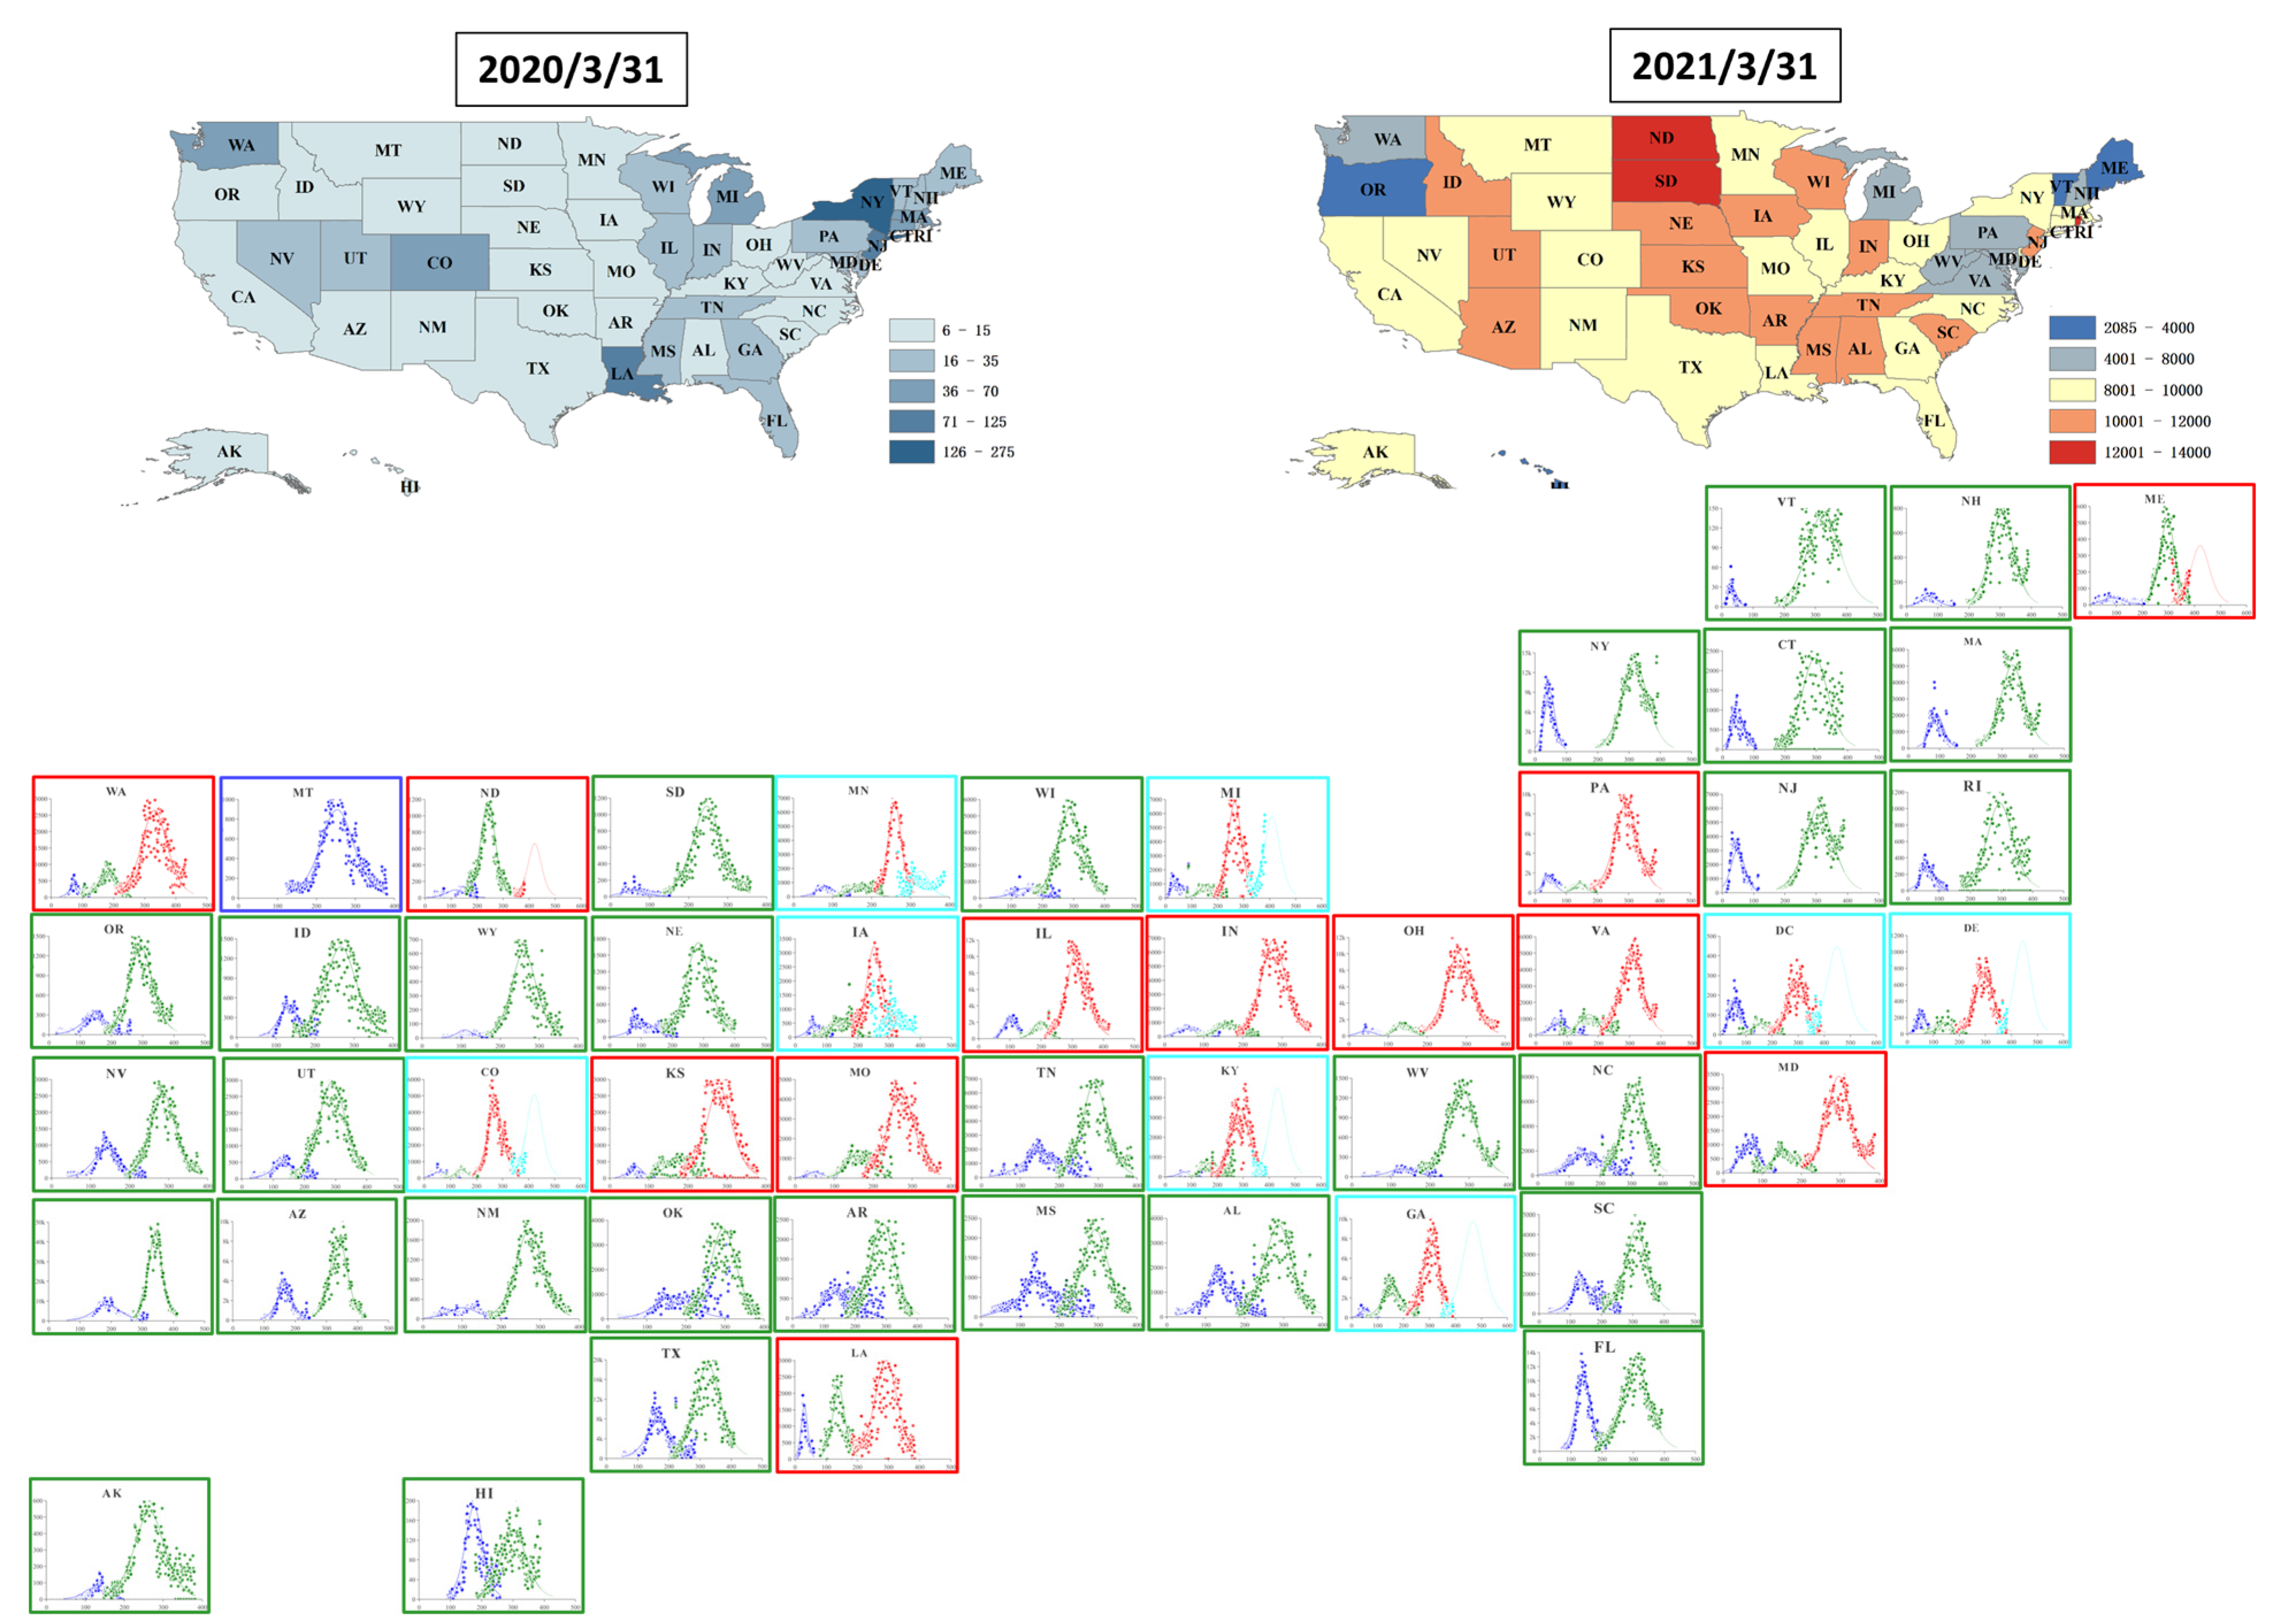
2.1. Spatiotemporal Changes of COVID-19 Pandemic in the United States

The geographic distribution of the COVID-19 epidemic showed a substantial change from 31 March 2020 to 31 March 2021, with a significant shift from the Eastern United States to the Central United States (Figure S1). On 31 March 2020, the incidence in most states was at a relatively low level (<300/100,000), while the highest incidence was reported in Eastern United States (New York, 275/100,000; New Jersey, 125/100,000). By 11 December 2020, there was a substantial increase in incidence in all states across the United States. In particular, there was a strong emergence in the Central United States (North Dakota, 11,445/100,000; South Dakota, 10,136/100,000). From 11 December 2020 to 31 March 2021, the growth of incidence slowed down slightly, but the Central United States remained the most severely affected area.
Remarkably, most of the states that experienced three or four waves were concentrated in the central part of the United States. The Getis–Ord Gi* statistic for total COVID-19 infectious identified Eastern United States as COVID hotspots in early 2020 and the Central United States as hotspots in 2021 and late 2020 (Figure S1). The Anselin’s Local Moran’s I analysis identified New York, located in the Eastern United States, as a high–low outlier in 2020, and “high–high” clusters were mainly found in the Central United States as of 31 March 2021.

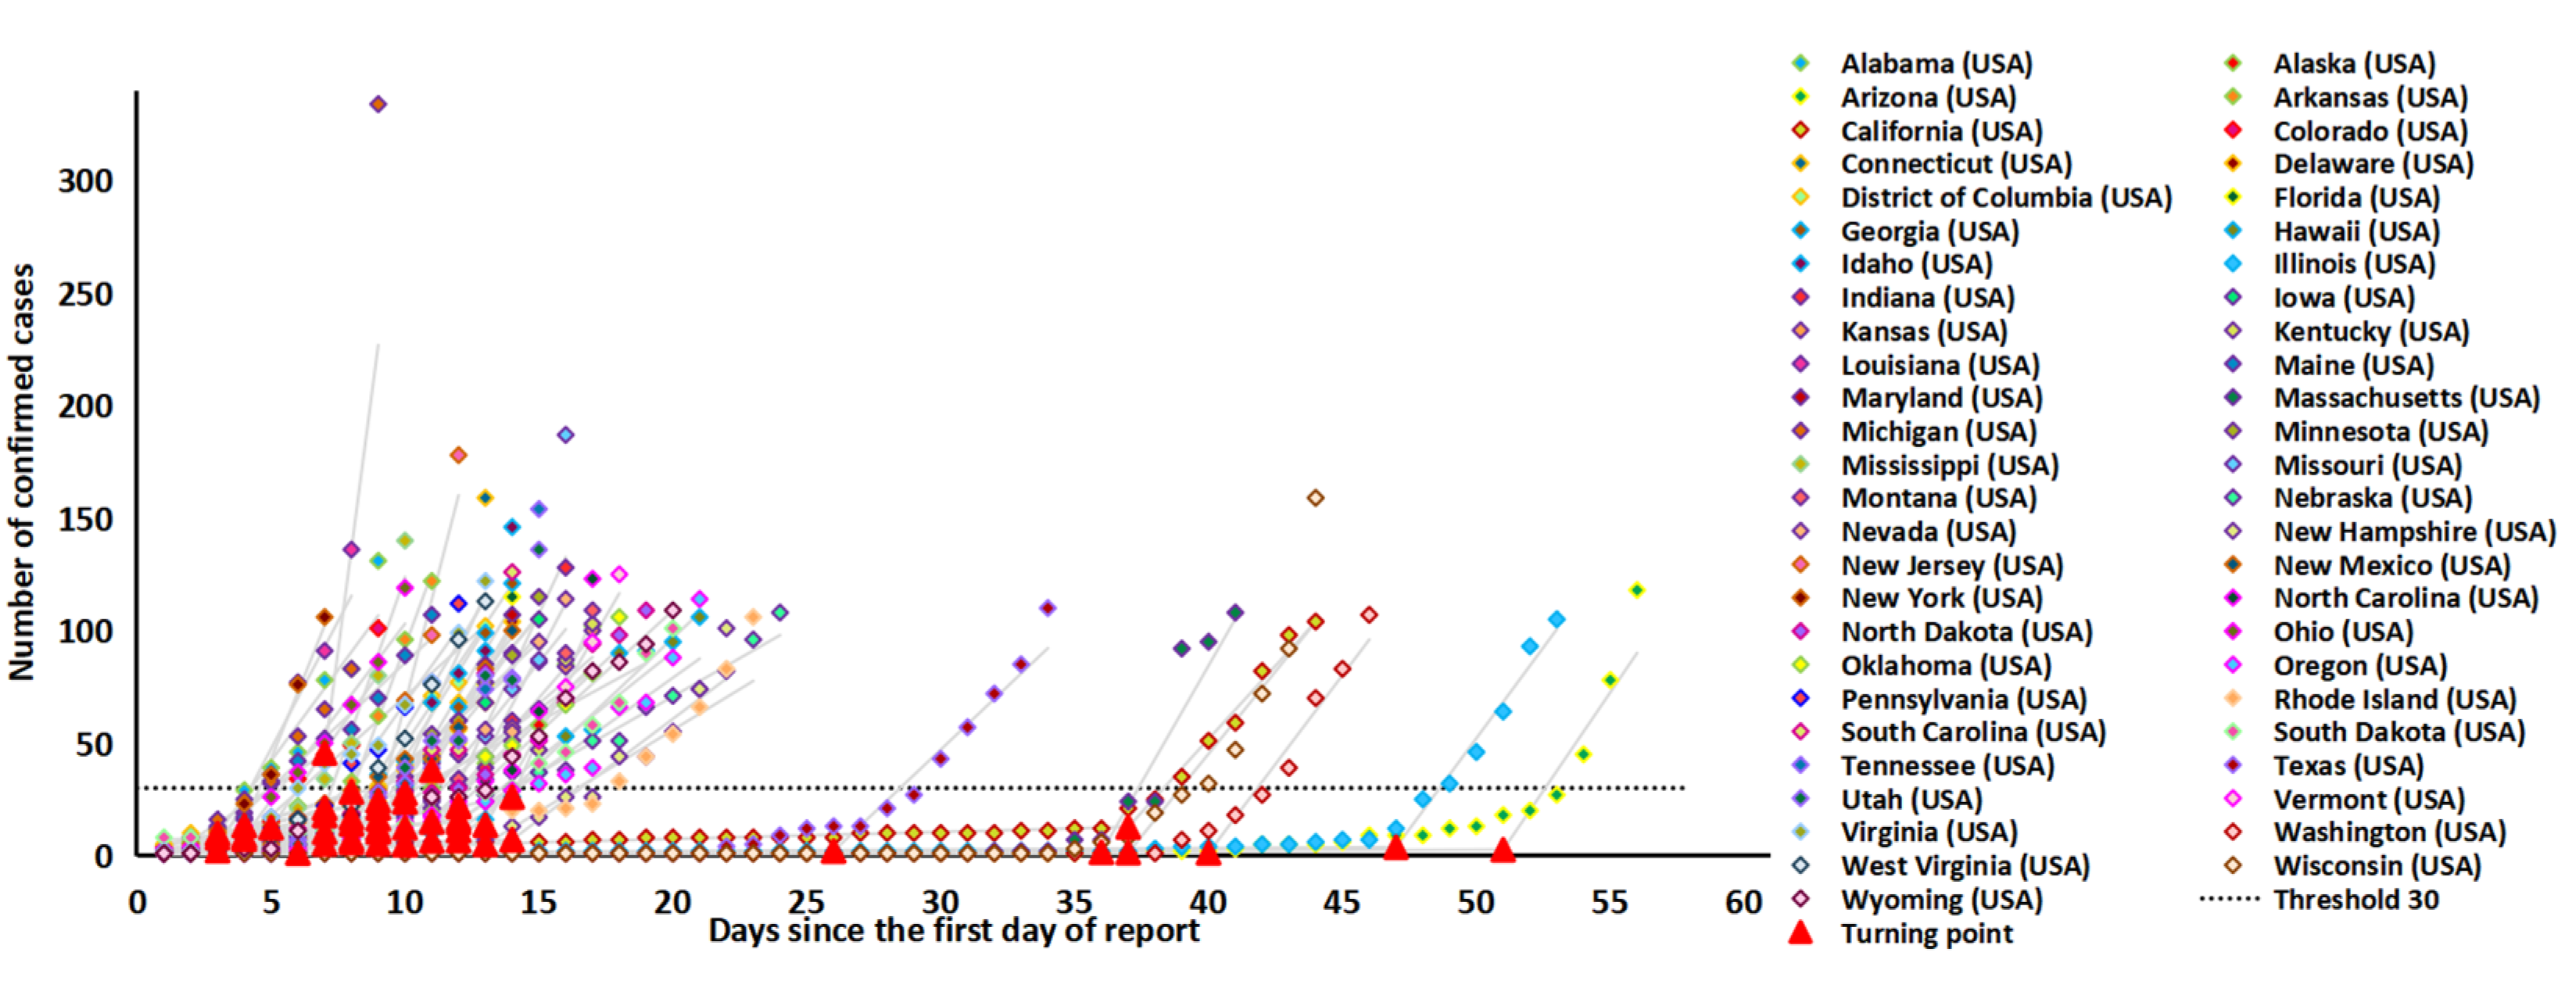
2.2. Early Epidemic Characteristics of the COVID-19 Epidemic in the US

We demonstrated two-phase linear fits to the first 100 confirmed cases of COVID-19 during the early phase of the epidemic in the 51 states of the US (Figure 1). The simple model identified one slow-growing phase and one fast-growing phase in the early phase of the 100 confirmed cases. The slow-growing phase was relatively short with a growth rate of 1.6 (1.2–2.0) cases/day, whereas the growth rate in the fast-growing phase was about 11 times higher (18.2 (14.5–21.8) cases/day, Table 1). The conversion from the slow phase to the fast phase occurred on day 13 (9.8–16.1). The average number of confirmed cases at the phase transition point was 12.6 (10.0–15.3) days, and 96.1% (49/51) of the states transited from the slow-growing phase to the fast-growing phase at a level below 30 cases (Figure 1, Table 1). Consistent with a previous finding in China [15], we regarded ‘30’ confirmed cases as a critical threshold where the COVID-19 epidemic started to increase rapidly. Further, in the 51 states, the days required for the number of confirmed cases to increase from 30 to 100 was 5.6 (5.1–6.1) days. The average case–fatality rates in the first 100 confirmed cases across all US states were 1.1% (0.6–1.6%).

2.3. Subsequent Epidemic Characteristics Based on Multi-Logistic Fitting

Figure 2 demonstrates the multi-logistic fitting to the COVID-19 epidemics in the 51 states. As of 31st March, our model identified that all 51 states experienced at least 2-waves of COVID-19 growth, among which 23.5% (12/51) experienced a 3-wave growth, and 15.7% (8/51) experienced a 4-wave growth (Table 2). Across all states, the average number of estimated confirmed cases was 111,061 (56,997–165,124), with an outbreak duration of 83.5 (75.0–92.0) days for the first wave. The average number of estimated confirmed cases was 329,686 (178,466–480,907), with an outbreak duration of 96.7 (90.2–103.1) days for the second wave. For the third and fourth waves, the average number of estimated confirmed cases at the peak was 389,757 (256,873–522,641) and 327,861 (43,632–612,091), and the outbreak duration was 94.1 (86.6–101.6) and 92.1 (76.9–107.3) days respectively. The fourth outbreak (estimated to saturate at 327,861 cases), the third outbreak (estimated to saturate at 389,757 cases) and the second outbreak (estimated to saturate at 327,686 cases) is significantly greater than the first outbreak (saturate at 111,061 cases). However, the duration of the outbreaks showed no significant difference across the waves.

2.4. Epidemic Size and Associated Characteristics

As of 31 March 2021, the overall epidemic size was 30,326,324 cases in the United States, ranging from the lowest 19,275 cases in Vermont to 3,669,048 cases in California. Figure 3 demonstrated significant correlations between epidemic size and time from 30 to 100 (p = 0.003, r = −0.405) and growth rate of the fast-growing phase (p = 0.012, r = 0.351). Additionally, epidemic size also showed significant positive correlations with K1 (p < 0.001, r = 0.794), K2 (p < 0.001, r = 0.595), K3 (p < 0.001, r = 0.977) and K4 (p = 0.002, r = 0.905). In addition, the epidemic size was positively correlated with the new cases on restriction day (p < 0.001, r = 0.764) and new cases on reopening day (p < 0.005, r = 0.880).

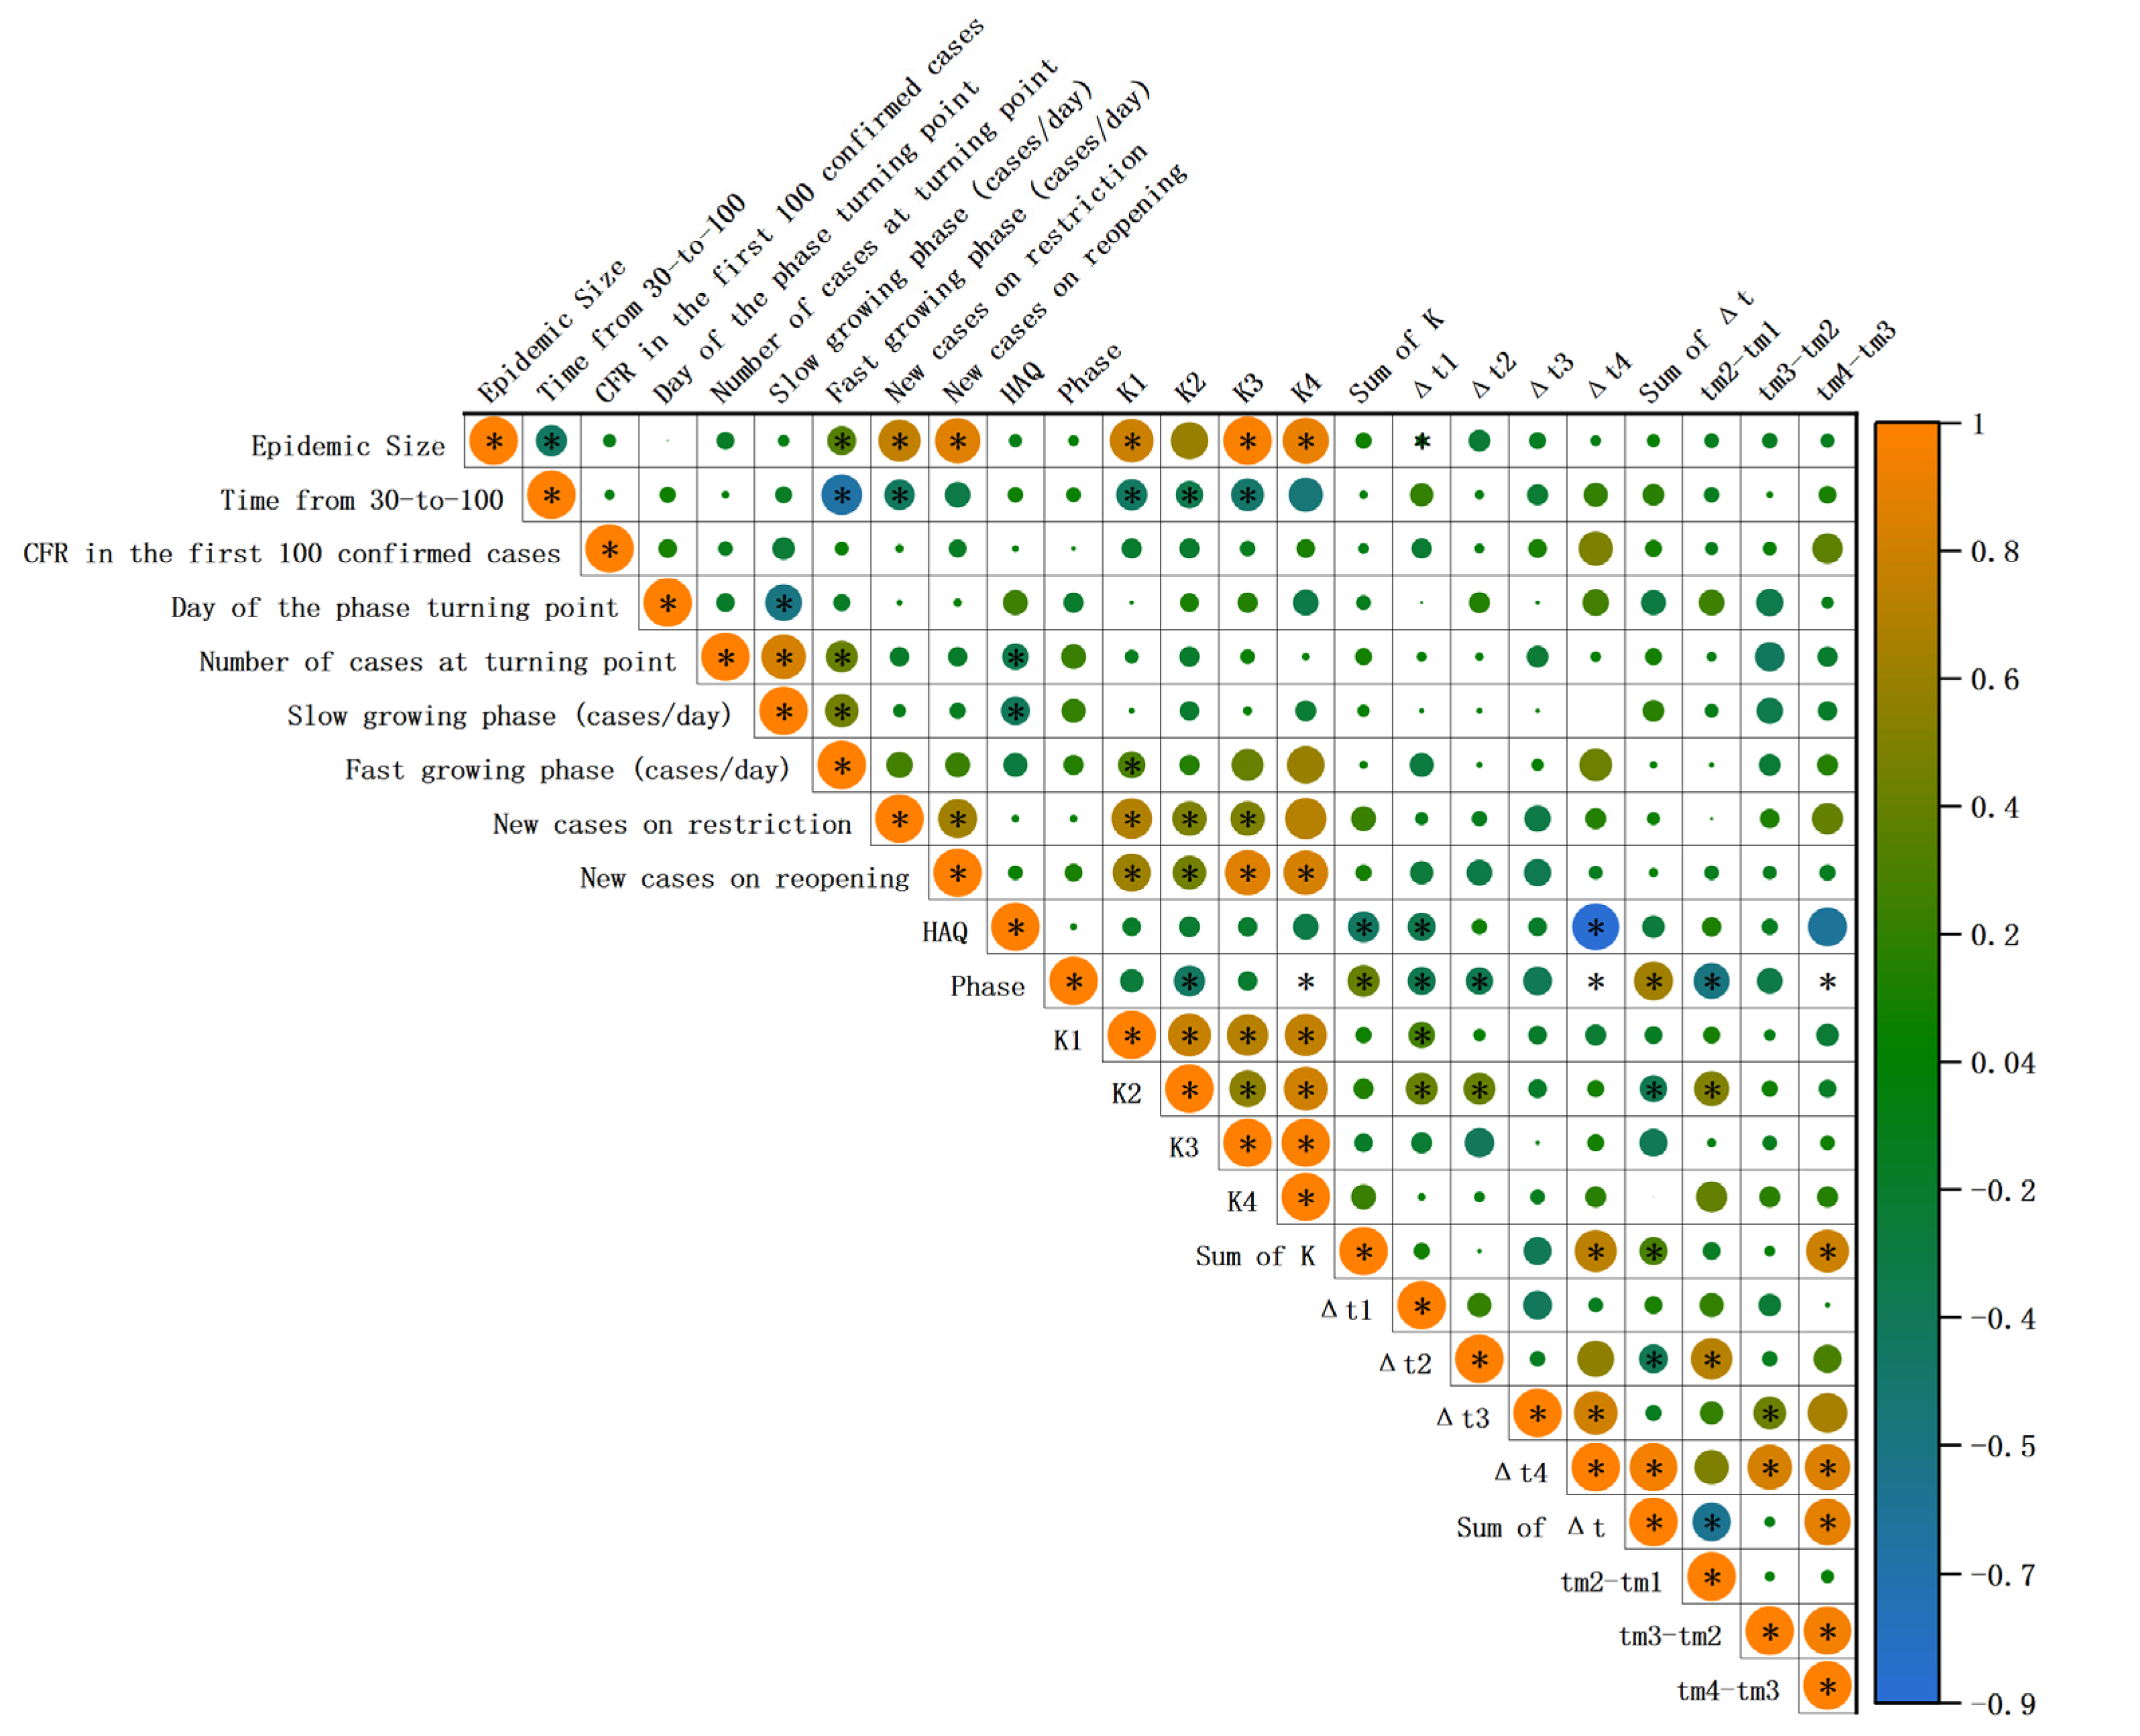
2.5. Correlation between Early and Subsequent Epidemic Characteristics

Notably, early characteristics of the epidemic also show a correlation with overall epidemic-wide fluctuations (Figure 3). Time from 30 to 100 was significantly negatively correlated with the K1 (p = 0.003, r = −0.41), K2 (p = 0.028, r = −0.31), and K3 (p = 0.048, r = −0.45). There is a negative correlation between HAQ and Δt1 (p = 0.021, r = −0.325) and Δt4 (p = 0.001, r = −0.929). In contrast, the new cases on reopening day showed a positive correlation with K1 (p < 0.001, r = 0.618), K2 (p = 0.003, r = 0.478), K3 (p < 0.001, r = 0.874), and K4 (p = 0.042, r = 0.829).

3. Discussion

Our study demonstrated that during the early phase of the epidemics in 51 US states, 30 cases appear to be a critical threshold for switching from a relatively slow-growing phase to a fast-growing phase. This is consistent with one of our previous published studies [15]. We identified multiple temporal waves and geographical distribution in the subsequent COVID-19 epidemics. Most states (50/51) have experienced at least 2 waves of the epidemic outbreak. The subsequent waves are significantly stronger and longer than the first wave, but states with a higher first wave tend to have higher subsequent waves as well. We also showed a geographic shift of the epidemic from the coastal states to inland states. The COVID-19 epidemic size across the US states is significantly associated with the duration from 30 to 100 cases, the growth rate of the fast-growing phase, and the peak cases in the subsequent waves.
Our study demonstrated similar early epidemic characteristics in the US compared with the previous findings in China [15]. In both settings, both countries were unprepared for the unprecedented outbreak. Based on the previous study, we again demonstrate that the first 30 cases appear to be an essential indicator of the onset of a rapid phase of COVID-19 transmission. Once this critical level is reached, the epidemic tends to enter a period of rapid expansion. Establishing an early warning system based on the number of confirmed cases per day is crucial to controlling the spread of an epidemic in the early phase. Interventions that aim to contain it to a low level in its early stage may be most beneficial in reducing its subsequent size.
Our study indicated that early characteristics are predictive of the subsequent waves of the epidemics and the epidemic size. Notably, the shorter the duration to increase from 30 to 100 cases in its early phase, the more severe the subsequent epidemic burden. The shorter duration represents a more rapid epidemic spread and likely reflects the absence of effective prevention strategies and diagnostic capacity in the states, leading to a high transmission rate. Consistent with this, more rapid growth in the early phase is also associated with a greater magnitude of subsequent waves. We believe the early rapid development of the outbreak may serve as an important warning signal for the healthcare system to respond to the outbreak and help predict the potential size of COVID-19 in the later development of the epidemic.
Our study demonstrated a significant shift in the geographical distribution of the COVID-19 epidemic from coastal to inland states, and inland states appeared to have experienced more subsequent waves, similar to the results of an earlier study [27]. This might be due to their delay in their response to COVID-19 prevention. California, New Jersey, Illinois, and Connecticut started restrictions early. In comparison, as of 3 May 2020, the eight states in the Central United States had not issued any residence orders nor lockdown interventions. Consistent with this, our study found that the lower the cumulative number of cases on lockdown days, the lower the extent of the subsequent epidemic size. Furthermore, the first eight states that experienced the fourth wave might have higher population density and more frequent changes in social distancing restrictions, such as frequent lockdown and reopening [28,29,30,31,32,33,34]. This may have led to the earlier decline of the previous wave and the earlier appearance of the next wave. Additionally, a low cumulative number of cases on the reopening day also corresponds to a smaller epidemic size intensity. This may also reflect the fact that states that emphasize non-pharmaceutical interventions are more effective at controlling the epidemic [35], which confirmed the view in a previous study that a hasty reopening may lead to another epidemic [10]. However, although many areas would implement restrictions and reopen according to the epidemic situation, the reduced adherence caused by pandemic fatigue may also lead to a large-scale epidemic [36].
Our study also demonstrated a strong correlation between waves. We are the first to identify the number of waves and quantify the size and duration of the waves. We report the subsequent waves were at least three times more than the first waves and each cycle of the waves is about 3 months. The duration likely reflects the time for the healthcare system to react, intervene, and gradually reduce the epidemics.
There are some limitations to our findings. First, our research only verified the pre-delta epidemic data before 31 March 2021 without considering the underestimated cases in the first waves [37] and the effect of the vaccination on the trajectory of the epidemic and multiple rounds of public health interventions. Further investigation is necessary to identify the impacts of these interventions on the course of the COVID-19 epidemic in the US. Second, states in the US may begin to witness the sixth wave of outbreaks with the emergence of another strain. The increasing waves may affect the prediction accuracy of various characteristics of the epidemic. Third, many potential confounding factors such as environmental, meteorological and intervention factors [38,39] were not included in our current study, which demands future investigations. Fourth, the vaccination efficacy, along with the population structure that may influence the vaccine effect and susceptibility [40,41], was not taken into consideration due to the limitation of data sources. The mortality rate was also affected by the complexity of its influencing factors [42,43,44] and was not considered to be an outcome indicator. Moreover, our study only considered the first restriction and first reopening. Many areas have since implemented more restrictions and reopening, which were not included in this study. The number of new cases on the days of other restrictions and reopening would likely serve as important indicators to predict the epidemic size, which could be addressed in further study.

4. Materials and Methods

4.1. Data Source

We collected publicly available data from 51 states in the United States, that reported on cases of COVID-19 (number of daily confirmed cases, deaths, and recovery cases) from 21 January 2020 to 31 March 2021 from the Coronavirus resource center of Johns Hopkins University and Medicine [3]. In accordance with the methods of another study [45], for some inconsistencies between Johns Hopkins University data and state-level reporting, we have manually supplemented and corrected this dataset and adjusted for reporting-day biases according to the NY Times website [4] to improve the accuracy of our analysis.
We collected social distancing data from the IHME COVID-19 Forecasting Team’s article [46]. We also obtained each state’s population size from the WorldPop Population Counts [47] along with the Healthcare Access and Quality (HAQ) Index, which was a summary measure of personal healthcare access and quality, from the GBD’s article [48].

4.2. Selection of Epidemic Characteristics Indicators

We defined the epidemic size for each state as the cumulative number of confirmed cases on 31 March 2021.
For the early epidemic trend of each 51 states, we used the Joinpoint software [49] to identify the trend and transition point of the epidemic during the initial phase of the epidemic based on the first 100 confirmed cases. We imposed a two-phase fit (it can be determined through the Joinpoint software automatically) [15] with the maximum of one joinpoint (corresponding to two-time intervals) and used a linear regression model for both phases. We identified: (1) the time of the transition point between the two phases; (2) the number of cases at the transition point; the growth rates of the (3) first (slow-growing) phase and (4) the second (fast-growing) phase. For the 51 states of the United States, the average number at the turning point is 12.6 (10–15.3) days (Table 1), along with the majority (49/51) of transition points occurring below 30 cases, which is consistent with our previous conclusion of 30 cases in China [15]. Therefore, in this study, we regarded 30 cases as an important threshold for the epidemic growth where the epidemic changed from a slow-growing to a fast-growing phase. We also estimated three additional predictors based on the first 100 confirmed cases, namely: (1) the days required to increase from 30 to 100 cases (time from 30 to 100); (2) the case fatality rate among the first 100 confirmed cases (CFR-100). The ‘first 100 cases’ was defined as the number of confirmed cases on the day the 100th confirmed case was reported.
We also collected various non-pharmacological intervention indicators under the epidemic situation, which were as follows: (1) the time of first restriction and first reopening for 51 US states; (2) the confirmed new cases on the day of restriction and reopening.
For the study period in each of the 51 states, we used a simple multi-logistic fitting (https://logletlab.com/, accessed on 5 April 2022) to identify the key characteristics of the COVID-19 epidemic based on the cumulative number of confirmed COVID-19 cases. We modelled the epidemic patterns by identifying 1 to 4 growth waves of the COVID-19 epidemic. We identified: (1) Km (m = 1,2,3,4) for each wave which represents the asymptotic values that bound the function and therefore specify the level at which the epidemic saturates. The sum of K represents the point at which the epidemic has finally reached saturation; (2) tm for each wave represents the midpoint of each epidemic growth and hence the peak of each outbreak. tm4-tm3, tm3-tm2, tm2-tm1 represent the time interval between the two consecutive outbreaks. The sum of tm represents the sum of the time required for each epidemic to reach its peak; (3) Δt for each phase represents the lengths of time intervals required for the epidemics to grow from 10% to 90% of the saturation level. The sum of Δt represents the sum of the interval lengths required for each epidemic to increase from 10% of saturation level to 90%. Figure S3 is a schematic graph with three main characteristics of Km, tm and Δt.

4.3. Statistical Analysis

We generated the disease mapping of COVID-19 in ArcGIS10.8 (Environmental Systems Research Institute, Redlands, CA, USA). The reported incidence in each state was joined to the shapefile of state boundary by administrative unit code. We created distribution maps for the COVID-19 on 31 March 2020, 11 December 2020 (the day when the Food and Drug Administration (FDA) of the United States issued an Emergency Use Authorization (EUA) for the first vaccine to prevent COVID-19) [50], and 31 March 2021, separately. We also performed Anselin Local Moran’s I and Getis-Ord Gi* to identify the spatial variations of the COVID-19 in the United States further. For the geospatial analysis, we normalized the epidemic size by dividing the population size of each of the states to obtain the infected rates of per 100,000 individuals.
After verifying the non-normal distribution of most variables through the Kolmogorov–Smirnov test, we used the Spearman correlation test in the OriginPro 2021b software (OriginLab Corporation, Northampton, MA, USA) to examine the correlation between epidemic size, early epidemic characteristics (time from 30 to 100, CFR in the first 100 confirmed cases, day of the phase turning point, number of cases at the turning point, slow-growing phase (case/day), fast-growing phase (case/day)), intervention (new cases on restriction, new cases on reopening) and HAQ indicators and the multi-logistic fitting characteristics of the subsequent epidemics (number of phases; K1, K2, K3, K4, Sum of K; tm1, tm2, tm3, tm4, sum of tm; tm4-tm3, tm3-tm2, tm2-tm1; Δt1, Δt2, Δt3 Δt4, Sum of Δt).
We also compared the differences among K1, K2, K3, K4; Δt1, Δt2, Δt3, Δt4 and tm4-tm3, tm3-tm2, tm2-tm1 using the Wilcoxon signed-rank test (GraphPad Prism (Version 8.3.0)).

5. Conclusions

In conclusion, we confirmed that the first 30 cases of COVID-19 might be a critical threshold for switching from a relatively slow-growing phase to a fast-growing phase in the early epidemic in the United States. Further, most states have experienced more than 1 wave of the COVID-19 epidemic, and the magnitude of the first wave tends to predict the magnitude of subsequent waves. The pre-delta epidemic size is negatively and significantly correlated with the duration from 30 to 100 cases but positively correlated with the growth rate of the fast-growing phase, and the peak cases in the subsequent 4 waves.

Supplementary Materials

The following supporting information can be downloaded at: https://0-www-mdpi-com.brum.beds.ac.uk/article/10.3390/pathogens11050576/s1, Figure S1: The changes of the geographic distribution of COVID-19 incidence in the United States from 31 March 2020 to 31 March 2021, including 11 December 2020; Figure S2: Comparison of the fitted parameters for the multi-logistic approximation of 50 US states and Washington DC; Figure S3: A schematic graph with three main indicators of Km, tm and Δt; Table S1: The Global Moran’s I of COVID-19 incidence in the United States on 31 March 2020, 31 March 2021 and 11 December 2020; Table S2: Spearman correlation between multi-logistic parameters and indicators in the early stage of the epidemic and non-pharmacological intervention indicators.

Author Contributions

H.L., Y.T., M.S., and L.Z. (Lei Zhang) conceived and designed the study. H.L., R.L., M.Z., and L.Z. (Leilei Zhang) collected the data. H.L. and Y.T. analyzed the data, and carried out the analysis. Y.T. wrote the first draft of the manuscript. M.S., L.Z. (Lei Zhang), and H.L. critically read and revised the manuscript. All authors have read and agreed to the published version of the manuscript.

Funding

The research is supported by the Bill and Melinda Gates Foundation (grant number: INV-006104). LZ was supported by the National Natural Science Foundation of China (Grant number: 81950410639); Outstanding Young Scholars Funding (Grant number: 3111500001); Xi’an Jiaotong University Basic Research and Profession Grant (Grant number: xtr022019003 and xzy032020032) and Xi’an Jiaotong University Young Talent Support Grant (Grant number: YX6J004). MS was supported by the National Natural Science Foundation of China (Grant number: 12171387), China Postdoctoral Science Foundation (Grant number: 2018M631134, 2020T130095ZX); Young Talent Support Program of Shaanxi University Association for Science and Technology (Grant number: 20210307).

Institutional Review Board Statement

Not applicable.

Informed Consent Statement

Not applicable.

Data Availability Statement

The data that support the findings of this study are available from the open data platform of the Coronavirus Resource Center of Johns Hopkins University and Medicine [3], IHME COVID-19 Forecasting Team’s article [46] and WorldPop Population [47].

Conflicts of Interest

All authors declare that they have no known competing financial interests or personal relationships that could have appeared to influence the work reported in this paper. The funding agencies were not involved in the design and conduct of the study; collection, management, analysis, and interpretation of the data; preparation, review, or approval of the manuscript; or decision to submit the manuscript for publication.

References

  1. Cucinotta, D.; Vanelli, M. WHO Declares COVID-19 a Pandemic. Acta Biomed. 2020, 91, 157–160. [Google Scholar] [CrossRef] [PubMed]
  2. To, K.K.; Sridhar, S.; Chiu, K.H.; Hung, D.L.; Li, X.; Hung, I.F.; Tam, A.R.; Chung, T.W.; Chan, J.F.; Zhang, A.J.; et al. Lessons learned 1 year after SARS-CoV-2 emergence leading to COVID-19 pandemic. Emerg. Microbes Infect. 2021, 10, 507–535. [Google Scholar] [CrossRef] [PubMed]
  3. Coronavirus Resource Center of Johns Hopkins University & Medicine. Available online: https://0-coronavirus-jhu-edu.brum.beds.ac.uk/ (accessed on 31 March 2021).
  4. Coronavirus in the U.S.: Latest Map and Case Count. Available online: https://www.nytimes.com/interactive/2021/us/covid-cases.html (accessed on 5 April 2021).
  5. Holshue, M.L.; DeBolt, C.; Lindquist, S.; Lofy, K.H.; Wiesman, J.; Bruce, H.; Spitters, C.; Ericson, K.; Wilkerson, S.; Tural, A.; et al. First Case of 2019 Novel Coronavirus in the United States. N. Engl. J. Med. 2020, 382, 929–936. [Google Scholar] [CrossRef] [PubMed]
  6. US Coronavirus Vaccine Tracker. Available online: https://usafacts.org/visualizations/covid-vaccine-tracker-states/ (accessed on 16 May 2021).
  7. Viral Variant Proportions in the United States. Available online: https://covid.cdc.gov/covid-data-tracker/#variant-proportions (accessed on 8 May 2021).
  8. What Doctors Wish Patients Knew about the Dangerous Delta Variant. Available online: https://www.ama-assn.org/delivering-care/public-health/what-doctors-wish-patients-knew-about-dangerous-delta-variant (accessed on 30 May 2021).
  9. Friston, K.J.; Parr, T.; Zeidman, P.; Razi, A.; Flandin, G.; Daunizeau, J.; Hulme, O.J.; Billig, A.J.; Litvak, V.; Price, C.J.; et al. Second waves, social distancing, and the spread of COVID-19 across the USA. Wellcome Open Res. 2020, 5, 103. [Google Scholar] [CrossRef]
  10. Jalali, A.M.; Peterson, B.M.; Galbadage, T. Early COVID-19 Interventions Failed to Replicate 1918 St. Louis vs. Philadelphia Outcomes in the United States. Front. Public Health 2020, 8, 579559. [Google Scholar] [CrossRef]
  11. Kaxiras, E.; Neofotistos, G. Multiple Epidemic Wave Model of the COVID-19 Pandemic: Modeling Study. J. Med. Internet Res. 2020, 22, e20912. [Google Scholar] [CrossRef]
  12. Hazem, Y.; Natarajan, S.; Berikaa, E.R. Hasty Reduction of COVID-19 Lockdown Measures Leads to the Second Wave of Infection. medRxiv, 2020; preprint. [Google Scholar] [CrossRef]
  13. Ridenhour, B.; Kowalik, J.M.; Shay, D.K. Unraveling R0: Considerations for public health applications. Am. J. Public Health 2014, 104, e32–e41. [Google Scholar] [CrossRef]
  14. Holme, P.; Masuda, N. The Basic Reproduction Number as a Predictor for Epidemic Outbreaks in Temporal Networks. PLoS ONE 2015, 10, e0120567. [Google Scholar] [CrossRef]
  15. Zhang, L.; Tao, Y.; Wang, J.; Ong, J.J.; Tang, W.; Zou, M.; Bai, L.; Ding, M.; Shen, M.; Zhuang, G.; et al. Early characteristics of the COVID-19 outbreak predict the subsequent epidemic scope. Int. J. Infect. Dis. 2020, 97, 219–224. [Google Scholar] [CrossRef]
  16. Saqib, M. Forecasting COVID-19 outbreak progression using hybrid polynomial-Bayesian ridge regression model. Appl. Intell. 2021, 51, 2703–2713. [Google Scholar] [CrossRef] [PubMed]
  17. Wang, P.; Zheng, X.; Li, J.; Zhu, B. Prediction of epidemic trends in COVID-19 with logistic model and machine learning technics. Chaos Solitons Fractals 2020, 139, 110058. [Google Scholar] [CrossRef] [PubMed]
  18. Gupta, K.D.; Dwivedi, R.; Sharma, D.K. Prediction of Covid-19 trends in Europe using generalized regression neural network optimized by flower pollination algorithm. J. Interdiscip. Math. 2020, 24, 33–51. [Google Scholar] [CrossRef]
  19. Singh, R.K.; Rani, M.; Bhagavathula, A.S.; Sah, R.; Rodriguez-Morales, A.J.; Kalita, H.; Nanda, C.; Sharma, S.; Sharma, Y.D.; Rabaan, A.A.; et al. Prediction of the COVID-19 Pandemic for the Top 15 Affected Countries: Advanced Autoregressive Integrated Moving Average (ARIMA) Model. JMIR Public Health Surveill. 2020, 6, e19115. [Google Scholar] [CrossRef]
  20. Bai, L.; Lu, H.; Hu, H.; Smith, M.K.; Harripersaud, K.; Lipkova, V.; Wen, Y.; Guo, X.; Peng, W.; Liu, C.; et al. Evaluation of work resumption strategies after COVID-19 reopening in the Chinese city of Shenzhen: A mathematical modeling study. Public Health 2021, 193, 17–22. [Google Scholar] [CrossRef]
  21. Shen, M.; Peng, Z.; Guo, Y.; Rong, L.; Li, Y.; Xiao, Y.; Zhuang, G.; Zhang, L. Assessing the effects of metropolitan-wide quarantine on the spread of COVID-19 in public space and households. Int. J. Infect. Dis. 2020, 96, 503–505. [Google Scholar] [CrossRef]
  22. Shen, M.; Xiao, Y.; Zhuang, G.; Li, Y.; Zhang, L. Mass testing-An underexplored strategy for COVID-19 control. Innovation 2021, 2, 100114. [Google Scholar] [CrossRef]
  23. Shen, M.; Zu, J.; Fairley, C.K.; Pagan, J.A.; An, L.; Du, Z.; Guo, Y.; Rong, L.; Xiao, Y.; Zhuang, G.; et al. Projected COVID-19 epidemic in the United States in the context of the effectiveness of a potential vaccine and implications for social distancing and face mask use. Vaccine 2021, 39, 2295–2302. [Google Scholar] [CrossRef]
  24. Shen, M.; Zu, J.; Fairley, C.K.; Pagán, J.A.; Ferket, B.; Liu, B.; Yi, S.S.; Chambers, E.; Li, G.; Guo, Y.; et al. Effects of New York’s Executive Order on Face Mask Use on COVID-19 Infections and Mortality: A Modeling Study. J. Urban Health 2021, 98, 197–204. [Google Scholar] [CrossRef]
  25. Zhang, L.; Shen, M.; Ma, X.; Su, S.; Gong, W.; Wang, J.; Tao, Y.; Zou, Z.; Zhao, R.; Lau, J.T.F.; et al. What Is Required to Prevent a Second Major Outbreak of SARS-CoV-2 upon Lifting Quarantine in Wuhan City, China. Innovation 2020, 1, 100006. [Google Scholar] [CrossRef]
  26. Zhang, L.; Tao, Y.; Shen, M.; Fairley, C.K.; Guo, Y. Can self-imposed prevention measures mitigate the COVID-19 epidemic? PLoS Med. 2020, 17, e1003240. [Google Scholar] [CrossRef] [PubMed]
  27. Wang, Y.; Liu, Y.; Struthers, J.; Lian, M. Spatiotemporal Characteristics of the COVID-19 Epidemic in the United States. Clin. Infect. Dis. 2021, 72, 643–651. [Google Scholar] [CrossRef] [PubMed]
  28. Courtemanche, C.; Garuccio, J.; Le, A.; Pinkston, J.; Yelowitz, A. Strong Social Distancing Measures In The United States Reduced The COVID-19 Growth Rate. Health Aff. 2020, 39, 1237–1246. [Google Scholar] [CrossRef] [PubMed]
  29. Goldstein, N.D.; Suder, J.S. Application of state law in the public health emergency response to COVID-19: An example from Delaware in the United States. J. Public Health Policy 2020, 42, 167–175. [Google Scholar] [CrossRef]
  30. Gu, T.; Mack, J.A.; Salvatore, M.; Sankar, S.P.; Valley, T.S.; Singh, K.; Nallamothu, B.K.; Kheterpal, S.; Lisabeth, L.; Fritsche, L.G.; et al. COVID-19 outcomes, risk factors and associations by race: A comprehensive analysis using electronic health records data in Michigan Medicine. MedRxiv, 2020; preprint. [Google Scholar] [CrossRef]
  31. Lyu, W.; Wehby, G.L. Comparison of Estimated Rates of Coronavirus Disease 2019 (COVID-19) in Border Counties in Iowa Without a Stay-at-Home Order and Border Counties in Illinois With a Stay-at-Home Order. JAMA Netw. Open 2020, 3, e2011102. [Google Scholar] [CrossRef]
  32. Ramírez, I.J.; Lee, J. COVID-19 Emergence and Social and Health Determinants in Colorado: A Rapid Spatial Analysis. Int. J. Environ. Res. Public Health 2020, 17, 3856. [Google Scholar] [CrossRef]
  33. Smith, T.P.; Flaxman, S.; Gallinat, A.S.; Kinosian, S.P.; Stemkovski, M.; Unwin, H.J.T.; Watson, O.J.; Whittaker, C.; Cattarino, L.; Dorigatti, I.; et al. Temperature and population density influence SARS-CoV-2 transmission in the absence of nonpharmaceutical interventions. Proc. Natl. Acad. Sci. USA 2021, 118, e2019284118. [Google Scholar] [CrossRef]
  34. Zhang, C.H.; Schwartz, G.G. Spatial Disparities in Coronavirus Incidence and Mortality in the United States: An Ecological Analysis as of May 2020. J. Rural. Health 2020, 36, 433–445. [Google Scholar] [CrossRef]
  35. Patel, U.; Malik, P.; Mehta, D.; Shah, D.; Kelkar, R.; Pinto, C.; Suprun, M.; Dhamoon, M.; Hennig, N.; Sacks, H. Early epidemiological indicators, outcomes, and interventions of COVID-19 pandemic: A systematic review. J. Glob. Health 2020, 10, 020506. [Google Scholar] [CrossRef]
  36. Reicher, S.; Drury, J. Pandemic fatigue? How adherence to covid-19 regulations has been misrepresented and why it matters. BMJ 2021, 372, n137. [Google Scholar] [CrossRef] [PubMed]
  37. Lau, H.; Khosrawipour, T.; Kocbach, P.; Ichii, H.; Bania, J.; Khosrawipour, V. Evaluating the massive underreporting and undertesting of COVID-19 cases in multiple global epicenters. Pulmonology 2021, 27, 110–115. [Google Scholar] [CrossRef] [PubMed]
  38. Ma, Y.; Pei, S.; Shaman, J.; Dubrow, R.; Chen, K. Role of meteorological factors in the transmission of SARS-CoV-2 in the United States. Nat. Commun. 2021, 12, 3602. [Google Scholar] [CrossRef] [PubMed]
  39. Fontal, A.; Bouma, M.J.; San-José, A.; López, L.; Pascual, M.; Rodó, X. Climatic signatures in the different COVID-19 pandemic waves across both hemispheres. Nat. Comput. Sci. 2021, 1, 655–665. [Google Scholar] [CrossRef]
  40. Soiza, R.L.; Scicluna, C.; Thomson, E.C. Efficacy and safety of COVID-19 vaccines in older people. Age Ageing 2021, 50, 279–283. [Google Scholar] [CrossRef]
  41. Brodin, P. Immune determinants of COVID-19 disease presentation and severity. Nat. Med. 2021, 27, 28–33. [Google Scholar] [CrossRef]
  42. Wiersinga, W.J.; Rhodes, A.; Cheng, A.C.; Peacock, S.J.; Prescott, H.C. Pathophysiology, Transmission, Diagnosis, and Treatment of Coronavirus Disease 2019 (COVID-19): A Review. JAMA 2020, 324, 782–793. [Google Scholar] [CrossRef]
  43. Levin, A.T.; Hanage, W.P.; Owusu-Boaitey, N.; Cochran, K.B.; Walsh, S.P.; Meyerowitz-Katz, G. Assessing the age specificity of infection fatality rates for COVID-19: Systematic review, meta-analysis, and public policy implications. Eur. J. Epidemiol. 2020, 35, 1123–1138. [Google Scholar] [CrossRef]
  44. Wang, W.; Shen, M.; Tao, Y.; Fairley, C.K.; Zhong, Q.; Li, Z.; Chen, H.; Ong, J.J.; Zhang, D.; Zhang, K.; et al. Elevated glucose level leads to rapid COVID-19 progression and high fatality. BMC Pulm. Med. 2021, 21, 64. [Google Scholar] [CrossRef]
  45. Team, I.C.-F. Modeling COVID-19 scenarios for the United States. Nat. Med. 2020, 27, 94–105. [Google Scholar] [CrossRef]
  46. IHME’s COVID-19 Projections. Available online: https://covid19.healthdata.org/ (accessed on 4 April 2021).
  47. WorldPop Population Counts. Available online: https://www.worldpop.org/project/list/ (accessed on 10 March 2021).
  48. Measuring performance on the Healthcare Access and Quality Index for 195 countries and territories and selected subnational locations: A systematic analysis from the Global Burden of Disease Study 2016. Lancet 2018, 391, 2236–2271. [CrossRef]
  49. Joinpoint Software. Available online: https://surveillance.cancer.gov/joinpoint/ (accessed on 17 June 2020).
  50. COVID-19 Vaccines. Available online: https://www.fda.gov/emergency-preparedness-and-response/coronavirus-disease-2019-covid-19/covid-19-vaccines (accessed on 19 March 2021).
Figure 1. Joinpoint two-phase fitting for 51 U.S. states, showing the transition point below a threshold of 30 cases. Most of the states transited from the slow-growing phase to the fast-growing phase at a level below 30 cases.
Pathogens 11 00576 g001
Figure 2. Multi-logistic fitting with multi growth phases by US state. Inset maps display the reported incidence on 31 March 2020 and 31 March 2021. Multi-logistic fittings for the dynamics of the newly reported incidence are presented for each state as separate panels with the blue line, green line, red line and light blue line representing the development process of the first wave, second wave, third wave and fourth wave estimated by fitting, respectively. The types of line colors correspond to the number of waves obtained by fitting. The total number of waves at 1, 2, 3 and 4 were also displayed as the colors of the borders of panels with blue, green, red and bright blue, respectively.
Pathogens 11 00576 g002
Figure 3. Spearman correlation between epidemic size, multi-logistic parameters, characteristics in the early stage of the epidemic and non-pharmacological intervention characteristics. The size of each circle represents the absolute value of the correlation coefficient. The color of each circle represents the sign of the correlation coefficient and the magnitude of its absolute value. The asterisks in circles indicate that the p-value of the hypothesis test for the correlation coefficient is less than 0.05. HAQ: healthcare and access quality index.
Pathogens 11 00576 g003
Table 1. Key early characteristics in the early-stage of the epidemic and the subsequent size and severity of the epidemic.
StateNumber of Confirmed Cases at the Date the 100th Cases were ReportedNumber of Deaths at the Date the 100th Cases were ReportedNumber of Days from 30 to 100Case Fatality Rate in the First 100 Confirmed CasesDay of the Phase Turning PointNumber of Cases at Turning PointSlow Growing Phase (Cases/Day)Fast Growing Phase (Cases/Day)
Alabama106040.0%39.732.6016.16
Alaska102262.0%85.800.838.48
Arizona104131.0%512.600.0417.49
Arkansas100030.0%828.213.9132.41
California100070.0%3712.690.3113.04
Colorado103141.0%512.382.0317.03
Connecticut159241.3%910.481.3826.50
Delaware104060.0%710.361.6810.11
District of Columbia116271.7%924.282.4519.18
Florida109443.7%911.491.2916.02
Georgia118160.8%911.791.4419.87
Hawaii106070.0%126.710.5811.25
Idaho123060.0%814.071.9217.73
Illinois104050.0%473.740.0616.14
Indiana128453.1%1221.762.0322.60
Iowa105060.0%1027.652.5814.21
Kansas102262.0%95.250.6610.37
Kentucky103352.9%1426.042.0926.44
Louisiana103231.9%32.170.7022.66
Maine107070.0%37.933.5811.10
Maryland108150.9%916.321.8516.19
Massachusetts110040.0%361.410.0220.75
Michigan334360.9%745.557.8190.68
Minnesota115060.0%87.201.0414.27
Mississippi140140.7%721.093.6334.25
Missouri130342.3%116.560.6825.23
Montana121160.8%1114.941.5313.78
Nebraska1020130.0%1216.231.546.81
Nevada165150.6%1012.341.3414.71
New Hampshire101161.0%147.020.488.96
New Jersey176241.1%921.222.6846.30
New Mexico100060.0%1137.953.6221.07
New York106030.0%413.334.3829.65
North Carolina104050.0%105.140.5311.31
North Dakota109291.8%61.060.026.50
Ohio120050.0%48.622.0615.74
Oklahoma106362.8%104.780.4910.92
Oregon114392.6%1211.161.008.48
Pennsylvania101050.0%717.832.8916.65
Rhode Island106060.0%134.960.337.26
South Carolina126150.8%1023.822.5919.86
South Dakota100171.0%1214.770.729.47
Tennessee155060.0%75.180.8111.24
Texas106180.9%261.990.0611.27
Utah112050.0%87.161.0314.20
Vermont123856.5%1313.521.2220.61
Virginia115281.7%47.251.9810.57
Washington110958.2%401.180.0115.80
West Virginia113050.0%816.712.4719.43
Wisconsin106040.0%371.270.0114.65
Wyoming121080.0%1222.142.0910.84
Total/Mean (95%CI)118.8
(108.9–128.7)
1.3
(0.8–1.8)
5.6
(5.1–6.1)
1.1%
(0.6–1.6%)
13
(9.8–16.1)
12.6
(10–15.3)
1.6
(1.2–2)
18.2
(14.5–21.8)
Table 2. The fitted parameters for the multi-logistic fitting for the dynamics of the cumulative incidence in each state of US.
StatePhase *K1 1Δt1 2tm1 3K2Δt2tm2K3Δt3tm3K4Δt4tm4K
Alabama2158,058113.0139.0356,678105287------514,736
Alaska2486874.8122.055,034113265------59,902
Arizona2219,76976.2166.0621,94782339------841,716
Arkansas289,317137.0151.0250,964115289------340,281
California2937,689124.0188.02,683,96767.8341------3,621,656
Colorado427,07476.958.829,84062.8142352,18885.7273402,30986.7422811,411
Connecticut246,84254.649.9263,325124296------310,167
Delaware410,15650.054.810,12278.814571,11510329495,15992.3443186,552
District of Columbia410,69467.261.3454487.5156257,7310429645,84911344986,860
Florida2676,13470.0141.01,417,834126309------2,093,968
Georgia442,44454.253.9302,13297.9156651,45792.63071,051,3521194692,047,385
Hawaii214,18982.8175.015,304119302------29,493
Idaho231,87473.2133.0147,958118266------179,832
Illinois3129,67852.8101.0122,40063.3198960,542100315---1,212,620
Indiana339,66278.659.465,41178.1163575,25992.3278---680,332
Iowa423,27360.060.052,00090150208,01570.825265,33681326348,624
Kansas316,72150.065.043,68575170241,62096.1280---302,026
Kentucky414,45364.473.358,25887.7178331,578106288381,43593.5433785,724
Louisiana343,79230.030.0114,55958.4140289,018106292---447,369
Maine34594117.086.240,12384.929635,078107422---79,795
Maryland363,75465.767.059,50778.4156279,22289.6296---402,483
Massachusetts2114,76462.191.4515,403112334------630,167
Michigan465,67465.745.066,90878.2157479,76177.1265480,31690.84091,092,659
Minnesota442,23760.981.556,83169.2172304,99050259101,13560.6326505,193
Mississippi2112,294140.0147.0194,67696.4293------306,970
Missouri316,17755.050.0102,00080165399,74897.2271---517,925
Montana1102,982126.0253.0---------102,982
Nebraska226,763106.0108.0179,197114283------205,960
Nevada279,92196.3141.0221,40394.9286------301,324
New Hampshire2623178.472.276,994110306------83,225
New Jersey2180,12064.549.2738,290131310------918,410
New Mexico222,510108.0102.0166,650101272------189,160
New York2411,49549.546.61,495,624121318------1,907,119
North Carolina2240,328146.0153.0687,653104308------927,981
North Dakota39515109.0118.088,70783.124246,69977.4421---144,921
Ohio332,25458.942.076,17450139893,32797.3281---1,001,755
Oklahoma2115,630137.0169.0325,33397.5296------440,963
Oregon227,810116.0141.0135,919112294------163,729
Pennsylvania382,24152.045.044,85650144900,730110292---1,027,827
Rhode Island217,32362.263.4118,673122295------135,996
South Carolina2156,103112.0145.0405,559105311------561,662
South Dakota2640989.658.9108,453108246------114,862
Tennessee2207,342126.0150.0577,02795.1290------784,369
Texas2786,183116.0169.02,110,206122326------2,896,389
Utah246,055104.0134.0346,926130289------392,981
Vermont2111441.633.920,062153327------21,176
Virginia361,15888.476.7106,05591.3170454,70298308---621,915
Washington317,69947.576.053,41276.8178294,323122331---365,434
West Virginia211,017101.0130.0129,068105281------140,085
Wisconsin256,786109.0142.0568,147114288------624,933
Wyoming2291556.0109.052,50093.7261------55,415
Total/Mean (95%CI)-111,060.5 (56,996.6–165,124.4)83.5 (75–92)101.5 (87.6–115.5)329,686 (178,465.5–480,906.5)96.7 (90.2–103.1)246.5 (226.9–266.1)389,757.3 (256,873.4–522,641.1)94.1 (86.6–101.6)301.1 (279.8–322.3)327,861.4 (43,631.9–612,090.8)92.1 (76.9–107.3)409.6 (364–455.3)638,557.2 (434,066.4–843,048.1)
* All the parameters were defined by the multi-logistic fitting; 1 The parameters K1, K2, K3, K4, and K represent the asymptotic values that bound the function and therefore specify the level at which the epidemic and the overall epidemic saturates; 2 The parameters tm1, tm2, tm3, and tm4 represent the midpoint of each epidemic growth and hence the peak of each outbreak; 3 The parameters Δt1, Δt2, Δt3, and Δt4 are the lengths of time intervals required for the epidemics to grow from 10% to 90% of the saturation level.
Publisher’s Note: MDPI stays neutral with regard to jurisdictional claims in published maps and institutional affiliations.

