1. Introduction
During recent decades, the number of sickle cell disease (SCD) patients has increased significantly, making it the most common genetic disorder affecting millions of people worldwide, particularly in sub-Saharan Africa [
1]. Several strategies have been applied in the treatment of this pathology, characterized by red blood cell sickling, vaso-occlusion, haemolytic anaemia, and vasculopathy leading to progressive organ damage [
2]. The cellular sickling process can be reduced by increasing the oxygen affinity of haemoglobin S (HbS). The literature has reported that increasing the concentration of oxygenated HbS, without compromising oxygen delivery, is a promising approach to prevent red blood cell sickling and, subsequently, achieve long-term disease improvement [
3].
Voxelotor (Vox), also known as GBT-440, is a small compound that binds to HbS and increases its affinity for oxygen. Vox improves the in vitro red blood cell flexibility and survival [
4]. In a rat model, Vox prevented ex vivo red cell blood sickling [
3]. The first-in-human studies in healthy volunteers and SCD patients showed that the tolerability and safety of Vox was associated with an increase in HbS oxygen affinity [
5]. OXBRYTA
®, a form of Vox, has been given accelerated approval by the U.S. Food and Drug Administration for patients aged 12 years and older [
6]. However, the oral delivery of Vox has been thwarted because of its lipophilicity (log 3.54) and poor aqueous solubility (43 µg/mL) [
5]. This aqueous solubility not only provides low oral bioavailability (36%), but also leads to considerable subject dose variability [
5]. Furthermore, the absorption of Vox from the GI tract is affected by food intake [
6]. When OXBRYTA
® was orally given to healthy human volunteers with a high-fat meal, it showed a 42- and 45-fold enhancement in AUC and C
max, respectively, compared to the fasted state [
6].
Lipid-based formulations have emerged as a promising strategy to improve the aqueous solubility and oral absorption of lipophilic drugs, and to decrease undesirable food effects [
7]. The development of self-nanoemulsifying drug delivery systems (SNEDDSs) has provided one approach that is commonly adopted in this direction. SNEDDSs are anhydrous mixtures of oils, surfactants, and cosurfactants, that spontaneously form oil-in-water nanoemulsions with droplet sizes of less than 200 nm when exposed to GI fluids [
8]. Compared to other lipid nanocarriers, SNEDDSs are easy to scale up and contain biodegradable excipients [
9,
10]. The food-associated effects of several lipophilic drugs, such as cinnarizine [
11], torcetrapib [
12], and itraconazole [
13], have been nullified when encapsulated into SNEDDSs. Many SNEDDS formulations have been developed and optimized by taking into consideration the resulting emulsion droplet sizes after aqueous dispersion, through the use of empirical “trial and error” ternary diagram approaches, which consist of varying one factor at a time [
14]. Unfortunately, such approaches are highly time consuming and require a number of experiments and resources. Furthermore, they often provide inadequate data to determine the impact of excipients on the performance of the formulation [
10,
15].
The use of the quality-by-design (Qbd) approach, applying the statistical design of experiments (DoE) for the systematic optimization of SNEDDSs has been reported to reduce expenditure in terms of time, resources, and developmental efforts. The Qbd approach provides an optimal amount of data and process understanding from a limited number of experiments [
16]. A DoE applied during the component screening can provide more insight into excipient effects and interactions in the SNEDDS performance [
17,
18]. The Qbd approach has been used in the optimization of a wide variety of lipid-based formulations, including itraconazole microemulsions [
19], rivaroxaban self-nanoemulsifying drug delivery systems [
20], doxorubicin and curcumin coloaded liposomes [
21], and rosuvastatin calcium solid lipid nanoparticles [
22].
Therefore, the present work aims to use the Qbd approach for the development and optimization of Vox-loaded SNEDDSs. An experimental mixture design and a desirability function were applied to select SNEDDSs that contain a maximum amount of lipids and a minimum amount of surfactant, and that possess optimal emulsification properties (i.e., droplet sizes, polydispersity index (PDI), emulsification time, and transmittance percentage). Further, this work endeavours to evaluate the biopharmaceutical performance of the optimized Vox-SNEDDS in terms of in vitro dissolution, lipolysis, cytotoxicity, transport studies, and in vivo pharmacokinetic studies.
2. Materials and Methods
2.1. Materials
Voxelotor with a purity greater than 98% was purchased from MedChemExpress (Monmouth, NJ, USA). Cremophor-EL® (polyoxyl-35 castor oil) was kindly provided by BASF (Ludwigshafen, Germany). Labrasol AFL® (caprylocaproyl polyoxyl-8- glycerides), Transcutol HP® (diethylene glycol monoethyl), Labrafil M® 1944 CS (oleoyl polyoxyl-6-glycerides), Labrafil M® 2125 CS (linoleoyl polyoxyl -6-glycerides), Capryol PGMC® (propylene glycol monocaprylate type I), Lauroglycol® 90 (propylene glycol monolaurate), and Maisine® 35-1 (glycerol monolinoleate) were kind gifts from Gattefossé (Saint-Priest, France). Tween® 80 (polysorbate 80), L-α-phosphatidylcholine (TLC), sodium taurodeoxycholate (NaTDC), 4-bromophenylboronic acid, porcine pancreatin extract (P7545, 8 × USP specification activity), and thiazolyl blue tetrazolium bromide (MTT) were all purchased from Sigma-Aldrich (St. Louis, MO, USA). Empty gelatine capsule shells (size “0”) were purchased from Capsugel Inc. (Morristown, NJ, USA). Formic acid, acetonitrile, methanol, and dimethylsulfoxide (DMSO) (all HPLC grade) were purchased from VWR (Copenhagen, Denmark). Purified water was used in all experiments. All other reagents were of analytical grade and used as received.
2.2. Analytical Methods
2.2.1. HPLC–UV Method
An HPLC-UV system was used to quantify voxelotor. The HPLC (Shimadzu C 204353, Kyoto, Japan) was equipped with of an LC-20A pump, an SIL-20A autosampler and SPD-20A intelligent UV/VIS detector. A CC 250-4.6 Nucleosil 100-5, C18 HD HPLC column (Macherey-Nagel, Düren, Germany) was used for chromatographic separation. The mobile phase consisted of 20%
v/
v (water + 0.1% formic acid) and 80%
v/
v (acetonitrile + 0.1% formic acid) under isocratic mode. The velocity of the flow, sample load and wavelength of the UV detector were set at 1.0 mL/min, 10 µL and 272 nm, respectively. The HPLC–UV method was validated according to the current international regulatory guidelines [
23]. In particular, the linearity, accuracy, precision, reproducibility, and repeatability of the method were assessed and are presented in
Supplementary Table S1 and Supplementary Figures S1 and S2. The limit of quantification and of detection were 0.7 µg/mL and 0.2 µg/mL, respectively. The retention time of Vox was about 4.8 ± 0.15 min.
2.2.2. LC–MS Method
Voxelotor was extracted from rat serum samples (50 µL) in the presence of F21450908, which was used as an internal standard (30 pmol), by adding acetonitrile (400 µL) and hydrochloric acid (10 µL, 2 N). After an overnight incubation (−20 °C), the samples were centrifuged, and the supernatant was transferred to an injection vial. The samples were analysed using a Waters Xevo TQ-S tandem quadrupole mass spectrometer, coupled to an Acquity UPLC class H system (Waters, Milford, MA, USA). A Kinetex LC-18 (150 × 4.6 mm, 5 µm) column (Phenomenex) and a 10-min gradient between MeOH-water (75:25, v/v) (with 0.1% acetic acid) and MeOH (with 0.1% acetic acid) were used. Ionization (positive mode) was obtained using an ESI probe. The quantification transitions for voxelotor and F21450908 were 338.1 → 200.0 and 342.1 → 222.1, respectively. The ratio between the area under the curve (AUC) of voxelotor and of the internal standard was reported using a calibration curve (obtained under identical conditions). To establish the LOD and LOQ, plasma (50 µL) was spiked with voxelotor at several levels and analysed using the same protocol. The values were 337 × 10−5 and 1126 × 10−5 µg/mL, respectively.
2.3. Optimization of the SNEDSS Formulation
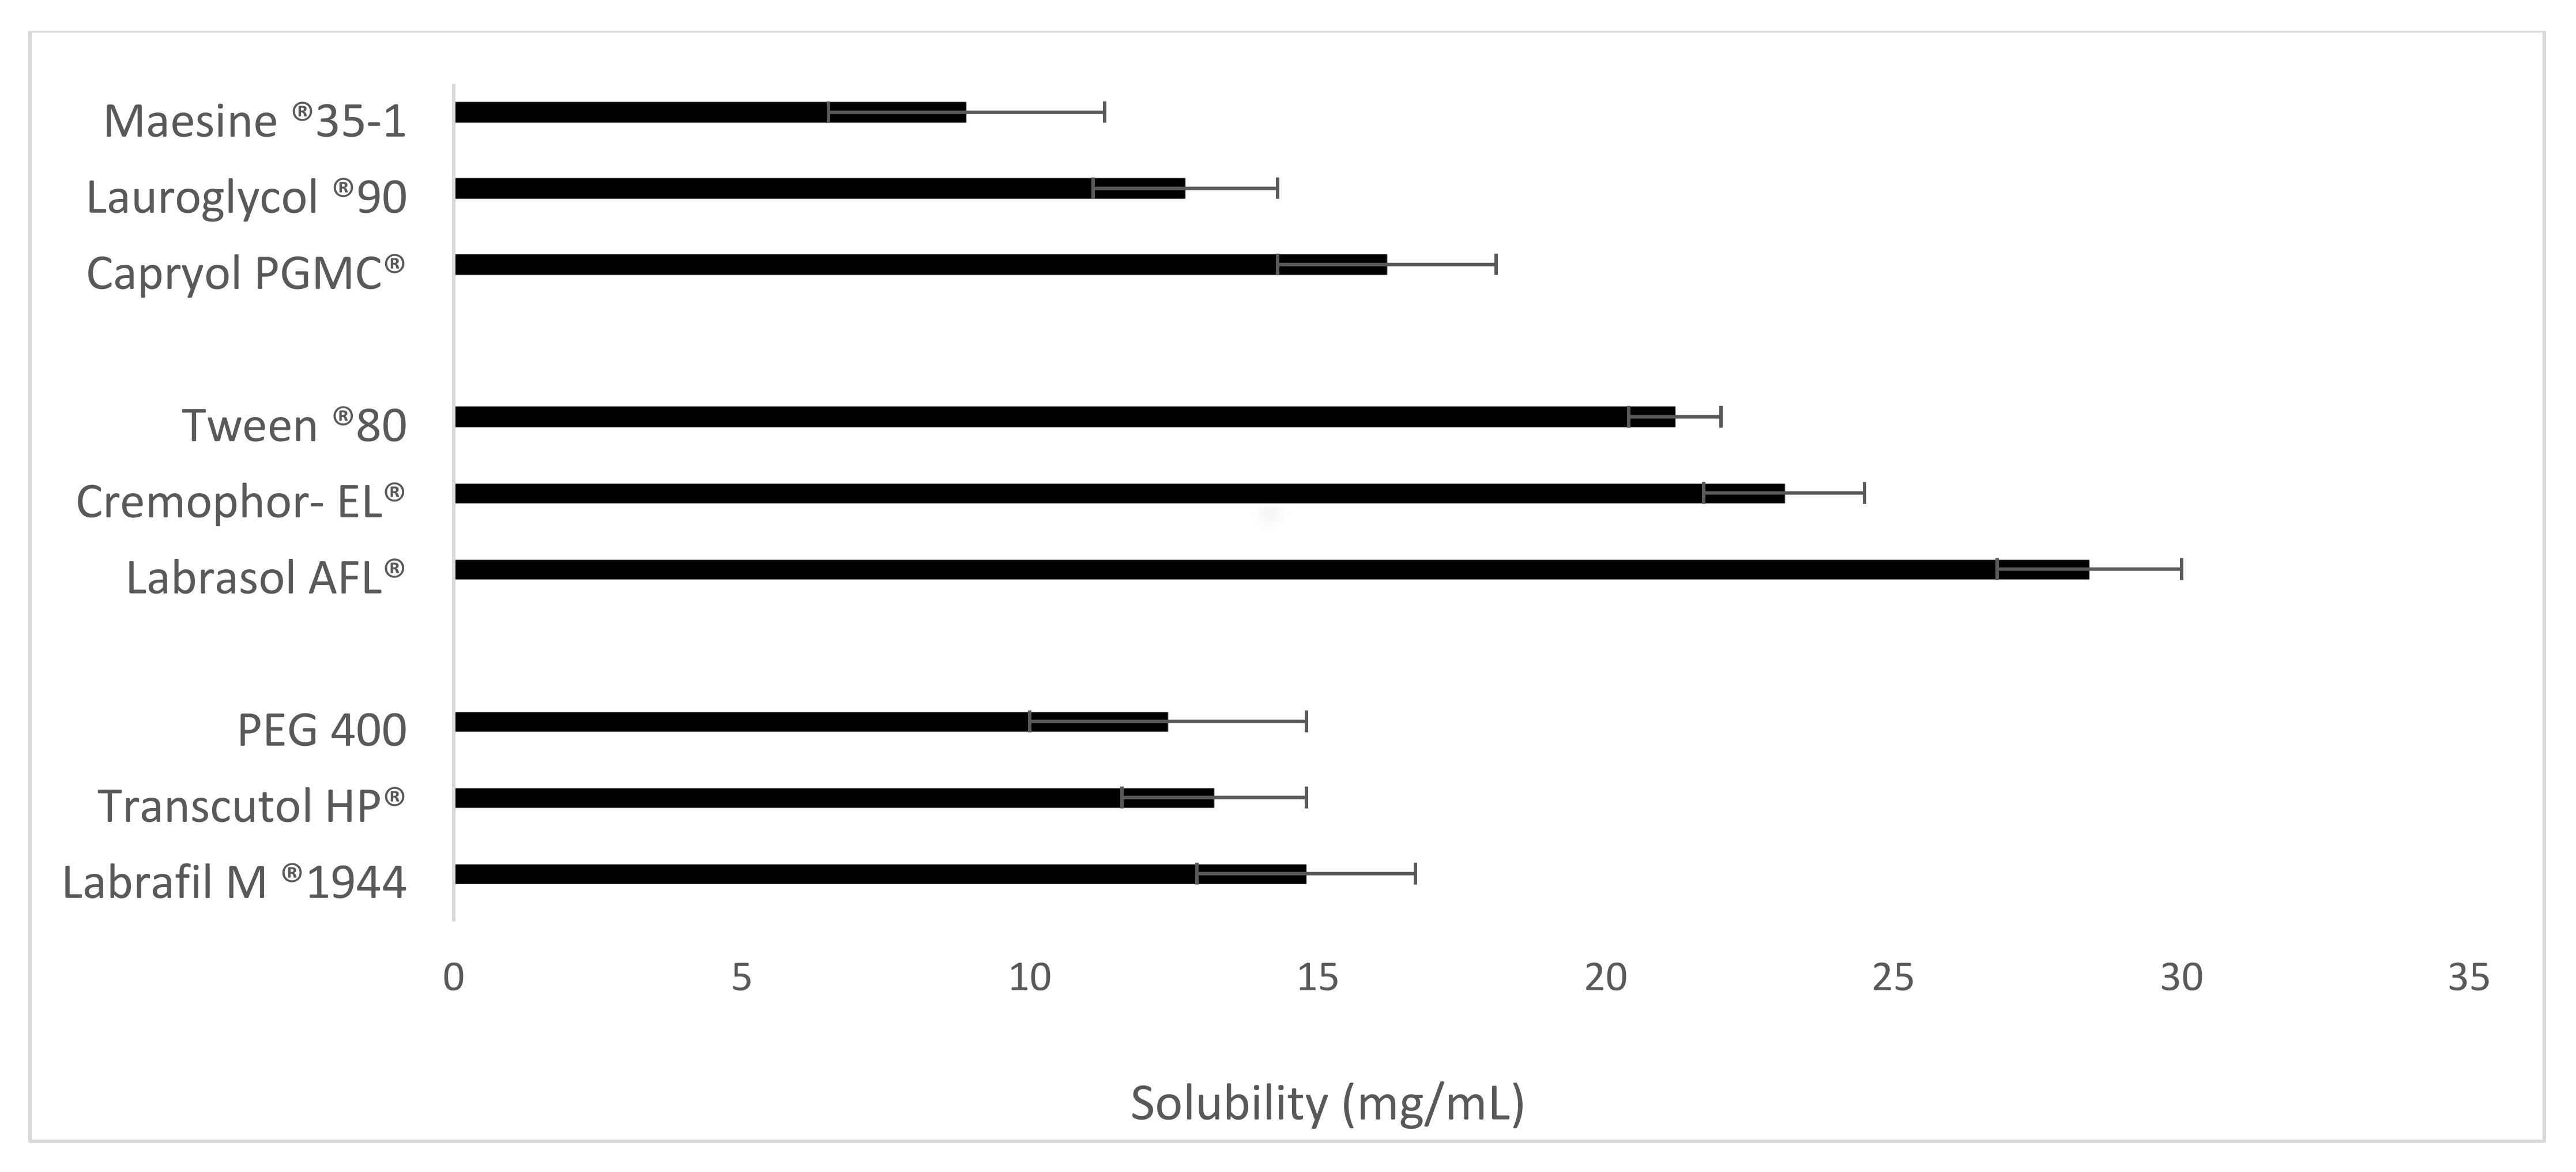
2.3.1. Equilibrium Solubility of Vox
The solubility of Vox was studied in the selected excipients (oils, surfactants and cosurfactants). An excess amount of Vox was added to 500 mg of each excipient under stirring (100 rpm, 37 °C) in a shaking incubator (Infors AG, Bottmingen, Switzerland) for 48 h. The resultant samples were centrifuged at 4000× g for 15 min (37 °C) using an Eppendorf centrifuge 5804 R (Hamburg, Germany). The supernatant was diluted with acetonitrile, and the concentration of Vox was determined by HPLC-UV.
2.3.2. Screening of Surfactants and Cosurfactants for Self-Emulsifying Ability
The self-emulsification capacity of the surfactants was studied as described by Date et al. [
24], with minor modifications. In brief, mixture of the selected oil and surfactant at a ratio 1: 1 (
w/
w) was heated (40–45 °C) under gentle stirring. The resulting mixture (500 mg) was dispersed in 10 ml of deionized water under gentle stirring. Visual observation was carried out to assess the relative turbidity. The resulting dispersions were allowed to stand for 2 h and the transmittance percentage values were determined at 550 nm using a NanoDrop
TM 2000 spectrophotometer (Thermo Fisher Scientific Inc., Waltham, MA, USA) with deionized water as a control.
To assess the emulsification ability of the cosurfactants and cosolvents, each of them was mixed with the selected surfactant at a 2:1 (w/w) ratio. The selected oil was added to this mixture at a 1:3 ratio under stirring and heat (40–45 °C). The resulting dispersions were analyzed as mentioned for the surfactant screening.
2.3.3. Development of SNEDDSs Employing “Qbd”
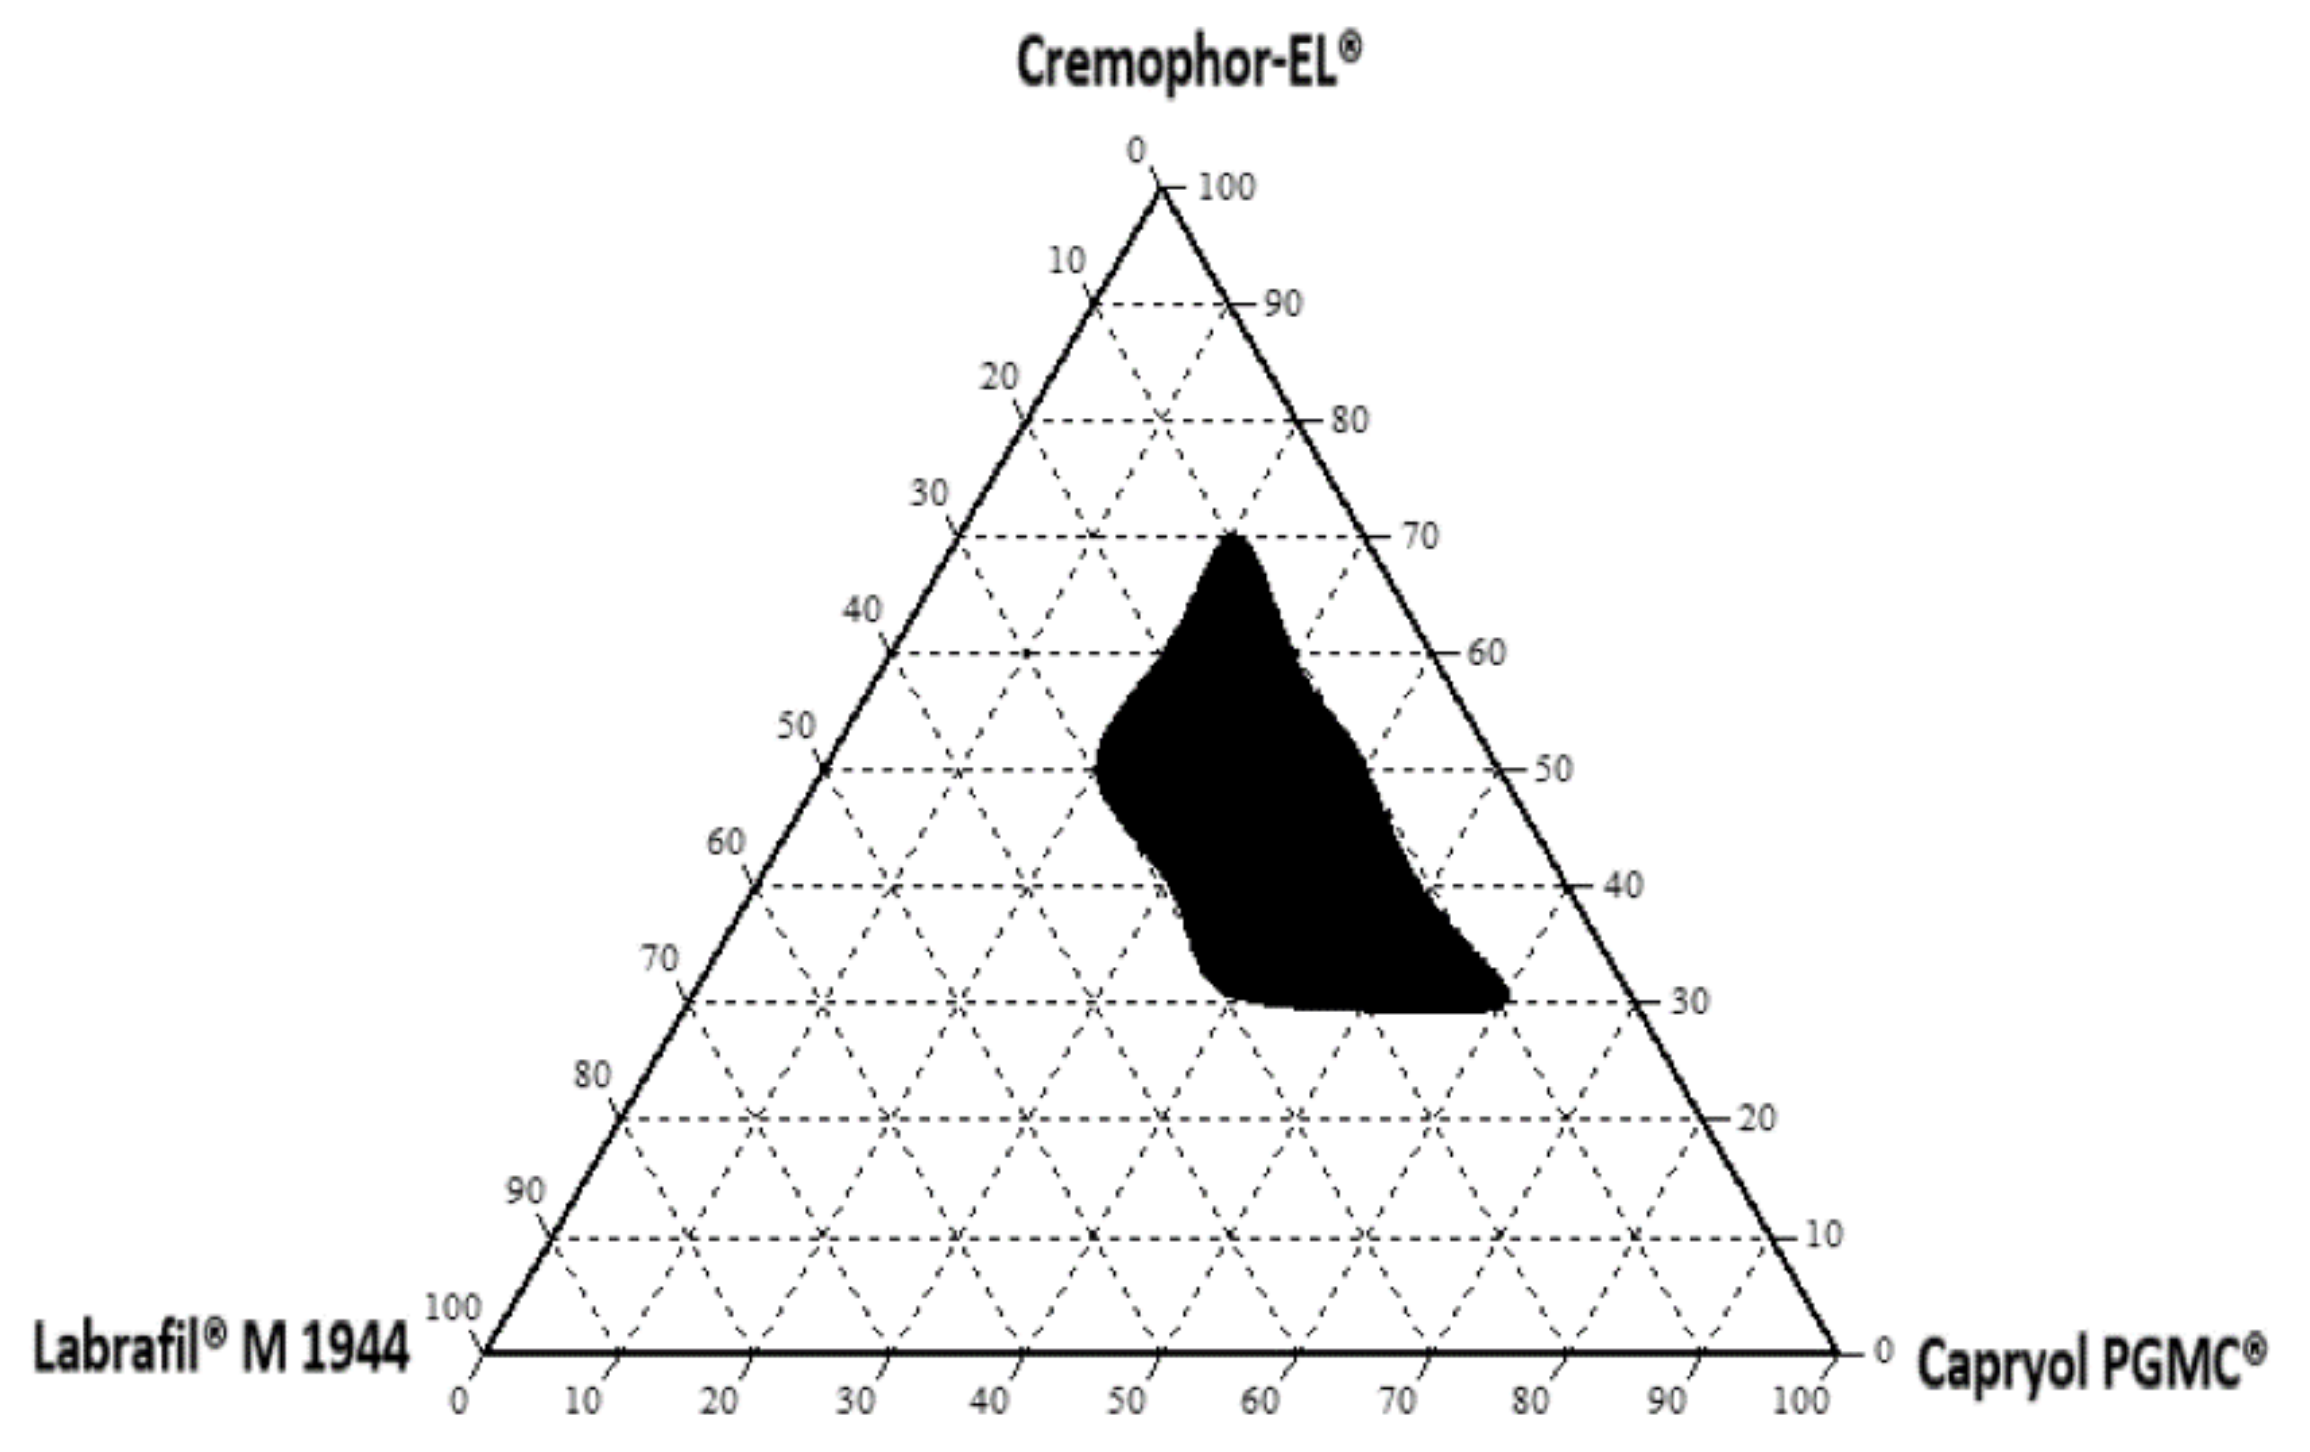
Ternary Phase Diagram
A ternary phase diagram of the oil, surfactant, and cosurfactant was plotted, with each representing an apex on the triangle. Forty ternary mixtures (with varying compositions of oil, surfactant, and cosurfactant) chosen from the solubility studies were prepared. The mixture (500 mg) was accurately weighed and dispersed in 200 mL of deionized water (37 °C) under gentle agitation (50 rpm). Visual observation was carried out immediately to investigate the occurrence of self-nanoemulsification. Dispersions with measured particle sizes of less than 200 nm were used to draw the nanoemulsion area of the diagram [
25]. Phase diagrams were constructed using Chemix School version 3.60 software (Arne Standnes, Bergen, Norway).
Preparation of SNEDDSs for the Experimental Design
The SNEDDSs were prepared by mixing (100 rpm, 20 ± 5 °C) the oil, surfactant, and cosurfactant at predetermined amounts, as per the design (
Table 1). The final mixtures were stirred for dissolution until clear preparations were obtained and were then stored (20 ± 5 °C) for further studies.
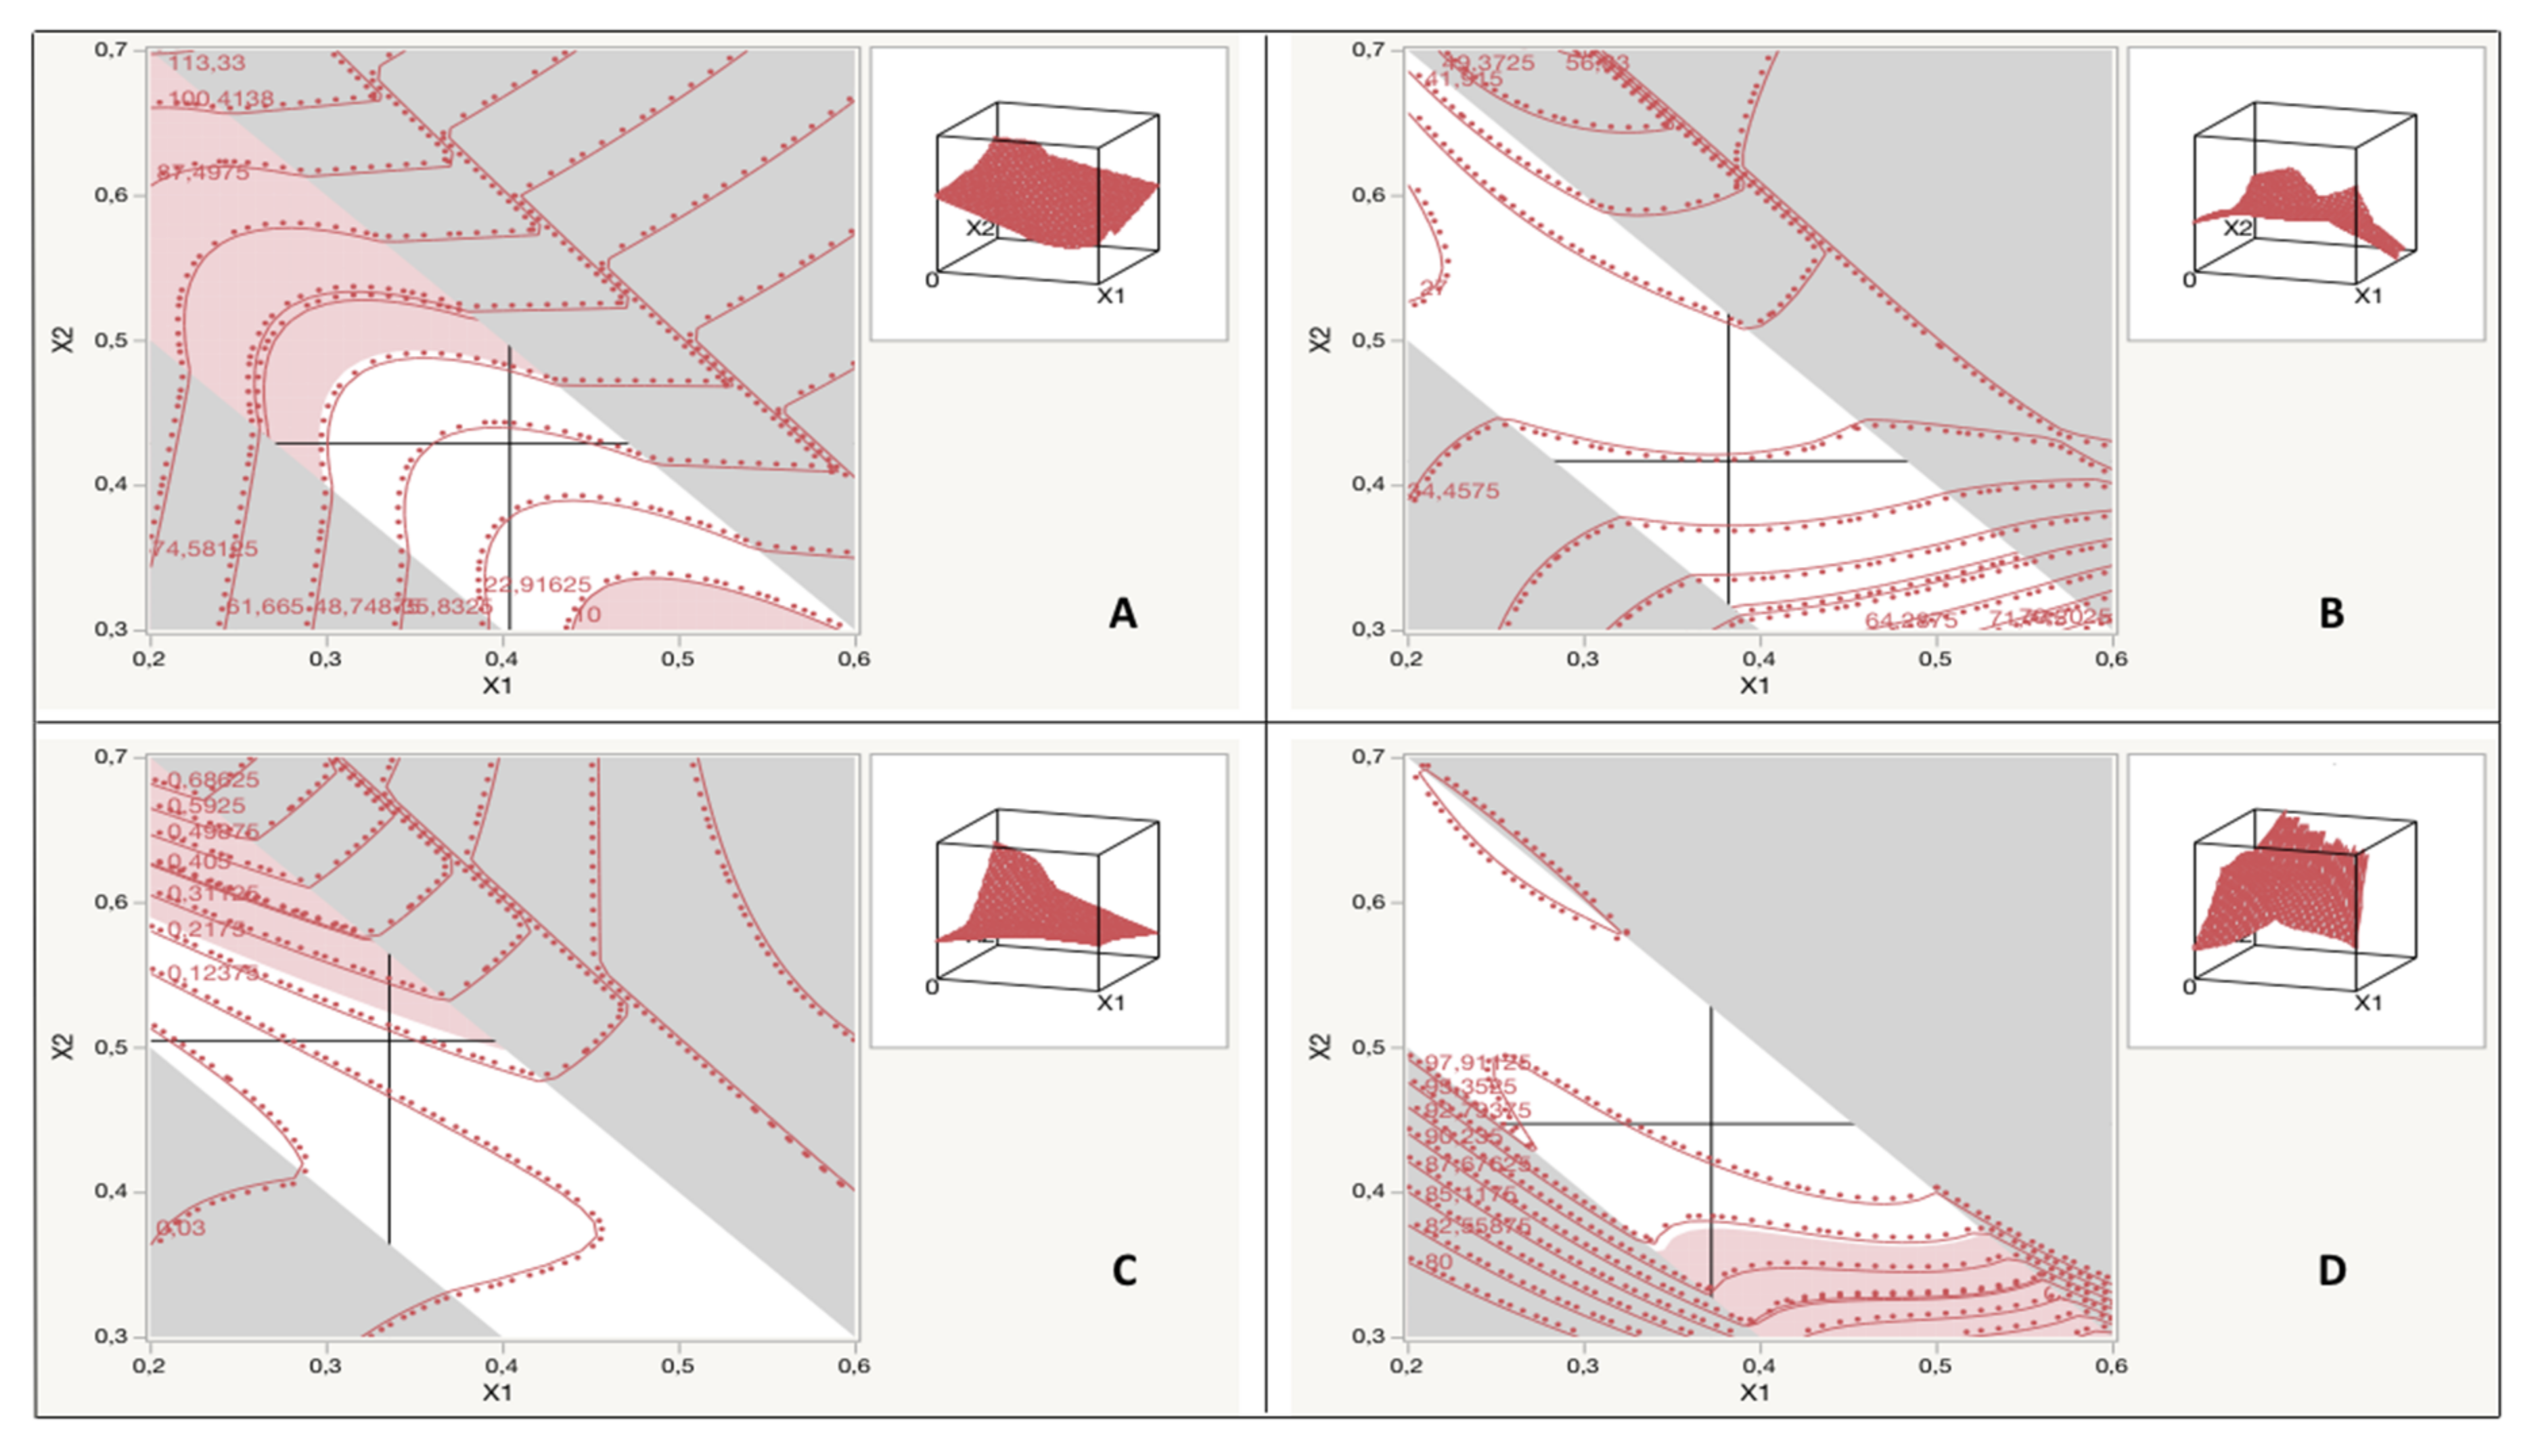
Experimental Design
A 16-run custom design, using the Bayesian D-optimality quality criterion, was generated to estimate a full cubic model for the three critical formulation variables. The design was blocked on 4 days of 4 runs each. The experimental design and statistical analysis were executed using JMP Pro
® 14.3.0 (SAS Institute, New York, NY, USA). The independent variables and their respective levels were selected based on solubility and ternary phase diagram studies. The proportions of oil (X
1, %
w/
w), surfactant (X
2, %
w/
w), and cosurfactant (X
3, %
w/
w) were considered independent variables (factors), whereas the dependent variables (responses) were emulsification time (Y
1, s), droplet size (Y
2, nm), PDI (Y
3), and transmittance percentage (Y
4, %). The amount of the components was held constant (1 g), while the ratio of the three was varied. Sixteen SNEDDS formulations were prepared and are presented in
Table 1. The data obtained from the response measurements were analysed using a mixed model, with the day as a random variable, and a fixed full model on our explanatory variables. When possible, the model was simplified, taking into account the linear constraints between the factors, to raise the model power. The correlation of factors with response variables was then fitted into different mathematical models (quadratic, cubic, or special cubic). The model quality was estimated using the R-squared, adjusted R-squared, root mean square error, and
p-value of the F-test associated with the contribution of the variables in the model (critical
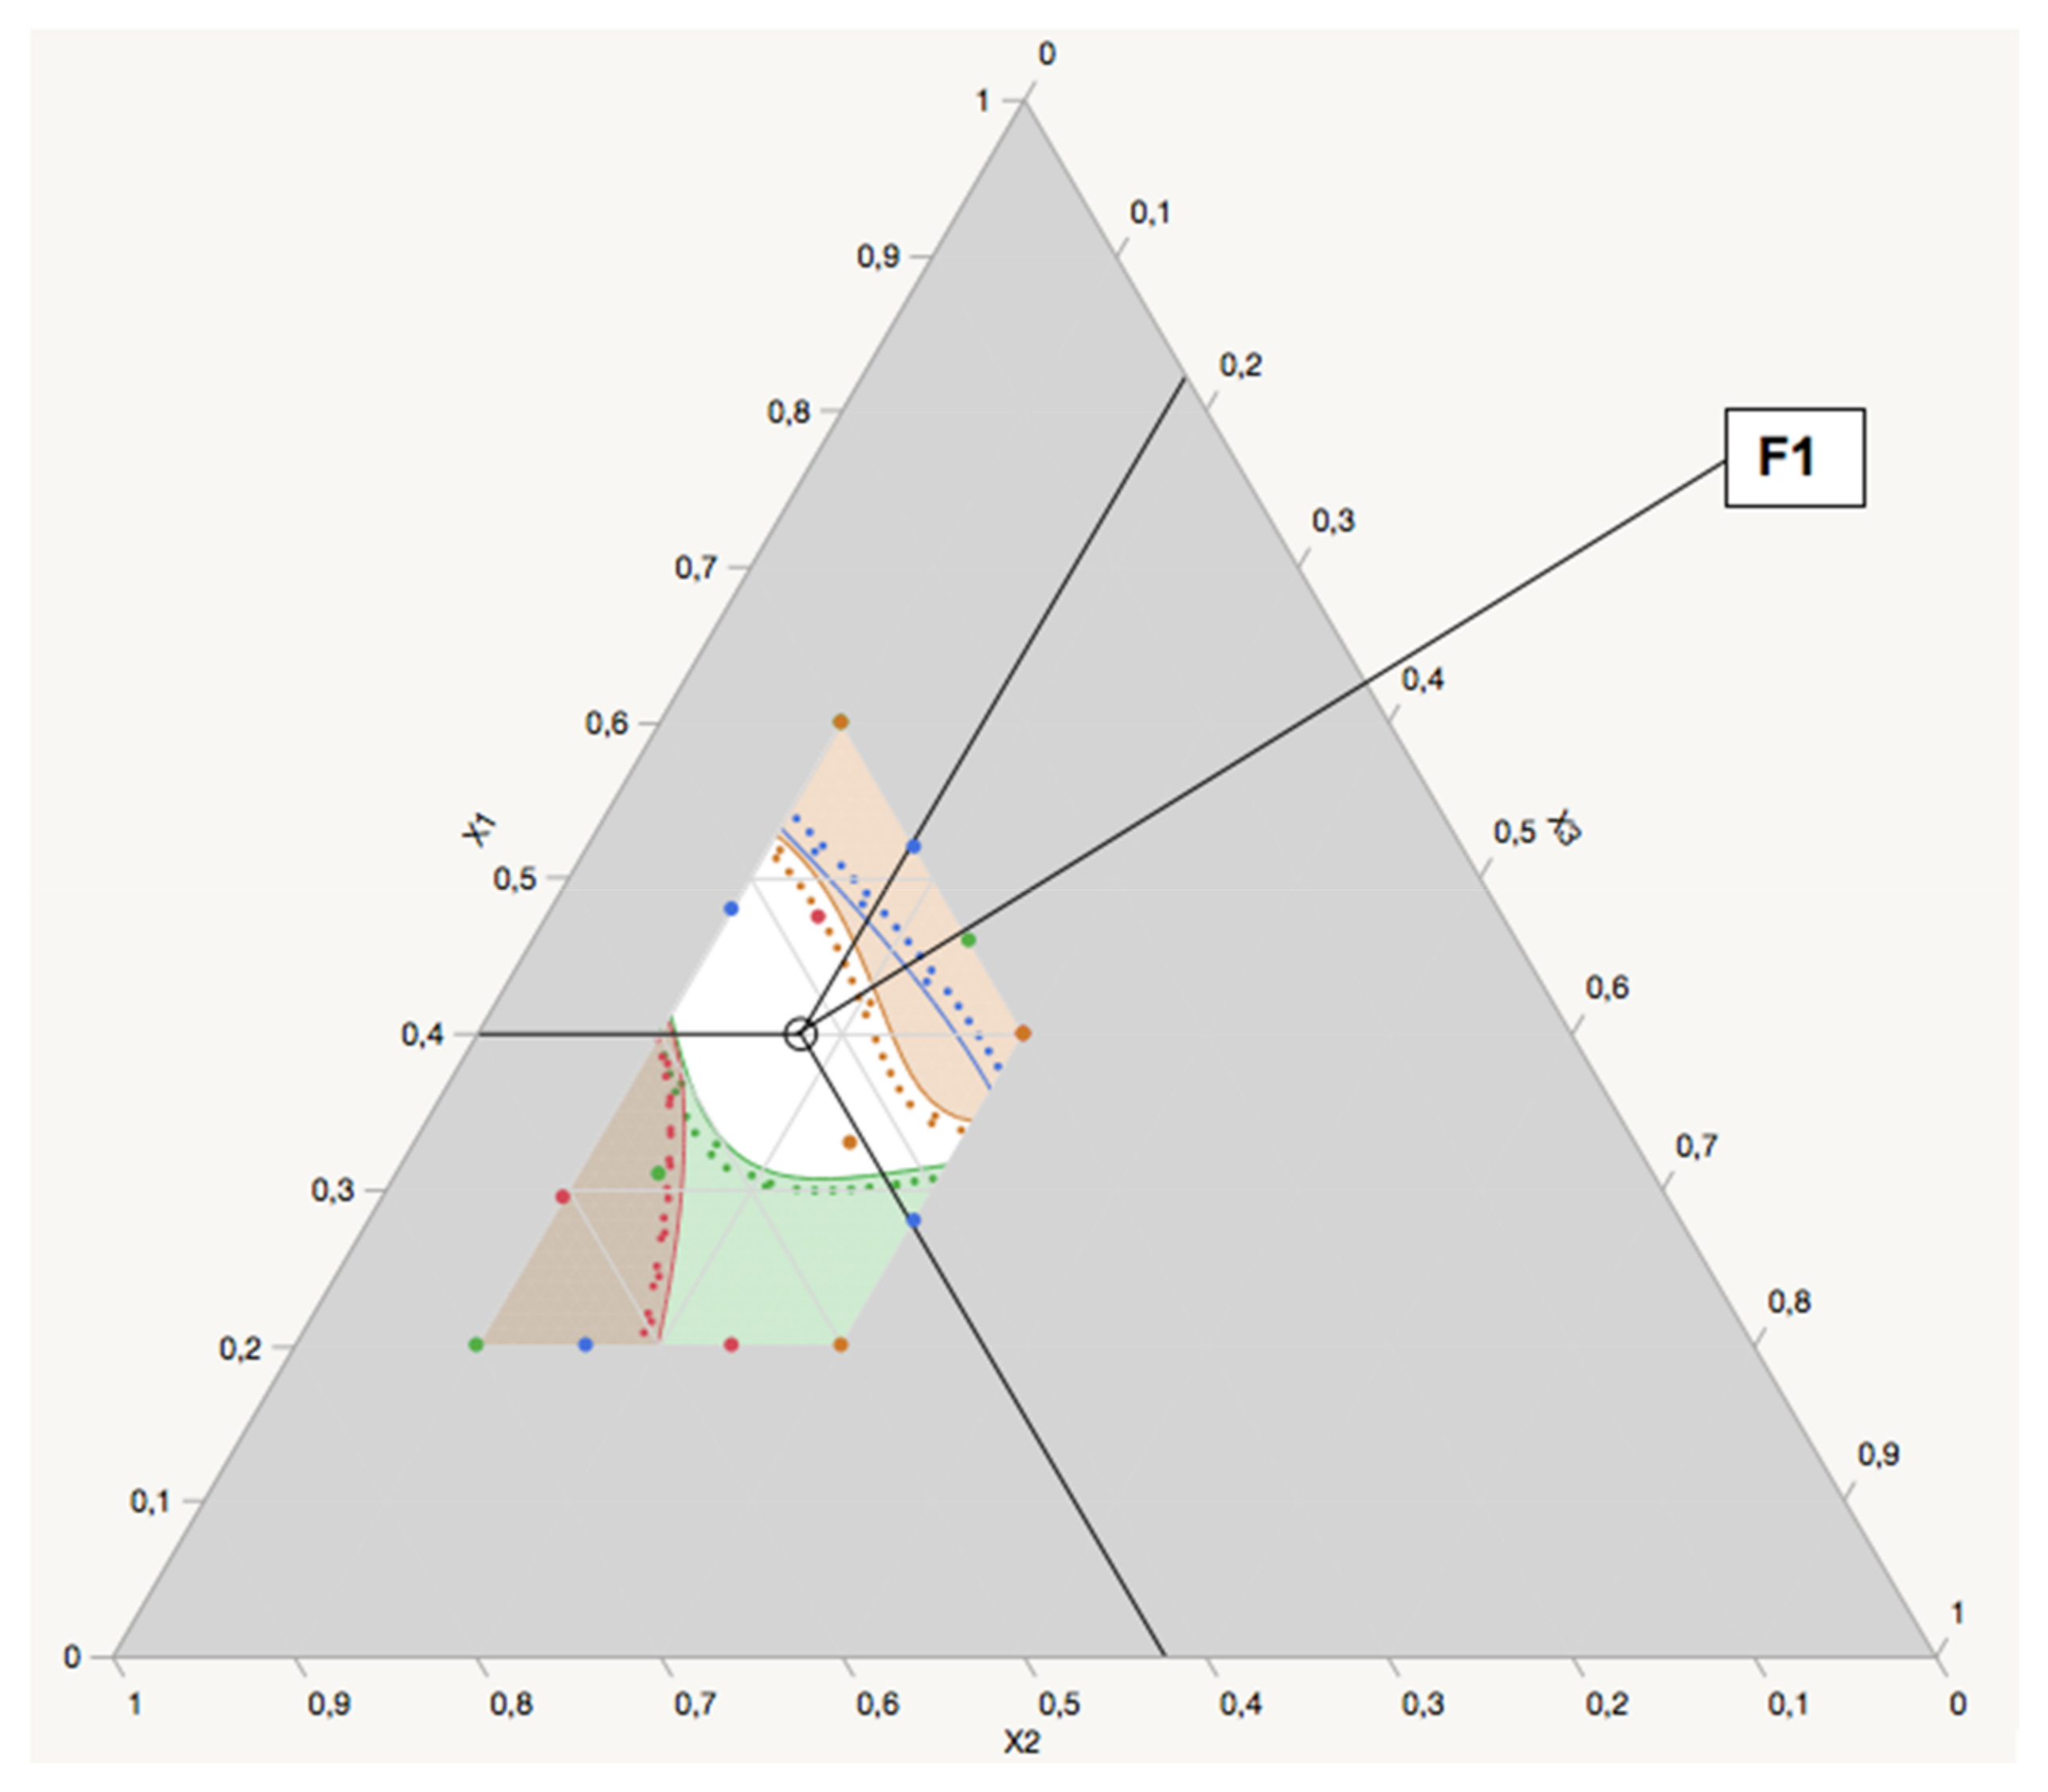
p-value = 5%). The models were reduced by removing nonsignificant higher-degree terms to make them cubic, then quadratic, and, finally, first-order. Next, a desirability function using JMP Pro
® 14.3.0 was applied to optimize factors for desirable responses.
2.3.4. Evaluation of Dependent Variables
Emulsification Time (Y1)
Each SNEDDS formulation (1 g) was dispersed in 250 mL of deionized water under gentle stirring (100 rpm, 37 ± 0.5 °C) [
14]. The emulsification time was recorded as time in seconds required to obtain a clear dispersion [
26].
Droplet Size and PDI (Y2 and Y3)
The droplet size and PDI were determined by dynamic light scattering (DLS) at 37 °C using a Nano ZS system (Malvern Instruments, Malvern, UK) with a water dispersant refractive index of 1.330. One gramm of the formulations were dispersed in 250 mL [
14] of filtered deionized water and allowed to stand for 1h prior the analysis. The zeta potentials were determined via electrophoretic mobility using the same instrument. All measurements were done in triplicate using disposable polystyrene cuvettes (Malvern Instruments, UK).
Transmittance Percentage (Y4)
One gram of the formulations were emulsified in 250 mL of deionized water and allowed to stand for 1h The transmittance percentage of resulting dispersions were mesuered at 550 nm [
27,
28] using a UV-visible spectrophotometer (Thermo Fisher Scientific Inc.) wiht deionized water as a control.
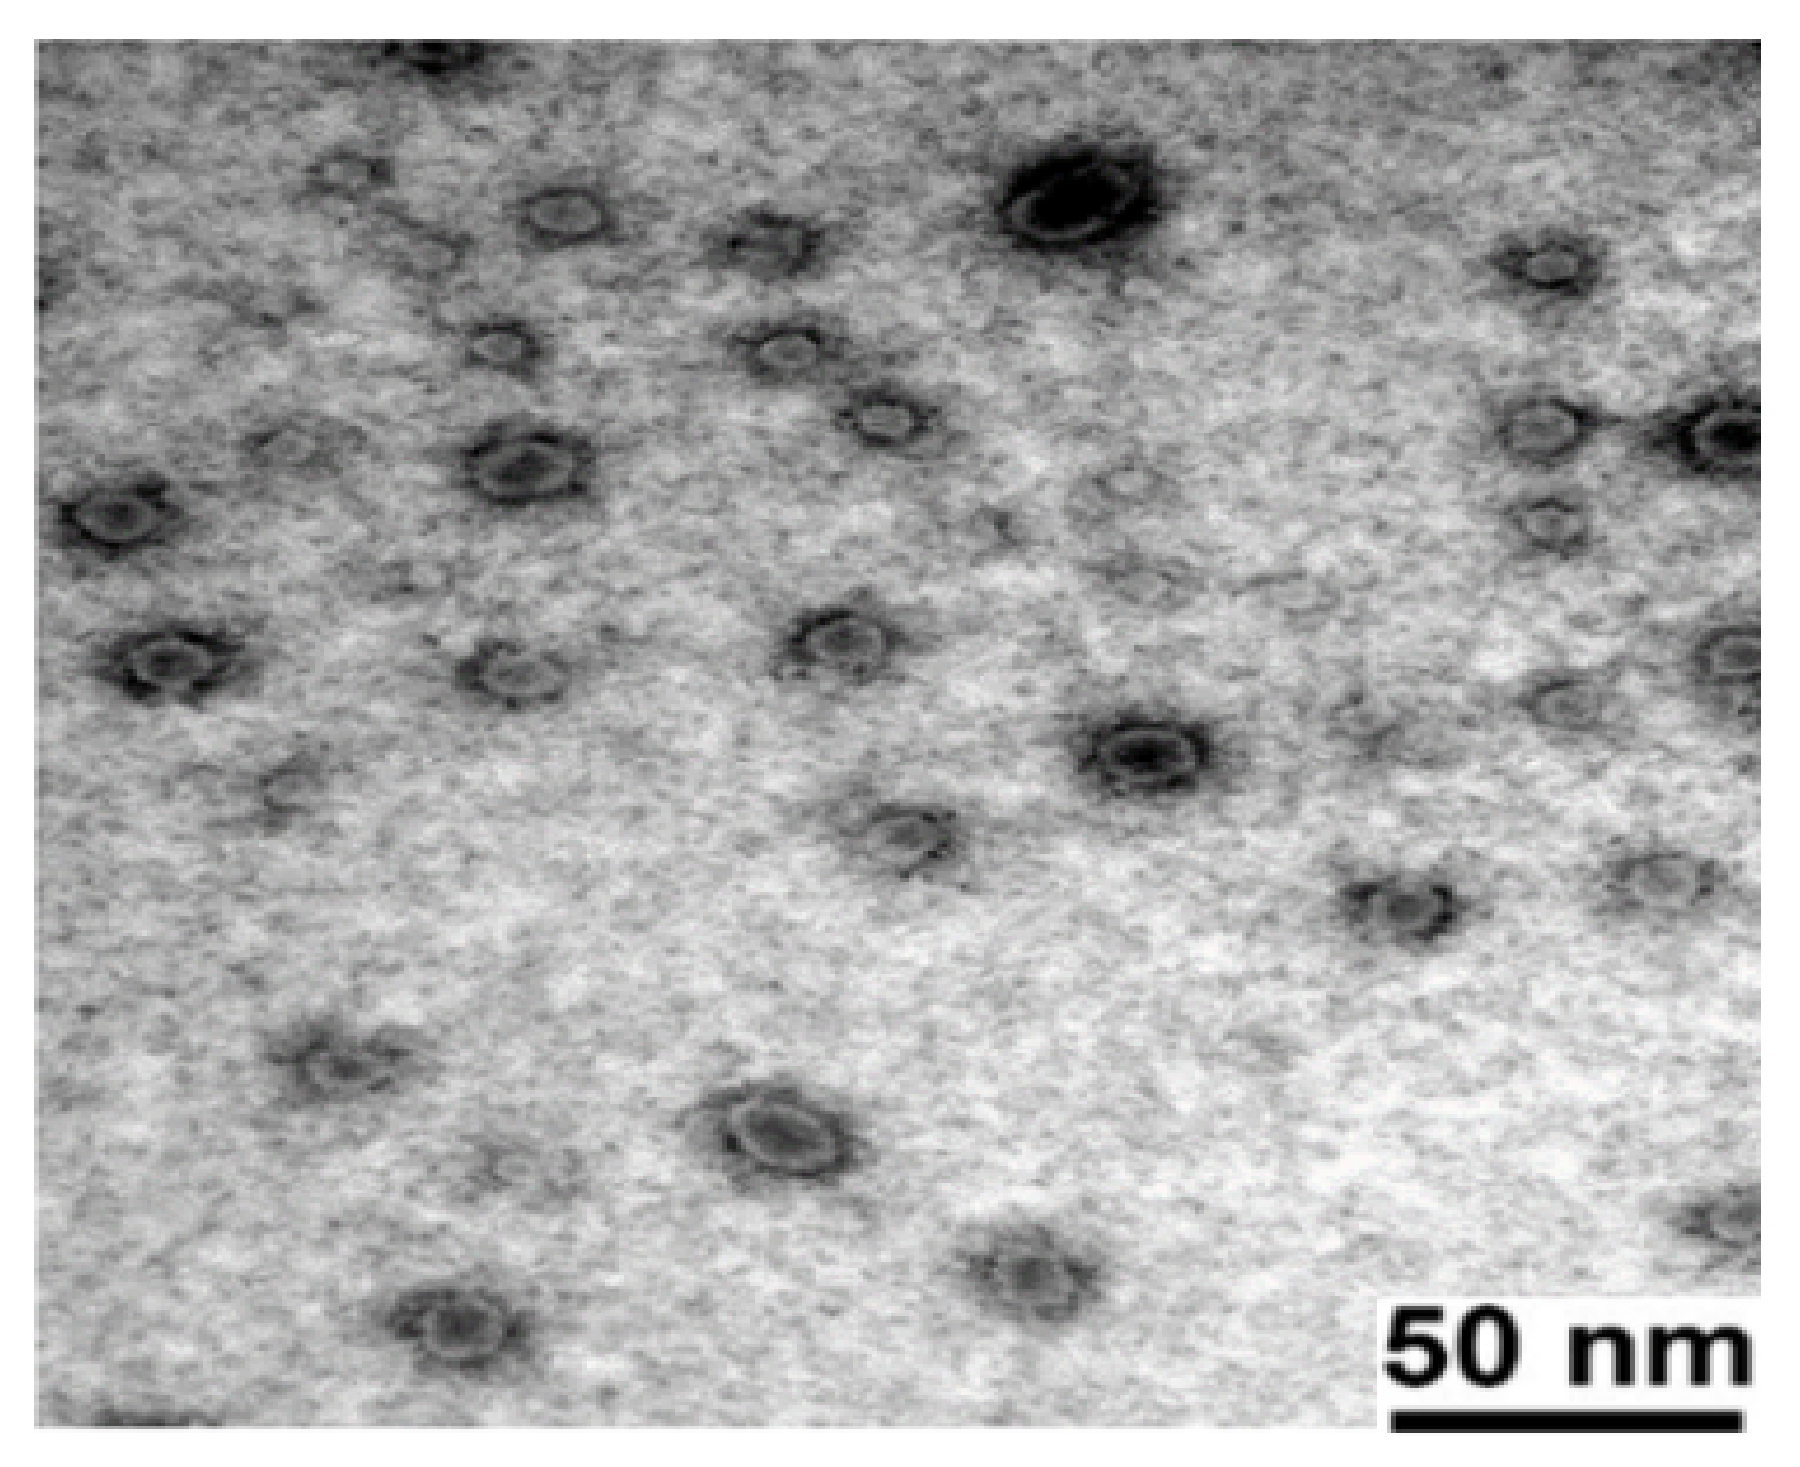
2.3.5. Transmission Electron Microscopy (TEM)
The morphology of the optimized nanoemulsion droplet was examined using a transmission electron microscope (Tecnai 10 microscope, FEI, Hillsboro, OR, USA) with a 100 kV accelerating voltage. A 0.5-mL droplet of the reconstituted SNEDDS formulation was positioned on carbon-coated 300 mesh grids, followed by negative staining with a 0.2% aqueous solution of uranyl acetate.
2.4. In Vitro Characterization of Vox-Loaded SNEDDS
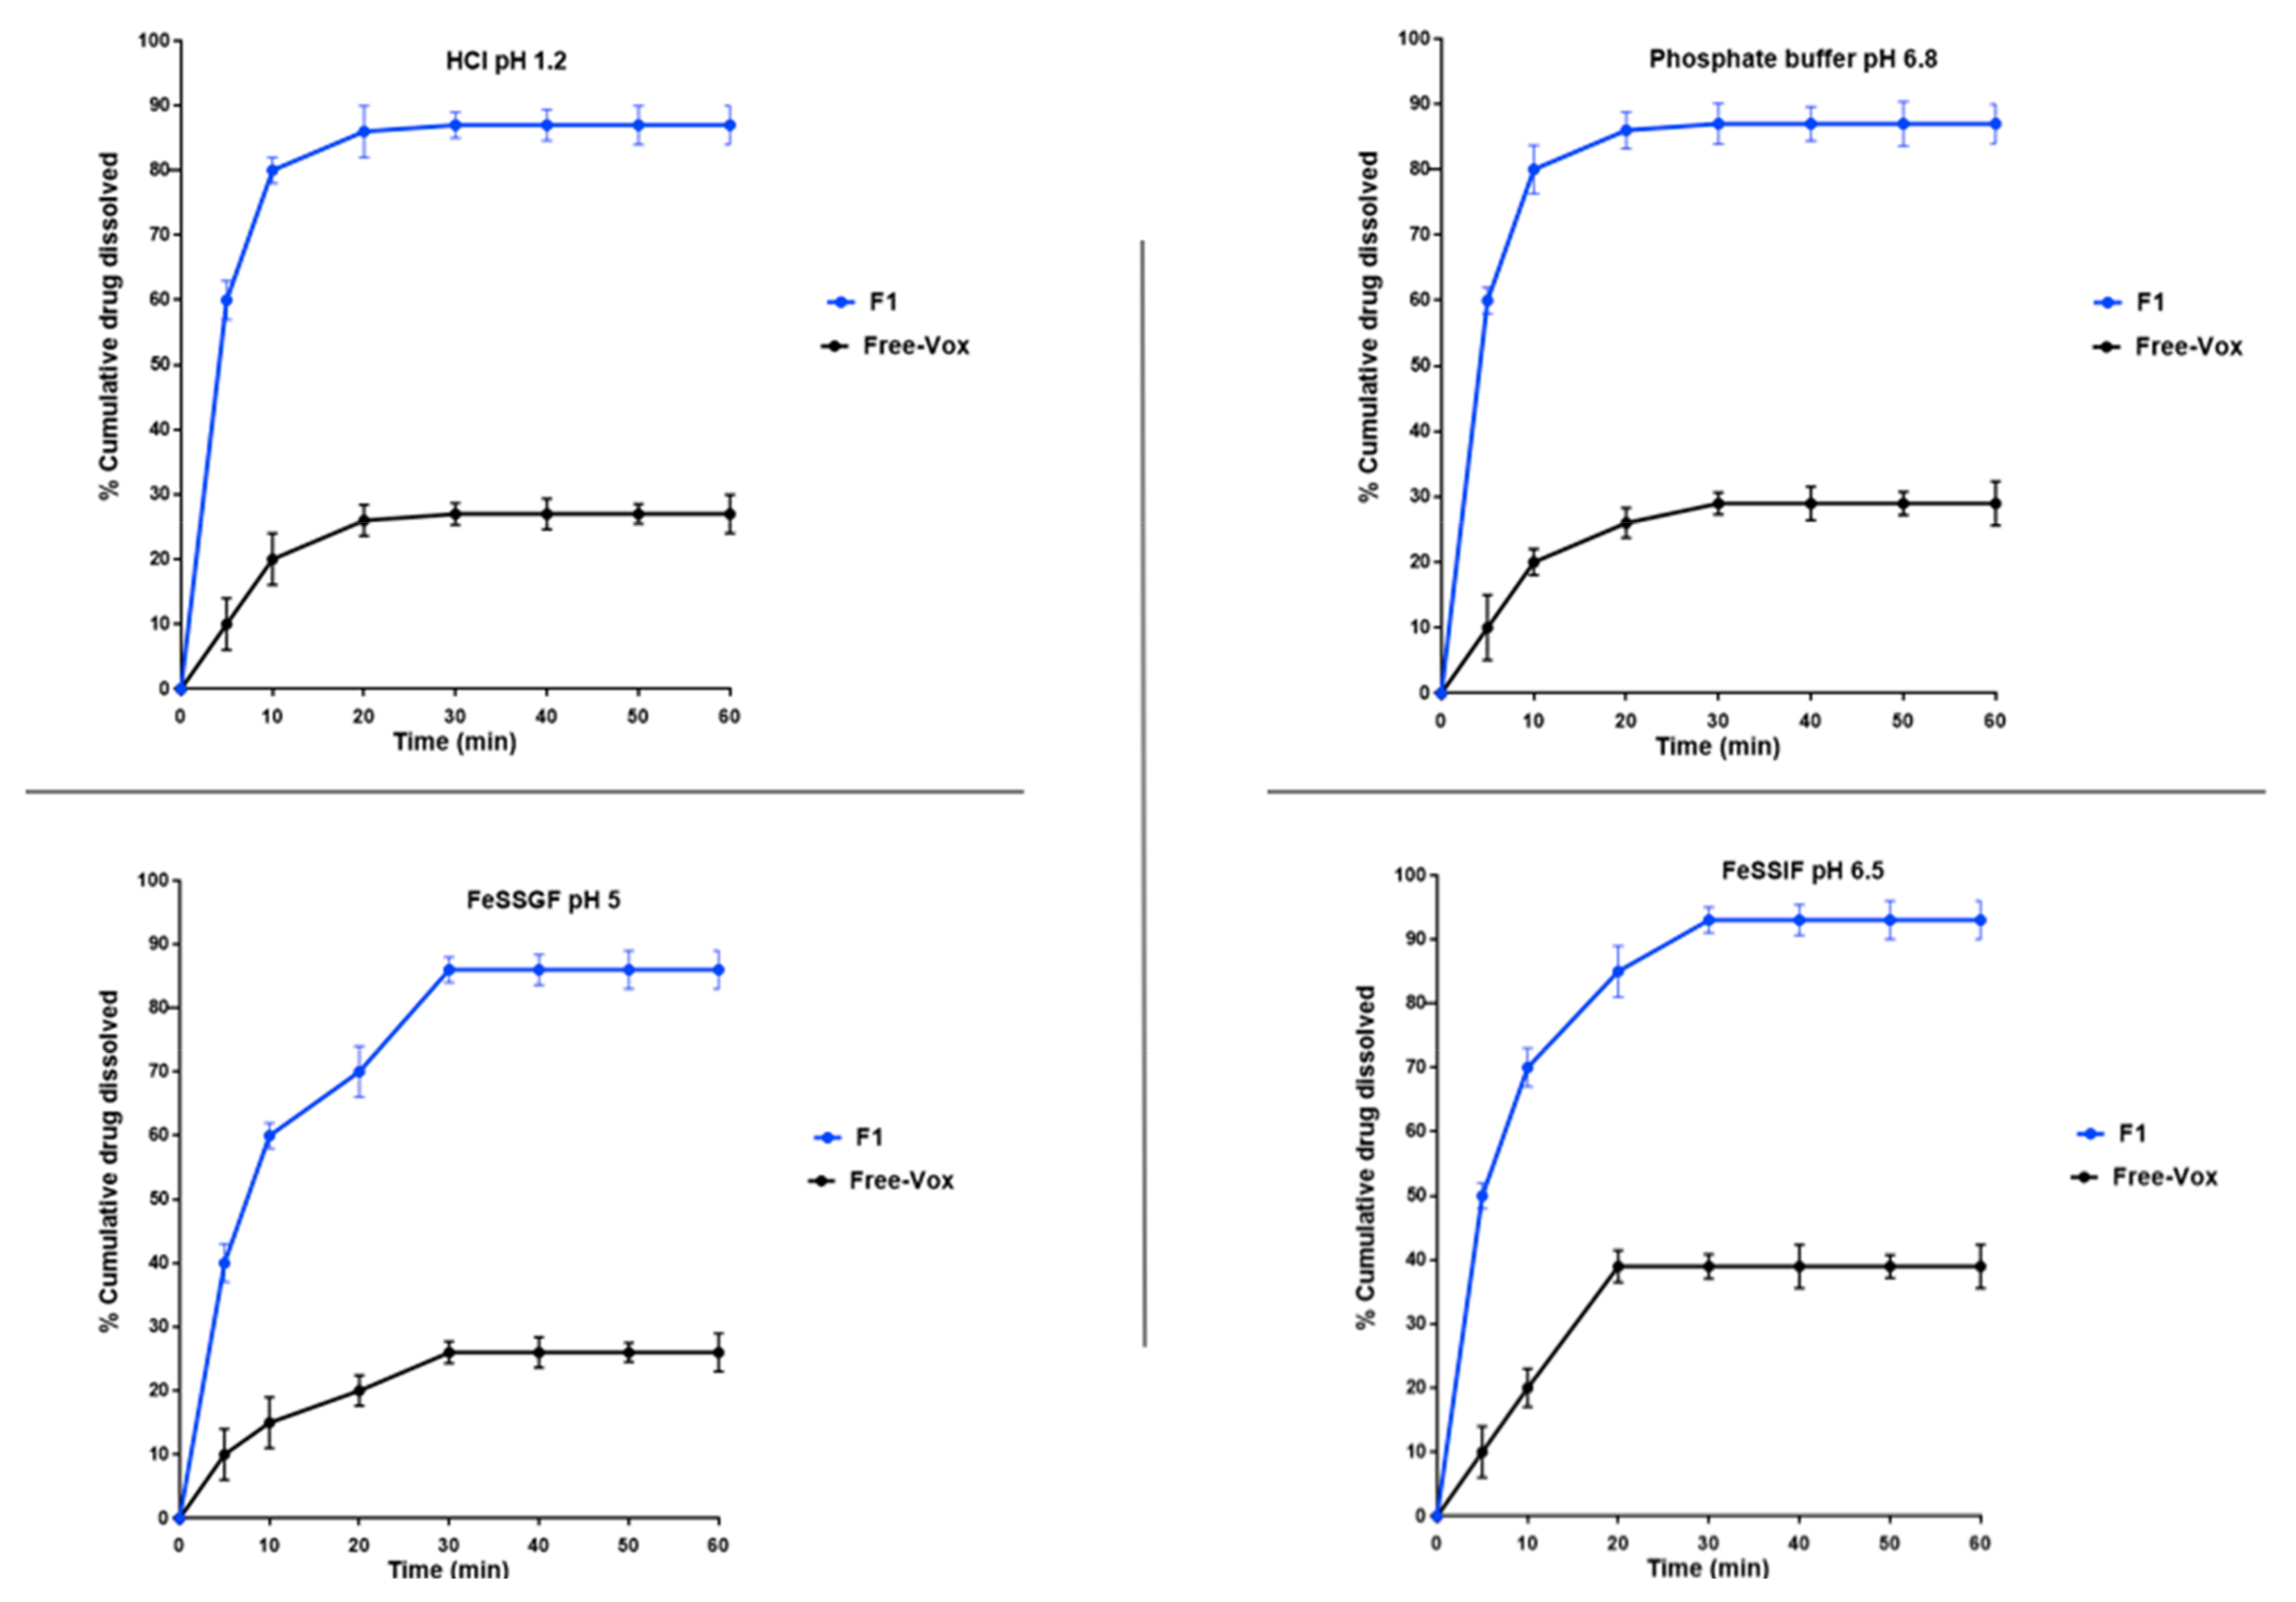
2.4.1. In Vitro Dissolution Studies
Dissolution studies were carried out using a USP Dissolution Tester (Apparatus II, Model Sotax AT7, CH-4008, Basel, Switzerland) with 500 mL hydrochloric acid USP buffer (pH 1.2), phosphate buffer (pH 6.8) [
29], and biorelevant medium (FeSSGF and FeSSIF). The speed of the paddle and the temperature were adjusted to 100 rpm and 37 ± 0.5 °C, respectively. The FeSSGF (fed state simulated gastric fluid) and FeSSIF (fed state simulated intestinal fluid) were prepared as per the method reported by Jantratid and Dressman [
30]. Hard gelatine capsules (size “0”) were filled with 50 mg of pure Vox or 600 mg of Vox-loaded SNEDDS (equivalent to 50 mg of Vox), and placed in the dissolution tester. At predetermined time intervals, an aliquot (2 mL) was withdrawn and replenished with an equivalent volume of fresh and preheated (37 °C) medium. The withdrawn samples were centrifuged (4000×
g) for 10 min and filtered through 0.22-µm Rotilabo
® syringe filters (Carl Roth, Karlsruhe, Germany). Appropriate dilutions in acetonitrile were performed prior to quantitative HPLC–UV analysis.
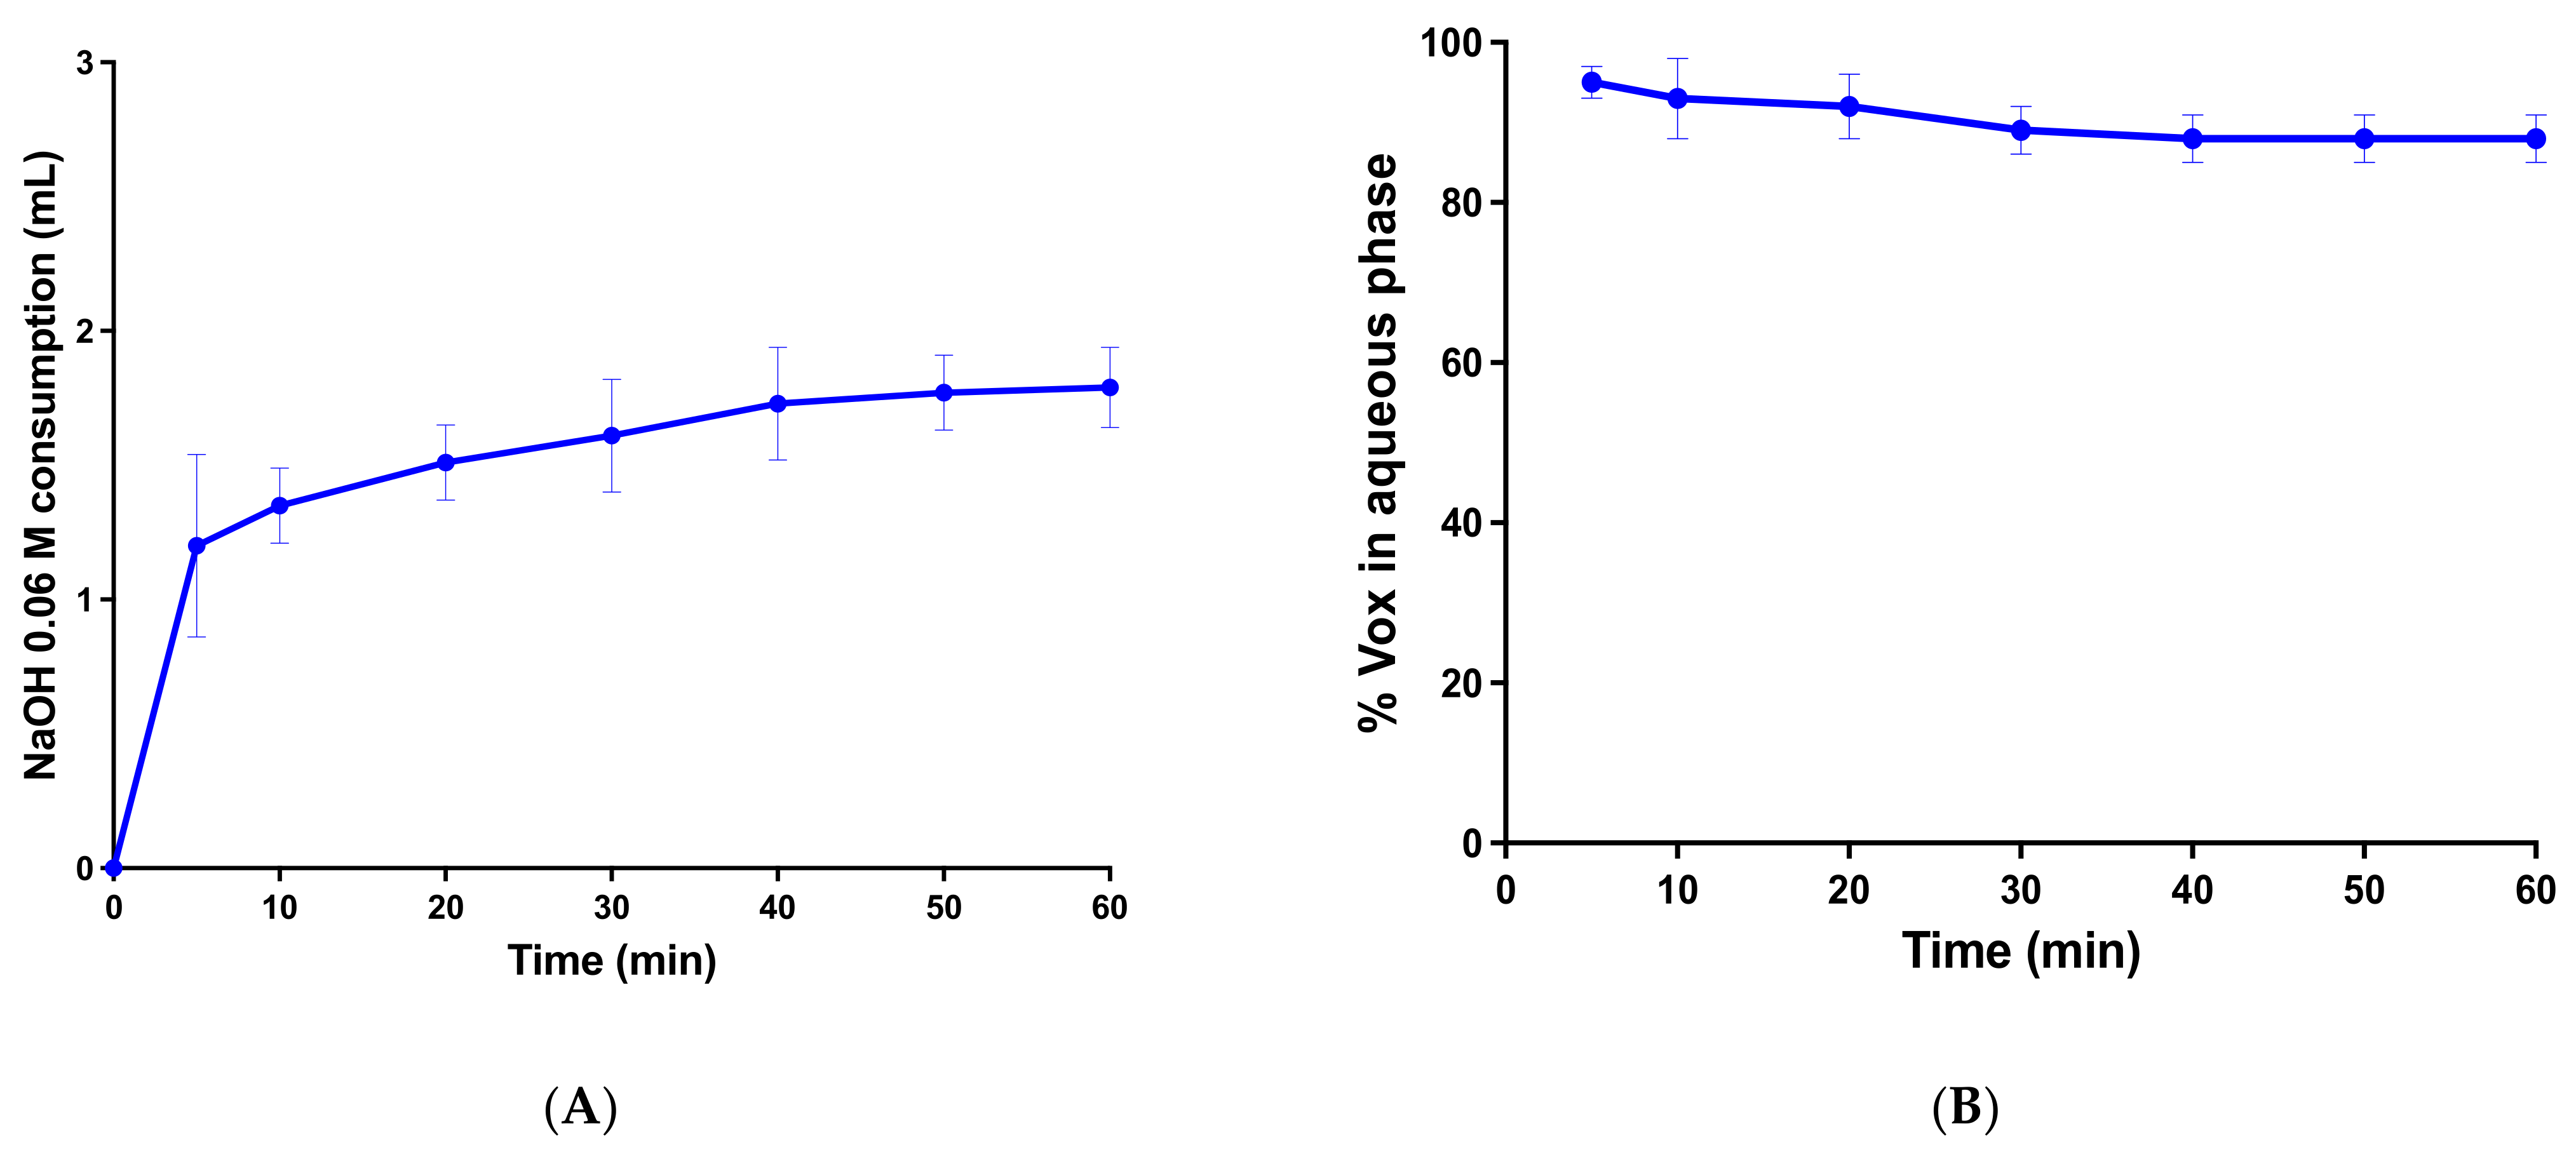
2.4.2. In Vitro Lipolysis
In vitro lipolysis study was performed as described previously [
31], with minor modifications. The equipment consisted of a compact stirrer (Mettler Toledo, Greifensee, Switzerland), an IKA C-MAG HS7 thermostat-jacketed glass reaction vessel (Staufen, Germany), a T5 Mettler Toledo pH-stat titration unit (Greifensee, Switzerland) containing a combined pH Ag/AgCl electrode (DGI 115-SC) and a 30-mL DV 1020 Mettler Toledo autoburette (Greifensee, Switzerland).
One gram of Vox-SNEDDS formulation was dispersed in 40 mL of lipolysis buffer (containing 1.4 mM CaCl2.2H2O, 0.75 mM TLC, 2 mM Tris-maleate, 3 mM NaTDC and 150 mM NaCl) for 20 min. Afterward, the pH was automatically set to 6.5, and in vitro lipolysis was started by adding 4 mL of pancreatin extract containing lipase (lipase activity equivalent to 8X USP specifications) and other pancreatic enzymes (ribonuclease, protease and amylase). The enzyme extract was prepared before each experiment by mixing 5 mL of lipolysis buffer with 1 g of pancreatic powder and 20 µL of NaOH solution (0.5 M) to reach the desired pH (6.5). The resulting enzyme dispersion was centrifuged (4000× g) for 15 min.
The fatty acids released during in vitro lipolysis were automatically titrated with 0.05 M NaOH to maintain the pH at 6.5. Lipolysis medium (2 mL) was withdrawn in 5-min intervals up to 1h of the experiment, and 10 µL of 1.0 M 4-bromophenylboronic acid (in methanol) was added to inhibit the enzyme activity. This process was followed by ultracentrifugation (6700× g, 4 °C MiniSpin, Eppendorf AG, Hamburg, Germany) for 20 min, resulting in the separation of the digestion content in a off-white pellet and clear supernatant. The supernatant was collected and Vox concentration was determined by HPLC-UV.
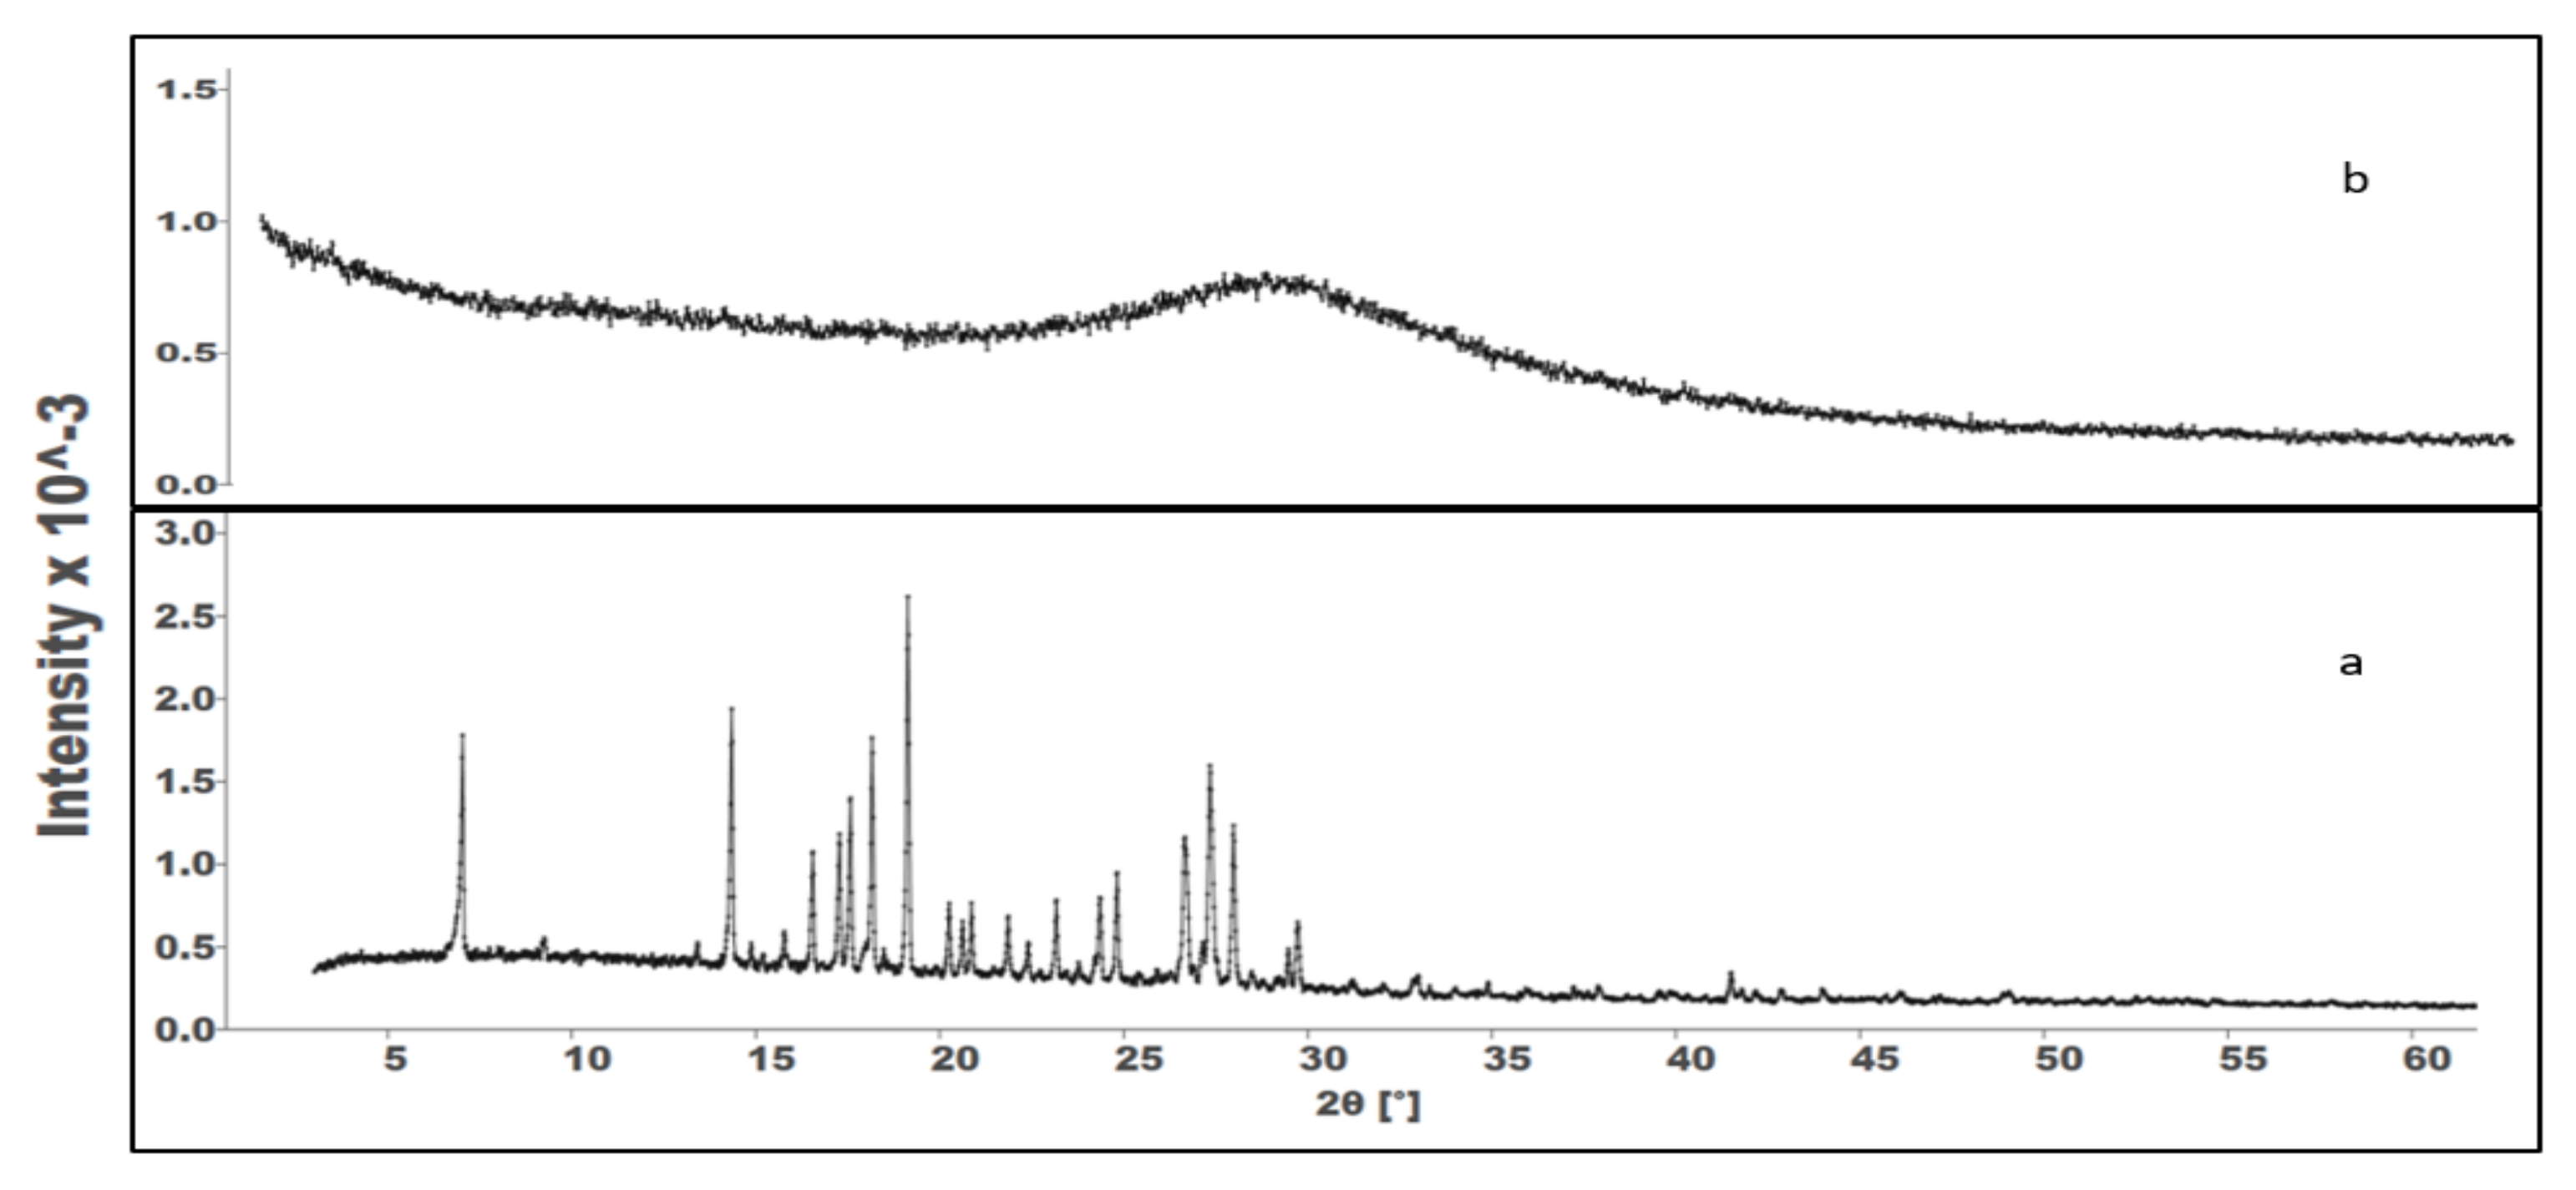
2.4.3. X-ray Powder Diffraction (PXRD)
To elucidate the solid state of the precipitated Vox during in vitro lipolysis, the pellets retrieved at the end of the experiment were analysed by X-ray powder diffraction. An X-ray diffractometer (PXRD, Stoe Stadi P, Darmstadt, Germany), with CuKα as the radiation source (1.542 Å), was used. The radiation voltage and amperes were set to 40 kV and 40 mA, respectively. All PXRD profiles were obtained at room temperature in the angular range of 2θ = 5–60°, at a speed of 0.04° per second.
2.4.4. Stability of the Vox-SNEDDS Formulation
SNEDDS formulations were stored for 6 months at room temperature and evaluated for optical clarity, droplet size, zeta potential, emulsification time, and drug content.
2.5. In Vitro Cell Line Study
The in vitro experiments were performed with Caco-2 cells. The cells were cultured in medium containing Dulbecco’s modified Eagle’s minimal essential medium (DMEM) supplemented with 1% (v/v) L-glutamine, 10% (v/v) heat-inactivated foetal bovine serum (HyClone®, Thermo Fisher Scientific Inc.), penicillin/streptomycin solution (10 units/10 µg/mL) and 1% (v/v) nonessential amino acids. The cells incubation was done in a humidified atmosphere (37 °C) containing 10% CO2. The cells were subcultured weekly once they reach 80% confluence.
2.5.1. Cell Viability Assay
The cell viability against the optimized formulation was assessed as described by Memvanga et al. [
32]. In brief, Caco-2 cells were seeded on 96-well culture plates (2 × 10
4 cells/well; 100 µL per well) and incubated in the culture media. After 24 h, the cells were washed with phosphate-buffered saline (37 °C) and treated with 100 µL of unloaded-SNEDDS or free Vox at various concentrations (from 0.3 to 4 mg/mL) diluted with Hank’s salt balanced solution (HBSS). After 2h of incubation, the cell were washed and treated with 100 µL of MTT solution (0.5 mg/mL in DMEM) and were incubated for 3 h (37 °C). To solubilize the formazan crystals formed during the incubation, 200 µL DMSO was added and the product of reaction was measured at 545 nm using a Multiskan Spectrum microplate reader (Thermo Fisher Scientific Inc.). The cell viability of the control cells (treated with HBSS) was defined as 100%.
The cell viability rates of the samples were calculated according to the following equation:
where A
s is the sample absorbance, and A
c is the absorbance measured after treating the cells with HBSS.
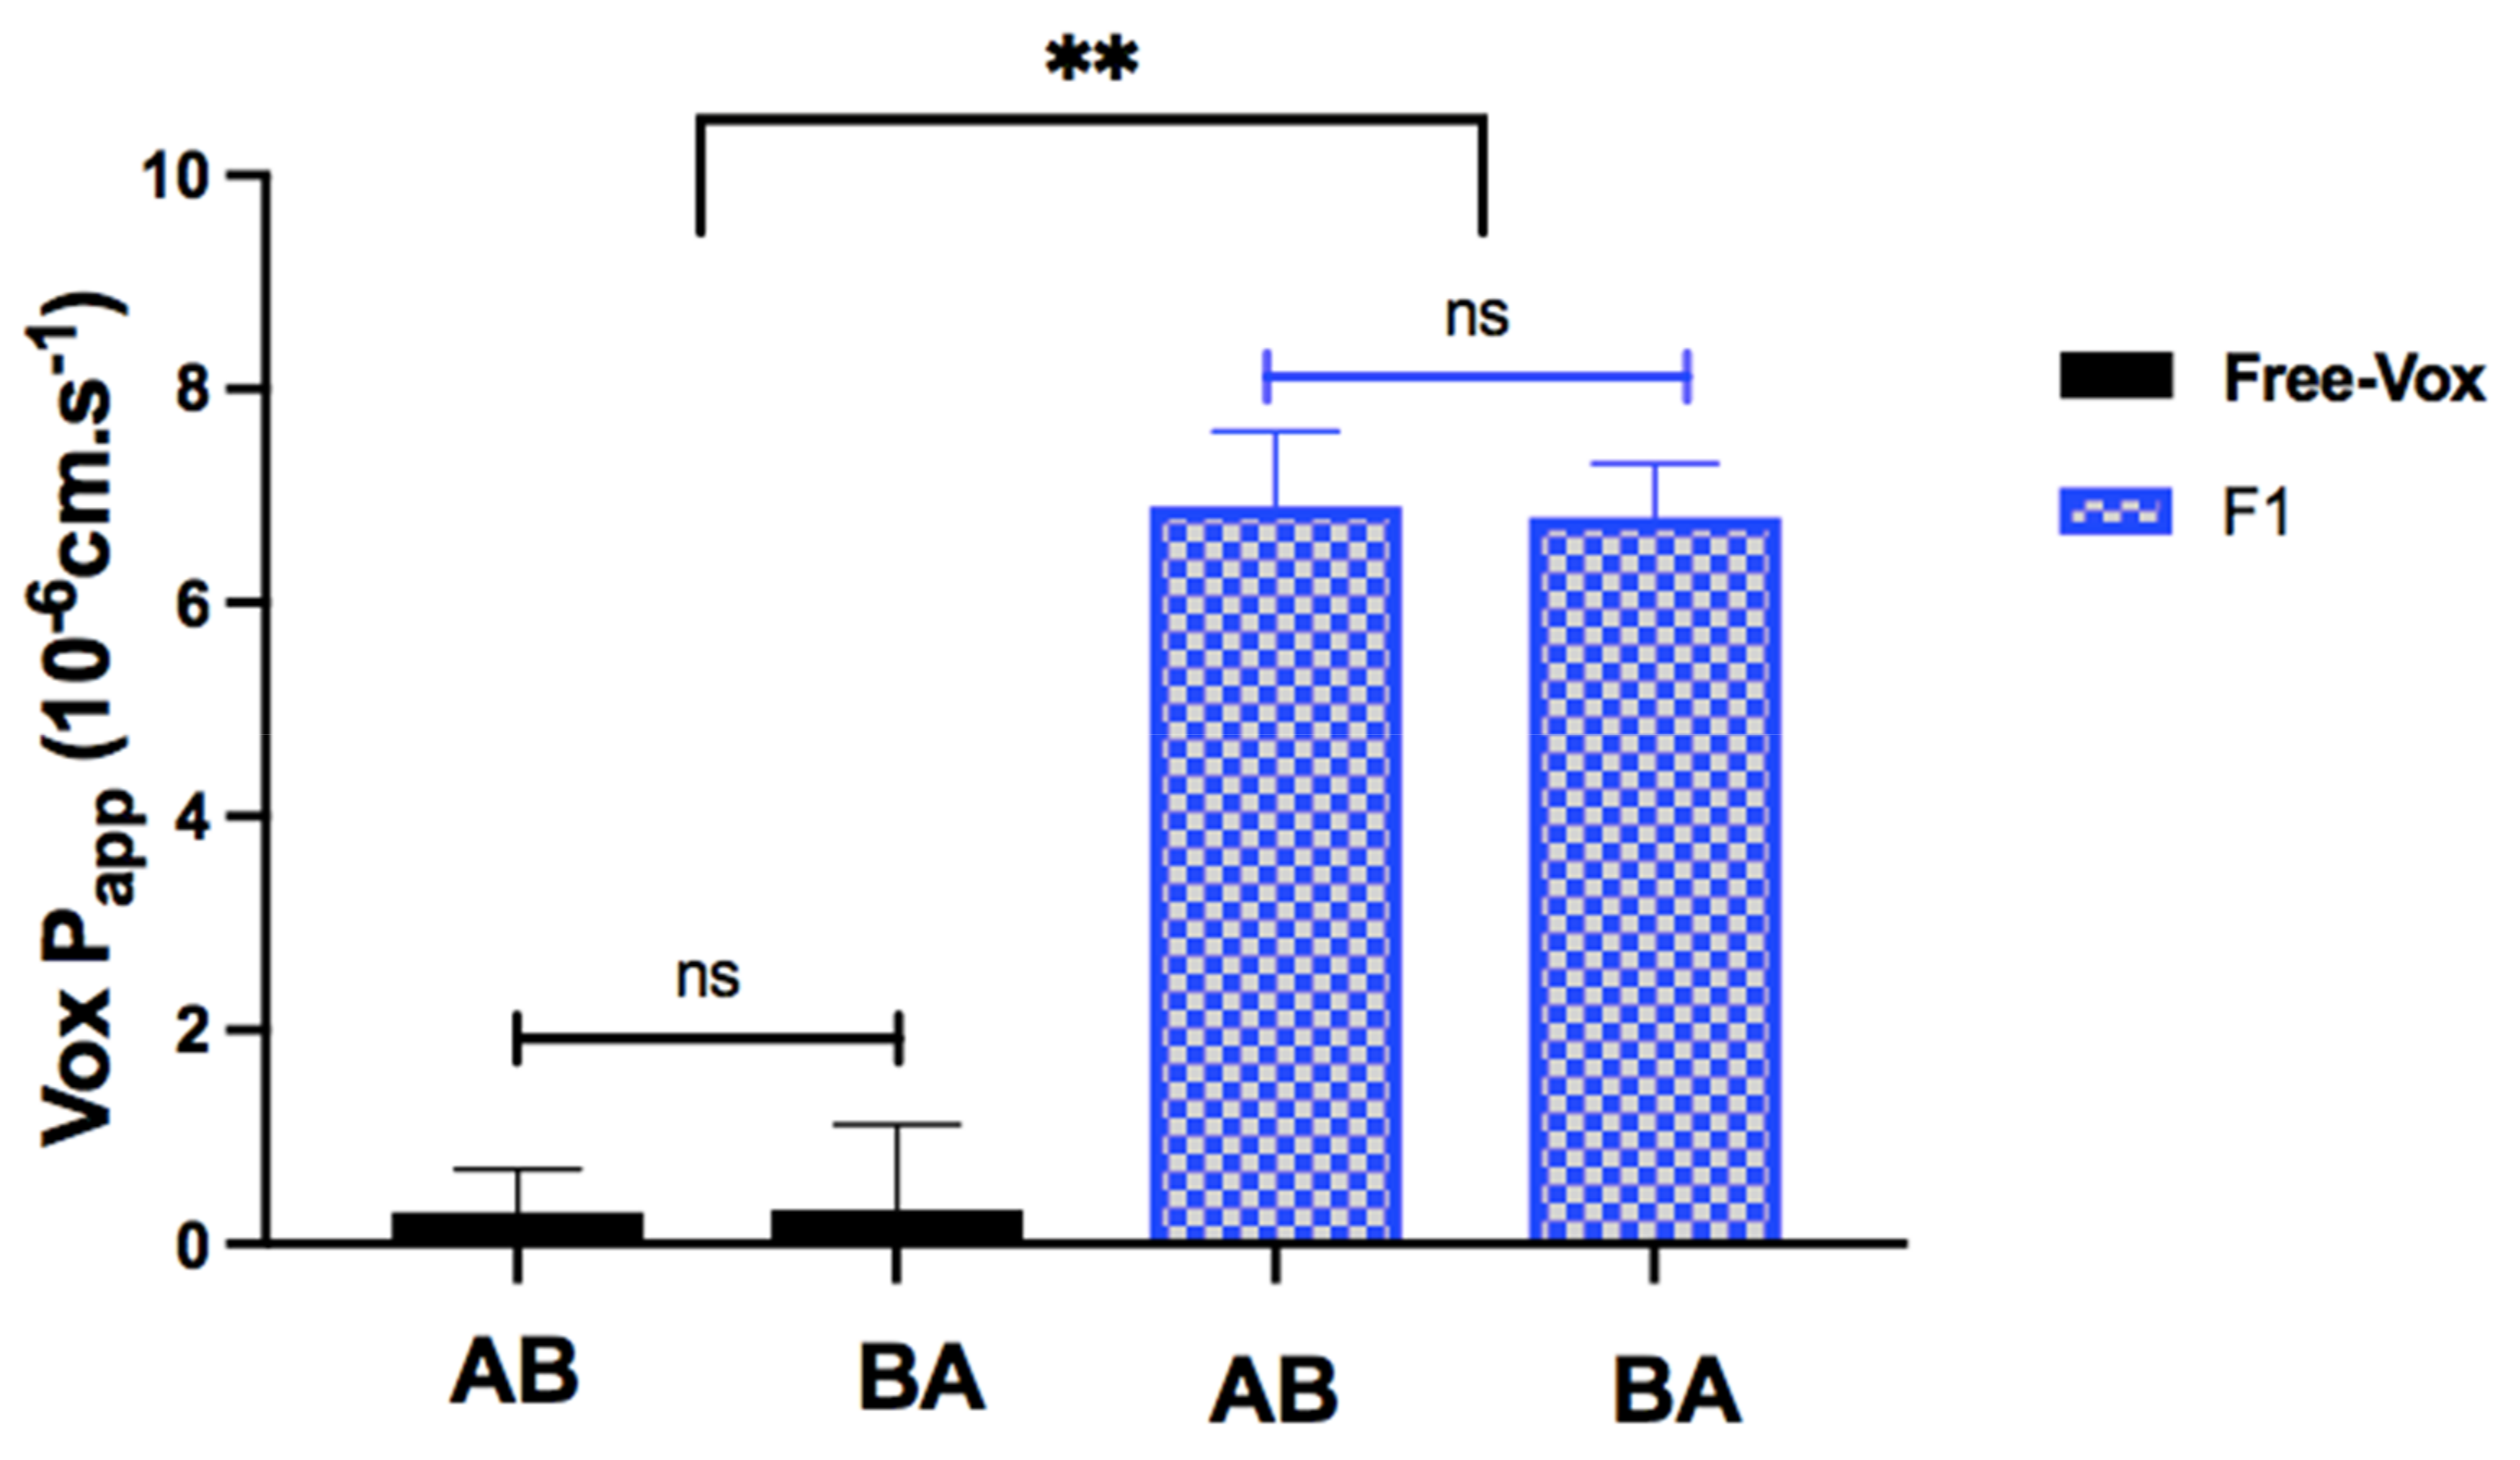
2.5.2. Cell Culture for Transport Studies
The in vitro transport experiments were carried out as described by Memvanga et al. [
32]. Caco-2 cells (5 × 10
5 cells/well) were seeded on 12-well cell culture inserts with a 0.9 cm
2 surface area (Corning Costar
®, NY, USA) and 1-µm pore diameter. Culture medium was replaced every two days and was added to the apical (0.5 mL) and basolateral (1.2 mL). The cells were incubated for 21 days to allow the differeciation until the measured transepithelial electrical resistance (TEER) increased to 400 ohm/cm
2. The TEER was measured using a voltmeter with a chopstick electrode (World Precision Instrument, Sarasota, USA). Thirty minutes before the experiments, the cells were incubated with HBSS (37 °C), and the TEER values of the monolayers were mesured in triplicate. Apical to basolateral (AB) transport experiments across Caco-2 cell monolayers were conducted by adding 0.5 mL of Vox suspension (0.9 mg/mL Vox in HBSS) or 0.5 mL of dispersed Vox-SNEDDS in HBSS (0.9 mg/mL Vox-SNEDDS, i.e., 75 µg/mL Vox) on the apical side of the inserts, and 1.2 mL HBSS on the basolateral side. For the basolateral to apical transport experiments (BA), 1.2 mL of Vox suspension (0.9 mg/mL Vox in HBSS), or 1.2 mL of dispersed Vox-SNEDDS in HBSS (0.9 mg/mL Vox-SNEDDS, i.e., 75 µg/mL Vox), was added to the basolateral side, while the apical side was filled with 0.5 mL HBSS.
After 2 h, TEER values of monolayers were determined in triplicate, and Vox content in acceptor compartments (basolateral for AB or apical for BA) was determined after appropriate dilutions by HPLC–UV. The apparent permeability coefficient (P
app) was determined using the following equation:
where
dQ/
dt (transport rate) is the amount of Vox (μg) appearing per time unit (s) in the receiver compartment,
Co is the initial concentration in the donor compartment (μg/mL), and
A is the surface area of the insert (
A = 0.9 cm
2).
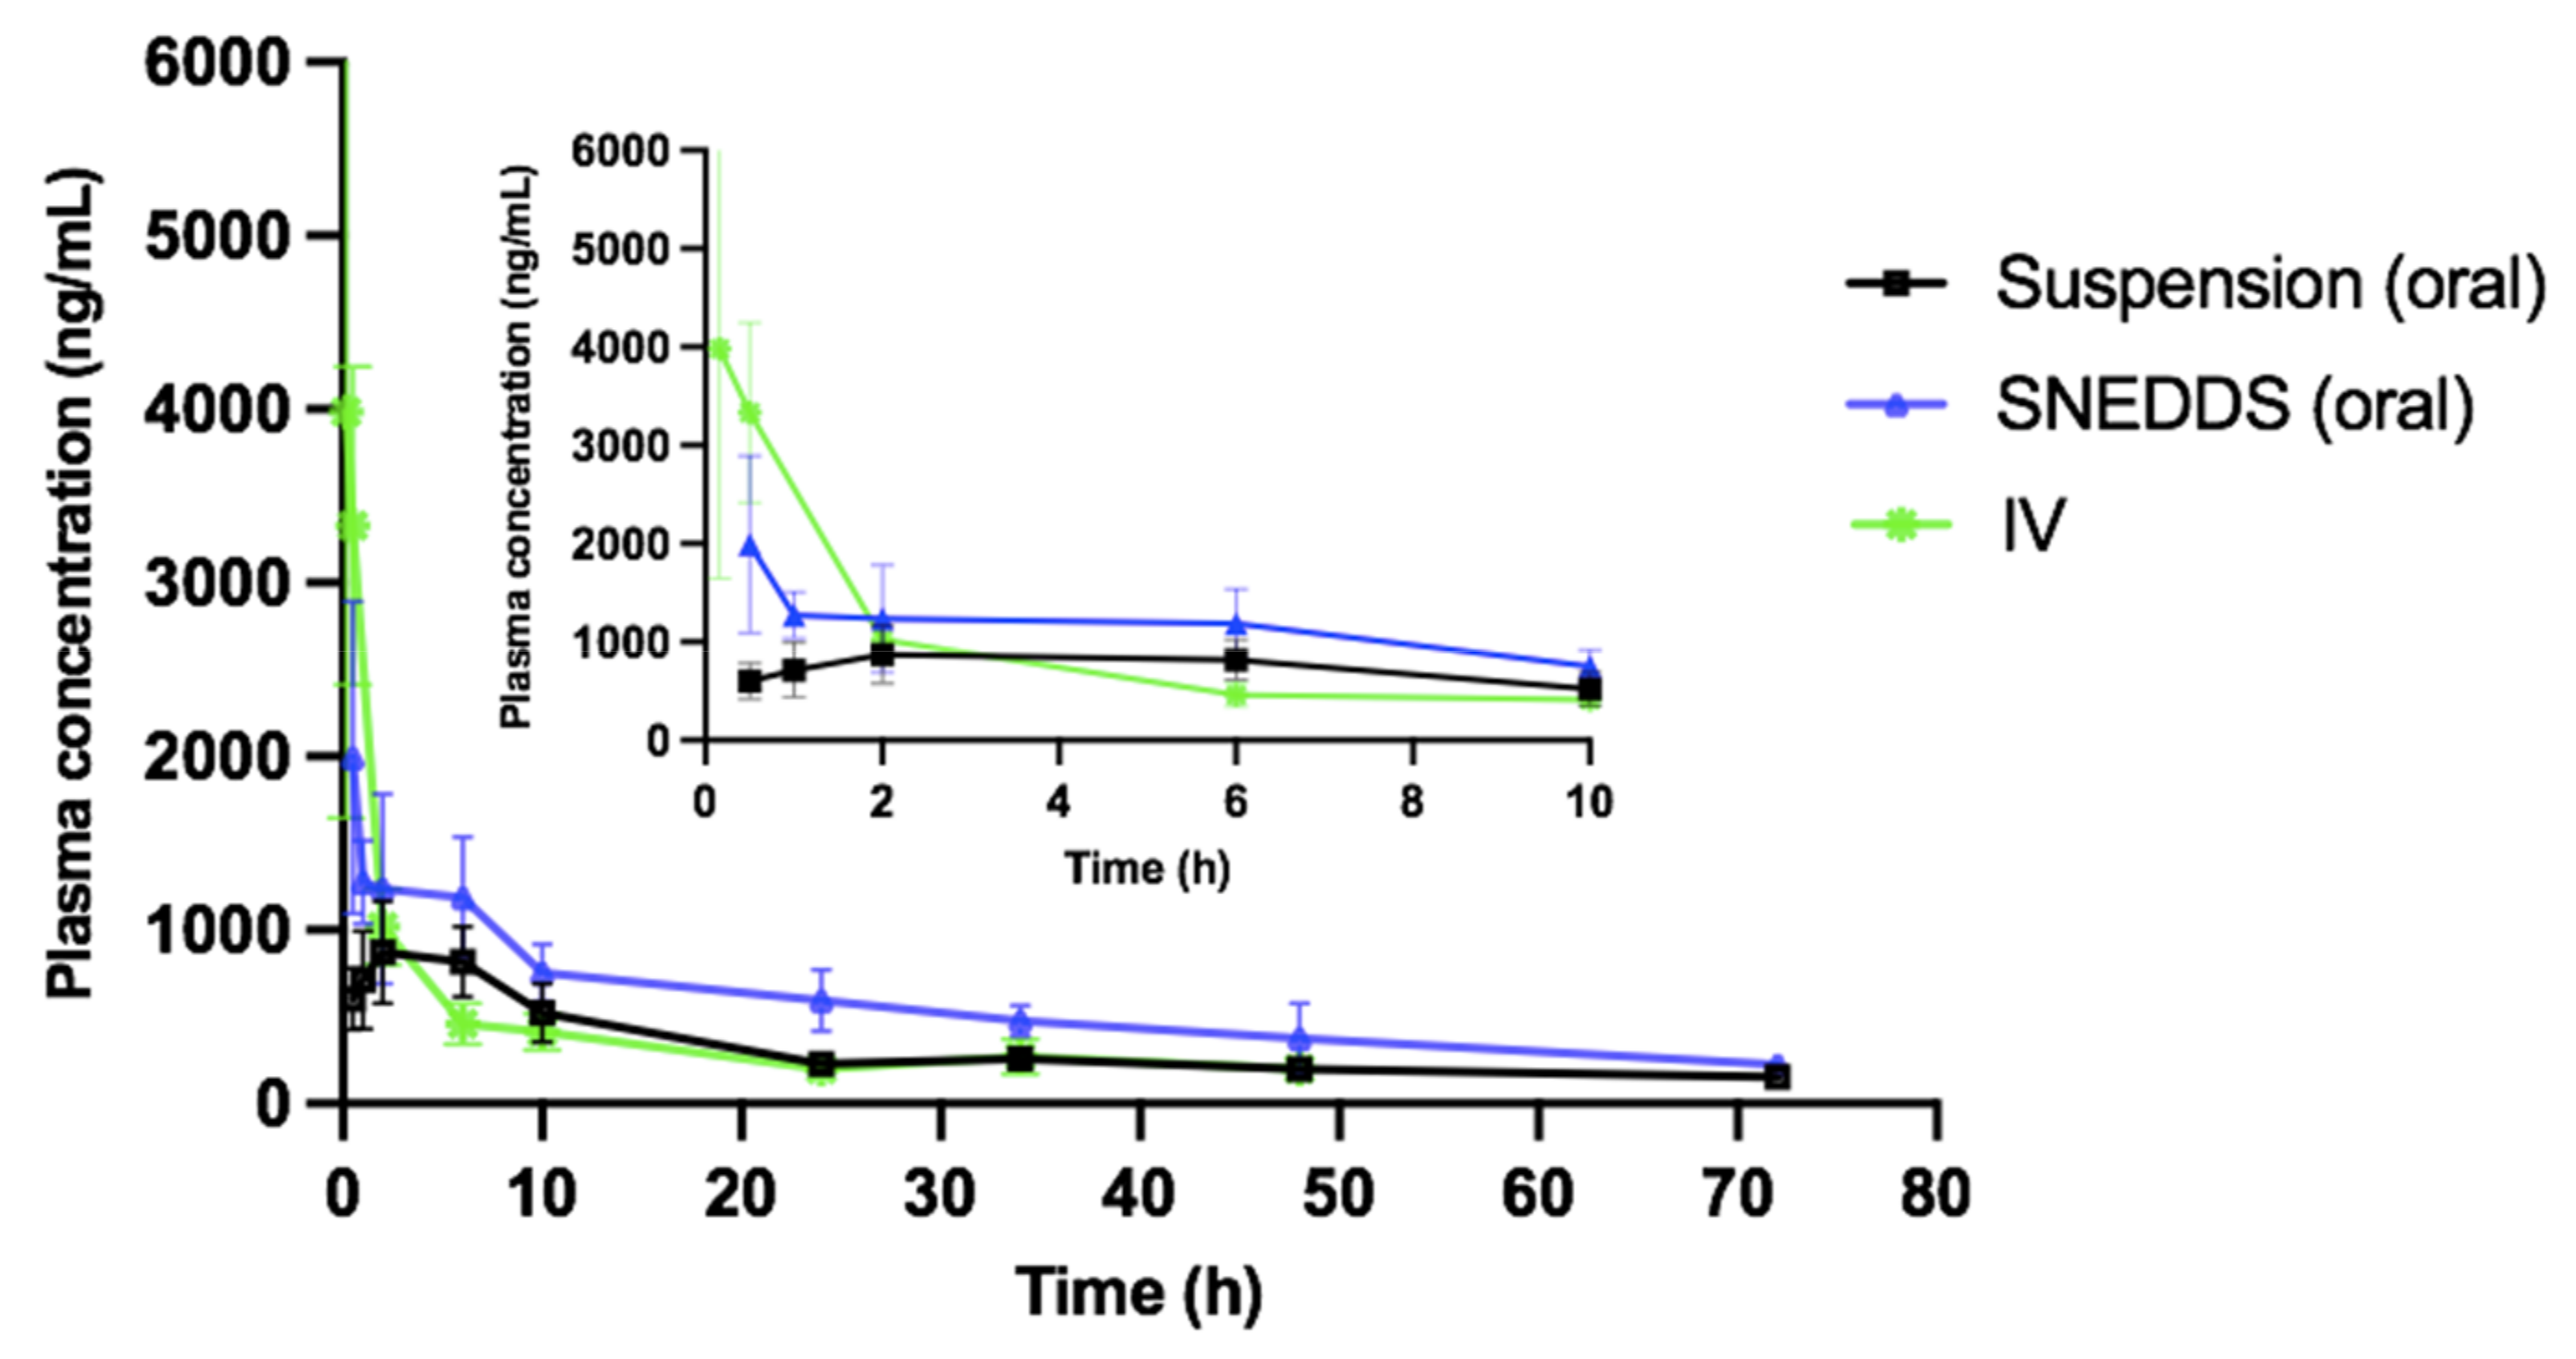
2.6. Pharmacokinetic Study
Male Sprague Dawley Fisher rats with a mean body weight of 300 g were obtained from Janvier Labs (Saint Berthevin, France). All rats were housed in a light-controlled room at a temperature of 20 ± 5 °C and a relative humidity of 25 ± 5%. All animal experiments were approved in March 2020 by, and performed in accordance with, the local animal committee (2020/UCL/MD/06, March 2020).
Before the experiments, the rats were divided into three groups (
n = 18) and fasted for 12 h with free access to water. Group 1 animals were orally administered 1 mL of pure Vox suspension (in 0.5% sodium carboxyl methylcellulose) at a drug dose of 7.2 mg/kg, and group 2 animals were orally administered a Vox-loaded SNEDDS at a dose of 7.2 mg/kg. For intravenous administration, group 3 animals were administered 0.5 mL of Vox solution (in normal saline buffer containing 10% (
w/
v) Tween
® 80) via the tail vein at a dose of 1.6 mg/kg [
3]. Blood samples (0.25 mL) were withdrawn from the tail vein using heparinized capillaries at 0.5, 1, 2, 6, 10, 24, 36, 48, and 72 h. The blood samples were centrifuged at 4000×
g (10 min) to separate the plasma. The samples were stored at −80 °C until analysis by LC–MS. A noncompartmental pharmacokinetic analysis was used to determine the pharmacokinetic behaviour of voxelotor. The pharmacokinetic parameters were computed using the PK solver programme (Microsoft Excel) with the trapezoidal rule. Statistical analysis of in vivo pharmacokinetic data was conducted using a two-tailed unpaired Student’s
t-test, with
p values < 0.05 considered significant.
The absolute bioavailability (
F) was calculated as follows:
where AUCo and AUCi are the areas under the curve of the oral groups (o) (SNEDDS and suspension) and the intravenous group (i), respectively.
4. Conclusions
In this study, the Qbd approach was applied to develop Vox-SNEDDSs with improved aqueous solubility and oral bioavailability. Solubility and emulsification studies suggested the suitability of Capryol PGMC®, Cremophor-EL®, and Labrafil M® 1944 as oils, surfactants, and cosurfactants, respectively. Ternary diagram studies indicated the nanoemulsification region and range of factors that should be applied in the DoE. The D-optimal design suggested that the SNEDDSs’ formulation comprised of Capryol PGMC® (40% w/w), Cremophor-EL® (43% w/w), and Labrafil M® 1944 CS (17% w/w). Thus, it fulfilled the maximum requirements of an optimum formulation and was chosen for further evaluation. The optimized formulation showed an emulsification time of 32.4 ± 0.4 s, globule size of 34.9 ± 1.2 nm, polydispersity index of 0.204 ± 0.0, zeta potential of −8.4 ± 1.3 mV, and transmittance percentage of 99.2 ± 0.6%. The spherical shape of the oil globules in the nanoemulsion was revealed using transmission electron microscopy. The optimized SNEDDS revealed a high drug dissolution, and at least 88% of the Vox remained solubilized after the in vitro lipolysis of the formulation. The in vitro transport study across Caco-2 cell monolayers revealed that the SNEDDSs could significantly enhance the permeation of Vox compared to the free drug. Thus, the developed SNEDDS resulted in a 1.7-fold higher oral bioavailability of Vox in rats, compared to the drug suspension. This new SNEDDS may be further developed as an alternative formulation of voxelotor.


 ,
, 


