
Crystallization Thermodynamics of α-Lactose Monohydrate in Different Solvents


1
School of Chemical Engineering and Technology, Sun Yat-sen University, Zhuhai 519082, China
2
School of Chemistry and Chemical Engineering, Jinggangshan University, Ji’an 343009, China
3
School of Chemistry, Sun Yat-sen University, Guangzhou 510275, China
*
Authors to whom correspondence should be addressed.
Pharmaceutics 2022, 14(9), 1774; https://0-doi-org.brum.beds.ac.uk/10.3390/pharmaceutics14091774
Submission received: 29 July 2022
/
Revised: 18 August 2022
/
Accepted: 19 August 2022
/
Published: 25 August 2022
(This article belongs to the Special Issue Applications of Crystal Engineering in Drug Delivery)
Abstract
:It is common to find that some of the lactose in dairy powders and pharmaceutical tablets is present in the unstable amorphous state. Therefore, their crystallization thermodynamics in different solvents are particularly important. In this paper, the solubility of α-lactose monohydrate (α-LM) in 15 mono-solvents such as ethanol, isopropanol, methanol, 1-propanol, 1-butanol, 2-butanol, isobutanol, 1-pentanol, isoamylol, 1-hexanol, 1-heptanol, 1-octanol, propanoic acid, acetonitrile, and cyclohexanone was evaluated by using the gravimetric method in the temperature ranges from 274.05 K to 323.05 K at constant pressure (1 atm). In the given temperature range, the solubility of α-LM in these solvents increased with the rising of temperature, the highest solubility of α-LM was found in methanol (2.37 × 10⁴), and the lowest was found in 1-hexanol (0.80 × 10⁵). In addition, the increase of α-LM solubility in isopropanol was the largest. The sequence at 298.15 K was: methanol > 1-butanol > isopropanol > ethanol > 1-propanol > 1-heptanol > isobutanol > propionic acid > 1-pentanol > 1-octanol > acetonitrile > isoamylol > 2-butanol > cyclohexanone > 1-hexanol. Solvent effect analysis shows that the properties of α-LM are more important than those of solvents. The Apelblat equation, λh equation, Wilson model, and NRTL model were used to correlate the experimental values. The root-mean-square deviation (RMSD) and relative average deviation (RAD) of all models were less than 2.68 × 10⁻² and 1.41 × 10⁻⁶, respectively, implying that the fitted values of four thermodynamic models all agreed well with the experimental values. Moreover, the thermodynamic properties of the dissolution process (i.e., dissolution Gibbs free energy (ΔdisG), molar enthalpy (ΔdisH), and molar entropy (ΔdisS)) for α-LM in selected solvents were determined. The results indicate that ΔdisH/(J/mol) (from 0.2551 to 6.0575) and ΔdisS/(J/mol/K) (from 0.0010 to 0.0207) of α-LM in these solvents are all positive, and the values of ΔdisH and ΔdisS. ΔdisG/(J/mol) (from −0.0184 to −0.6380) are all negative. The values were observed to decrease with rising temperatures, implying that α-LM dissolution is an endothermic, entropy-driven, and spontaneous process. The solid–liquid equilibrium data and dissolution thermodynamics of α-LM were obtained, which provide a basis for industrial production.
1. Introduction
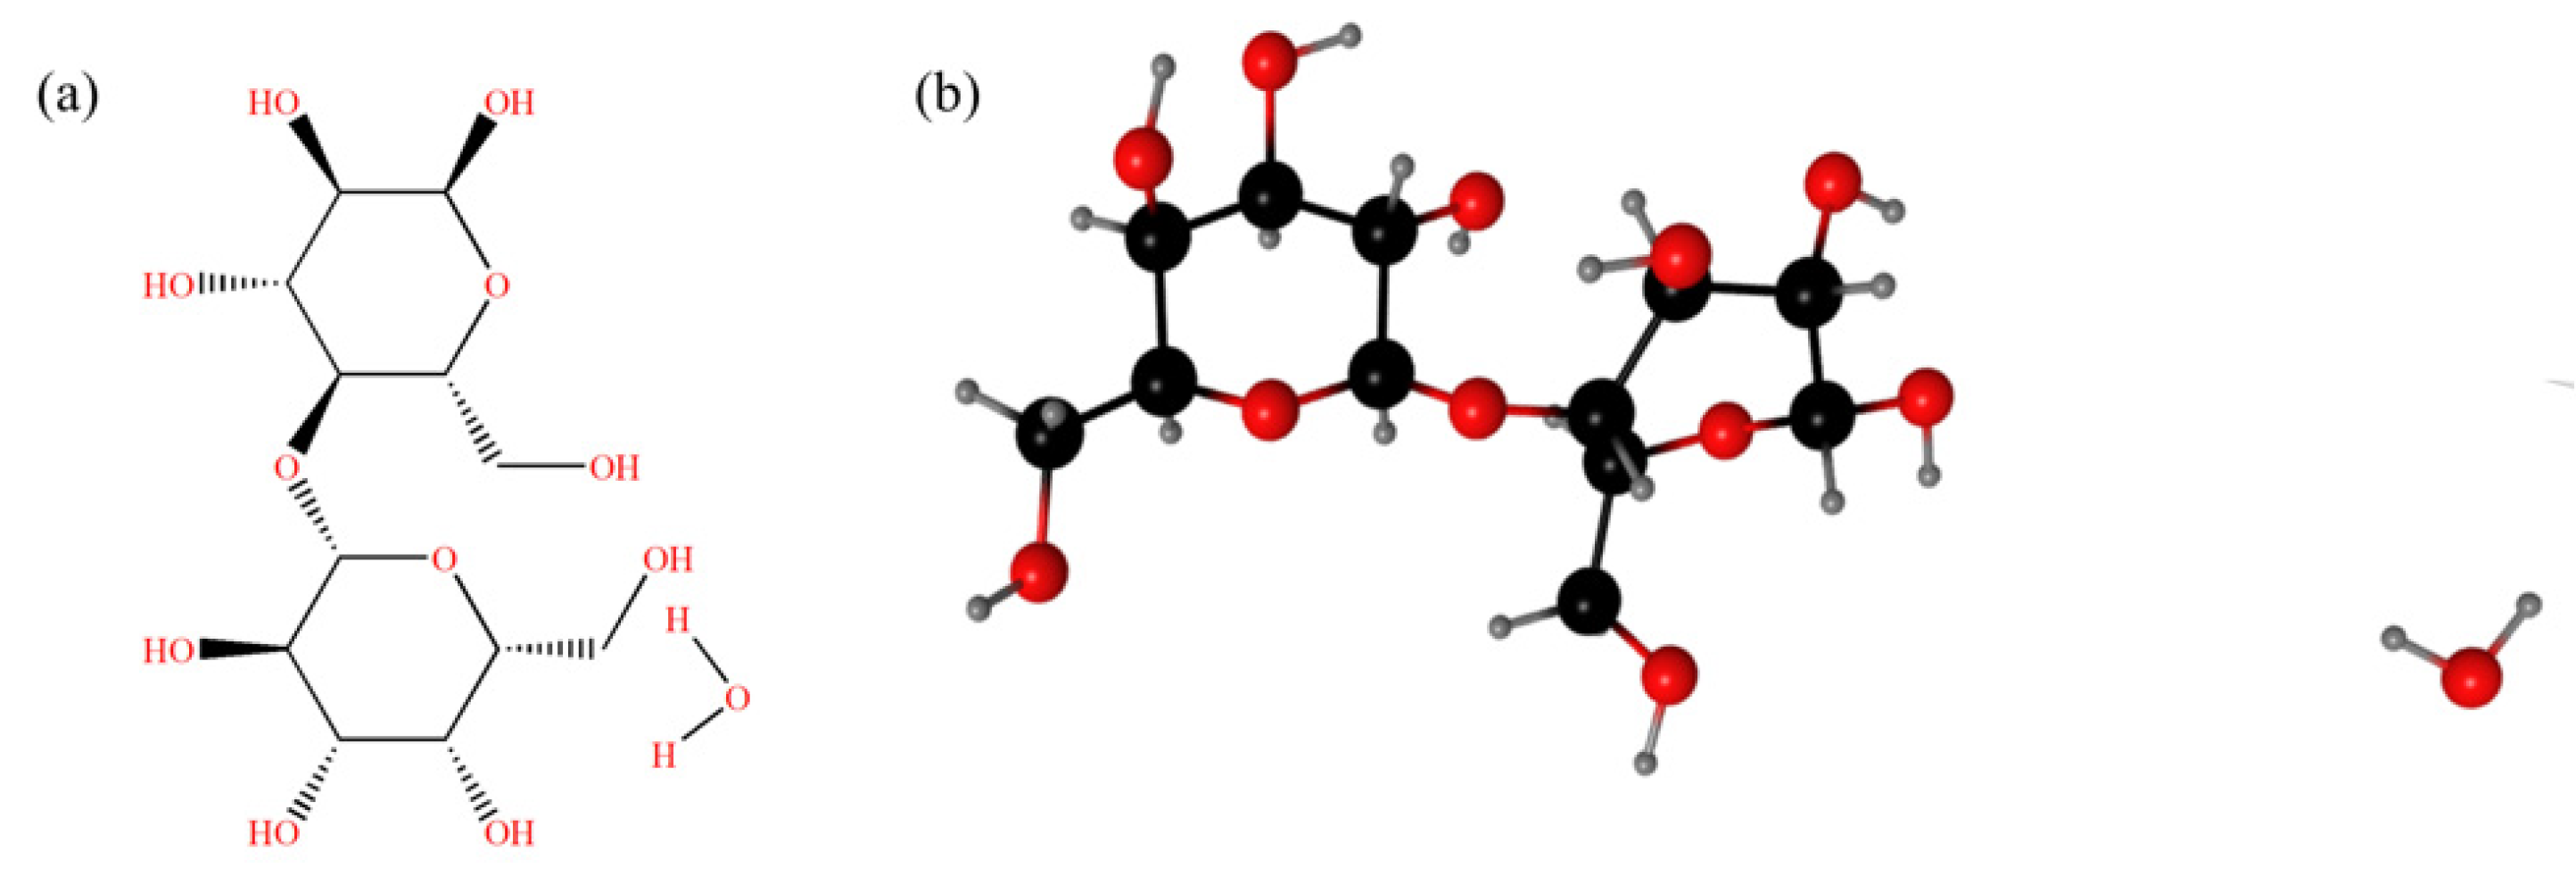
Lactose (4-O-β-D-galactopyranosyl-D-glucopyranose), a by-product of the milk industry, is produced from the solution crystallization of whey [1,2]. Due to the different orientation of -OH groups in glucose unit, lactose molecule has two different isomers (i.e., α and β anomers) [3]. The α-lactose monohydrate (C12H22O11·H2O, molar mass 360.31 g·mol−1, CAS No. 5989-81-1, abbreviated as α-LM, the chemical structure shown in Figure 1), the most stable form of lactose, is widely used as sweetener, stabilizer, and excipient in food and pharmaceutical excipient because of its excellent texture, taste, and adhesion [4,5,6]. However, α-lactose products usually exist as a mixture of α and β-lactose in the aqueous solution with a ratio of 60:40 [7]. Altamimi et al. used a new H1-NMR to analyze a group of 19 commercial lactose samples to establish a library, implying the isomer content of a large number of lactose products, because a change of more than 10% in the isomer content of the α-lactose monohydrate sample may affect the bioavailability of the final preparation [8]. Therefore, the purity of α-LM in the production process will significantly affect its functions, so it is necessary to purify the food and drug additive, and the solubility of the additive in various pure solvents can provide a theoretical basis for the food and drug crystallization process. Different methods such as anti-solvent crystallization [4,5], micro-fluidic spray drying [9], ultrasonic crystallization [10,11], and solvated crystallization [12] have been used to improve the yield and the desired shape, size, and polymorphic form of α-LM crystals. Industrial production of α-LM is an energy-intensive process. Optimized solvents can recover α-LM from the mixture of α- and β-lactose, which can save stringent energy and help regulate the nucleation, growth, and polymorphism of α-LM crystals. López-Pablos et al. proposed a method to prepare pure anhydrous β-lactose (β-L) by static reaction of α-LM in alkaline alcohol solution under the condition of controlling temperature [13]. Therefore, obtaining the solubility data of α-LM in different solvents helps choose the appropriate crystallization solvent and production process. Majd et al. measured the solubility of lactose in 70–90% alcohol-aqueous solution, which guided the recovery of lactose crystals [14]. Choscz et al. discussed the effects of different whey salts and mixed salts on the solubility of lactose in aqueous solution (20–50 °C), and proposed a semi-predictive modeling method based on EPC-SAFT model [15]. Machado et al. obtained the solubility of α-lactose in water–ethanol mixed solvents (25, 40 and 60 °C, with concentrations ranging from 0 to 100 wt.% water), and correlated and predicted it using the UNIQUAC model [16]. But there have been few relevant reports on the solubility distribution of α-LM in different pure solvents, solvent effect, and thermodynamic properties of the dissolution process in previous literature.
Alcohols, ketones, and hydrocarbons are commonly used organic solvents in industrial operations (including chemical reactions, preparation and separation). From various lengths of the carbon chain to different types of isomerism, multiple homologous alcohols exist and different alcohols show different hydrophilic and hydrophobic propensities. Most organic solvents are usually volatile, and therefore solution crystallization does not need too-high temperatures; solubility data in a temperature range 0–60 °C is enough for daily use. Thus, the purpose of this work was to accurately determine the solid–liquid equilibrium data of α-LM in 15 pure solvents, including methanol, ethanol, 1-propanol, isopropanol, 1-butanol, 2-butanol, isobutanol, 1-pentanol, isoamylol, 1-hexanol, 1-heptanol, 1-octanol, propanoic acid, acetonitrile, and cyclohexanone from T = 274.05 to T = 323.05 K at 1 atm. Four thermodynamic phase equilibrium models (Apelblat equation, λh equation, NRTL model, and Wilson model) were used to correlate the experimental data. The relationship between the solubility of α-LM and the selected solvent parameters was analyzed by the KAT-LSER model. The dissolution enthalpy, entropy, and Gibbs free energy of α-LM in these solvents would be determined.
2. Experimental Section
2.1. Materials
The α-LM with a purity of 0.990 in the mass fraction was purchased from Sigma-Aldrich (St. Louis, MO, USA) and used without further purification, and the relevant information on the selected solvents has been listed in Table 1. All solvents were also used without further purification. The detailed information on the materials used in the present work was shown in Table 1.
2.2. Characterization
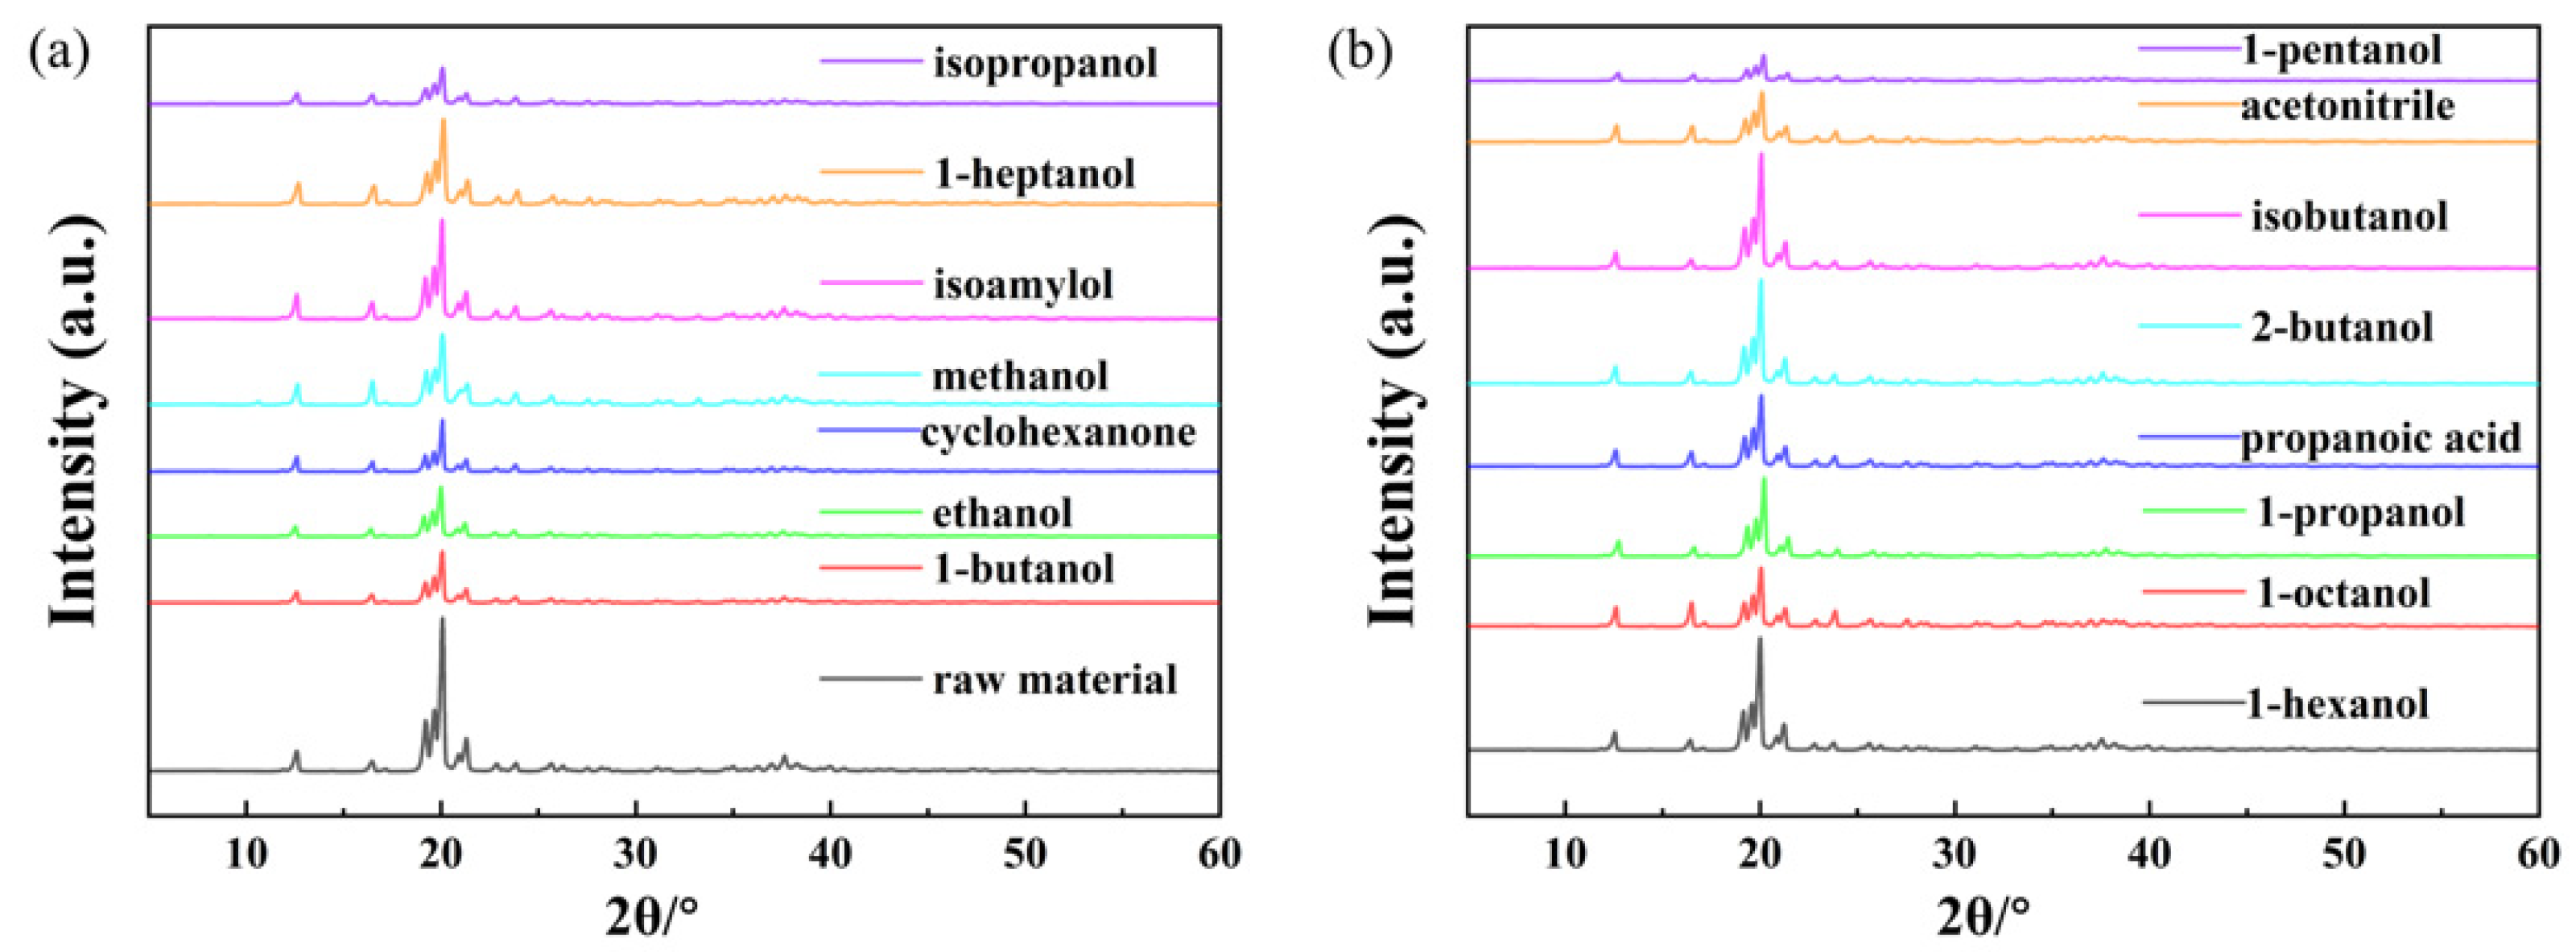
X-ray powder diffractometer (XRD) was used to verify the crystal forms of α-LM during the experiments, and the tests were carried out using a D-max 2000 VPC diffractometer with Cu Kα radiation (Rigaku, Tokyo, Japan). The diffraction angle is 5~60° with the scanning step of 0.02°. The characteristic peaks of XRD spectrum were located by using MDI Jade 6 software (Materials Data, Inc., Livermore, CA, USA).
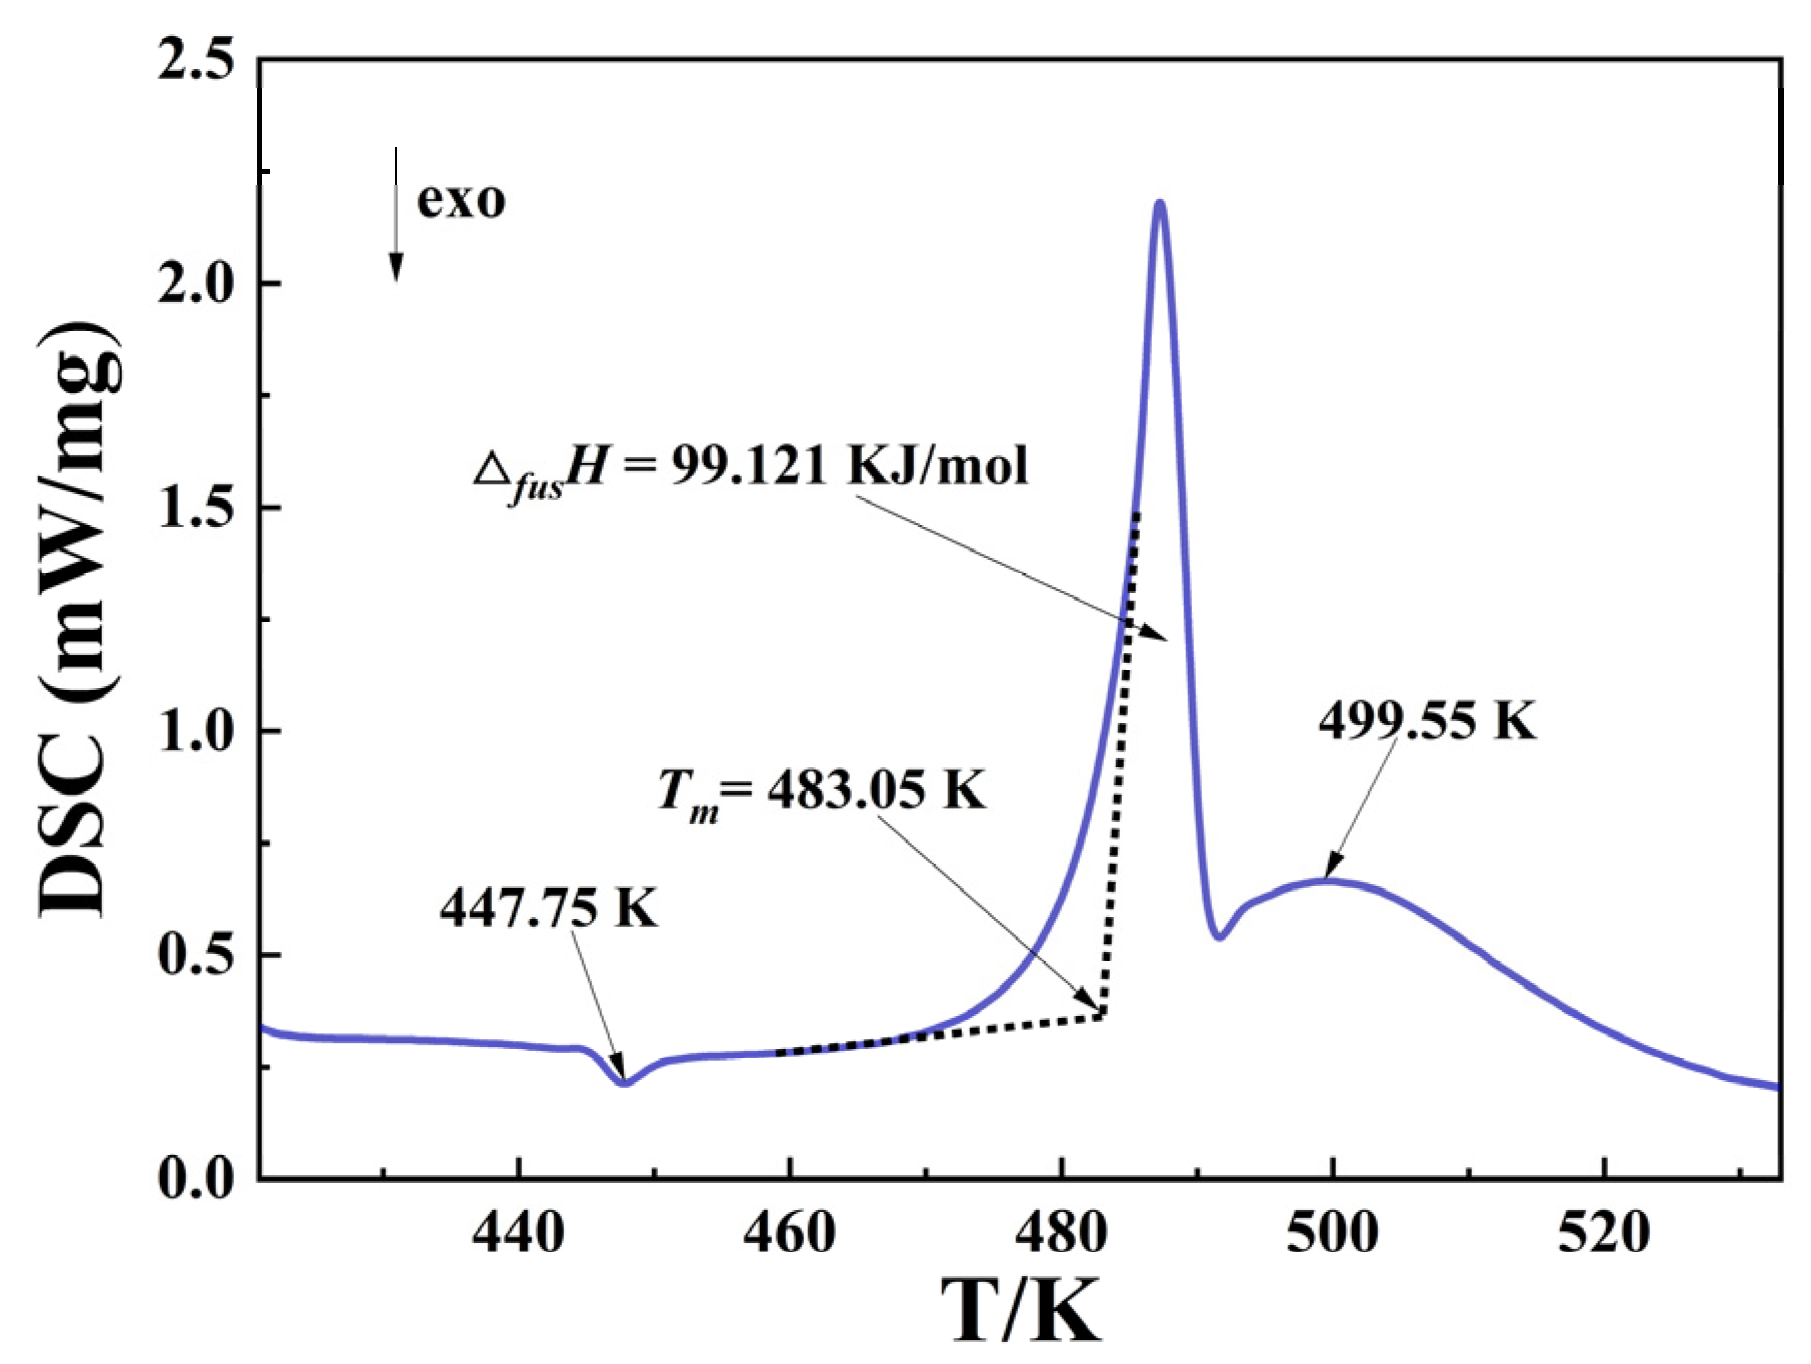
The melting temperature (Tm) and fusion entropy (ΔfusH) of α-LM were determined by a differential scanning calorimeter (DSC F204 Phoenix, Netzsch, Selb, Germany) under a nitrogen atmosphere. About 7 mg sample was put in a DSC pan and heated from 423.15 K to 533.15 K with a heating rate of 5 K/min. The measurement was repeated three times. The three replicate DSC measurements were taken from the purchased raw material samples and carried out separately.
2.3. Solubility Measurements
The solubility of α-LM was carried out in 15 mono-solvents (methanol, ethanol, 1-propanol, isopropanol, 1-butanol, 2-butanol, isobutanol, 1-pentanol, isoamylol, 1-hexanol, 1-heptanol, 1-octanol, propanoic acid, acetonitrile, and cyclohexanone) from 274.05 K to 323.05 K according to [19]. For the method, excess α-LM was added to a 250 mL jacketed glass vessel containing about 100 mL of the above solvent. Then, the mixture solution was continuously stirred by a magnetic agitator (HJ-1, Anhui Haixin, China) and the solute was added at regular intervals to ensure that there were always visible solids in the solution. The temperature was kept at a required value by the smart refrigerated and heating circulators with an accuracy of ±0.01 K (FP 51, JULABO, Seelbach, Germany). The actual solution temperature was measured by a calibrated mercury thermometer with an accuracy of ±0.01 K. The mass of α-LM dissolved in unit mass supernatant was measured every hour until the figure accounted to two decimal places maintained unchanged to find out the dissolution equilibrium time. The magnetic agitator was turned off and settled for 7 h at the same temperature and the residual solids were sampled for XRD measurement after drying. Subsequently, the supernatant was filtered and transferred to a pre-weighed weighing bottle (m1) by a preheated syringe equipped with a 0.45 μm filter. Then, the total weight of the bottle and solution was measured quickly (m2). The saturated solution was placed in a vacuum oven at 313.15 K until the weight of the sample was constant (m3). All the above samples were weighed by an analytical balance with an accuracy of ±0.0001 g (Mettler Toledo AL204, Nänikon, Switzerland). To ensure accuracy, all experiments were tested three times and the arithmetic average value was used to calculate the solubility of α-LM.
The mole fraction solubility (x1) of α-LM was calculated by Equation (1):
where mA = m3 − m1, is the mass of α-LM; mB = m2 − m3 is the mass of the solvent; MA and MB are the molecular weights of α-LM and the solvent, respectively.
3. Thermodynamic Models
The theories of correlation phase equilibrium data mainly include empirical model, state equation model, and activity coefficient model. The state equation model is usually too complicated because of the choice of mixing rules, which requires a large number of thermodynamic parameters in the calculation process, and is seldom used in the actual process. Therefore, this work chose the practical empirical model (Apelblat equation and λh equation) and activity coefficient model (NRTL model and Wilson model) to correlate solubility, which were used to correctly predict the saturation concentration of solute under different conditions.
3.1. Apelblat Equation
The Apelblat equation is a semi-empirical model with three parameters, which can be used to describe the general relationship between solubility and temperature [20,21,22]. It can be expressed as Equation (2). The Apelblat equation is suitable for interpolation, but does not have the function of extrapolation. Because the model is simple and the number of model parameters is small, if the model is used to correlate and predict the system with a wide range of solubility values, the deviation of the results will increase.
where x1 is the mole fraction solubility of α-LM; T is the absolute temperature; A, B, and C are adjustable constants; C demonstrates the effect of temperature on the fusion enthalpy.
3.2. λh Equation
The λh equation is another empirical model with two parameters (λ and h) proposed by Buchowski et al. in 1981, which can be used to describe the relationship between solubility and temperature [23]. The model is suitable for studying the solvent activity along a saturation line and solubility of hydrogen-bonding solids [24], and the equation can be expressed as Equation (3). When dealing with multicomponent systems, two parameters are still maintained. Good results can also be obtained by treating mixed solvents as virtual unitary solvents. However, it is difficult to use the solubility data of pure solvents to predict the solubility behavior of multicomponent systems.
Herein, x1 is the mole fraction solubility of α-LM; T and Tm are the absolute temperature and melting temperature of the solute, respectively; λ and h are the two parameters of the λh equation, which reflect the non-ideality of the solution and enthalpy of the solution, respectively.
3.3. NRTL Model
Based on the solid–liquid phase equilibrium theory proposed by Renon et al. and the concept of local composition, the NRTL model is used to describe the fluid phase equilibrium and calculate the activity coefficient of the solute [25,26,27]. Based on the activity coefficient model, the simplified equation can be described as Equation (4). The NRTL model can be applied to partially miscible and immiscible systems. Compared with other thermodynamic models, the regression parameters of NRTL model need a large amount of work, and sometimes the parameters can not be steadily extended from room temperature to a wider temperature range. When there is ionization equilibrium, the correlation of model parameters at different temperatures is more complex.
Herein, x1 is the mole fraction solubility of α-LM; γ1 is the activity coefficient of solute; T is the experimental temperature; Tm and ΔfusH are the melting temperature and fusion enthalpy of α-LM, respectively.
The γ1 can be calculated with the NRTL equation, which is expressed as Equations (5)–(8):
Herein, γ1 is the activity coefficient of component i; Δgij is the Gibbs energy of intermolecular interaction; αij is an adjustable constant, which usually varied from 0.2 to 0.47.
For model correlation, it can be assumed that the cross-interaction parameters between solvent and solute (τij) in the NRTL model have a linear relationship with temperature, which can be expressed as Equation (9) [28]:
Herein, aij and bij are equation parameters independent of composition and temperature.
3.4. Wilson Model
Based on the concept of excess free enthalpy GE, the Wilson model can describe the activity coefficient more concretely, which can be expressed as Equations (10)–(12) [29,30]. The model can reflect the effect of temperature on activity coefficient, has semi-theoretical physical meaning, and can predict the behavior of multicomponent systems. However, the Wilson model cannot be applied to the liquid phase stratification system, nor can it reflect the solution characteristics in which the activity coefficient has the highest or lowest value.
Herein, V1 and V2 represent the molar volumes of α-LM and the solvents, respectively; x1 and x2 denote the mole fractions of α-LM and the solvent, respectively; Δλij represents the energy parameters about cross-interactions between i and j components in the dissolution process; Λij represents the binary cross-interaction parameters in the Wilson model, which can be assumed to have a linear relationship with temperature [28]. The Wilson model can be expressed as Equation (13):
Herein, aij and bij are the parameters of the model, which are independent of composition and temperature.
Finally, relative average deviation (RAD) and the root-mean square deviation (RMSD) were used to evaluate the overall correlation effects of the thermodynamic models. The values fitted by the model with smaller RAD or RMSD values mean that they are closer to the experimental values, implying a better model. The two criteria can be described as Equations (14) and (15):
Herein, N represents the number of experimental values; xiexp represents the experimental values; xicalc represents the model fitted solubility values.
Parameters of four thermodynamic models for solubility correlation and KAT-LSER model regression were calculated by 1stOpt software (Professional Version 1.5) using the Levenberg–Marquardt and Universal Global Optimization (LM–UGO) method.
4. Results and Discussion
4.1. XRD Analysis
Different crystal forms can lead to different solubility. The XRD patterns of α-LM raw material and residual solids of α-LM in the selected solvents are displayed in Figure 2. The characteristic peaks of α-LM raw material are located at 12.60°, 16.48°, 19.22°, 19.66°, 20.08°, 20.92°, 21.30°, 23.86°, 26.28°, and 37.64°. The residual α-LM solids in 15 solvents have the same crystal forms as the raw material, implying that there is no polycrystalline transformation of the solids in the dissolution process.
4.2. Melting Properties of α-LM
The melting temperature (Tm) and fusion enthalpy (ΔfusH) were measured by DSC, and the results are shown in Figure 3. An exothermic peak appeared at 447.75 K, which was due to the transformation of amorphous lactose into crystals, and there is still a dehydration peak of α-LM near 418 K that has not been shown according to [31,32]. This is because during the heating process of DSC test, α-LM will preferentially lose the bound H2O molecule to become α-lactose. Therefore, the strong endothermic melting peak in DSC indicates that the melting of α-lactose at 483.05 K is not α-LM with a corresponding standard uncertainty of u (Tm) = 0.5 K. The fusion enthalpy ΔfusH is 99.121 kJ/mol with a relative standard uncertainty of ur (ΔfusH) = 0.05, and the fusion entropy (ΔfusS) of α-lactose is calculated as 205.20 J·mol−1·K−1 with Equation (16).
In addition, a small exothermic peak was also observed at 499.55 K, which may be attributed to solid-state epimerization and melting of the sample powder caused by the heating and dehydration of α-LM, and about 29.1 ± 0.7% of the sample powder was converted into β-lactose at 463.15 K, and the results are following [32,33].
4.3. Solubility Data and Correlation
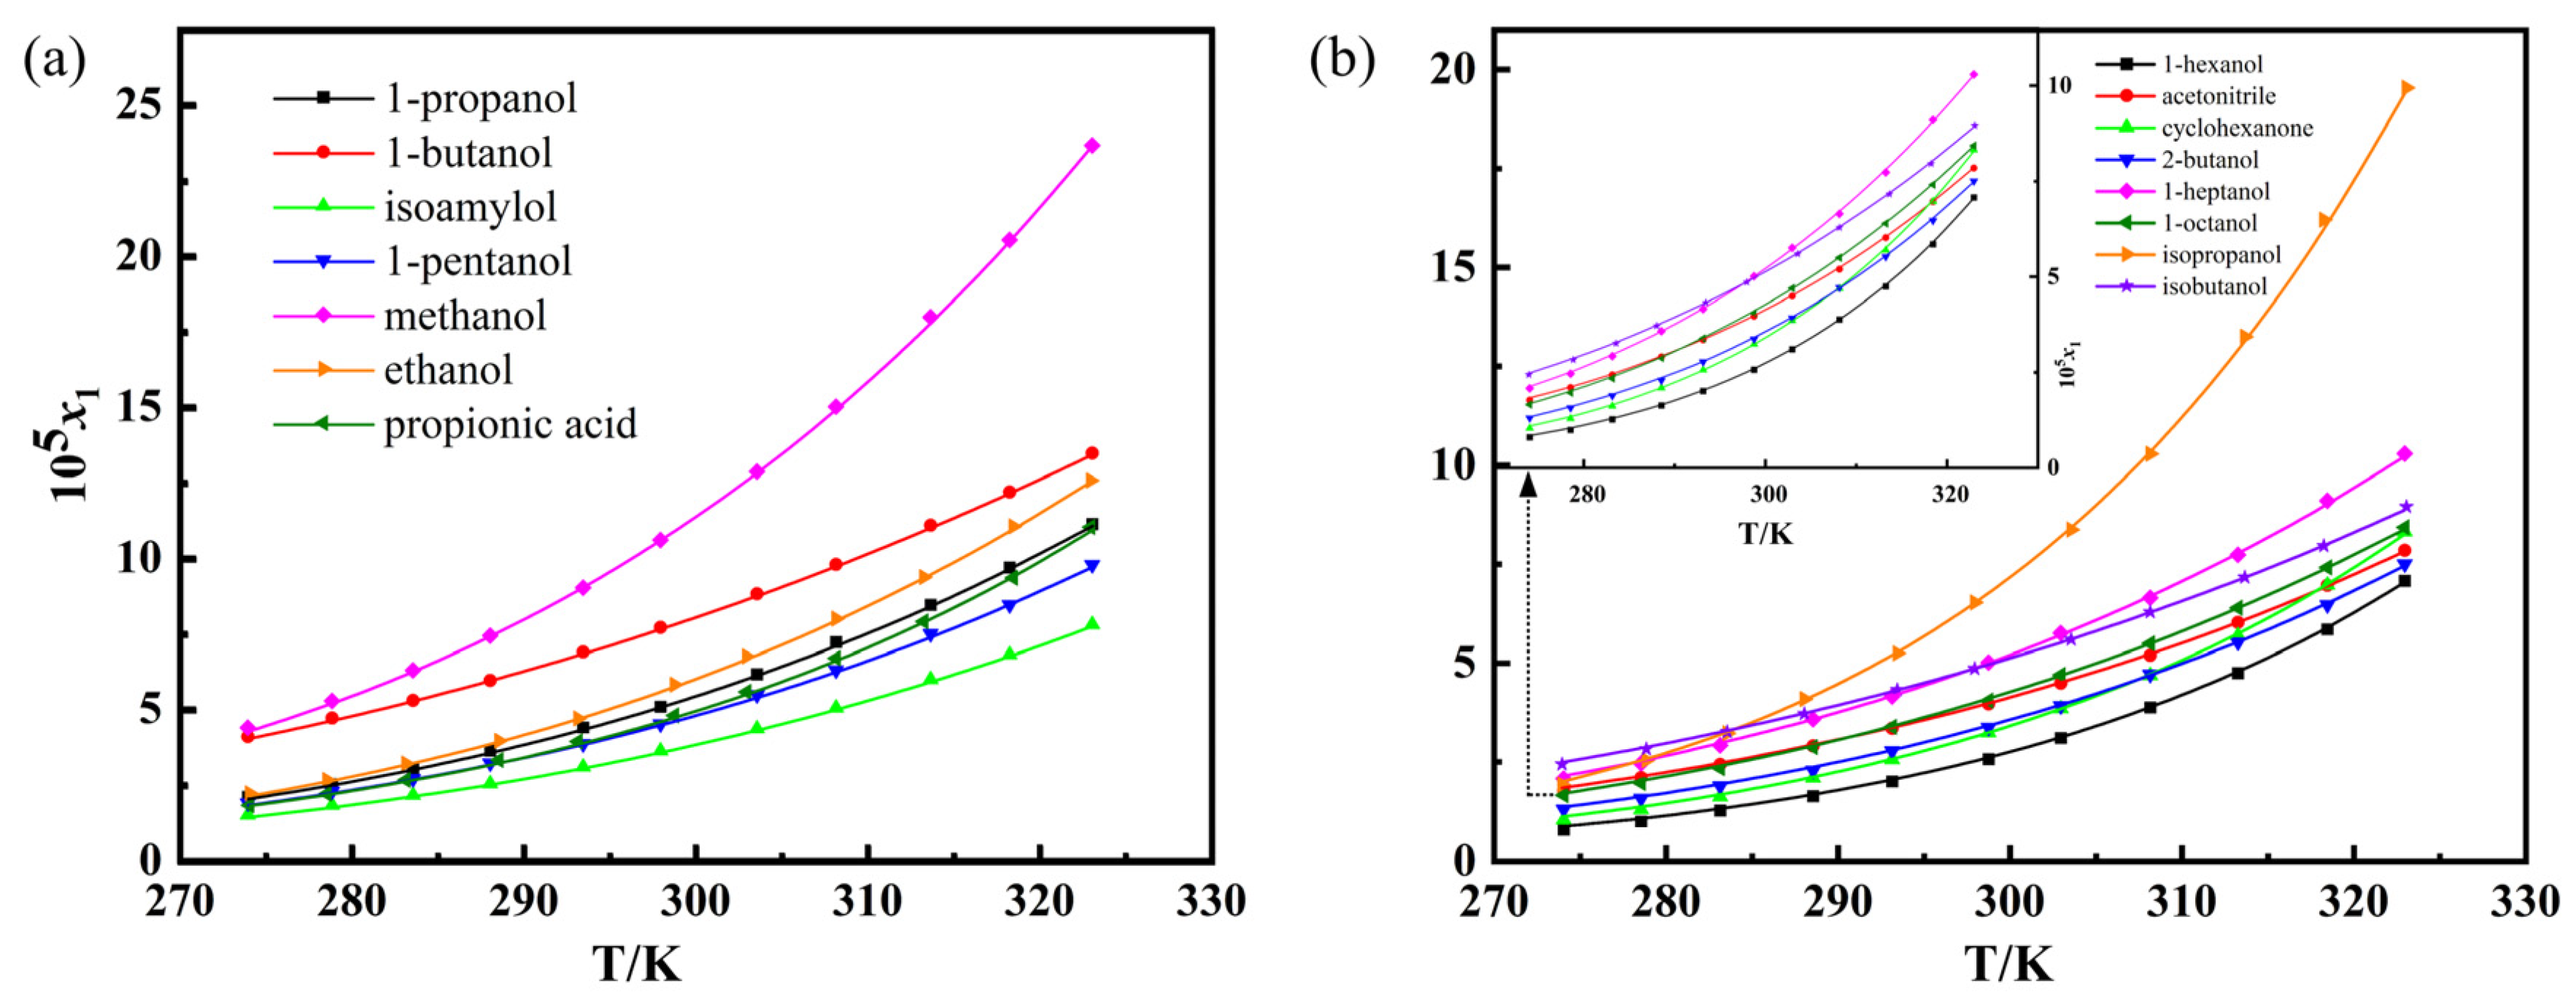
The experimental mole fraction solubility x1exp of α-LM in 1-butanol, ethanol, cyclohexanone, methanol, isoamylol, 1-heptanol, and isopropanol, 1-hexanol, 1-octanol, 1-propanol, propanoic acid, 2-butanol, isobutanol, acetonitrile, and 1-pentanol from 274.05 K to 323.05 K are presented in Table S1. The relationship between temperature and solubility is shown in Figure 4. It can be seen that the solubility of α-LM increased with increasing temperature in the above solvents, implying that the dissolution process is endothermic. The α-LM has the largest solubility in methanol, but the smallest solubility in 1-hexanol.
To evaluate the differences of α-LM solubility in the given solvents, some physical parameters, including polarity index (ET (30)), dipole moments (μ), dielectric constants (ε) and Hansen solubility parameters (δH) are also shown in Table 2. Among them, ET(30) was also widely used to empirically evaluate the polarity of various molecular liquids and ionic liquids as an important parameter to describe the hydrogen bond and electrostatic interaction of solvents [34,35,36]. In this study, the solvents were divided into two groups according to the boundary of the values: ET(30) ≥ 49.0 and ET(30) < 49.0. It can be observed from Figure 4 that the solubility order of α-LM in the strong polar solvents is: methanol (ET(30) = 55.4) > 1-butanol (ET(30) = 49.7) > ethanol (ET(30) = 51.9) > 1-propanol (ET(30) = 50.7) > propionic acid (ET(30) = 55.0) > 1-pentanol (ET(30) = 49.1) > isoamylol (ET(30) = 49.0). In addition, the solubility of α-LM in weak polar solvents decreases in the sequence: isopropanol (above 283.55 K) > isobutanol > 1-heptanol > acetonitrile ≈ 1-octanol > 2-butanol > cyclohexanone > 1-hexanol below 298.15 K and isopropanol > 1-heptanol > isobutanol > 1-octanol > acetonitrile > cyclohexanone (below 318.45 K) ≈ 2-butanol > 1-hexanol above 298.15 K. In addition, the solubility order of α-LM in 15 pure solvents at 298.15 K is: methanol > 1-butanol > isopropanol > ethanol > 1-propanol > 1-heptanol > isobutanol > propionic acid > 1-pentanol > 1-octanol > acetonitrile > isoamylol > 2-butanol > cyclohexanone > 1-hexanol.
Based on the above results in Table S1 and Table 2, the solubility order of α-LM is not in accordance with the order of polarity of solvents, which deviates from the rule of “like dissolves like”. Therefore, the polarity of the solution is not a critical factor that affected the solubility of α-LM, so it is difficult to deduce the phenomenon by a single reason. The solubility of solute is significantly affected by solvent–solvent and solute–solvent interactions [37]. The α-LM contains 8 hydrogen receptor groups (-OH), and hydrogen bonds can be formed between the solute and some solvent molecules. The dissolution of α-LM in different polar solvents can cause various intermolecular forces. In addition, cohesive energy density has been used to describe the binding degree of solvent–solvent [38]. The exact mechanism which led to the complex solubility performance of α-LM is still not clear and more investigation should be performed.
The solubility data of α-LM in different solvents can offer useful information to optimize the crystallization process. In this work, four thermodynamic models were used to correlate the experimental data. The model parameters, including RAD and RMSD, are shown in Table 3, Table 4, Table 5 and Table 6. The average RAD values of the four models were 0.53% (Apelblat), 0.55% (Wilson), 1.11% (λh), and 0.34% (NRTL). The average values of RAD and RMSD of the NRTL model are the lowest among the four models, implying that this model is more suitable for the data correlation.
4.4. Solvent Effect
Kamlet et al. proposed the KAT-LSER model to analyze the solvent effect to describe complex solubility performance, which divided the intermolecular forces into non-specific ones and specific ones [42,43]. The KAT-LSER model can reasonably explain the effect of various physical properties of the solvent on the solute solubility through multiple linear regression correlation of solute solubility data in different pure solvents [44]. The expression of KAT-LSER model can be expressed as Equation (17):
Herein, α and β are the acidity and basicity of hydrogen bonds, respectively; π* is the dipolarity-polarizability of the solvents; δH is the Hansen solubility parameter of some solvents; c0 is a constant, depending on the solute; c1, c2, c3, and c4 are all constants, indicating the influence of the four property parameters of solvents on the solubility of α-LM; Vs = 235.4967 cm3/mol is the molar volume of α-LM; R = 8.314 J/(mol·K) is the molar gas constant; x is the solubility of α-LM at T; T is the experimental temperature around 298.15 K.
The values of α, β, π* and δH of fourteen solvents used in the correlation of KAT-LSER model are listed in Table 3. Multiple linear regression analysis was used to correlate the solubility data of α-LM with the property parameters of solvents according to Equation (17), and the correlation result is shown in Equation (18).
Herein, n is the number of solvents used, except 1-heptanol. For the regression effect, R2 is the square of the correlation coefficient; RMSD is the root-mean square deviation; RSS is the residual sum of squares; χ2 is the value of the Chi-Squared test. These indicators show a reliable result.
In the fitted KAT-LSER model, c0 = −11.4635, indicating that the dissolution process of α-LM needs to overcome the strong crystal lattice cohesion energy, so it is difficult to dissolve. However, c1, c2, and c3 are all positive (c1 = 0.2313, c2 = 0.1419, c3 = 1.5897), implying that the solubility of α-LM increases with the rising of hydrogen bond donation ability, electron pair donation ability, and polarity of the solvents. Furthermore, the coefficient of δH is positive (c4 = 2.1243), which indicates that the solvent hydrogen bonding cohesion (Hansen solubility parameter) is the most beneficial to the dissolution of α-LM. In the solvent effect distribution ratio, the four parameters α, β, π*, and δH are 1.49%, 0.91%, 10.22%, and 13.66%, respectively. The total distribution proportion of the solvent effect is 26.28%. As a result, the properties of α-LM have a more significant effect than the properties of solvents, which can explain the low solubility of α-LM in this study.
4.5. Thermodynamic Properties of Dissolution
The calculation of the thermodynamics of the dissolution of α-LM in selected solvents will guide its production applications, and the dissolution thermodynamic properties were described by the changes of Gibbs energy (G), enthalpy (S), and entropy (H) of the α-LM in the dissolution process. Such as ΔdisH can help to determine the energy exchanged in the crystallization system, ΔdisS can help to determine the degree of confusion in the system, ΔdisG can help to determine the difficulty of spontaneity and driving force of the process, which can be described as four stages: heating, melting, cooling, and mixing [45,46], expressed as Equation (19).
Herein, x is the mole fraction of α-LM in a pure solvent; M can be considered as Gibbs energy (G), entropy (S), and enthalpy (H). The values of S and H in the heating (heatM) and cooling (coolM) process are lower than those in the fusion (fusM) process, so they can be ignored in the calculation of dissolution properties [46].
According to the Lewis–Randall law, the real thermodynamic properties of mixed solutions were composed of ideal mixing properties and excess thermodynamic properties, which can be expressed by Equation (20) [47]:
Herein, M can be S, H, and G, representing entropy, enthalpy, and Gibbs energy, respectively; ME represents the excess property; ΔmixMid is the thermodynamic property of mixing in the ideal solution, which can be calculated as Equations (21)–(23), respectively [19,48].
Herein, x1 and x2 are the mole fraction of α-LM and the solvent, respectively; ΔmixS id, ΔmixH id, and ΔmixG id refer to the mixing entropy, enthalpy, and Gibbs energy of the deal solution, respectively.
The excess mixing property (SE, HE, and GE) can be calculated as Equations (24)–(26) [49,50], based on the correlation results of the Wilson model.
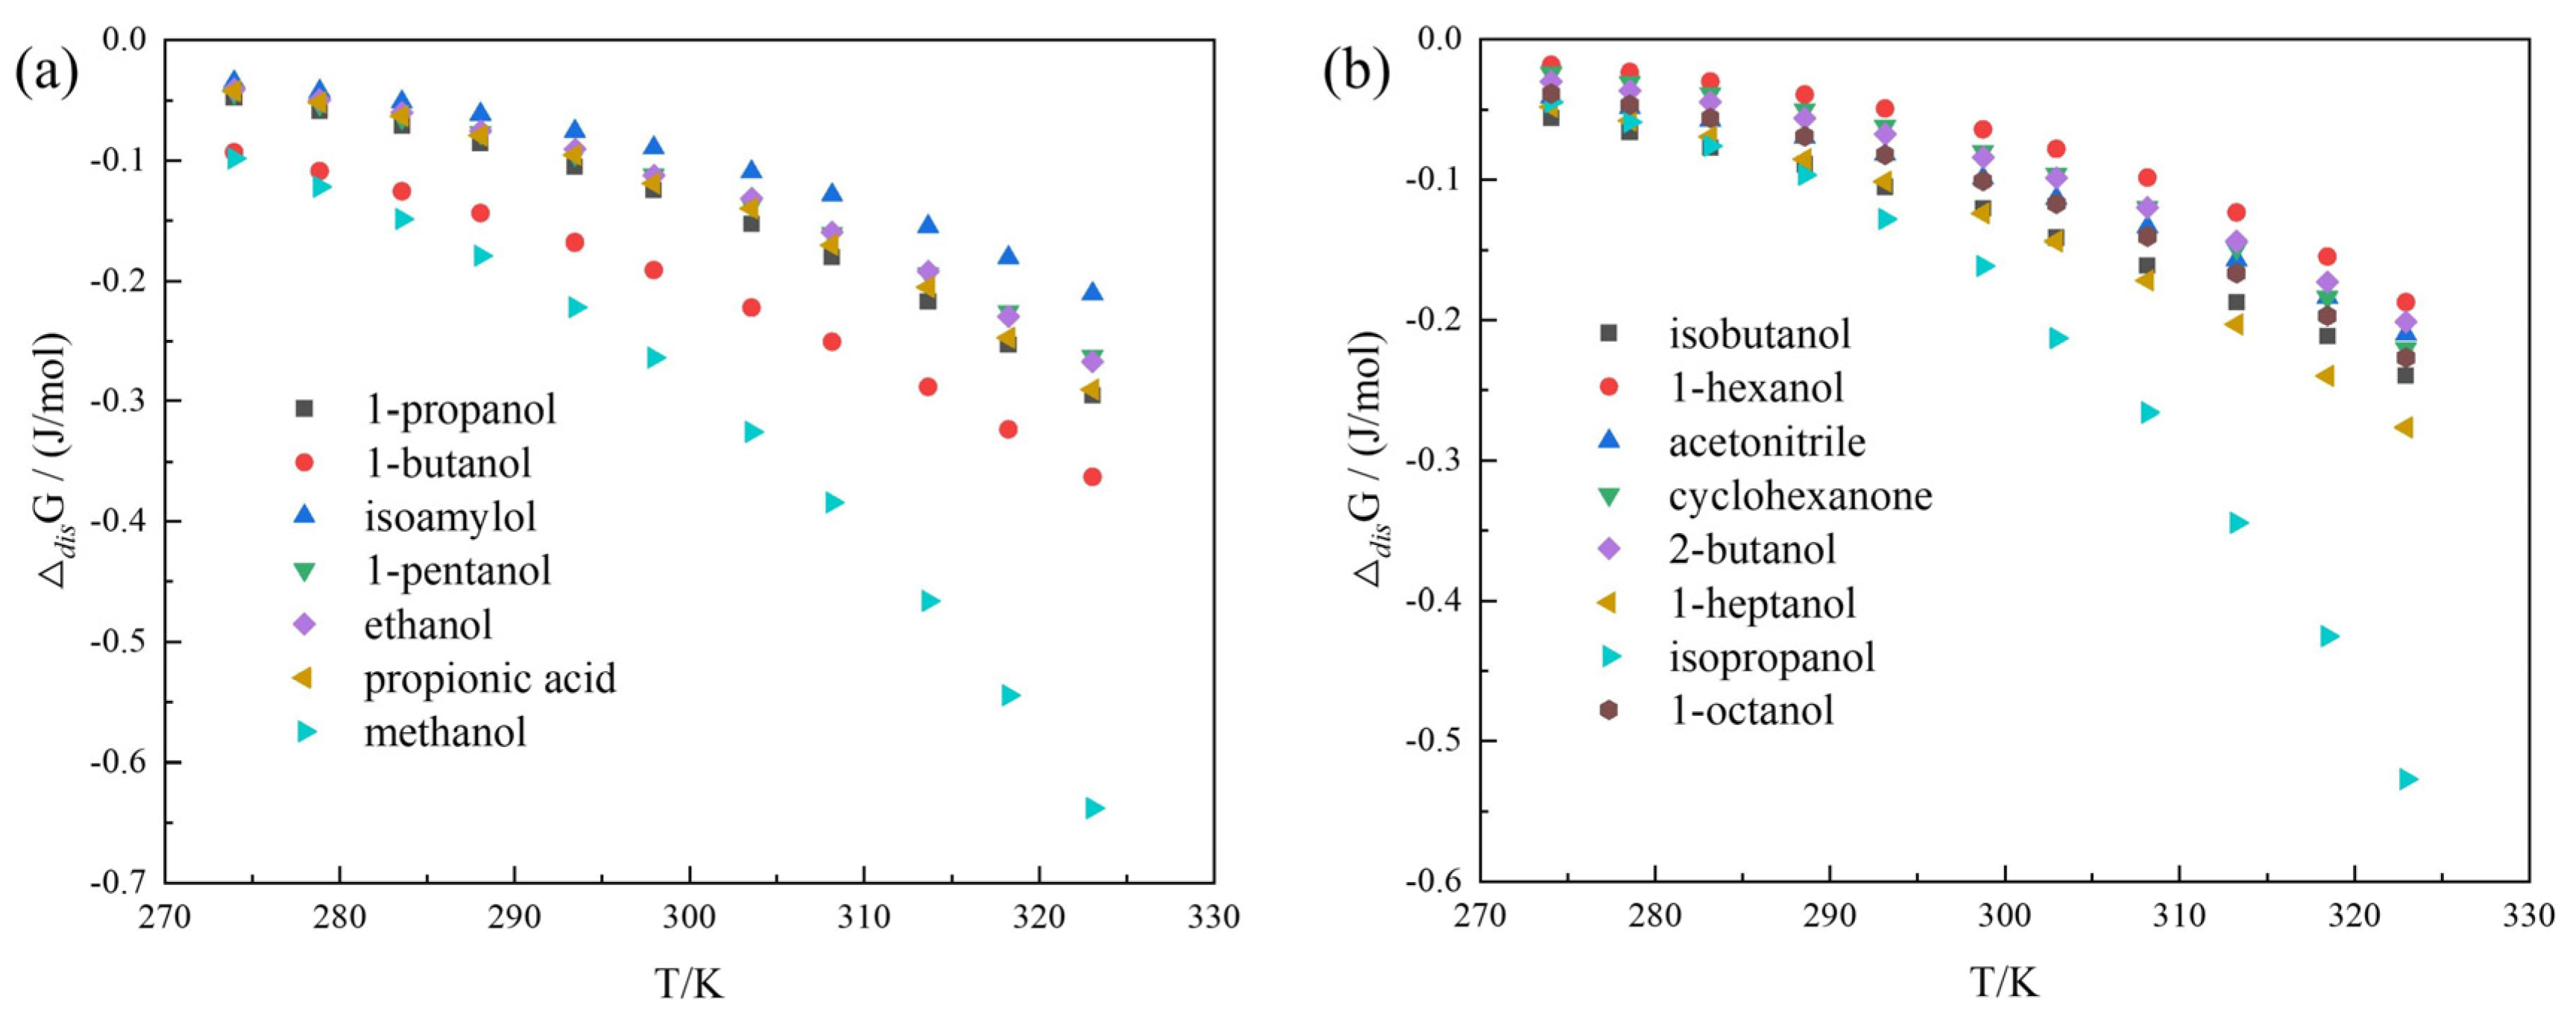
Based on the experimental solubility data and the fitted parameters of the Wilson model, the values of dissolution properties (ΔdisH, ΔdisS and ΔdisG) of α-LM in 15 mono-solvents from 274.05 to 323.05 K were calculated and are listed in Table S2. Positive values of ΔdisH demonstrate that the dissolution of α-LM is endothermic in selected 15 mono-solvents, and the positive values of ΔdisS are the degree of confusion, indicating that the dissolution process of α-LM is entropy-driven. In addition, the higher the solubility of α-LM, the higher are the values of ΔdisH and ΔdisS, which indicates that the heat absorption and entropy increase are also increased during the dissolution of the corresponding solvent. The dissolution of α-LM in these 15 mono-solvents is driven by both heat and entropy. The ΔdisG of α-LM in 15 mono-solvents are all negative, and the higher the dissolution temperature is, the lower the value is and the greater the decline rate is, implying that the dissolution process of α-LM is spontaneous and favorable for high temperature. Moreover, Figure 5 shows the ΔdisG of α-LM in 15 solvents. By comparison with Figure 4, it can be seen that the decreasing order of ΔdisG values in different pure solvents with temperature is the same as that of their solubility increasing with temperature. This shows that both theoretical calculation and experiment section are reliable.
5. Conclusions
In this work, the solubility of α-LM in 15 pure solvents, namely methanol, ethanol, 1-propanol, isopropanol, 1-butanol, 2-butanol, isobutanol, 1-pentanol, isoamylol, 1-hexanol, 1-heptanol, 1-octanol, propanoic acid, acetonitrile, and cyclohexanone, was measured in the temperature range of 274.05 K to 323.05 K under atmospheric pressure by a static gravimetric method. The solubility of α-LM in all selected solvents increased with increasing temperature. At the given temperature, the solubility of α-LM in methanol was the highest and that in 1-hexanol was the lowest. Four thermodynamic models including the Apelblat equation, λh equation, NRTL model and Wilson model were used to correlate the experimental data. The fitting values of the above models were close to the experimental values, and the NRTL model provided the best fitting results. The solvent effect showed that hydrogen bond donation ability, electron pair donation ability, and polarity of the solvents were beneficial for the dissolution of α-LM. In addition, the dissolution thermodynamics (ΔdisH, ΔdisS, and ΔdisG) were calculated. The ΔdisH and ΔdisS were positive, but ΔdisG was negative, implying that the dissolution process was endothermic, entropy-driven, and spontaneous. The effect of the dissolution process of α-LM is important to its recrystallization and purification.
Supplementary Materials
The following supporting information can be downloaded at: https://0-www-mdpi-com.brum.beds.ac.uk/article/10.3390/pharmaceutics14091774/s1, Table S1: Experimental and Model Fitted Solubility of α-LM in 15 Solvents (P = 0.1 MPa); Table S2: Dissolution Thermodynamic Properties of α-LM in 15 Solvents.
Author Contributions
Conceptualization, Y.G., K.W., Z.Y. and H.J.; data curation, Y.G., K.W. and Z.Y.; formal analysis, Y.G. and K.W.; funding acquisition, K.W., Z.Y. and H.J.; investigation, Y.G., Z.Y. and Y.G.; methodology, Y.G.; project administration, Y.G., Z.Y. and H.J.; resources, Z.Y. and H.J.; software, Y.G.; supervision, Z.Y. and H.J.; validation, Z.Y. and H.J.; visualization, Y.G.; writing—original draft, Y.G. and K.W.; writing—review and editing, Y.G. and H.J. All authors have read and agreed to the published version of the manuscript.
Funding
The work was supported by the National Natural Science Foundation of China (21961160741, 21808247), Guangdong Basic and Applied Basic Research Foundation (2021A1515010260), Natural Science Foundation of Guangdong Province (2020A1515010609), and Doctoral Foundation of Jinggangshan University (JZB2007).
Institutional Review Board Statement
Not applicable.
Informed Consent Statement
Not applicable.
Data Availability Statement
Not applicable.
Conflicts of Interest
The authors declare no conflict of interest.
References
- Kougoulos, E.; Marziano, I.; Miller, P.R. Lactose particle engineering: Influence of ultrasound and anti-solvent on crystal habit and particle size. J. Cryst. Growth 2010, 312, 3509–3520. [Google Scholar] [CrossRef]
- Singh, R.; Shah, B.; Nielsen, S.; Chambers, J. α-Lactose Monohydrate from Ultrafiltered Whey Permeate in One-step Crystallization Using Ethanol-Water Mixtures. J. Food Sci. 2006, 56, 777–781. [Google Scholar] [CrossRef]
- Lara-Mota, E.E.; Nicolás–Vázquez, M.I.; López-Martínez, L.A.; Espinosa-Solis, V.; Cruz-Alcantar, P.; Toxqui-Teran, A.; Saavedra-Leos, M.Z. Phenomenological study of the synthesis of pure anhydrous β-lactose in alcoholic solution. Food Chem. 2021, 340, 128054. [Google Scholar] [CrossRef]
- Pawar, N.; Agrawal, S.; Methekar, R. Continuous Antisolvent Crystallization of α-Lactose Monohydrate: Impact of Process Parameters, Kinetic Estimation, and Dynamic Analysis. Org. Process Res. Dev. 2019, 23, 2394–2404. [Google Scholar] [CrossRef]
- MacFhionnghaile, P.; Svoboda, V.; McGinty, J.; Nordon, A.; Sefcik, J. Crystallization Diagram for Antisolvent Crystallization of Lactose: Using Design of Experiments to Investigate Continuous Mixing-Induced Supersaturation. Cryst. Growth Des. 2017, 17, 2611–2621. [Google Scholar] [CrossRef]
- Pawar, N.; Methekar, R.; Agrawal, S. Modeling, Simulation, and Parameter Estimation of Antisolvent Crystallization of α-Lactose Monohydrate. In Global Challenges in Energy and Environment; Springer: Singapore, 2020; pp. 99–107. [Google Scholar]
- Raghavan, S.L.; Ristic, R.I.; Sheen, D.B.; Sherwood, J.N.; Trowbridge, L.; York, P. Morphology of Crystals of α-Lactose Hydrate Grown from Aqueous Solution. J. Phys. Chem. B 2000, 104, 12256–12262. [Google Scholar] [CrossRef]
- Altamimi, M.J.; Wolff, K.; Nokhodchi, A.; Martin, G.P.; Royall, P.G. Variability in the α and β anomer content of commercially available lactose. Int. J. Pharm. 2019, 555, 237–249. [Google Scholar] [CrossRef]
- Jiang, T.; Yan, S.; Zhang, S.; Yin, Q.; Chen, X.; Wu, W. Uniform lactose microspheres with high crystallinity fabricated by micro-fluidic spray drying technology combined with post-treatment process. Powder Technol. 2021, 392, 690–702. [Google Scholar] [CrossRef]
- Khaire, R.A.; Gogate, P.R. Understanding the role of different operating modes and ultrasonic reactor configurations for improved sonocrystallization of lactose. Chem. Eng. Process. 2021, 159, 108212. [Google Scholar] [CrossRef]
- Gajendragadkar, C.N.; Gogate, P.R. Ultrasound assisted intensified recovery of lactose from whey based on antisolvent crystallization. Ultrason. Sonochem. 2017, 38, 754–765. [Google Scholar] [CrossRef]
- Rachah, A.; Noll, D.; Espitalier, F.; Baillon, F. Control of solvated crystallisation of α-lactose monohydrate. Int. J. Math. Model. Numer. Optim. 2015, 6, 159. [Google Scholar] [CrossRef]
- López-Pablos, A.L.; Leyva-Porras, C.C.; Silva-Cázares, M.B.; Longoria-Rodríguez, F.E.; Pérez-García, S.A.; Vértiz-Hernández, Á.A.; Saavedra-Leos, M.Z. Preparation and Characterization of High Purity Anhydrous β-Lactose from α-Lactose Monohydrate at Mild Temperature. Int. J. Polym. Sci. 2018, 2018, 5069063. [Google Scholar] [CrossRef]
- Majd, F.; Nickerson, T.A. Effect of Alcohols on Lactose Solubility. J. Dairy Sci. 1976, 59, 1025–1032. [Google Scholar] [CrossRef]
- Choscz, C.; Held, C.; Eder, C.; Sadowski, G.; Briesen, H. Measurement and Modeling of Lactose Solubility in Aqueous Electrolyte Solutions. Ind. Eng. Chem. Res. 2019, 58, 20797–20805. [Google Scholar] [CrossRef]
- Machado, J.J.B.; Coutinho, J.A.; Macedo, E.A. Solid–liquid equilibrium of α-lactose in ethanol/water. Fluid Phase Equilib. 2000, 173, 121–134. [Google Scholar] [CrossRef]
- Lide, D.R. CRC Handbook of Chemistry and Physics, 87th ed.; CRC Press: Boca Raton, FL, USA, 2006. [Google Scholar]
- Vogel’s Textbook of Practical Organic Chemistry, 5th ed.; Addison-Wesley Longman Ltd.: Boston, MA, USA, 2013.
- Wu, K.; Guan, Y.; Yang, Z.; Ji, H. Solid–Liquid Phase Equilibrium of Isophthalonitrile in 16 Solvents from T = 273.15 to 324.75 K and Mixing Properties of Solutions. J. Chem. Eng. Data 2021, 66, 4442–4452. [Google Scholar] [CrossRef]
- Apelblat, A.; Manzurola, E. Solubilities of o-acetylsalicylic, 4-aminosalicylic, 3,5-dinitrosalicylic, and p-toluic acid, and magnesium-DL-aspartate in water from T = (278 to 348) K. J. Chem. Thermodyn. 1999, 31, 85–91. [Google Scholar] [CrossRef]
- Apelblat, A.; Manzurola, E. Solubilities of L-aspartic, DL-aspartic, DL-glutamic, p-hydroxybenzoic, o-anistic, p-anisic, and itaconic acids in water from T = 278 K to T = 345 K. J. Chem. Thermodyn. 1997, 29, 1527–1533. [Google Scholar] [CrossRef]
- Ahmad, A.; Raish, M.; Alkharfy, K.M.; Alsarra, I.A.; Khan, A.; Ahad, A.; Jan, B.L.; Shakeel, F. Solubility, solubility parameters and solution thermodynamics of thymoquinone in different mono solvents. J. Mol. Liq. 2018, 272, 912–918. [Google Scholar] [CrossRef]
- Buchowski, H.; Ksiazczak, A.; Pietrzyk, S. Solvent activity along a saturation line and solubility of hydrogen-bonding solids. J. Phys. Chem. 1980, 84, 975–979. [Google Scholar] [CrossRef]
- Kodide, K.; Asadi, P.; Thati, J. Solubility and Thermodynamic Modeling of Sulfanilamide in 12 Mono Solvents and 4 Binary Solvent Mixtures from 278.15 to 318.15 K. J. Chem. Eng. Data 2019, 64, 5196–5209. [Google Scholar] [CrossRef]
- Renon, H.; Prausnitz, J.M. Local compositions in thermodynamic excess functions for liquid mixtures. AIChE J. 1968, 14, 135–144. [Google Scholar] [CrossRef]
- Wang, Z.; Zhou, G.; Dong, J.; Li, Z.; Ding, L.; Wang, B. Measurement and correlation of the solubility of antipyrine in ten pure and water + ethanol mixed solvents at temperature from (288.15 to 328.15) K. J. Mol. Liq. 2018, 268, 256–265. [Google Scholar] [CrossRef]
- Liu, B.; Asadzadeh, B.; Yan, W. Solubility Determination and Modeling of EGCG Peracetate in 12 Pure Solvents at Temperatures from 278.15 to 318.15 K. J. Chem. Eng. Data 2019, 64, 5218–5224. [Google Scholar] [CrossRef]
- Shao, D.; Yang, Z.; Zhou, G. Solubility Determination of 1,5-Naphthalenediamine and 1,8-Naphthalenediamine in Different Solvents and Mixing Properties of Solutions. J. Chem. Eng. Data 2019, 64, 1770–1779. [Google Scholar] [CrossRef]
- Wilson, G.M. Vapor-Liquid Equilibrium.XI. New expression for excess free energy of mixing. J. Am. Chem. Soc. 1964, 86, 127–130. [Google Scholar] [CrossRef]
- Kuang, W.; Ji, S.; Wang, X.; Liao, A.; Lan, P.; Zhang, J. Solid–Liquid Equilibrium of Lamotrigine in 12 Pure Solvents from T = 283.15 to 323.15 K: Experimental Determination and Thermodynamic Modeling. J. Chem. Eng. Data 2020, 65, 169–176. [Google Scholar] [CrossRef]
- Figura, L.O. The physical modification of lactose and its thermoanalytical identification. Thermochim. Acta 1993, 222, 187–194. [Google Scholar] [CrossRef]
- GombÁs, Á.; Szabó-Révész, P.; Kata, M.; Regdon, G.; Erős, I. Quantitative Determination of Crystallinity of α-Lactose Monohydrate by DSC. J. Therm. Anal. Calorim. 2002, 68, 503–510. [Google Scholar] [CrossRef]
- Alzoubi, T.; Martin, G.P.; Barlow, D.J.; Royall, P.G. Stability of α-lactose monohydrate: The discovery of dehydration triggered solid-state epimerization. Int. J. Pharm. 2021, 604, 120715. [Google Scholar] [CrossRef]
- Marcus, Y. The Properties of Organic Liquids That Are Relevant to Their Use as Solvating Solvents. Chem. Soc. Rev. 1993, 22, 409–416. [Google Scholar] [CrossRef]
- Cerón-Carrasco, J.P.; Jacquemin, D.; Laurence, C.; Planchat, A.; Reichardt, C.; Sraïdi, K. Solvent polarity scales: Determination of new ET(30) values for 84 organic solvents. J. Phys. Org. Chem. 2014, 27, 512–518. [Google Scholar] [CrossRef]
- Spange, S.; Lienert, C.; Friebe, N.; Schreiter, K. Complementary interpretation of ET(30) polarity parameters of ionic liquids. Phys. Chem. Chem. Phys. 2020, 22, 9954–9966. [Google Scholar] [CrossRef]
- Wu, K.; Li, Y.J. Solid–Liquid Equilibrium of Azacyclotridecan-2-one in 15 Pure Solvents from T = 273.15 to 323.15 K: Experimental Determination and Thermodynamic Modeling. J. Chem. Eng. Data 2019, 64, 1640–1649. [Google Scholar] [CrossRef]
- Gu, C.-H.; Li, H.; Gandhi, R.B.; Raghavan, K. Grouping solvents by statistical analysis of solvent property parameters: Implication to polymorph screening. Int. J. Pharm. 2004, 283, 117–125. [Google Scholar] [CrossRef] [PubMed]
- Marcus, Y. The Properties of Solvents; John Wiley & Sons Ltd.: Chichester, UK, 1998. [Google Scholar]
- Smallwood, I.M. Handbook of Organic Solvent Properties; Wiley: New York, NY, USA, 1996. [Google Scholar]
- Hansen, C.M. Hansen Solubility Parameters: A User’s Handbook, 2nd ed.; CRC Press: Boca Raton, FL, USA, 2007. [Google Scholar]
- Kamlet, M.; Abboud, J.-L.; Abraham, M.; Taft, R. Linear solvation energy relationships. 23. A comprehensive collection of the solvatochromic parameters,.pi.*,.alpha., and. beta., and some methods for simplifying the generalized solvatochromic equation. J. Org. Chem. 1983, 48, 2877–2887. [Google Scholar] [CrossRef]
- Taft, R.W.; Abraham, M.H.; Famini, G.R.; Doherty, R.M.; Abboud, J.-L.M.; Kamlet, M.J. Solubility Properties in Polymers and Biological Media 5: An Analysis of the Physicochemical Properties Which Influence Octanol–Water Partition Coefficients of Aliphatic and Aromatic Solutes. J. Pharm. Sci. 1985, 74, 807–814. [Google Scholar] [CrossRef]
- Zheng, M.; Farajtabar, A.; Zhao, H. Solubility of 4-amino-2,6-dimethoxypyrimidine in aqueous co-solvent mixtures revisited: Solvent effect, transfer property and preferential solvation analysis. J. Mol. Liq. 2019, 288, 111033. [Google Scholar] [CrossRef]
- Delgado, D.R.; Romdhani, A.; Martínez, F. Solubility of sulfamethizole in some propylene glycol+water mixtures at several temperatures. Fluid Phase Equilib. 2012, 322-323, 113–119. [Google Scholar] [CrossRef]
- Wang, Y.; Liu, Y.; Xu, S.; Liu, Y.; Yang, P.; Du, S.; Yu, B.; Gong, J. Determination and modelling of troxerutin solubility in eleven mono-solvents and (1,4-dioxane+2-propanol) binary solvents at temperatures from 288.15Kto 323.15K. J. Chem. Thermodyn. 2017, 104, 138–149. [Google Scholar] [CrossRef]
- Wang, J.; Yuan, X.; Jaubert, J.-N. 4-Chloro-2-nitroaniline Solubility in Several Pure Solvents: Determination, Modeling, and Solvent Effect Analysis. J. Chem. Eng. Data 2020, 65, 222–232. [Google Scholar] [CrossRef]
- Xu, R.; Xu, A.; Du, C.; Yang, C.; Jian, W. Solubility determination and thermodynamic modeling of 2,4-dinitroaniline in nine organic solvents from T = (278.15 to 318.15)K and mixing properties of solutions. J. Chem. Thermodyn. 2016, 102, 178–187. [Google Scholar] [CrossRef]
- Orye, R.V.; Prausnitz, J.M. Multicomponent Equilibria—The Wilson Equation. Ind. Eng. Chem. Res. 1965, 57, 18–26. [Google Scholar] [CrossRef]
- Jia, Z.; Yin, H.; Zhao, Y.; Zhao, H. Solubility of 3-Bromo-4-Hydroxybenzaldehyde in 16 Monosolvents at Temperatures from 278.15 to 323.15 K. J. Chem. Eng. Data 2020, 65, 287–295. [Google Scholar] [CrossRef]
Figure 1.
Structure of α-LM: (a) chemical molecular; (b) ball and stick model.

Figure 2.
X-ray powder diffraction patterns of α-LM in different solvents: (a) the raw material, 1-butanol, ethanol, cyclohexanone, methanol, isoamylol, 1-heptanol, isopropanol; (b) 1-hexanol, 1-octanol, 1-propanol, propanoic acid, 2-butanol, isobutanol, acetonitrile, 1-pentanol.
Figure 2.
X-ray powder diffraction patterns of α-LM in different solvents: (a) the raw material, 1-butanol, ethanol, cyclohexanone, methanol, isoamylol, 1-heptanol, isopropanol; (b) 1-hexanol, 1-octanol, 1-propanol, propanoic acid, 2-butanol, isobutanol, acetonitrile, 1-pentanol.

Figure 3.
DSC plot of α-LM.

Figure 4.
Solubility of α-LM in 15 solvents: (a) (ET(30) ≥ 49.0): 1-propanol, 1-butanol, isoamylol, 1-pentanol, methanol, ethanol, and propionic acid; (b) (ET(30) < 49.0): 1-hexanol, acetonitrile, cyclohexanone, 2-butanol, 1-heptanol, 1-octanol, isopropanol, and isobutanol. The trend lines were fitted with the Apelblat equation.

Figure 5.
ΔdisG of α-LM in 15 solvents: (a) (ET(30) ≥ 49.0): 1-propanol, 1-butanol, isoamylol, 1-pentanol, methanol, ethanol, and propionic acid; (b) (ET(30) < 49.0): 1-hexanol, acetonitrile, cyclohexanone, 2-butanol, 1-heptanol, 1-octanol, isopropanol, and isobutanol.
Figure 5.
ΔdisG of α-LM in 15 solvents: (a) (ET(30) ≥ 49.0): 1-propanol, 1-butanol, isoamylol, 1-pentanol, methanol, ethanol, and propionic acid; (b) (ET(30) < 49.0): 1-hexanol, acetonitrile, cyclohexanone, 2-butanol, 1-heptanol, 1-octanol, isopropanol, and isobutanol.


Table 1.
Detailed information about the materials used.
| Chemicals | CAS No. | Source | Mass Fraction Purity | Analysis Method | Molar Volume c (cm3·mol−1) |
|---|---|---|---|---|---|
| α-LM | 5989-81-1 | Sigma-Aldrich, St. Louis, MO, USA | ≥0.990 | GC a | 235.4967 |
| Methanol | 67-56-1 | Saan Chemical Technology (Shanghai, China) Co., Ltd. | ≥0.995 | GC a | 40.5057 |
| Ethanol | 64-17-5 | Tianjin Kemao Chemical Reagent Co., Ltd. (Tianjin, China) | ≥0.997 | GC a | 58.3904 |
| 1-Propanol | 71-23-8 | Saan Chemical Technology (Shanghai) Co., Ltd. (Shanghai, China) | ≥0.995 | GC a | 75.1188 |
| 1-Butanol | 71-36-3 | Adamas-beta, Shanghai Titan Scientific Co., Ltd. (Shanghai, China) | ≥0.995 | GC a | 91.5062 |
| Isobutanol | 78-83-1 | Saan Chemical Technology (Shanghai) Co., Ltd. (Shanghai, China) | ≥0.990 | GC a | 92.3064 |
| 2-Butanol | 78-92-2 | Saan Chemical Technology (Shanghai) Co., Ltd. (Shanghai, China) | ≥0.990 | GC a | 92.6525 |
| 1-Pentanol | 71-41-0 | Saan Chemical Technology (Shanghai) Co., Ltd. (Shanghai, China) | ≥0.990 | GC a | 106.2048 |
| Isoamylol | 123-51-3 | Saan Chemical Technology (Shanghai) Co., Ltd. (Shanghai, China) | ≥0.990 | GC a | 108.8272 |
| 1-Hexanol | 111-27-3 | Saan Chemical Technology (Shanghai) Co., Ltd. (Shanghai, China) | ≥0.980 | GC a | 125.0610 |
| 1-Heptanol | 111-70-6 | Saan Chemical Technology (Shanghai) Co., Ltd. (Shanghai, China) | ≥0.990 | GC a | 141.3625 |
| 1-Octanol | 111-87-5 | Saan Chemical Technology (Shanghai) Co., Ltd. (Shanghai, China) | ≥0.980 | GC a | 158.0461 |
| Propanoic Acid | 79-09-4 | Saan Chemical Technology (Shanghai) Co., Ltd. (Shanghai, China) | ≥0.990 | GC a | 74.8263 |
| Acetonitrile | 75-05-8 | General-reagent, Shanghai Titan Scientific Co., Ltd. (Shanghai, China) | ≥0.990 | GC a | 52.2591 |
| Cyclohexanone | 108-94-1 | Saan Chemical Technology (Shanghai) Co., Ltd. (Shanghai, China) | ≥0.990 | GC a | 102.9832 |
| Isopropanol | 67-63-0 | Saan Chemical Technology (Shanghai) Co., Ltd. (Shanghai, China) | ≥0.999 | HPLC b | 76.4609 |
Table 2.
Some physical properties of selected solvents.
| Solvent | ET(30) a | αa | βa | π*a | μ b | ε c | δH d |
|---|---|---|---|---|---|---|---|
| Methanol | 55.40 | 0.98 | 0.66 | 0.60 | 1.70 | 32.60 | 22.30 |
| Ethanol | 51.90 | 0.86 | 0.75 | 0.54 | 1.70 | 22.40 | 19.40 |
| 1-Propanol | 50.70 | 0.84 | 0.9 | 0.52 | 1.70 | 20.10 | 17.40 |
| Isopropanol | 48.40 | 0.76 | 0.84 | 0.48 | 1.66 | 18.30 | 16.40 |
| 1-Butanol | 49.70 | 0.84 | 0.84 | 0.47 | 1.66 | 18.20 | 15.80 |
| Isobutanol | 48.60 | 0.79 | 0.84 | 0.40 | 1.70 | 17.70 | 15.90 |
| 2-Butanol | 47.10 | 0.69 | 0.80 | 0.40 | 1.70 | 16.56 | 14.50 |
| 1-Pentanol | 49.10 | 0.84 | 0.86 | 0.40 | 1.70 | 13.90 | 13.90 |
| Isoamylol | 49.00 | 0.84 | 0.86 | 0.40 | 1.80 | 15.20 | 13.30 |
| Cyclohexanone | 39.80 | 0.00 | 0.53 | 0.68 | 3.10 | 18.20 | 12.70 |
| 1-Hexanol | 48.80 | 0.80 | 0.84 | 0.40 | - | - | 13.00 |
| 1-Heptanol | - | - | - | - | - | - | 11.90 |
| 1-Octanol | 48.10 | 0.77 | 0.81 | 0.40 | 1.90 | - | 6.10 |
| Acetonitrile | 45.60 | 0.19 | 0.40 | 0.66 | 3.20 | 37.50 | 5.10 |
| Propinoic acid | 55.00 | 1.12 | 0.45 | 0.58 | - | - | 12.40 |
a Dimroth and Reichardt’s polarity parameter, Kamlet–Taft parameter. Taken from [39]. b Dipole moment, μ/D. Taken from [40]. c Dielectric constant at T = 293.15 K. Taken from [40]. d Hydrogen bonding cohesion (Hansen) solubility parameter, the unit is MPa 1/2. Taken from [41]. “-” means the data were not found.
Table 3.
Parameters and deviations of Apelblat equation for the solubility of α-LM in 15 solvents.
| Solvent | A | B | C | 103 RAD | 106 RMSD |
|---|---|---|---|---|---|
| Methanol | 3.0766 | −3158.8693 | −0.2847 | 5.3031 | 0.6003 |
| Ethanol | 41.7699 | −4985.8779 | −6.1120 | 4.6061 | 0.2374 |
| 1-Propanol | 26.4854 | −4185.2840 | −3.9175 | 4.1847 | 0.2885 |
| Isopropanol | −27.8252 | −2736.3574 | 4.8044 | 6.3433 | 0.6439 |
| Acetonitrile | −27.5986 | −1497.9216 | 3.9436 | 3.4318 | 0.1189 |
| 1-Butanol | 4.5383 | −2459.6923 | −1.0101 | 2.9809 | 0.2425 |
| Isobutanol | −6.8557 | −2120.3304 | 0.7088 | 2.4968 | 0.1839 |
| 2-Butanol | 4.0985 | −3337.5824 | −0.5650 | 4.9549 | 0.2350 |
| 1-Pentanol | 17.0290 | −3736.0487 | −2.5440 | 5.6961 | 0.3223 |
| Isoamylol | 32.6382 | −4461.5797 | −4.8957 | 4.6822 | 0.1659 |
| 1-Hexanol | −47.5650 | −1692.9922 | 7.4855 | 6.8966 | 0.2083 |
| 1-Heptanol | −2.2769 | −2787.9947 | 0.2990 | 5.8348 | 0.3460 |
| 1-Octanol | 28.3460 | −4215.4499 | −4.2710 | 3.7780 | 0.1634 |
| Cyclohexanone | −27.1953 | −2419.8664 | 4.3772 | 9.7513 | 0.3162 |
| Propinoic acid | −43.2062 | −1265.0271 | 6.5779 | 8.4350 | 0.4790 |
| Average | 5.2917 | 0.3034 | |||
Table 4.
Parameters and deviations of λh equation for the solubility of α-LM in 15 solvents.
| Solvent | 103λ | h | 103 RAD | 106 RMSD |
|---|---|---|---|---|
| Methanol | 4.8545 | 615,583.7552 | 4.8535 | 0.7199 |
| Ethanol | 3.1697 | 997,826.5251 | 15.6423 | 1.1342 |
| 1-Propanol | 2.3316 | 1,285,742.1272 | 13.0935 | 0.8522 |
| Isopropanol | 16.0734 | 267,512.2672 | 26.7948 | 1.4094 |
| Acetonitrile | 1.0672 | 2,444,208.9247 | 5.9051 | 0.2256 |
| 1-Butanol | 0.8784 | 2,233,532.0823 | 6.6374 | 0.5483 |
| Isobutanol | 0.7550 | 2,895,562.0914 | 4.7101 | 0.2708 |
| 2-Butanol | 1.7099 | 1,806,144.9113 | 5.6122 | 0.2595 |
| 1-Pentanol | 1.8496 | 1,573,562.5892 | 7.2038 | 0.5004 |
| Isoamylol | 1.4327 | 2,013,266.8911 | 8.6628 | 0.3579 |
| 1-Hexanol | 4.2654 | 940,265.8582 | 18.1818 | 0.3672 |
| 1-Heptanol | 1.6977 | 1,641,263.9352 | 6.9722 | 0.3709 |
| 1-Octanol | 1.4556 | 1,941,581.3104 | 9.2550 | 0.3589 |
| Cyclohexanone | 3.9075 | 965,202.1135 | 14.0863 | 0.4350 |
| Propinoic acid | 2.7888 | 1,145,606.1334 | 5.3089 | 0.5203 |
| Average | 10.1946 | 0.5554 | ||
Table 5.
Parameters and deviations of Wilson model for the solubility of α-LM in 15 solvents.
| Solvent | a12 | b12 | a21 | b21 | 103 RAD | 106 RMSD |
|---|---|---|---|---|---|---|
| Methanol | 24.4427 | −8960.6721 | 0.4448 | 34.8474 | 5.4478 | 0.6006 |
| Ethanol | 25.7710 | −8790.9862 | 0.0104 | −0.0075 | 7.8584 | 0.4502 |
| 1-Propanol | 26.3558 | −8924.0253 | −0.2396 | −0.0038 | 5.5948 | 0.3651 |
| Isopropanol | 17.2970 | −7415.4742 | 7.5370 | −1468.9739 | 6.9079 | 0.6353 |
| Acetonitrile | 28.5466 | −8231.7192 | −0.2444 | −119.7887 | 2.6844 | 0.1094 |
| 1-Butanol | 28.1475 | −9769.2383 | −0.2111 | 1.1678 | 3.2012 | 0.2580 |
| isobutanol | 32.7860 | −9600.4299 | −1.1306 | −0.0058 | 2.9048 | 0.1557 |
| 2-Butanol | 26.4039 | −8729.5396 | −0.4449 | −6.1837 | 4.7570 | 0.2359 |
| 1-Pentanol | 26.8768 | −8963.5924 | −0.5753 | 1.8416 | 4.7443 | 0.3470 |
| Isoamylol | 26.5113 | −8946.4676 | −0.4400 | 0.0851 | 5.5650 | 0.2588 |
| 1-Hexanol | 25.6327 | −6718.4932 | −1.1445 | −139.6036 | 5.7548 | 0.1595 |
| 1-Heptanol | 31.3149 | −9079.4249 | −1.5496 | 3.4011 | 5.7054 | 0.3349 |
| 1-Octanol | 27.4758 | −9001.5085 | −0.9517 | 0.0247 | 6.3363 | 0.2515 |
| Cyclohexanone | 30.4941 | −8406.5104 | −1.4374 | 17.9929 | 9.1296 | 0.2281 |
| Propinoic acid | 32.0520 | −9018.3050 | −1.1804 | 29.1649 | 6.0851 | 0.3158 |
| Average | 5.5118 | 0.3137 | ||||
Table 6.
Parameters and deviations of NRTL model for the solubility of α-LM in 15 solvents.
| Solvent | α | a12 | b12 | a21 | b21 | 103 RAD | 106 RMSD |
|---|---|---|---|---|---|---|---|
| Methanol | 7.6935 | −38.6535 | 12,490.0130 | 23.4391 | −8826.6631 | 0.2460 | 0.4874 |
| Ethanol | −0.3667 | 2.8759 | −920.7980 | 21.4235 | −7978.7635 | 4.6061 | 0.2389 |
| 1-Propanol | 17.3089 | −4.9224 | 1601.6066 | 24.3282 | −8873.3037 | 4.0046 | 0.2632 |
| Isopropanol | 1.3652 | 0.1969 | −418.1983 | −9.4994 | 5151.6911 | 3.2121 | 0.1504 |
| Acetonitrile | 44.7979 | −0.2714 | 84.6165 | 25.9768 | −9283.6565 | 2.6844 | 0.1036 |
| 1-Butanol | 10.5622 | −27.8827 | 9009.6038 | 26.8760 | −9754.0188 | 2.6124 | 0.2014 |
| Isobutanol | 21.3971 | −12.1041 | 3908.5777 | 26.7979 | −9593.3165 | 1.8288 | 0.0764 |
| 2-Butanol | −0.0345 | −2.9422 | 872.3605 | 27.3048 | −9624.3411 | 4.9549 | 0.2351 |
| 1-Pentanol | 4.3661 | −59.3899 | 19,189.7345 | 24.6120 | −8920.9197 | 3.9488 | 0.1798 |
| Isoamylol | 23.2447 | −4.4141 | 1437.1100 | 24.8075 | −8912.0932 | 2.3763 | 0.1222 |
| 1-Hexanol | 35.1965 | −1.5530 | 499.1438 | 21.9911 | −7964.3999 | 4.7214 | 0.1074 |
| 1-Heptanol | 11.0309 | −2.0698 | 688.8884 | 24.7314 | −8983.8417 | 4.6317 | 0.3104 |
| 1-Octanol | −0.1241 | −4.5717 | 1289.6954 | 29.2548 | −10,195.5144 | 3.7780 | 0.1624 |
| Cyclohexanone | 7.7270 | −3.9109 | 1279.8161 | 22.1958 | −8097.0602 | 4.2176 | 0.1130 |
| Propinoic acid | 32.1107 | −13.0524 | 4210.3300 | 23.8667 | −8708.3199 | 2.9581 | 0.1232 |
| Average | 3.3854 | 0.1917 | |||||
Publisher’s Note: MDPI stays neutral with regard to jurisdictional claims in published maps and institutional affiliations. |
© 2022 by the authors. Licensee MDPI, Basel, Switzerland. This article is an open access article distributed under the terms and conditions of the Creative Commons Attribution (CC BY) license (https://creativecommons.org/licenses/by/4.0/).
Share and Cite
MDPI and ACS Style
Guan, Y.; Yang, Z.; Wu, K.; Ji, H. Crystallization Thermodynamics of α-Lactose Monohydrate in Different Solvents. Pharmaceutics 2022, 14, 1774. https://0-doi-org.brum.beds.ac.uk/10.3390/pharmaceutics14091774
AMA Style
Guan Y, Yang Z, Wu K, Ji H. Crystallization Thermodynamics of α-Lactose Monohydrate in Different Solvents. Pharmaceutics. 2022; 14(9):1774. https://0-doi-org.brum.beds.ac.uk/10.3390/pharmaceutics14091774
Chicago/Turabian StyleGuan, Youliang, Zujin Yang, Kui Wu, and Hongbing Ji. 2022. "Crystallization Thermodynamics of α-Lactose Monohydrate in Different Solvents" Pharmaceutics 14, no. 9: 1774. https://0-doi-org.brum.beds.ac.uk/10.3390/pharmaceutics14091774
Note that from the first issue of 2016, this journal uses article numbers instead of page numbers. See further details here.