Article

Photophysical Properties of Bright Luminescent Polyethyleneimine@Carbon Nanodots and Their Application in White Light-Emitting Diodes

College of Physics & Optoelectronic Engineering, Ocean University of China, Qingdao 266100, China
*
Author to whom correspondence should be addressed.
Submission received: 18 January 2023 / Revised: 7 February 2023 / Accepted: 10 February 2023 / Published: 2 March 2023

Abstract

:
Highly fluorescent carbon nanodots (CNDs) have broad application prospects in optoelectronics, energy, biological imaging, and other fields because of their good solubility in water, adjustable photoluminescence (PL), low toxicity, good biocompatibility, and stable chemical properties. In this paper, polyethyleneimine@CNDs (PEI@CNDs) with unique excitation- and concentration-dependent PL properties were synthesized by a one-pot hydrothermal approach. The morphology, structure, surface chemistry, photophysical properties, and stability of the PEI@CNDs were well probed. The PEI@CNDs solution at low concentration displayed blue PL with a quantum yield of 50.6%. As the concentrations of the PEI@CNDs increase, the PL colors changed from blue, cyan, and green, to greenish-yellow. At low concentration, the excitation-independent and excitation-dependent PL property is mainly caused by carbon core and surface state emission. However, at higher concentration, the quenched blue emission and enhanced green emission were found. This is mainly attributed to the aggregate-related inner filter effect, electron transfer, and surface states. Mixing 10.0 mg/mL of PEI@CNDs with polyvinyl alcohol can be used to construct composite films, which were combined with the blue light-emitting diode to construct white light-emitting diodes with white and warm white emissions.

1. Introduction

Carbon dots (CDs), as a new branch of carbon-based nanomaterials, were first discovered in 2004 [1]. So far, various kinds of CDs have been synthesized, including carbon nanodots (CNDs) [2,3,4,5], polymer dots (PDs) [6,7], graphene quantum dots (GQDs) [8,9], and so on [10,11,12]. Because of their excellent luminescent performance, low cost, low toxicity, good biocompatibility, and chemical stability, CNDs have attracted widespread attention in the fields of sensors [13,14], optoelectronics [15], energy [16], photocatalysis [17], and biological imaging [18]. Generally, the unmodified CNDs process single physics-chemical property for lack of specific groups, which undoubtedly limits its wider applications, such as bioimaging, full-color displays, and light-emitting diodes (LEDs) [19,20,21,22,23]. Therefore, it is highly desirable to develop CNDs with multicolor emissions. By introducing special elements, such as nitrogen [24,25], boron [26,27], sulfur [28], and phosphorus [29,30], the PL intensities or spectra ranges of CNDs could be changed. Among the doped heteroatoms, nitrogen doping is the most common one and has proved to be a powerful strategy to modify carbon materials for various applications [31]. Qi et al. [32] prepared nitrogen-doped carbon quantum dots (N-CQDs) with an average size of 2.8 nm by a one-pot hydrothermal method using citric acid as raw material; the surfaces of N-CQDs were covered with various O/N-containing hydrophilic functional groups, rendering N-CQDs possessing great water solubility and strong fluorescence emission at 440 nm with a quantum yield (QY) of 44%. By linking specific functional groups to the surfaces of CNDs, new surface states may be induced; thus, the electronic structures, optical properties, and chemical reactivities of CNDs could be altered [33]. Surface passivation by small molecules has also been applied for adjusting the optical properties of CNDs. Gao et al. [18] synthesized PL-tunable graphene quantum dots (GQDs) with a two-step method. Yellow luminescent GQDs were firstly synthesized by pyrolysis carbon black in nitric acid at low temperature, then blue-emitting GQDs and red-emitting GQDs were obtained by wrapped the GQDs with PEI1800 and PEI600, respectively. The amidation reaction between the carboxyl groups on the surface of GQDs and the amine groups in PEI plays an important role in the coating process. The as-prepared PL-tunable GQDs showed excellent chemical stability and extremely low cytotoxicity. However, the two-step approach is somewhat time-consuming.
In the field of white light-emitting diodes (WLEDs), a new light source in the 21st century [34,35], the multi-color photoluminescent CNDs, have also aroused great research interests [36,37] in CNDs as promising phosphors. Although rare earth phosphors and semiconductor quantum dots (QDs) used as phosphors for LEDs have many merits, such as high brightness, spectral tunability, and controllable sizes [38], they are generally expensive and harmful to the environment because of containing some heavy-metal elements (Cd, Pb or Hg) [39,40]. CNDs as phosphors in WLEDs are candidates on account of their low cost and non-toxicity [41,42]. Wang et al. [41] fabricated red luminescent CNDs with a QY of 53%; by combining them with the blue and green luminescent CNDs, a warm WLED was constructed. Qu et al. [42] established a warm WLED using CNDs as a phosphor with a fluorescent QY of 23%. A few reports about WLED based on carbon nanomaterials have highlighted the potential application of CNDs in this field [43,44,45,46]. Wang et al. [44] reported a new one-step acid-reagent engineering strategy to obtain highly luminescent CNDs with a remarkably tunable and stable fluorescence emission from blue to red and even white light by using o-phenylenediamine as a precursor. The full-color light-emitting polymer films and various high-color rendering index WLEDs were fabricated by mixing various CNDs in appropriate proportions. Zhang et al. [45] developed a facile method to prepare CDs with few defects, high carbonization, excitation wavelength-independent PL emission, compatibility with the solution process, and which can be used as emitters to configurate LEDs. Li et al. [46] combined CDs and ZnO QDs to form a composite with white fluorescence by electrostatic interaction. On this basis, WLED with fluorescence emission spectrum ranging from 425 nm to 750 nm and color coordinates of (0.30, 0.34) was successfully prepared. The above research results show that CNDs can participate in the construction of WLED alone or with other materials.
In recent years, a new property called aggregation-induced emission (AIE) [47] was found in CNDs. The AIE has attracted extensive attention due to strong emissions in the aggregated state. Mu et al. [36] prepared CNDs showing concentration-dependent PL properties, indicating full-color emissions under excitation at the white light. Kumari et al. [48] reported that F-intercalated CDs exhibited the phenomenon of polymer aggregation-induced emission (P-AIE). Mixing polyvinyl alcohol (PVA) with the CDs, highly conjugated polymer system around the CDs resists the coupling of surface states in aggregated forms; that is to say that PVA formed a self-quenching-resistant, resulting in a red-shift for both absorption and emission spectra [48]. The P-AIE of CDs has been used in red LED and WLED fabrication [48]. These red-shifted CDs of the aggregated state induced by the polymer matrix would endow the CDs more applicability in WLEDs. Therefore, the low-cost raw materials, facile fabrication method, and decreasing aggregation-caused quenching (ACQ) are important for the CNDs applied in WLEDs.
Inspired by these studies, non-toxic, pollution-free, readily available, and low-cost materials of citric acid (CA), L-glutamic acid (L-Glu), and polyethyleneimine (PEI) were used as precursors to fabricate PEI@CNDs by the one-pot ultrasound-assisted hydrothermal method. Compared to the two-step method, our approach is simple and time-saving. The bright fluorescent PEI@CNDs exhibited interesting excitation- and concentration-dependent PL properties. The morphology, structure, and photophysical properties of the PEI@CNDs were characterized in detail by different microscopy and spectroscopy techniques. The AIE property of the PEI@CNDs was probed, and the corresponding mechanism was explained. The PEI@CNDs-based films were fabricated using PVA as a matrix. By putting the blue LED and the yellow fluorescence film together, simple WLED with CIE color coordinates (0.30, 0.31) were constructed.

2. Experimental Section

2.1. Materials and Characterization

CA, L-Glu, and PEI (MW1800) were purchased from Aladdin Reagent Co., Ltd. (Shanghai, China). PVA and Rhodamine B were obtained from Macklin (Shanghai, China). Ultrapure water (18.2 MΩ·cm) was used as a solvent. CA and L-Glu are all an analytic grade material, and Rhodamine B is a spectrum-grade reagent.
A type of YZUR-100 (Shanghai Yan Zheng, Shanghai, China) ultrasonic hydrothermal reactor (220 V, 250 W) was employed to fabricate the PEI@CNDs. An UH5300 spectrophotometer (Hitachi, Japan) was used to record the ultraviolet–visible (UV–Vis) absorption spectra. The PL spectra were carried out using a FluoraMAX-4 fluorescent spectrometer (Horiba JY, Edison, NJ, USA). An X-ray diffractometer (XRD, Smartlab 9 kw, Japan) was applied to analyze the crystalline structure of solid PEI@CNDs powder. Fourier transform infrared (FTIR) spectra was completed using a Nicolet iN10 FTIR spectrometer (Thermo Fisher Scientific, Waltham, MA, USA) with a resolution of 4 cm−1 from 4000 cm−1 to 500 cm−1. An X-ray photoelectron spectrometer (Thermo ESCALAB 250XI, MA, USA, with a radiation source Al Kα-1486.6 eV) with a multifunctional imaging function was employed to measure the X-ray photoelectron spectra (XPS) of PEI@CNDs. An Edinburgh F900 time-resolved fluorescence spectrometer (FLS-980, Edinburgh, UK) was applied to record the fluorescence lifetimes of the PEI@CNDs.

2.2. Preparation of PEI@CNDs

CA provided the carbon source, L-Glu and PEI supplied part of the carbon source and nitrogen source. The reaction temperature was controlled at 180 °C during the fabrication process, CA was decomposed, dehydrated, and concentrated to configure CNDs. L-Glu and PEI were not thermalized for the higher boiling points of 225 °C and 530 °C, respectively. Because CNDs possess –COOH and –OH at the surfaces, through the dehydration reaction, L-Glu was linked to CNDs. The CNDs were further passivated by PEI via amidation reaction between –NH2 in PEI and –COOH in CNDs; thus, PEI@CNDs could be obtained in a one-pot process. Figure 1 shows the schematic diagram for PEI@CNDs preparation. Compared with the previously reported two-step preparation of PEI-coated GQDs [18], our preparation process is simple and time-saving.
Typically, a 30 mL aqueous solution containing CA and L-Glu (w/w = 2:1) was mixed with the same volume of PEI solution. After fully stirring, the mixture was transferred to a 100 mL hydrothermal reactor. The solution was heated up to 180 °C in the ultrasonic reactor for 3 h, and the reactant indicated red-brown color; after cooling down to room temperature, the reactant was filtrated three times and dialyzed for 72 h, a pure PEI@CNDs solution was obtained and displayed a yellow color. Furthermore, the solid-state of PEI@CNDs was obtained via freeze drying.

2.3. Preparation of Composite Films

We mixed 3.0 g PVA with 20 mL 10.0 mg/mL PEI@CNDs solution. After heating in a water bath at 80 °C and stirring for 2 h, a homogeneous PVA containing PEI@CNDs was prepared. The glue was evenly coated on the quartz glass (20 mm × 20 mm) at room temperature. A PEI@CNDs/PVA composite film was obtained via overnight drying in the air.

2.4. Preparation of WLEDs

The PVA glue containing PEI@CNDs was carefully dripped onto a blue LED lamp and cured at room temperature for 24 h.

3. Results and Discussion

3.1. Morphology and Structure of the PEI@CNDs

The morphology and structure of PEI@CNDs were characterized in detail by TEM, AFM, and XRD. Figure 2 shows the experimental results. TEM (Figure 2A) indicates that the size of the PEI@CNDs is about 3 nm. The lattice structure could not be clearly distinguished through HRTEM, so the PEI@CNDs as prepared are amorphous structures. AFM images (Figure 2B–D) show that the thickness of most PEI@CNDs is less than 2.5 nm.
The XRD pattern displays a wide diffraction peak at 2θ = 21.1°, corresponding to the (002) crystal plane of the carbon-based material [49,50], indicating that the crystallinity of the sample is low, confirming again the amorphous nano-cluster structures.

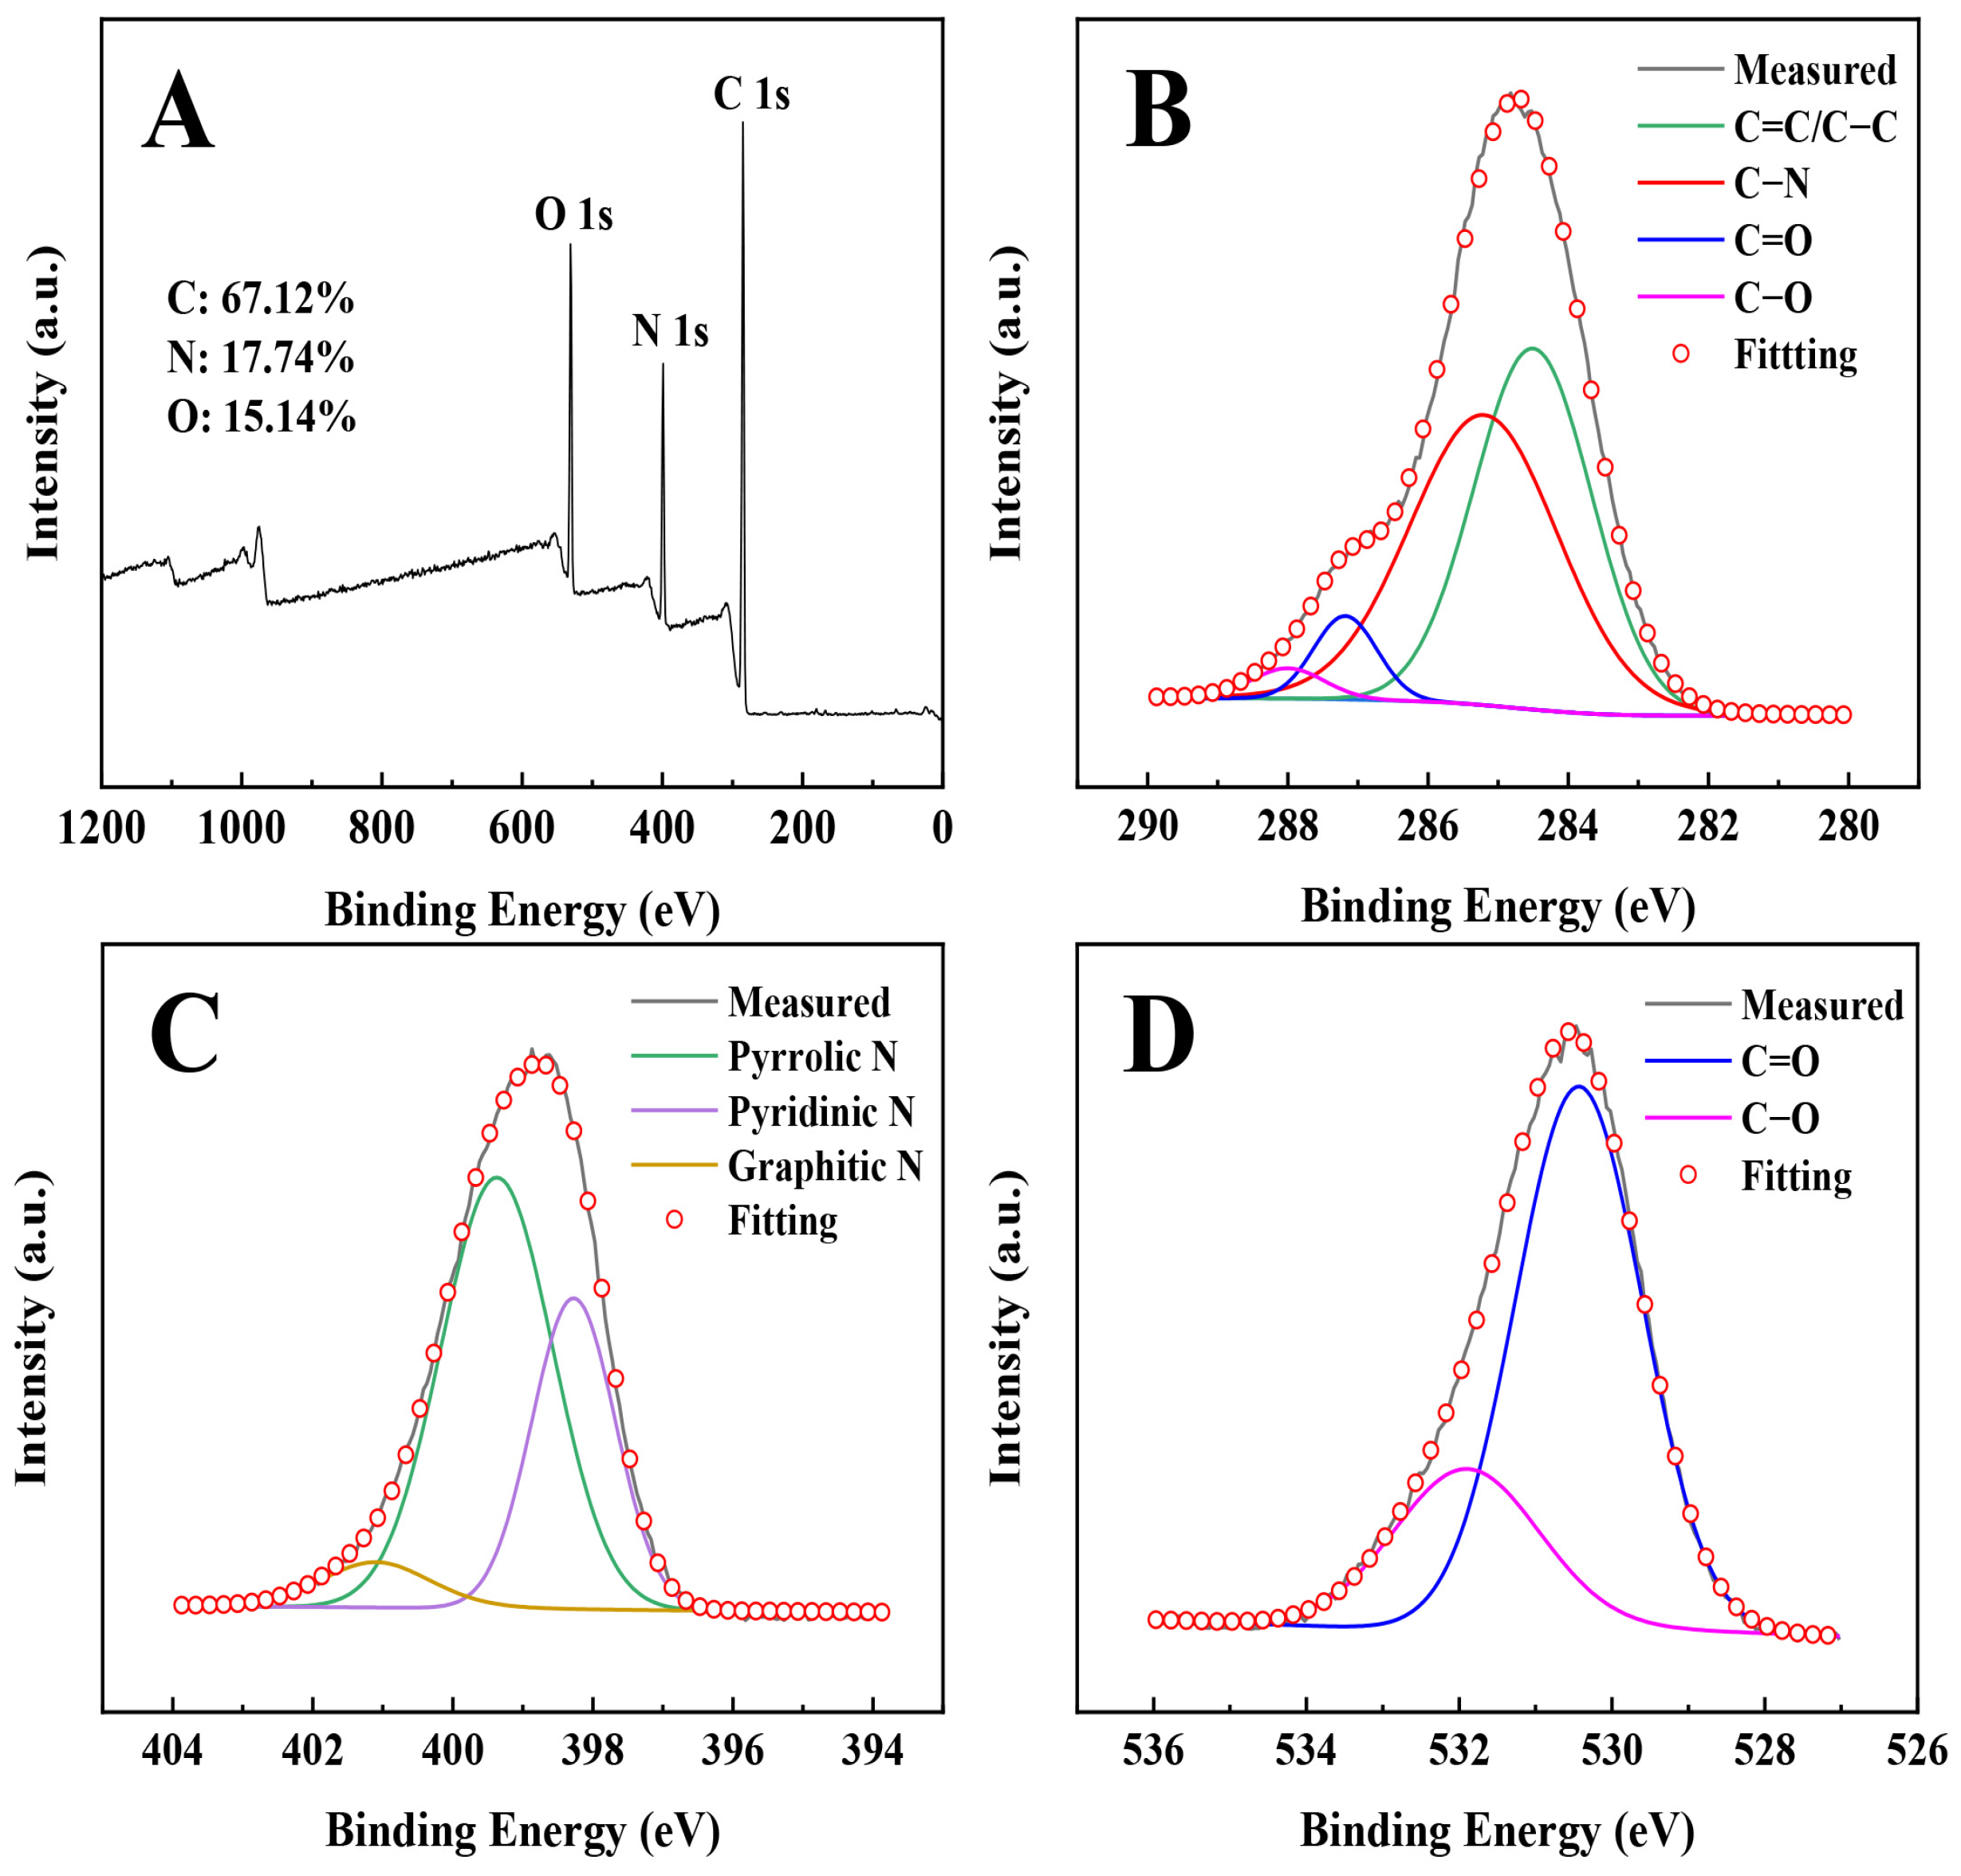
3.2. Surface Chemistry Property of the PEI@CNDs

In the hydrothermal process, nitrogen- and oxygen-containing functional groups were easily introduced. To analyze the surface chemical structure of the PEI@CNDs, FTIR and XPS spectra were carried out. For comparison, the FTIR spectra of CA, L-Glu, and PEI were also measured as references. The FTIR spectrum of CA (Figure 3a) displays the presence of O–H (3290–3495 cm–1), C=O (1752 cm–1 and 1707 cm–1), –CH2– (scissor vibration at 1430 cm–1, oscillation out of the plane at 1387 cm–1, and twisting vibration at 1220–1240 cm–1), C–OH (1180–1290 cm–1 and 1310–1360 cm–1), C–O (1080–1140 cm–1), and C–C (1050 cm–1) [51]. The FTIR of L-Glu (Figure 3b) shows the existence of O–H and N–H (2780–3600 cm–1), –C–H (2650–2740 cm–1), carboxylic acid of C=O (1740 cm–1 and 1640 cm–1), N–H (1516 cm–1), C–N (1420 cm–1), –CH2– (1360 cm–1 and 1250–1310 cm–1), C–OH (1130 cm–1 and 1230 cm–1), C–O (1080–1130 cm–1), and C–C (1050 cm–1) [52]. The FTIR of PEI (Figure 3c) indicates the appearance of –NH2 (3284 cm–1) [18], –CH (2822 cm–1 and 2939 cm–1) [53], amine end groups (υ(N–H) at 1460 cm–1 and υ(C–N) at 1590 cm–1) [54], N–H bending vibration (1301 cm–1), C–N (1119 cm–1) [55], and C–C (1050 cm–1) [56,57,58].
Comparing the FTIR of PEI@CNDs with that of CA, L-Glu, and PEI, the three peaks of PEI@CNDs at 2848, 2920, and 3272 cm–1 are similar to the PEI, implying that PEI was successfully linked to the CNDs. The C=O at 1694 cm–1 is attributed to the L-Glu undergoing decarboxylation or dehydration as it links to the CNDs. The C=C stretching at 1654 cm–1 [59,60] in CNDs indicates the pyrolysis and condensation of CA formation of sp2 or sp3 carbon structures. The peak at 1556 cm−1 is associated with –CONH– [18], indicating that the –NH2 groups in PEI or –OH in L-Glu combined with the carboxyl groups in CNDs. The peak localized at 1356 cm−1 corresponds to the out-of-plane oscillations of –CH2– [61] from PEI or L-Glu. The peak at 1438 cm−1 belongs to the in-plane bending vibration of C–N [18]. The peak at 1155 cm−1 is attributed to C–O [62]. The above analysis shows that L-Glu and PEI could be linked to the CNDs in one step.
XPS was used to investigate the surface functional groups and contents of doped elements in the PEI@CNDs. The selected data were calibrated using the standard peak of C1s. The XPS full scan (Figure 4A) proves the presence of C1s (284.8 eV), N1s (399.6 eV), and O1s (531.2 eV), with percentages of 67.12%, 17.74%, and 15.14%, respectively. The content of N in PEI@CNDs is higher than the N-CQDs (12.1%) prepared from citric acid (CA) and ethylenediamine (EDA) [32]. The main reason is that both of PEI and L-Glu were grafted onto the CNDs, and PEI has higher N content. The above results indicate that PEI was successfully linked to the CNDs. The four components of C1s high-resolution XPS (Figure 4B) at 284.5, 285.2, 287.3, and 288.0 eV denote the presence of C=C/C–C (284.5 eV), C–N (285.2 eV), C=O (287.3 eV), and C–OH (288.0 eV) bands [63], which is consistent with the results of FTIR (Figure 3d). The deconvolution of N1s high-resolution XPS (Figure 4C) reveals the presence of pyridinic N (398.5 eV), amino N (399.6 eV), and pyrrolic N (400.9 eV), respectively [64], where the percentage of amino N is 46.3%, confirming again that PEI containing higher amino group was linked to the CNDs. The two decompositions of O1s (Figure 4D) at 530.4 eV and 531.8 eV are assigned to the C=O and the C–OH/C–O–C groups [65,66]; the higher content of C=O is caused by amidation reaction for the amino groups in L-Glu and PEI combined with the carboxyl groups in CA to form amide group (–CONH–), which agrees with the XPS spectrum of C1s.

3.3. Photophysical Properties of PEI@CNDs at Low Concentration

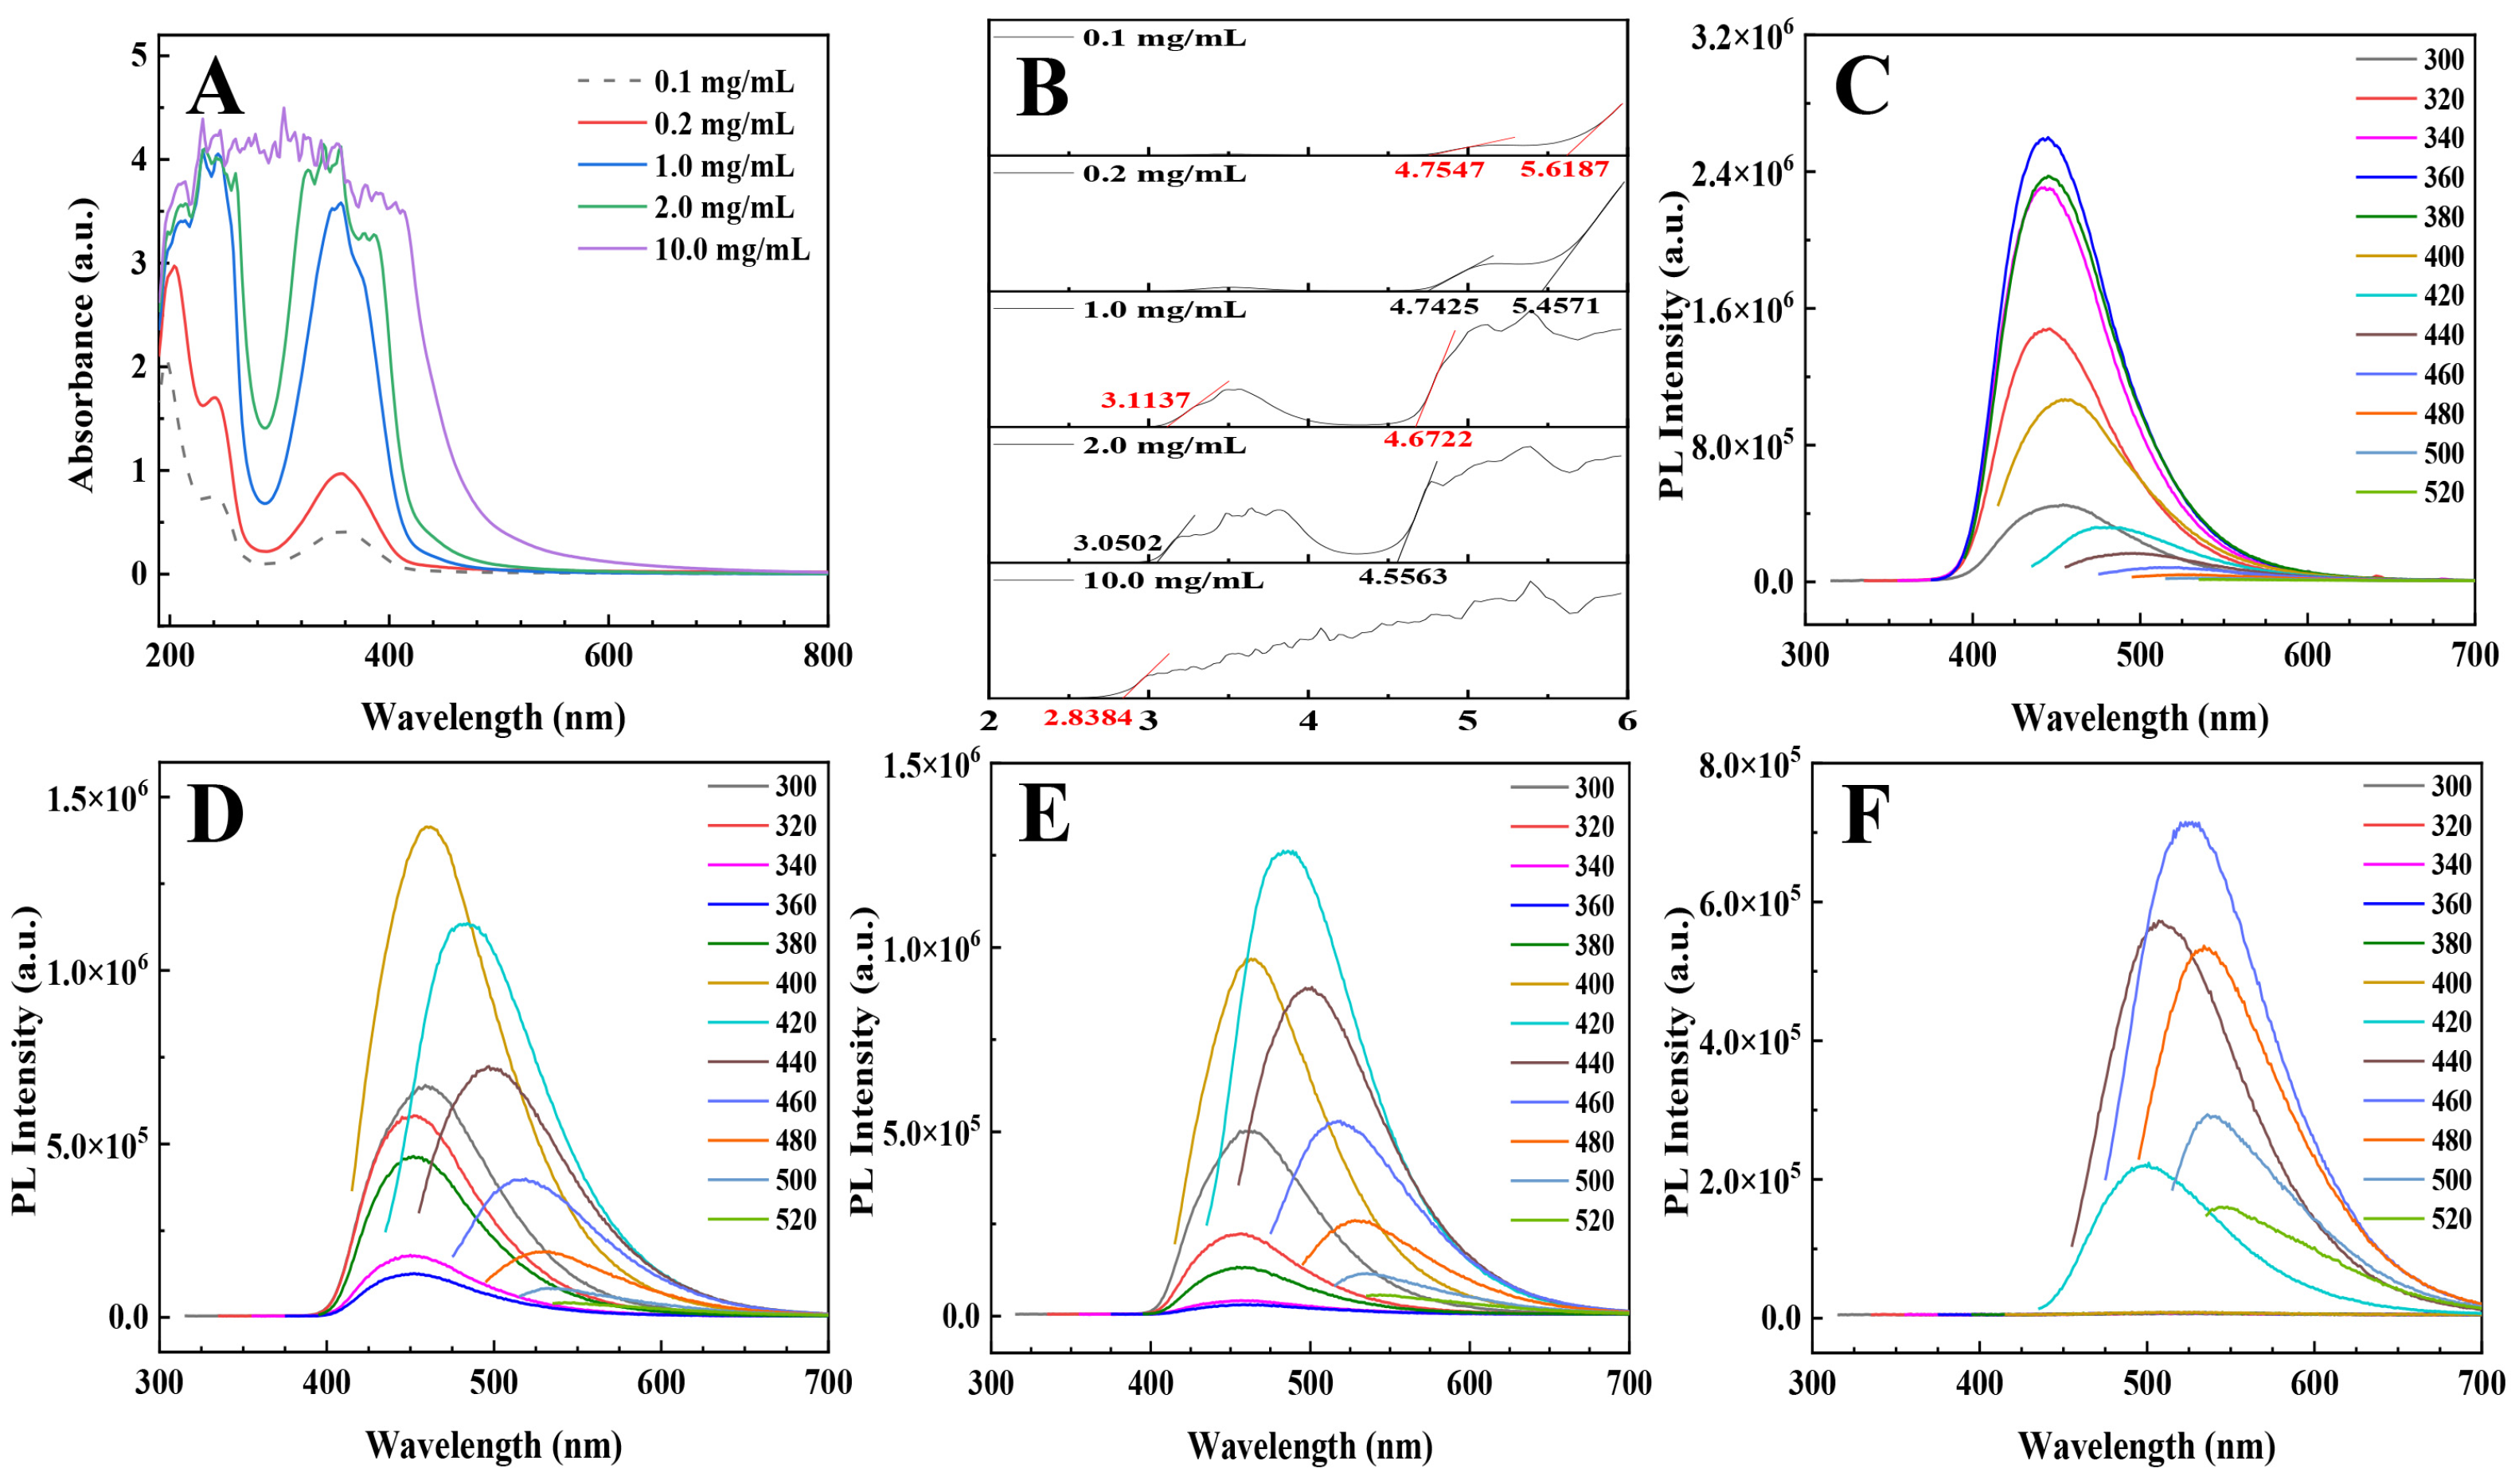
3.3.1. UV–Vis Absorption and Photoluminescence

The photophysical properties are important for the practical application of CNDs. At a low concentration of 0.1 mg/mL, the photophysical properties of the PEI@CNDs were investigated using UV–Vis absorption and PL spectroscopy. The UV–Vis absorption spectrum (Figure 5A, Abs) indicates three peaks at 196, 240, and 356 nm; the peaks at 196 nm and 240 nm correspond to the π→π* electron transition due to the delocalization of π electrons of the aromatic ring [67]; because of the oxygen- or nitrogen-containing functional groups positioned at the surfaces of the PEI@CNDs, the absorption peak at 356 nm is ascribed to the n→π* of the C=O/C–N/C–H/C–O bond, respectively [68]. The peak position of the PL excitation spectrum (Figure 5A, PLE) is at 360 nm, and the strongest PL spectrum (Figure 5A, PL) was observed under the same wavelength excitation. The PLE and PL spectra exhibit a good mirror symmetry (Figure 5A), indicating that the PL of the PEI@CNDs is closely related to the n→π* transition.
When the excitation wavelengths changing from 300 nm to 520 nm, the PL spectra of the PEI@CNDs were measured and shown in Figure 5B. Within 300–380 nm excitation (Figure 5C, band I), the emission peaks are all at ~447 nm with the maximum intensity at 360 nm excitation, indicating excitation-independent behavior, which is mainly produced by the carbon core (sp2 domain) of the PEI@CNDs (Figure 5C, band I). The QY of PEI@CNDs was measured as 50.6% by using Rhodamine B as the reference standard (all the calculation data was presented in Figure S1 and Table S1), significantly higher than the N-CQDs prepared by Qi et al. [32]. However, when the excitation wavelength is in the range of 400–520 nm, the PL intensities decrease quickly and the emission peaks shifts from 447 nm to 541 nm (Figure 5C, band II), implying that the emission is derived from the surface states mainly caused by the hybridization of the carbon backbone and connected chemical groups [69]. Various functional groups on the surface of PEI@CNDs induce the generation of a series of energy levels between HOMO and LUMO, which results in many different emission sites [69]. At low concentrations, the uneven size distribution of the PEI@CNDs can result in the PL peak redshift, but the shift is very small (~10 nm) [70]. The excitation-dependent PL property at low concentrations reflects that the PEI@CNDs have a set of surface states, each of them corresponding to a band gap. As the exciting wavelength matches well with that band gap, the PEI@CNDs emit corresponding color fluorescence. Therefore, by adjusting the surface groups or changing the populated environment of the CNDs, the PL properties of the CNDs may be tuned. At 0.1 mg/mL, the excitation-independent PL behavior is mainly caused by the carbon core of the PEI@CNDs, and the excitation-dependent PL of the PEI@CNDs originates from the surface states caused by the hybridization of the carbon core and connected chemical groups.

3.3.2. Optical Stability

The photostability of the PEI@CNDs, including the influences from photobleaching, temperature, pH, and storage time, is very important for its applications. We explored this issue in detail. Figure 6A shows that after continuous excitation with UV light (360 nm) for 30 min, the PL intensity decreased by 3.27%, and after 60 min continuous excitation, the PL intensity decreased by 6.6%, which is slightly inferior to that the N-CDs prepared by CA and EDA (after continuous excitation with UV light for 30 min, the PL intensity decreased by 2.19%) [71], implying the PEI@CNDs of 0.1 mg/mL were not easily aggregated into dimers or photodecomposed into small particles; thus, the PEI@CNDs have excellent photobleaching resistance to UV light, which provides great opportunity for its application in the fields of bioimaging and optoelectronics.
When the temperature was changed in the range of 0–100 °C, the PL spectra of the PEI@CNDs were measured as shown in Figure 6B. As the temperature rises, the PL peak positions have no change, and the PL intensities decreased with temperature in the range of 10–100 °C, indicating that the thermal stability of the PEI@CNDs is not so good, which is similar to the results of Ref. [72]; however, at 20 °C and 30 °C, the PL intensities are up to the 86.5–91.8% of the maximum PL intensity, indicating the PEI@CNDs has good photo-stability at room temperature.
By varying the pH values in the range of 2–10, the PL spectra of the PEI@CNDs were recorded (Figure 6C). The inset shows the PL peak intensities varying with the pH. In the strong acid environment (pH = 2 and 3), the PL intensities are slightly larger than others, and the peak positions redshift at about 20 nm, probably related to the protonation process in strong acid environment; within the pH value of 4–10, the PL intensities exhibit a slight change, showing that the as-prepared PEI@CNDs have good photostability in both neutral and alkaline environments.
During 60-day storage at 4 °C, the PL spectra of the PEI@CNDs were measured under excitation at 360 nm. Figure 6D shows after 5, 10, 15, 30, and 60-day storage, the peak intensities are 99.97%, 97.92%, 97.01%, 95.91%, and 95.63% of the as-prepared PEI@CNDs, respectively, indicating that the PEI@CNDs could be stably stored at least 60 days. Ref. [73] reported that N-GQDs with CA and L-Glu as raw materials could be stably preserved for 31 days. By contrast, the CND grafted PEI is benefit of its stability, this property would warrant its applications in many fields [74].
The above results indicate that the PEI@CNDs prepared by the ultrasonic-assisted hydrothermal method have superior photophysical properties and stability by using PEI as a surface passivator.

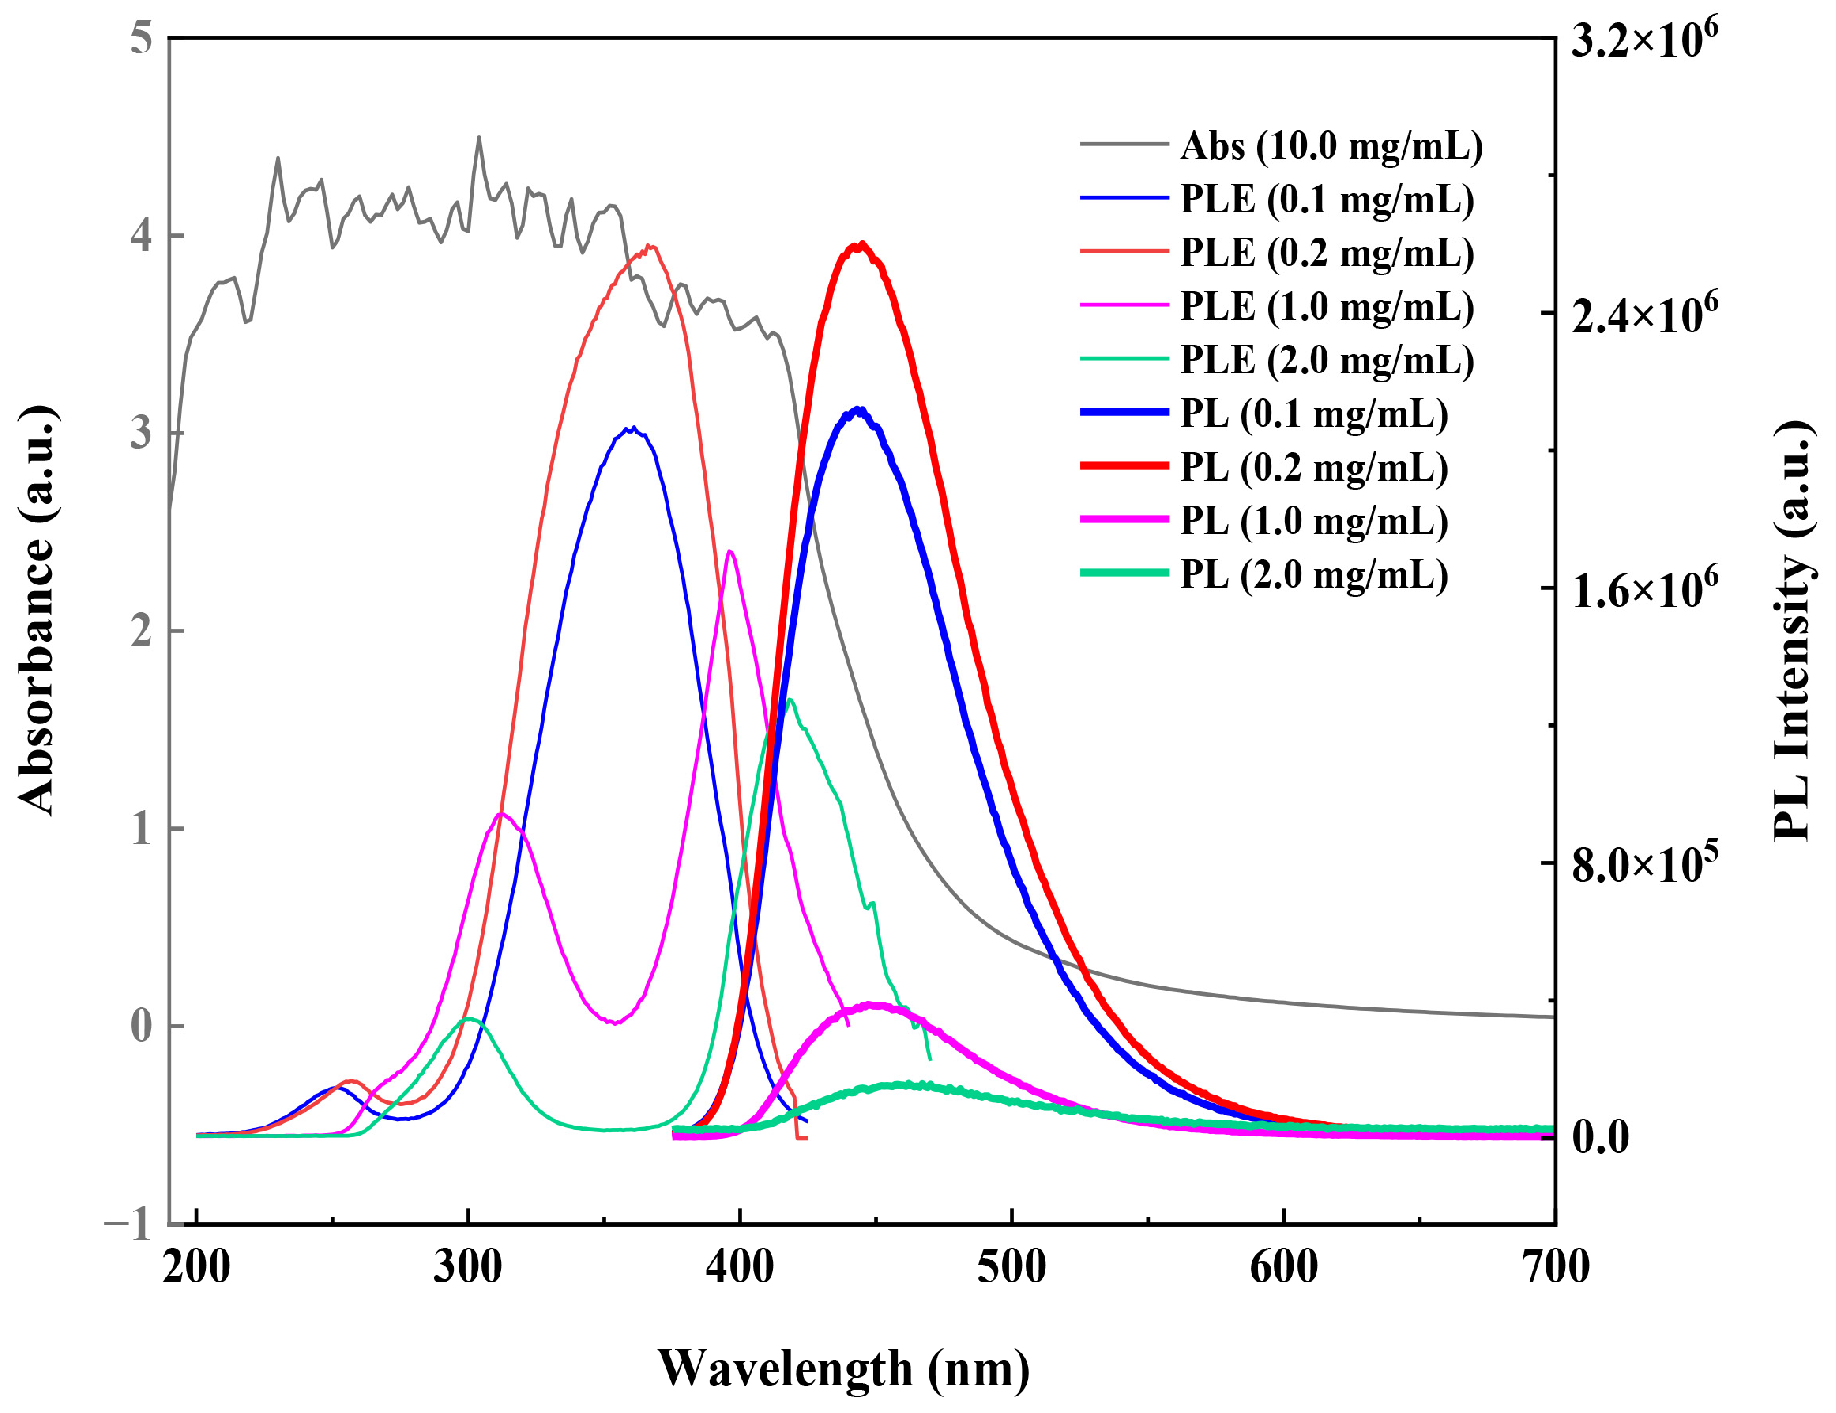
3.4. Photophysical Properties of the PEI@CNDs at High Concentrations

In the experimental processing, we found that the as-prepared PEI@CNDs indicated concentration-dependent optical properties. The absorption spectra and the PL spectra changed with the concentrations of the PEI@CNDs. Figure 7A shows the UV–Vis spectra as the concentrations of the PEI@CNDs increased to 0.2, 1.0, 2.0, and 10.0 mg/mL, respectively; the absorption around 230 nm and 350 nm significantly increases with concentration, but these are not linear increases; the later rising quicker than the former, and there is a deep valley between the two absorption peaks as the concentrations are 1.0 mg/mL and 2.0 mg/mL; however, as the concentration is 10.0 mg/mL, the valley disappears completely, showing a wide absorption band from 200 nm to 480 nm. The changes of the absorption spectra should be caused by the aggregation of the PEI@CNDs with concentration increase, which would lead to the varying of the surface states of the PEI@CNDs; we suggest that band gaps of the PEI@CNDs probably change with the concentrations of the PEI@CNDs. According to the Tauc equation [75], the calculated band gaps with concentrations are illustrated in Figure 7B. When the concentrations are 0.1, 0.2, 1.0, and 2.0 mg/mL, BG1 and BG2 are 5.62 eV and 4.75 eV, 5.46 eV and 4.74 eV, 4.67 eV and 3.11 eV and 4.56 eV and 3.05 eV, respectively; both BG1 and BG2 decrease with increasing concentrations of PEI@CNDs. The BG2s of the 0.1 mg/mL (4.75 eV) and 0.2 mg/mL (4.74 eV) are almost the same; as the concentrations of PEI@CNDs is 10.0 mg/mL, only one band gap of 2.84 eV appears.
The PL spectra of the PEI@CNDs at the concentrations of 0.2, 1.0, 2.0, and 10.0 mg/mL are illustrated in Figure 7C–F. At 0.2 mg/mL (Figure 7C), the PL properties of the PEI@CNDs are similar to the 0.1 mg/mL PEI@CNDs (Figure 5B); the strongest PL was also obtained at 360 nm excitation, and the maximum intensity is higher than that of 0.1 mg/mL. As the concentration increases to 1.0 mg/mL, under excitation at 320, 340, and 360 nm, the PL peaks are almost unchanged (~450 nm), but the PL intensities decrease with the excitation wavelengths, which is opposite to the property of the PEI@CNDs with concentrations of 0.1 mg/mL and 0.2 mg/mL. Within 380–520 nm, the PL spectra indicate an excitation-dependent property; the strongest PL spectrum was obtained under excitation at 400 nm, the emission peak is at 460 nm, and the PL displays a bluish-green color. At 2.0 mg/mL, the PL characteristic is similar to those of 1.0 mg/mL PEI@CNDs; however, the strongest PL spectrum was obtained under excitation at 420 nm; the peak position redshifts to 486 nm, and the PL indicates cyan. Further increasing the concentration of PEI@CNDs to 10.0 mg/mL, the PL spectra change greatly compared to the sample at 2.0 mg/mL; excitations at 320, 340, 360, 380, and 400 nm, the blue emission are very weak; the PL spectra of the PEI@CNDs display excitation-dependence within 420–520 nm excitation, and the PL peaks exhibit redshift as excitation wavelengths increase. As the excitation wavelengths within 460–520 nm, the PL intensities were significantly enhanced compared with other concentrations; the strongest PL spectrum was acquired at 460 nm excitation, the emission peak is at 525 nm, and the PL mainly shows greenish yellow fluorescence.

3.5. The PL Mechanism of the PEI@CNDs at High Concentrations

The concentration-dependent PL mechanism of PEI@CNDs may be related to the aggregation of PEI@CNDs at higher concentrations. The confocal fluorescence images of 1.0 mg/mL (Figure 8A) and 10.0 mg/mL (Figure 8B) PEI@CNDs confirmed the presence of aggregation. The 1.0 mg/mL sample showed a blue and green fluorescence under 405 nm (Figure S2A) and 488 nm excitation (Figure S2B), respectively. For clarity, an image with 405 nm and 488 nm laser co-excitation is shown in Figure 8A. In this picture, some bright particles with the size around 1–2 μm are the aggregations of PEI@CNDs, and the blue background is the emission from the homogeneously distributed small nanoparticles of PEI@CNDs in solution, coinciding with the PL spectra of 1.0 mg/mL PEI@CNDs in Figure 7D. The confocal fluorescence image of 10.0 mg/mL PEI@CNDs (Figure 8B) showed a bright green fluorescence under 488 nm excitation. From Figure 8B, a heavier aggregation of PEI@CNDs than that of the 1.0 mg/mL sample can be observed. Some big aggregated particles with the size of 1–4 μm were observed and the particles exhibited bright green emission. More particles with size less than 1 μm were also observed on the glass slide. The above results indicated that the higher the concentration, the heavier the aggregation, leading to the absorption properties in Figure 7A.
The mechanism by which the blue PL decreases with the concentrations of the PEI@CNDs and even completely quenches at 10.0 mg/mL needs further probing. According to Figure 8B, the 10.0 mg/mL sample includes various sizes of PEI@CNDs. The PL spectra of the 10.0 mg/mL sample are formed by the superimposition of the PEI@CNDs with different sizes, but not a simple superimposition; otherwise, the blue emission would not be quenched. We found that the absorption spectrum of the PEI@CNDs at 10.0 mg/mL overlaps with the excitation and emission spectra (at 360 nm excitation) of PEI@CNDs at 0.1, 0.2, 1.0, and 2.0 mg/mL (Figure 9), suggesting that both the fluorescence resonance energy transfer (FRET) and/or inner filter effect (IFE) may occur [76,77] and cause the concentration-dependent PL spectra of the PEI@CNDs at higher concentration. To distinguish FRET and IFE, we further measured the fluorescence decay time of PEI@CNDs solutions at 0.1, 1.0, and 10 mg/mL by using the time-correlated single photon counting (TCSPC) technique.
Figure 10A,B indicates the results under 375 nm excitation, 450 nm monitoring, and 420 nm excitation, 530 monitoring, respectively. The decay curves could be well superimposed as a two-exponential function (Figure S3, Table 1). All the samples contain one fast decay life τ1 and one slow decay life τ2, and the slow component is dominant (around 75%). The fast decay components (τ1) for the three samples are near to 1.85 ns, with no obvious difference, and the slow decay components (τ2) are around 8.44 ns, there is a small difference around 1 ns between 0.1 mg/mL and 10.0 mg/mL PEI@CNDs, but not a substantial difference. The above results showed that the fluorescence decay times of the PEI@CNDs did not change significantly with the increase of the concentrations, indicating that the quenching was mainly generated via a static mechanism and ruling out the possibility of FRET [78]. Hence, IFE should be present in the higher concentrations PEI@CNDs systems and be related to blue fluorescence decrease or quenching. In particular, the excitation/emission spectra of the lower concentration PEI@CNDs (0.1, 0.2, 1.0, and 2.0 mg/mL) overlap with the absorption spectrum of the higher concentration solution (10.0 mg/mL) means that the higher concentration PEI@CNDs could absorb fluorescence emitted from the lower concentration PEI@CNDs and its corresponding excitation light, resulting in the decrease/quenching of blue fluorescence at high concentration.
Based on the calculated band gaps of PEI@CNDs with concentration increases (Figure 7B), and the fact that the slow decay components (τ2) decrease slightly with concentration increase, we speculate that electron transfer (ET) is likely present inside the PEI@CNDs as one of the quenching mechanisms. Suraj reported the identification method for judging the existence of ET: (i) fluorophore lifetime shortening; and (ii) the redox potentials of the species (or HOMO and LUMO energy) changes, revealing the ET quenching mechanism [79]. As the data of Table 1 shows, the average fluorescence lifetimes (τ2) decrease slightly (1.31 ns and 0.53 ns) as the concentration of PEI@CNDs increased from 0.1 mg/mL to 10.0 mg/mL at different excitations and emissions. Combined with the calculated band gaps (Figure 7B), it is not difficult to find that the energy gaps decrease with increasing concentrations of PEI@CNDs, which will be more conducive to the transition of electrons from HOMO to LUMO [80]. Therefore, ET should also be present in the higher concentration PEI@CNDs systems. The concentration-induced energy gaps change may be caused by the agglomeration of small-sized PEI@CNDs. Specifically, as the concentration of the PEI@CNDs increases, ET is more likely to occur from electron-rich functional groups (mainly amino groups) to electron-deficient groups of aromatic hydrocarbons [80]. ET leads to a change in charge distribution, which often causes the creation of new energy levels [81]. At the same time, the aggregation may result in a variety of surface states, which also influences energy levels. The above reasons lead to the emergence of various new radiative transition channels and long-wavelength emission centers [64]; thus, as the concentration increases, the aggregation becomes heavy, and PL spectra indicate redshift [82]. Based on the above analysis, the PL mechanism of the PEI@CNDs at high concentrations is mainly attributed to IFE, ET, and surface states.

3.6. Performance of WLED

The PL spectra of PEI@CNDs exhibit an excitation- and concentration-dependent characteristic. At 10.0 mg/mL, the strongest emission peak is at 525 nm upon excitation at 460 nm (Figure 7F), which renders the possibility to use the PEI@CNDs to prepare composite films and to construct white light-emitting composite devices together with blue LEDs emitting at 460 nm.
By mixing the PEI@CNDs solution with PVA, a glue was formed. Then the glue was evenly dripped onto quartz glasses. After standing at room temperature for 24 h, a flexible film could be fabricated. By regulating the volume of the dropped glue, a set of orange flexible films with thicknesses of 0.5, 1.0, 1.5, 2.0, 2.5, and 3.0 mm were obtained. The UV–Vis absorption spectra of these films (Figure S4) show that with the film thicknesses increase, the absorption bands extend to long wavelengths. The absorption edges change from 450 nm to 550 nm as the film thicknesses increase from 0.5 mm to 3.0 mm. Under excitation at 460 nm, the PL spectra of these films were measured as shown in Figure S4. The maximum emission peaks of PL spectra remain at 510 nm; however, the fluorescence intensities increase with the film thicknesses. Compare with 10.0 mg/mL PEI@CNDs solution, the maximum emission peak shows a slight blueshift. This is similar to the fluorescent self-healing gels constructed by Sagarika, which may be related to the aggregation-induced fluorescence quenching decrease and the increased rigidity of the solid-phase film [83]. Meanwhile, the phenomenon that the PL intensity increases with film thickness can be attributed to the increase in the number of fluorescence emission centers. The above analysis shows that it is possible to tune the emission spectra of the light conversion films by adjusting their thicknesses. According to Ref. [84], white light could be produced by blending two complementary colors of blue light and yellow light; it is possible to construct a WLED model by combining the light conversion films composed of PEI@CNDs with a blue LED. The blue LED with an emission center at 460 nm excites the flexible films contained PEI@CNDs; the yellow fluorescence from the PEI@CNDs film blends with the left blue light of the LED to become white light.
To obtain excellent performance of WLED, we measured the PL spectra of blue LED and six WLED models. Figure 11A–G show the PL spectra of these devices and the insets are their corresponding optical images. By contrast, one can see that with the film thicknesses increase, the stronger greenish yellow light was emitted from the films. One possible reason is the enhanced blue light scattering by the fluorescence film [85]. Another is that the IFE became heavy with the increase of the film thickness. The transmitted or non-absorbed blue light of the blue LED superimposes with the greenish yellow to achieve spectral tuning. According to the colorimetry theory [86], the CIE coordinates of the obtained devices are (0.17, 0.03), (0.18, 0.06), (0.24, 0.18), (0.19, 0.28), (0.30, 0.31), (0.39, 0.40), and (0.51, 0.44), respectively, indicating pure blue, blue, light blue, bluish-white, white, warm white, and warm yellow. The white (red dot in Figure 11H) and warm white model WLED correspond to 2.0 mm and 2.5 mm film thicknesses. The above results show that the WLEDs based on PEI@CNDs have the potential to be widely used as high-performance light sources [87].

4. Conclusions

In summary, the PEI@CNDs with unique excitation- and concentration-dependent PL properties were synthesized by a one-pot hydrothermal approach. The morphology, structure, surface chemistry, optical properties, and stability of the PEI@CNDs were probed in detail. The PEI@CNDs contain 67.12% C, 17.74% N, and 15.14% O. The experimental results proved that L-Glu and PEI could be linked to the CNDs in one step, which makes the CNDs process rich amnio groups. At low concentrations (0.1 mg/mL and 0.2 mg/mL), the excitation-independent blue PL behavior is mainly caused by the carbon core of the PEI@CNDs, and the excitation-dependent PL of the PEI@CNDs originates from the surface states caused by the hybridization of the carbon core and connected chemical groups. The as-prepared PEI@CNDs have excellent photophysical stability. At room temperature, the PL intensities are near to 90% of the maximum PL intensity. The PEI@CNDs have excellent photobleaching resistance to UV light and its PL spectra show slight changes within a wide pH range (4–10), showing good pH tolerance in both neutral and alkaline environments. Furthermore, the as-prepared PEI@CNDs could be stored stably for at least 60 days. As the concentration of the PEI@CNDs increases from 1 mg/mL to 10.0 mg/mL, the UV–Vis absorption around 350 nm exhibit a significant increase, and the absorption peaks become broad for the aggregation of the PEI@CNDs with concentration increase. The PL colors show blue, cyan, green, and greenish-yellow. The blue emission decreased or quenched; however, the green emission increased with concentration increase. At 10.0 mg/mL, the strongest PL spectrum was acquired at 460 nm excitation, and the emission peak is at 525 nm. By confocal fluorescence images, time-resolved spectra, and energy band calculation, the mechanisms of the quenched blue emission and enhanced green emission are mainly attributed to the aggregated-related IFE, ET, and surface states.
By mixing 10.0 mg/mL of PEI@CNDs with polymer PVA and using light-conversion films of PVA containing PEI@CNDs to combine with the blue LEDs to construct WLEDs with white and warm white emissions, the color coordinates of (0.30, 0.31) and (0.39, 0.40) could be obtained.
In summary, this work provides a simple method for the preparation of PEI@CNDs with aggregated luminescence properties, which can be used to obtain tunable PL spectra. The excellent optical stability of the PEI@CNDs shows good promise in bioimaging. Our results proved that the PEI@CNDs can be used in WLED construction, and they show great potential in the field of optoelectronics.

Supplementary Materials

The following supporting information can be downloaded at: https://0-www-mdpi-com.brum.beds.ac.uk/article/10.3390/photonics10030262/s1, Figure S1: The absorption and PL spectra of PEI@CNDs and Rhodamine B at 360 nm Excitation; Table S1: The relevant data to calculate the QY of PEI@CNDs; Figure S2: Confocal fluorescence images of 1.0 mg/mL PEI@CNDs solutions with single laser excitation; Figure S3: The experimental and fitting time-resolved PL decay curves of PEI@CNDs solutions at different concentrations; Figure S4. (A) UV-vis absorption spectra and (B) PL spectra of fluorescent films with thicknesses of 0.5, 1.0, 1.5, 2.0, 2.5, and 3.0 mm.

Author Contributions

J.Z.: investigation, data curation, formal analysis, and writing—original draft; A.Y.: conceptualization, methodology, investigation, project administration, resources, supervision, writing—original draft, review & editing; K.Z.: investigation and data curation; All authors have read and agreed to the published version of the manuscript.

Funding

This research was funded by the National Natural Science Foundation of China (Granted No. 41877499).

Institutional Review Board Statement

Not applicable.

Informed Consent Statement

Not applicable.

Data Availability Statement

Please contact the corresponding author.

Acknowledgments

The authors are very appreciated to the support from National Natural Science Foundation of China.

Conflicts of Interest

The authors declare no conflict of interest.

References

  1. Xu, X.; Ray, R.; Gu, Y.; Ploehn, H.J.; Gearheart, L.; Raker, K.; Scrivens, W.A. Electrophoretic analysis and purification of fluorescent single-walled carbon nanotube fragments. J. Am. Chem. Soc. 2004, 126, 12736–12737. [Google Scholar] [CrossRef] [PubMed]
  2. Lee, T.; Won, S.; Park, Y.; Kwon, W. Oxygen-less carbon nanodots with an absolute quantum yield of 80% for display applications. ACS Appl. Nano Mater. 2021, 4, 2462–2469. [Google Scholar] [CrossRef]
  3. Chinnadurai, S.; Krishnendhu, T.S.; Ashraf, P.M.; Edwin, L. Synthesis and characterization of carbon nanodots from jellyfish. Synth. Met. 2022, 287, 117085. [Google Scholar] [CrossRef]
  4. Sakthivel, S.; Zhou, X.; Giannelis, E.P.; Kanj, M.Y. Carbon nanodots for enhanced oil recovery in carbonate reservoirs. Energy Rep. 2021, 7, 8943–8959. [Google Scholar] [CrossRef]
  5. Verma, N.C.; Yadav, A.; Rao, C.; Mishra, P.M.; Nandi, C.K. Emergence of carbon nanodots as a probe for super-resolution microscopy. J. Phys. Chem. C 2021, 125, 1637–1653. [Google Scholar] [CrossRef]
  6. Liu, S.; Fang, X.; Mi, F.; Sun, K.; Wu, C. Covalent incorporation of metalloporphyrin in luminescent polymer dot transducer for continuous glucose monitoring. J. Lumin. 2022, 251, 119202. [Google Scholar] [CrossRef]
  7. Han, B.; Yan, Q.; Liu, Q.; Li, D.; Chen, Y.; He, G. Bright green emission non-conjugated polymer dots: pH trigged hydrogel for specific adsorption of anionic dyes and visual detection of tert-butylhydroquinone. Sep. Purif. Technol. 2022, 292, 121023. [Google Scholar] [CrossRef]
  8. Ghosh, D.; Sarkar, K.; Devi, P.; Kim, K.H.; Kumar, P. Current and future perspectives of carbon and graphene quantum dots: From synthesis to strategy for building optoelectronic and energy devices. Renew. Sust. Energ. Rev. 2021, 135, 110391. [Google Scholar] [CrossRef]
  9. Lin, R.; Zhang, J.; Shu, L.; Zhu, J.; Fu, B.; Song, C.; Shang, W.; Tao, P.; Deng, T. Self-dispersible graphene quantum dots in ethylene glycol for direct absorption-based medium-temperature solar-thermal harvesting. RSC Adv. 2020, 10, 45028–45036. [Google Scholar] [CrossRef]
  10. Fu, B.; Liu, Q.; Liu, M.; Chen, X.; Lin, H.; Zheng, Z.; Zhu, J.; Dai, C.; Dong, X.; Yang, D.P. Carbon dots enhanced gelatin/chitosan bio-nanocomposite packaging film for perishable foods. Chin. Chem. Lett. 2022, 33, 4577–4582. [Google Scholar] [CrossRef]
  11. Mei, S.; Fu, B.; Su, X.; Chen, H.; Lin, H.; Zheng, Z.; Dai, C.; Yang, D.P. Developing silk sericin-based and carbon dots reinforced bio-nanocomposite films and potential application to litchi fruit. LWT—Food Sci.Technol. 2022, 164, 113630. [Google Scholar] [CrossRef]
  12. Su, X.; Lin, H.; Fu, B.; Mei, S.; Lin, M.; Chen, H.; Zheng, Z.; Bo, H.; Yang, D.P.; Lin, Y. Egg-yolk-derived carbon dots@albumin bio-nanocomposite as multifunctional coating and its application in quality maintenance of fresh litchi fruit during storage. Food Chem. 2023, 405, 134843. [Google Scholar] [CrossRef]
  13. Singh, S.; Vaishnav, J.K.; Mukherjee, T.K. Quantum dot-based hybrid coacervate nanodroplets for ultrasensitive detection of Hg2+. ACS Appl. Nano Mater. 2020, 3, 3604–3612. [Google Scholar] [CrossRef]
  14. Kim, Y.; Kim, J. Bioinspired thiol functionalized carbon dots for rapid detection of lead (II) ions in human serum. Opt. Mater. 2020, 99, 109514. [Google Scholar] [CrossRef]
  15. Astafiev, A.A.; Shakhov, A.M.; Kritchenkov, A.S.; Khrustalev, V.N.; Shepel, D.V.; Nadtochenko, V.A.; Tskhovrebov, A.G. Femtosecond laser synthesis of nitrogen-doped luminescent carbon dots from acetonitrile. Dyes Pigm. 2021, 188, 109176. [Google Scholar] [CrossRef]
  16. Bian, H.; Wang, Q.; Yang, S.; Yan, C.; Wang, H.; Liang, L.; Jin, Z.; Wang, G.; Liu, S. Nitrogen-doped graphene quantum dots for 80% photoluminescence quantum yield for inorganic γ-CsPbI3 perovskite solar cells with efficiency beyond 16%. J. Mater. Chem. A 2019, 7, 5740–5747. [Google Scholar] [CrossRef]
  17. Wang, X.; Liu, Y.; Zhou, Q.; Sheng, X.; Sun, Y.; Zhou, B.; Zhao, J.; Guo, J. A reliable and facile fluorescent sensor from carbon dots for sensing 2,4,6-trinitrophenol based on inner filter effect. Sci. Total Environ. 2020, 720, 137680. [Google Scholar] [CrossRef]
  18. Gao, T.; Wang, X.; Yang, L.Y.; He, H.; Ba, X.X.; Zhao, J.; Jiang, F.L.; Liu, Y. Red, yellow, and blue luminescence by graphene quantum dots: Syntheses, mechanism, and cellular imaging. ACS Appl. Mater. Interfaces 2017, 9, 24846–24856. [Google Scholar] [CrossRef]
  19. Yang, Y.; Liu, Z.; Chen, D.; Gu, B.; Gao, B.; Wang, Z.; Guo, Q.; Wang, G. Multifunctional N-doped graphene quantum dots towards tetracycline detection, temperature sensing and high-performance WLEDs. J. Photochem. Photobiol. A Chem. 2021, 405, 112977. [Google Scholar] [CrossRef]
  20. Wang, X.F.; Wang, G.G.; Li, J.B.; Liu, Z.; Zhao, W.F.; Han, J.C. Towards high-powered remote WLED based on flexible white-luminescent polymer composite films containing S, N co-doped graphene quantum dots. Chem. Eng. J. 2018, 336, 406–415. [Google Scholar] [CrossRef]
  21. Yan, F.; Jiang, Y.; Sun, X.; Bai, Z.; Zhang, Y.; Zhou, X. Surface modification and chemical functionalization of carbon dots: A review. Microchim. Acta 2018, 185, 424. [Google Scholar] [CrossRef] [PubMed]
  22. Wang, X.F.; Wang, G.G.; Li, J.B.; Liu, Z.; Chen, Y.X.; Liu, L.F.; Han, J.C. Direct white emissive Cl-doped graphene quantum dots-based flexible film as a single luminophore for remote tunable UV-WLEDs. Chem. Eng. J. 2019, 361, 773–782. [Google Scholar] [CrossRef]
  23. Zhang, G.; Bai, Y.; Yu, C.; Xuan, T. Highly stable carbon nanodot-based phosphor as a color converter for WLED. J. Lumin. 2022, 246, 118836. [Google Scholar] [CrossRef]
  24. Guo, X.; Xu, L.; Zhang, L.; Wang, H.; Wang, X.; Liu, X.; Yao, J.; Hao, A. One-pot solid phase pyrolysis synthesis of highly fluorescent nitrogen-doped carbon dots and the interaction with human serum albumin. J. Lumin. 2018, 196, 100–110. [Google Scholar] [CrossRef]
  25. Yang, G.; Wu, C.; Luo, X.; Liu, X.; Gao, Y.; Wu, P.; Cai, C.; Saavedra, S.S. Exploring the emissive states of heteroatom-doped graphene quantum dots. J. Phys. Chem. C 2018, 122, 6483–6492. [Google Scholar] [CrossRef]
  26. Sadhanala, H.K.; Pagidi, S.; Gedanken, A. High quantum yield boron-doped carbon dots: A ratiometric fluorescent probe for highly selective and sensitive detection of Mg2+ ions. J. Mater. Chem. C 2021, 9, 1632–1640. [Google Scholar] [CrossRef]
  27. Fan, Z.; Li, Y.; Li, X.; Fan, L.; Zhou, S.; Fang, D.; Yang, S. Surrounding media sensitive photoluminescence of boron-doped graphene quantum dots for highly fluorescent dyed crystals, chemical sensing and bioimaging. Carbon 2014, 70, 149–156. [Google Scholar] [CrossRef]
  28. Wang, C.; Wang, Y.; Shi, H.; Yan, Y.; Liu, E.; Hu, X.; Fan, J. A strong blue fluorescent nanoprobe for highly sensitive and selective detection of mercury (II) based on sulfur doped carbon quantum dots. Mater. Chem. Phys. 2019, 232, 145–151. [Google Scholar] [CrossRef]
  29. Li, Y.; Lin, H.; Luo, C.; Wang, Y.; Jiang, C.; Qi, R.; Huang, R.; Travas-sejdic, J.; Peng, H. Aggregation induced red shift emission of phosphorus doped carbon dots. RSC Adv. 2017, 7, 32225–32228. [Google Scholar] [CrossRef]
  30. Omer, K.M.; Hassan, A.Q. Chelation-enhanced fluorescence of phosphorus doped carbon nanodots for multi-ion detection. Microchim. Acta 2017, 184, 2063–2071. [Google Scholar] [CrossRef]
  31. Wu, Y.; Chen, Z.; Cheong, W.C.; Zhang, C.; Zheng, L.; Yan, W.; Yu, R.; Chen, C.; Li, Y. Nitrogen-coordinated cobalt nanocrystals for oxidative dehydrogenation and hydrogenation of N-heterocycles. Chem. Sci. 2019, 10, 5345–5352. [Google Scholar] [CrossRef] [PubMed]
  32. Qi, H.; Zhai, Z.; Dong, X.; Zhang, P. Nitrogen doped carbon quantum dots (N-CQDs) with high luminescence for sensitive and selective detection of hypochlorite ions by fluorescence quenching. Spectrochim. Acta A Mol. Biomol. Spectrosc. 2022, 279, 121456. [Google Scholar] [CrossRef]
  33. Li, W.; Tang, J.; Li, Y.; Bai, H.; Zhang, W.; Zhang, J.; Xiao, Y.; Xu, W. Preparation and fluorescent wavelength control of multi-color nitrogen-doped carbon nano-dots. Nanomaterials 2021, 11, 3190. [Google Scholar] [CrossRef] [PubMed]
  34. Chen, X.; Zhang, H.; Liu, Z.; Qiu, J.; Xu, X. High quality germanate phosphor La(2-x-y)Ge2O7: Tb3+, Eu3+ for WLED applications applications. J. Lumin. 2022, 252, 119295. [Google Scholar] [CrossRef]
  35. Hoerder, G.J.; Seibald, M.; Baumann, D.; Schroder, T.; Peschke, S.; Schmid, P.C.; Tyborski, T.; Pust, P.; Stoll, I.; Bergler, M.; et al. Sr[Li2Al2O2N2]: Eu2+—A high performance red phosphor to brighten the future. Nat. Commun. 2019, 10, 1824. [Google Scholar] [CrossRef] [PubMed]
  36. Mu, Y.; Wang, N.; Sun, Z.; Wang, J.; Li, J.; Yu, J. Carbogenic nanodots derived from organo-templated zeolites with modulated full-color luminescence. Chem. Sci. 2016, 7, 3564–3568. [Google Scholar] [CrossRef] [PubMed]
  37. Soni, N.; Singh, S.; Sharma, S.; Batra, G.; Kaushik, K.; Rao, C.; Verma, N.C.; Mondal, B.; Yadav, A.; Nandi, C.K. Absorption and emission of light in red emissive carbon nanodots. Chem. Sci. 2021, 12, 3615–3626. [Google Scholar] [CrossRef]
  38. Jang, H.S.; Yang, H.; Kim, S.W.; Han, J.Y.; Lee, S.G.; Jeon, D.Y. White light-emitting diodes with excellent color rendering based on organically capped CdSe quantum dots and Sr3SiO5: Ce3+, Li+ phosphors. Adv. Mater. 2008, 20, 2696–2702. [Google Scholar] [CrossRef]
  39. Dutzler, D.; Seibald, M.; Baumann, D.; Huppertz, H. Alkali Lithosilicates: Renaissance of a reputable substance class with surprising luminescence properties. Angew. Chem. Int. Ed. Engl. 2018, 57, 13676–13680. [Google Scholar] [CrossRef]
  40. Hudson, M.H.; Chen, M.; Kamysbayev, V.; Janke, E.M.; Lan, X.; Allan, G.; Delerue, C.; Lee, B.; Guyot-Sionnest, P.; Talapin, D.V. Conduction band fine structure in colloidal HgTe quantum dots. ACS Nano 2018, 12, 9397–9404. [Google Scholar] [CrossRef]
  41. Wang, Z.; Yuan, F.; Li, X.; Li, Y.; Zhong, H.; Fan, L.; Yang, S. 53% efficient red emissive carbon quantum dots for high color rendering and stable warm white-light-emitting diodes. Adv. Mater. 2017, 29, 1702910. [Google Scholar] [CrossRef] [PubMed]
  42. Qu, S.; Zhou, D.; Li, D.; Ji, W.; Jing, P.; Han, D.; Liu, L.; Zeng, H.; Shen, D. Toward efficient orange emissive carbon nanodots through conjugated sp2-domain controlling and surface charges engineering. Adv. Mater. 2016, 28, 3516–3521. [Google Scholar] [CrossRef] [PubMed]
  43. Wang, B.; Song, H.; Tang, Z.; Yang, B.; Lu, S. Ethanol-derived white emissive carbon dots: The formation process investigation and multi-color/white LEDs preparation. Nano Res. 2021, 15, 942–949. [Google Scholar] [CrossRef]
  44. Wang, L.; Li, W.; Yin, L.; Liu, Y.; Guo, H.; Lai, J.; Han, Y.; Li, G.; Li, M.; Zhang, J.; et al. Full-color fluorescent carbon quantum dots. Sci. Adv. 2020, 6, eabb6772. [Google Scholar] [CrossRef]
  45. Zhang, X.; Zeng, L.; Sun, T.; Xue, X.; Wei, B. Facilely synthesized carbon dots and configurated light-emitting diodes with efficient electroluminescence. Phys. Chem. Chem. Phys. 2022, 24, 26511–26518. [Google Scholar] [CrossRef]
  46. Li, W.; Wu, M.; Jiang, H.; Yang, L.; Liu, C.; Gong, X. Carbon dots/ZnO quantum dots composite-based white phosphors for white light-emitting diodes. Chem. Commun. 2022, 58, 1910–1913. [Google Scholar] [CrossRef]
  47. Yan, X.; Wei, P.; Liu, Y.; Wang, M.; Chen, C.; Zhao, J.; Li, G.; Saha, M.L.; Zhou, Z.; An, Z.; et al. Endo- and exo-functionalized tetraphenylethylene M12L24 nanospheres: Fluorescence emission inside a confined space. J. Am. Chem. Soc. 2019, 141, 9673–9679. [Google Scholar] [CrossRef]
  48. Kumari, R.; Kumar, A.; Mishra, N.K.; Sahu, S.K. Polymer-induced emission-active fluorine-embedded carbon dots for the preparation of warm WLEDs with a high color rendering index. Langmuir 2022, 38, 9389–9399. [Google Scholar] [CrossRef]
  49. Aghamali, A.; Khosravi, M.; Hamishehkar, H.; Modirshahla, N.; Behnajady, M.A. Preparation of novel high performance recoverable and natural sunlight-driven nanocomposite photocatalyst of Fe3O4/C/TiO2/N-CQDs. Mater. Sci. Semicond. Process. 2018, 87, 142–154. [Google Scholar] [CrossRef]
  50. Gu, S.; Hsieh, C.T.; Ashraf Gandomi, Y.; Li, J.; Yue, X.X.; Chang, J.K. Tailoring fluorescence emissions, quantum yields, and white light emitting from nitrogen-doped graphene and carbon nitride quantum dots. Nanoscale 2019, 11, 16553–16561. [Google Scholar] [CrossRef]
  51. Tarakeshwar, P.; Manogaran, S. Ground state vibrations of citric acid and the citrate trianion—An ab initio study. Spectrochim. Acta A Mol. Biomol. Spectrosc. 1994, 50, 2327–2343. [Google Scholar] [CrossRef]
  52. Jiang, Y.; Li, Y.; Li, Y.; Li, S. A sensitive enzyme-free hydrogen peroxide sensor based on a chitosan–graphene quantum dot/silver nanocube nanocomposite modified electrode. Anal. Methods 2016, 8, 2448–2455. [Google Scholar] [CrossRef]
  53. Strauss, V.; Wang, H.; Delacroix, S.; Ledendecker, M.; Wessig, P. Carbon nanodots revised: The thermal citric acid/urea reaction. Chem. Sci. 2020, 11, 8256–8266. [Google Scholar] [CrossRef] [PubMed]
  54. Qiu, L.Y.; Bae, Y.H. Self-assembled polyethylenimine-graft-poly(epsilon-caprolactone) micelles as potential dual carriers of genes and anticancer drugs. Biomaterials 2007, 28, 4132–4142. [Google Scholar] [CrossRef] [PubMed]
  55. Ghanbari, N.; Salehi, Z.; Khodadadi, A.A.; Shokrgozar, M.A.; Saboury, A.A. Glucosamine-conjugated graphene quantum dots as versatile and pH-sensitive nanocarriers for enhanced delivery of curcumin targeting to breast cancer. Mater. Sci. Eng. C 2021, 121, 111809. [Google Scholar] [CrossRef] [PubMed]
  56. Ertani, A.; Francioso, O.; Tinti, A.; Schiavon, M.; Pizzeghello, D.; Nardi, S. Evaluation of seaweed extracts from laminaria and ascophyllum nodosum spp. as biostimulants in Zea mays L. Using a combination of chemical, biochemical and morphological approaches. Front. Plant Sci. 2018, 9, 428. [Google Scholar] [CrossRef] [PubMed]
  57. He, J.; Wang, N.; Cui, Z.; Du, H.; Fu, L.; Huang, C.; Yang, Z.; Shen, X.; Yi, Y.; Tu, Z.; et al. Hydrogen substituted graphdiyne as carbon-rich flexible electrode for lithium and sodium ion batteries. Nat. Commun. 2017, 8, 1172. [Google Scholar] [CrossRef]
  58. Wen, D.; Liu, W.; Haubold, D.; Zhu, C.; Oschatz, M.; Holzschuh, M.; Wolf, A.; Simon, F.; Kaskel, S.; Eychmuller, A. Gold aerogels: Three-dimensional assembly of nanoparticles and their use as electrocatalytic interfaces. ACS Nano 2016, 10, 2559–2567. [Google Scholar] [CrossRef]
  59. Liang, K.; Spiesz, E.M.; Schmieden, D.T.; Xu, A.W.; Meyer, A.S.; Aubin-Tam, M.E. Bioproduced polymers self-assemble with graphene oxide into nanocomposite films with enhanced mechanical performance. ACS Nano 2020, 14, 14731–14739. [Google Scholar] [CrossRef]
  60. Shin, S.R.; Zihlmann, C.; Akbari, M.; Assawes, P.; Cheung, L.; Zhang, K.; Manoharan, V.; Zhang, Y.S.; Yuksekkaya, M.; Wan, K.T.; et al. Reduced graphene Oxide-GelMA hybrid hydrogels as scaffolds for cardiac tissue engineering. Small 2016, 12, 3677–3689. [Google Scholar] [CrossRef]
  61. Dostert, K.H.; O’Brien, C.P.; Mirabella, F.; Ivars-Barcelo, F.; Schauermann, S. Adsorption of acrolein, propanal, and allyl alcohol on Pd(111): A combined infrared reflection-absorption spectroscopy and temperature programmed desorption study. Phys. Chem. Chem. Phys. 2016, 18, 13960–13973. [Google Scholar] [CrossRef] [PubMed]
  62. Shah, F.; Nicolas, C.; Bentzer, J.; Ellstrom, M.; Smits, M.; Rineau, F.; Canback, B.; Floudas, D.; Carleer, R.; Lackner, G.; et al. Ectomycorrhizal fungi decompose soil organic matter using oxidative mechanisms adapted from saprotrophic ancestors. New Phytol. 2016, 209, 1705–1719. [Google Scholar] [CrossRef] [PubMed]
  63. Schroer, Z.S.; Wu, Y.; Xing, Y.; Wu, X.; Liu, X.; Wang, X.; Pino, O.G.; Zhou, C.; Combs, C.; Pu, Q.; et al. Nitrogen–sulfur-doped graphene quantum dots with metal ion-resistance for bioimaging. ACS Appl. Nano Mater. 2019, 2, 6858–6865. [Google Scholar] [CrossRef]
  64. Zhang, T.; Zhao, F.; Li, L.; Qi, B.; Zhu, D.; Lu, J.; Lu, C. Tricolor white-light-emitting carbon dots with multiple-cores@shell structure for WLED application. ACS Appl. Mater. Interfaces 2018, 10, 19796–19805. [Google Scholar] [CrossRef] [PubMed]
  65. Hou, J.; Wang, W.; Zhou, T.; Wang, B.; Li, H.; Ding, L. Synthesis and formation mechanistic investigation of nitrogen-doped carbon dots with high quantum yields and yellowish-green fluorescence. Nanoscale 2016, 8, 11185–11193. [Google Scholar] [CrossRef]
  66. Li, Y.; Shi, Y.; Song, X.; Zhao, Z.; Zhang, N.; Hao, C. Pitch-derived carbon quantum dots as fluorescent probe for selective and sensitive detection of ferric ions and bioimaging. J. Photochem. Photobiol. A Chem. 2021, 412, 113253. [Google Scholar] [CrossRef]
  67. Li, Y.; Liu, X.; Wang, J.; Liu, H.; Li, S.; Hou, Y.; Wan, W.; Xue, W.; Ma, N.; Zhang, J.Z. Chemical nature of redox-controlled photoluminescence of graphene quantum dots by post-synthesis treatment. J. Phys. Chem. C 2016, 120, 26004–26011. [Google Scholar] [CrossRef]
  68. Hola, K.; Sudolska, M.; Kalytchuk, S.; Nachtigallova, D.; Rogach, A.L.; Otyepka, M.; Zboril, R. Graphitic nitrogen triggers red fluorescence in carbon dots. ACS Nano 2017, 11, 12402–12410. [Google Scholar] [CrossRef]
  69. Tang, L.; Ji, R.; Cao, X.; Lin, J.; Jiang, H.; Li, X.; Teng, K.S.; Luk, C.M.; Zeng, S.; Hao, J.; et al. Deep ultraviolet photoluminescence of water-soluble self-passivated graphene quantum dots. ACS Nano 2012, 6, 5102–5110. [Google Scholar] [CrossRef]
  70. Liu, Y.; Liu, Y.; Mernaugh, R.L.; Zeng, X. Single chain fragment variable recombinant antibody functionalized gold nanoparticles for a highly sensitive colorimetric immunoassay. Biosens. Bioelectron. 2009, 24, 2853–2857. [Google Scholar] [CrossRef]
  71. Rao, L.; Tang, Y.; Lu, H.; Yu, S.; Ding, X.; Xu, K.; Li, Z.; Zhang, J.Z. Highly photoluminescent and stable N-doped carbon dots as nanoprobes for Hg2+ detection. Nanomaterials 2018, 8, 900. [Google Scholar] [CrossRef] [PubMed]
  72. Qi, C.; Wang, H.; Yang, A.; Wang, X.; Xu, J. Facile fabrication of highly fluorescent N-doped carbon quantum dots using an ultrasonic-assisted hydrothermal method: Optical properties and cell imaging. ACS Omega 2021, 6, 32904–32916. [Google Scholar] [CrossRef] [PubMed]
  73. Wang, H.; Qi, C.; Yang, A.; Wang, X.; Xu, J. One-pot synthesis of bright blue luminescent N-doped GQDs: Optical properties and cell imaging. Nanomaterials 2021, 11, 2798. [Google Scholar] [CrossRef]
  74. Page, R.C.; Espinobarro-Velazquez, D.; Leontiadou, M.A.; Smith, C.; Lewis, E.A.; Haigh, S.J.; Li, C.; Radtke, H.; Pengpad, A.; Bondino, F.; et al. Near-unity quantum yields from chloride treated CdTe colloidal quantum dots. Small 2015, 11, 1548–1554. [Google Scholar] [CrossRef] [PubMed]
  75. Slimani, Y.; Almessiere, M.A.; Guner, S.; Kurtan, U.; Baykal, A. Impacts of sol-gel auto-combustion and ultrasonication approaches on structural, magnetic, and optical properties of Sm-Tm co-substituted Sr0.5Ba0.5Fe12O19 nanohexaferrites: Comparative study. Nanomaterials 2020, 10, 272. [Google Scholar] [CrossRef] [PubMed]
  76. Tanwar, A.S.; Hussain, S.; Malik, A.H.; Afroz, M.A.; Iyer, P.K. Inner filter effect based selective detection of nitroexplosive-picric acid in aqueous solution and solid support using conjugated polymer. ACS Sens. 2016, 1, 1070–1077. [Google Scholar] [CrossRef]
  77. Jiang, K.; Luo, S.H.; Pang, C.M.; Wang, B.W.; Wu, H.Q.; Wang, Z.Y. A functionalized fluorochrome based on quinoline-benzimidazole conjugate: From facile design to highly sensitive and selective sensing for picric acid. Dyes Pigm. 2019, 162, 367–376. [Google Scholar] [CrossRef]
  78. Gu, B.; Liu, Z.; Chen, D.; Gao, B.; Yang, Y.; Guo, Q.; Wang, G. Solid-state fluorescent nitrogen doped graphene quantum dots with yellow emission for white light-emitting diodes. Synth. Met. 2021, 277, 116787. [Google Scholar] [CrossRef]
  79. Kumar Panigrahi, S.; Kumar Mishra, A. Inner filter effect in fluorescence spectroscopy: As a problem and as a solution. J. Photochem. Photobiol. C 2019, 41, 100318. [Google Scholar] [CrossRef]
  80. Zhang, H.; Chen, Y.; Liang, M.; Xu, L.; Qi, S.; Chen, H.; Chen, X. Solid-phase synthesis of highly fluorescent nitrogen-doped carbon dots for sensitive and selective probing ferric ions in living cells. Anal. Chem. 2014, 86, 9846–9852. [Google Scholar] [CrossRef]
  81. Meng, X.; Chang, Q.; Xue, C.; Yang, J.; Hu, S. Full-colour carbon dots: From energy-efficient synthesis to concentration-dependent photoluminescence properties. Chem. Commun. 2017, 53, 3074–3077. [Google Scholar] [CrossRef]
  82. Chen, Y.; Lian, H.; Wei, Y.; He, X.; Chen, Y.; Wang, B.; Zeng, Q.; Lin, J. Concentration-induced multi-colored emissions in carbon dots: Origination from triple fluorescent centers. Nanoscale 2018, 10, 6734–6743. [Google Scholar] [CrossRef] [PubMed]
  83. Bhattacharya, S.; Phatake, R.S.; Nabha Barnea, S.; Zerby, N.; Zhu, J.J.; Shikler, R.; Lemcoff, N.G.; Jelinek, R. Fluorescent self-healing carbon dot/polymer gels. ACS Nano 2019, 13, 1433–1442. [Google Scholar] [CrossRef] [PubMed]
  84. Chen, W.C.; Yuan, Y.; Zhu, Z.L.; Jiang, Z.Q.; Su, S.J.; Liao, L.S.; Lee, C.S. De novo design of D-sigma-A molecules as universal hosts for monochrome and white phosphorescent organic light-emitting diodes. Chem. Sci. 2018, 9, 4062–4070. [Google Scholar] [CrossRef] [PubMed]
  85. Zhang, Y.; Zhuo, P.; Yin, H.; Fan, Y.; Zhang, J.; Liu, X.; Chen, Z. Solid-state fluorescent carbon dots with aggregation-induced yellow emission for white light-emitting diodes with high luminous efficiencies. ACS Appl. Mater. Interfaces 2019, 11, 24395–24403. [Google Scholar] [CrossRef] [PubMed]
  86. Ma, Z.; Liu, Z.; Lu, S.; Wang, L.; Feng, X.; Yang, D.; Wang, K.; Xiao, G.; Zhang, L.; Redfern, S.A.T.; et al. Pressure-induced emission of cesium lead halide perovskite nanocrystals. Nat. Commun. 2018, 9, 4506. [Google Scholar] [CrossRef]
  87. Ha, J.; Seo, Y.; Kim, Y.; Lee, J.; Lee, H.; Kim, S.; Choi, Y.; Oh, H.; Lee, Y.; Park, E.; et al. Synthesis of nitrogen-doped carbon nanodots to destroy bacteria competing with Campylobacter jejuni in enrichment medium, and development of a monoclonal antibody to detect C. jejuni after enrichment. Int. J. Food Microbiol. 2021, 339, 109014. [Google Scholar] [CrossRef]
Figure 1. Schematic diagram of the fabrication of PEI@CNDs.
Photonics 10 00262 g001
Figure 2. (A) TEM, (BD) AFM, and (E) XRD pattern of the PEI@CNDs.
Photonics 10 00262 g002
Figure 3. FTIR spectra of (a) CA, (b) L-Glu, (c) PEI, and (d) PEI@CNDs.
Photonics 10 00262 g003
Figure 4. (A) XPS full scan spectrum of the PEI@CNDs, and high solution XPS spectra of (B) C1s, (C) N1s, and (D) O1s.
Photonics 10 00262 g004
Figure 5. (A) The absorption (Abs), excitation (PLE), and emission (PL) spectra of PEI@CNDs; (B) the PL spectra of PEI@CNDs under various excitation wavelengths; (C) the peak positions, and (D) the maximum intensities of the PL spectra varying with the excitation wavelengths in (B). The concentration of the PEI@CNDs is 0.1 mg/mL.
Photonics 10 00262 g005
Figure 6. The photo-stability of the PEI@CNDs. (A) The photo-bleaching resistance; (B) the PL peak intensities change with temperature; (C) the PL spectra varying with pH, the inset shows the corresponding bar chart; and (D) the PL peak intensity changes within 60 days.
Photonics 10 00262 g006
Figure 7. (A) UV–Vis absorption spectra and (B) the calculated energy band gaps of PEI@CNDs at various concentrations (0.1, 0.2, 1.0, 2.0, and 10.0 mg/mL); PL spectra of PEI@CNDs at higher concentrations of (C) 0.2 mg/mL, (D) 1.0 mg/mL, (E) 2.0 mg/mL, and (F) 10.0 mg/mL.
Photonics 10 00262 g007
Figure 8. Confocal fluorescence images of (A) 1.0 mg/mL (with 405 nm and 488 nm laser co-excitation) and (B) 10.0 mg/mL (with 488 nm laser excitation) of PEI@CNDs solutions.
Photonics 10 00262 g008
Figure 9. Spectral overlap between the absorption spectrum of 10.0 mg/mL PEI@CNDs solution and the PL spectra of 0.1, 0.2 1.0, 2.0 mg/mL PEI@CNDs solutions, in which the PL spectrum of 2.0 mg/mL sample was enlarged five times.
Photonics 10 00262 g009
Figure 10. Time-resolved PL decay curves of PEI@CNDs at 0.1, 1.0 and 10.0 mg/mL. (A) λem = 450 nm, and λex = 375 nm; and (B) λem = 530 nm, and λex = 420 nm.
Photonics 10 00262 g010
Figure 11. PL spectra of WLEDs with (A) 0 mm, (B) 0.5 mm, (C) 1.0 mm, (D) 1.5 mm (E) 2.0 mm, (F) 2.5 mm, (G) 3.0 mm films, the insets in each picture are the images of the model WLEDs; and (H) the CIE coordinates of the WLEDs.
Photonics 10 00262 g011
Table 1. Fluorescence lifetimes of PEI@CNDs solutions at different concentrations (0.1, 1.0, and 10.0 mg/mL) with 375 nm excitation, 450 nm monitoring, and 420 nm excitation, 530 monitoring, respectively.
Ex/Em (nm)Concentration (mg/mL)τ1 (ns)α1 (%)τ2 (ns)α2 (%)τav (ns)
375/4500.11.8921.668.9778.347.44
1.02.0125.098.7274.917.03
10.01.6625.267.6374.746.13
420/5300.11.8924.928.4475.086.81
1.01.5918.657.8481.356.67
10.01.9226.557.8673.456.28
Disclaimer/Publisher’s Note: The statements, opinions and data contained in all publications are solely those of the individual author(s) and contributor(s) and not of MDPI and/or the editor(s). MDPI and/or the editor(s) disclaim responsibility for any injury to people or property resulting from any ideas, methods, instructions or products referred to in the content.

