Patent Technology Network Analysis of Machine-Learning Technologies and Applications in Optical Communications


Science and Technology Policy Research and Information Center, National Applied Research Laboratories, Taipei 10663, Taiwan
Photonics 2020, 7(4), 131; https://0-doi-org.brum.beds.ac.uk/10.3390/photonics7040131
Submission received: 12 October 2020
/
Revised: 13 December 2020
/
Accepted: 14 December 2020
/
Published: 15 December 2020
(This article belongs to the Special Issue Advanced Technique and Future Perspective for Next Generation Optical Fiber Communications)
Abstract
:As the Internet of Things (IoT) develops, applying machine learning on optical communications has become a prospective field of research. Scholars have mostly concentrated on algorithmic techniques or specific applications but have been unable to address the distribution of machine-learning technologies and the development of its applications in optical communications from a macro perspective. Therefore, in this paper, machine-learning patents in optical communications are taken as the analytical basis for constructing a patent technology network. The study results revealed that key technologies were primarily in data input and output devices, data-processing methods, wireless communication networks, and the transmission of digital information in optical communications. Such technologies were also applied to perform measurement for diagnostic purposes and medical diagnoses. The technology network model proposed in this paper explores the technological development trends of machine learning in optical communications and serves as a reference for allocating research and development resources.
1. Introduction
Optical communications have greatly advanced in signal serial communication speed, agile channel spacing, modulation formats, and coding schemes. However, relevant technologies have yet to fully meet the complexity and performance requirements of future optical communication system networks. The distinguishing features of machine learning are its autonomous learning and evolution ability. With new information, a system can modulate its structure and parameters to build a new mapping network and enable new skills [1]. At present, machine-learning technologies play a significant role in network planning, failure prediction, and optical performance monitoring in optical communication systems [2,3,4]. In the future, intelligent optical communication system networks will be automated and adaptive and become capable of predicting traffic demands to maximize performance. To achieve this goal, the integration of machine-learning mathematics, programming, and algorithms is necessary in optical communications, and these are the key directions of future optical communication development.
Integrating machine learning and optical communication technologies—in essence, combining computer science with communication—is a forward-looking research field. Machine-learning technologies have been highly effective in classification tasks, particularly when signals are non-linear and distorted [5]. Machine learning predicts and eliminates defects in a system by learning its properties. Current signal analysis systems are ineffective in classifying signals. However, machine learning can be applied to such systems to identify patterns in collected data and boost the systems’ signal analysis performance. In truth, more scholars have begun to focus on developing this technology [2,4,6]. Studies have mainly focused on algorithmic techniques [4,7] or specific applications [2,8]; however, these studies have not addressed the technological distribution and application development of machine learning in optical communication from a macro perspective. In particular, the rapid development of machine learning has gradually rendered relevant technologies a powerful tool for enterprises in smart manufacturing to increase output value. The development of the Internet of Things (IoT) and its high-speed, low-latency, and large-data transmission characteristics will drive optical communication needs. Integrating the machine-learning and optical communication technologies will unlock unlimited business opportunities in the future; thus, defining key technologies and their applications are critical. In the current phase of machine learning, where personnel and funds should be directed, is the most crucial consideration in optical communications for government and industry actors. Machine learning was applied for interface arrangements, image capture, encoding, decoding, and code conversion. Governments may consider investing more research funds and resources toward academic research for developing technologies in this field. This study addressed this topic through employing technology network analysis to analyze and identify key technologies.
This paper focuses on technology networks for machine learning in optical communications and constructs a technology network model through patent analysis. Patents are the most direct method of measuring the industrialization of technology, and previous measurements of technology transfers [9,10] and studies on technology development trajectories [11,12] and industrial technology development maps [13,14] have used patents. Therefore, patent information is one of the most direct metrics for technological development. Patent information forms the basis of this paper’s observation of technological development trends and key technological fields. In terms of the screening of machine learning and optical communications patents, a prior art search for patents in the past mainly involved the use of keywords [15,16], similarities in International Patent Classification (IPC) codes [17,18], or the establishment of a topic-dependent citation graph [19]. The patents were retrieved using Derwent smart search (SSTO), which involves hundreds of experts who read and translate the open information of official patents in various databases before rewriting the key abstracts, eliminating content errors, and normalizing the patentees. The revised and normalized data are logged into a database after manual browsing and sorting.
This study differs from previous explorations of algorithmic techniques and applications by mainly exploring key technologies and applicable developments for machine learning in optical communications. It focuses on building a technology network model and identifying technological development trends. The study results can serve as a reference for government and industry actors.
2. Literature Review
2.1. Current Development of Machine Learning in Optical Communications
The two vital forces driving the advancement of the overall communications industry are fifth-generation mobile communication system (5G) and artificial intelligence (AI) technologies. To increase communication transmission speeds, the application of optical communications technology has gradually increased in the 5G field. A study by MarketsandMarkets stated, “The global optical communication and networking equipment market size was valued at USD 18.9 billion in 2020 and is projected to reach USD 27.8 billion by 2025; it is growing at a compound annual growth rate (CAGR) of 8.0% from 2020 to 2025” [20]. AI fulfills critical roles in optical communication industries, including optical network planning and operations in transport and access networks [21]. Machine learning is the basis of AI, and studies have argued that machine-learning techniques are used for many optical network applications. The applications of machine learning are classified by their use in cases, which are categorized into optical network control and resource management and optical network monitoring and survivability [22]. Therefore, methods of improving the performance of optical communications through mathematical methods and algorithms related to machine learning may become the trend of future research.
To satisfy the growing traffic demands of mobile communications and transmitting diverse and high-quality data through methods such as IoT, the goal of developing optical communications is to integrate machine learning and create deeply intelligent control management systems. Topics on involving machine learning in optical communications are diverse and include optical performance monitoring, fiber non-linearity compensation, cognitive network failure prediction, dynamic planning, the cross-layer optimization of software-defined networks, the quality of transmission estimation, and the physical layer design of optical communication systems [23]. These techniques involve optics, mathematics, computer science, communications, and semiconductors and belong to cross-disciplinary technical fields. Developments in IoT technologies, mobile communications, and optical communications have led multiple governments to focus on machine-learning applications in optical communications. Optical communications will gradually become widespread among most users. The sending of large volumes of sound, video, and image data is reliant on AI technologies such as machine learning for computing and transmission, and the range of applicable fields is wide. Therefore, this study analyzed the technological development and applicable fields of machine learning in optical communications, and patents were examined to identify key technologies. The exploration into these key technologies was conducted through network analysis, which is further explained in the following section.
2.2. Technology Network Analysis Model
In recent years, studies have explored the development and trends of technological innovation through network analysis methods [24,25] or sought to understand the technical partnership between institutions or inventors through network analysis [26,27] to explore the flow of knowledge [28,29]. Network analysis can be used to accurately illustrate the transmission paths and evolution of technology and knowledge. Analysis of patent data in particular can provide objective and feasible data, such as the year the patent was approved, the quantity of the patent, and the type of technology used [13]. Therefore, this study used patent data to analyze the development of specific technologies, and based on the features of network analysis, the relationship between technical fields were analyzed using co-classification. Because each patent may be involved in multiple technical fields, co-classification can be used to define the relationship between technical fields [30,31] and pinpoint key technologies on the basis of technology networks. The classification framework of technical fields was based on the current the IPC system, and this study used the technology network analysis model to explore key technical fields in machine learning in optical communications.
3. Research Design
3.1. Retrieval Strategy and Data Source
In this study, the patent analysis was based on data from the United States Patent and Trademark Office (USPTO), a historic organization whose development and data can be traced back to 1975. Because the United States is the largest commercial trade market in the world, most inventors who apply for patents in other countries also submit patent applications in the United States. Therefore, researchers generally use the USPTO database to examine global innovation activities [13,14]. Patents explored in this study were limited to US patents that were announced between January 2015 and December 2019. In this study, the patents were retrieved using SSTO, and the search criteria were (SSTO/Machine Learning) and (SSTO/Optical Communications), which returned 824 patents in total.
3.2. Network Centrality Analysis
In this study, key technologies in patent technology networks were identified through technology network centrality. The methods of measuring network centrality are explained as follows.
3.2.1. Degree Centrality
Degree centrality is the number of nodes that are adjacent a specific node and can be used to evaluate the core of a patent technology network. High degree centrality represents a greater number of connected nodes in a network, and degree centrality in specific networks of links represents critical transitions that will become a hot spot in the network [32].
If nodes i and j are connected, then = 1.
3.2.2. Eigenvector Centrality
Eigenvector centrality measures the influence of a node in a network. In addition to whether a node is connected with other nodes, relevant analysis focuses on whether the nodes connected to this nodes are linked with other nodes. The centrality of a node is determined by the centrality of its adjacent nodes. If a node is connected to nodes with high centrality, the node in question has higher degree centrality. This indicates that degree centrality differs between adjacent nodes. Analysis of eigenvector centrality can determine the relative importance of a node and constitutes a crucial research field in technology networks.
where and are the eigenvector centrality of nodes i and j, respectively; represents the node entering the adjacency matrix A; and λ is a constant and the largest eigenvalue in the adjacency matrix A.
In this equation, eigenvector centrality views the centrality of a single node as the linear combination of the centrality of all other nodes to derive a linear function [33].
3.2.3. Structural Hole
Structural holes can be used to assess the ability of a node as a mediator in the overall network. This concept describes the characteristics of a node that occupies the main communication and information channels in the network, which is associated with the hole effect [34]. This is the degree to which the connections between clusters depend on the node in question. The gaps between clusters provide opportunities to build a network of bridges. If any technology becomes a bridge to connect two non-overlapping technology clusters, that bridging technology gains a spatial advantage in the overall technology network. Burt [34] argued that structural hole effects can be measured using a network constraint index, with a value between 0 and 1. A high network constraint index indicates low autonomy and a low structural hole effect in the entity.
where is the score of the constraint on node i by node j; is the proportion of connections with node j among the connections of node i; is the relational ratio of node j with the other connections of all nodes; and is the ratio of all other nodes with node j connections.
This equation sums all node j totals, and this sum is the total constraint on node i in the network [34]; ergo, .
4. Results
4.1. Patent Retrieval Results
Before performing technology network analysis, the patent retrieval results were analyzed to gain a preliminary overview of technological development. Machine-learning technologies in optical communications involved 407 four-digit IPCs, which indicated a wide scope of involvement. Table 1 presents the quantity of the top 10 four-digit IPCs.
In Table 1, the frequency denotes the number of patents that have appeared in the IPC classification; for example, 170 patents under G06F17 belonged to the IPC classification. The percentage represents the proportion accounted for by an IPC classification out of the total number of IPC classifications; for example, the 824 patents contained 3291 IPC classifications (one patent might have more than two IPC classifications), and G06F17 appeared 170 times, accounting for 5.17%. The results indicated that that the technologies were mostly concentrated under the classifications G06F17, G06F3, G06K9, H04L29, and A61B5 (Table 1); Appendix A displays the definition of each IPC code. According to the IPC definitions, G06F17 refers to data-processing methods, and G06F3 is the classification for data input and output devices (e.g., interface arrangements). G06K9 covers methods and devices for recognizing patterns, and H04L29 is communication control. A61B5 is the classification for measuring diagnostic purposes, among which G06F17 was more related to AI [35] because it appeared the most frequently.
The analysis results of the top ten patentees revealed that Apple Inc., which focuses on AI and communication technology development, holds the greatest number of patents, followed by SAS Institute Inc., Intel Corporation, and International Business Machines Corporation, which are global leaders in intelligent software and services (Table 2). The next patentee, Volcano Corporation, develops biological diagnostic systems with ultrahigh resolution and holds numerous patents to technologies that can be applied for medical diagnostics.
Furthermore, G06N in three-digit IPCs describes computer systems based on specific computational models, and G06N will be subdivided into four-digit IPCs, which is further explained different computational models. Therefore, the patents collected in this study reveal computational models (i.e., G06N). In this study, four-digit IPCs related to G06N appeared 131 times, and the distribution of the four-digit IPCs, including computer systems based on biological models (G06N3), computer systems using knowledge-based models (G06N5), subject matter not provided for in other groups of this subclass (G06N99), as shown in Table 3.
4.2. Technology Network Analysis
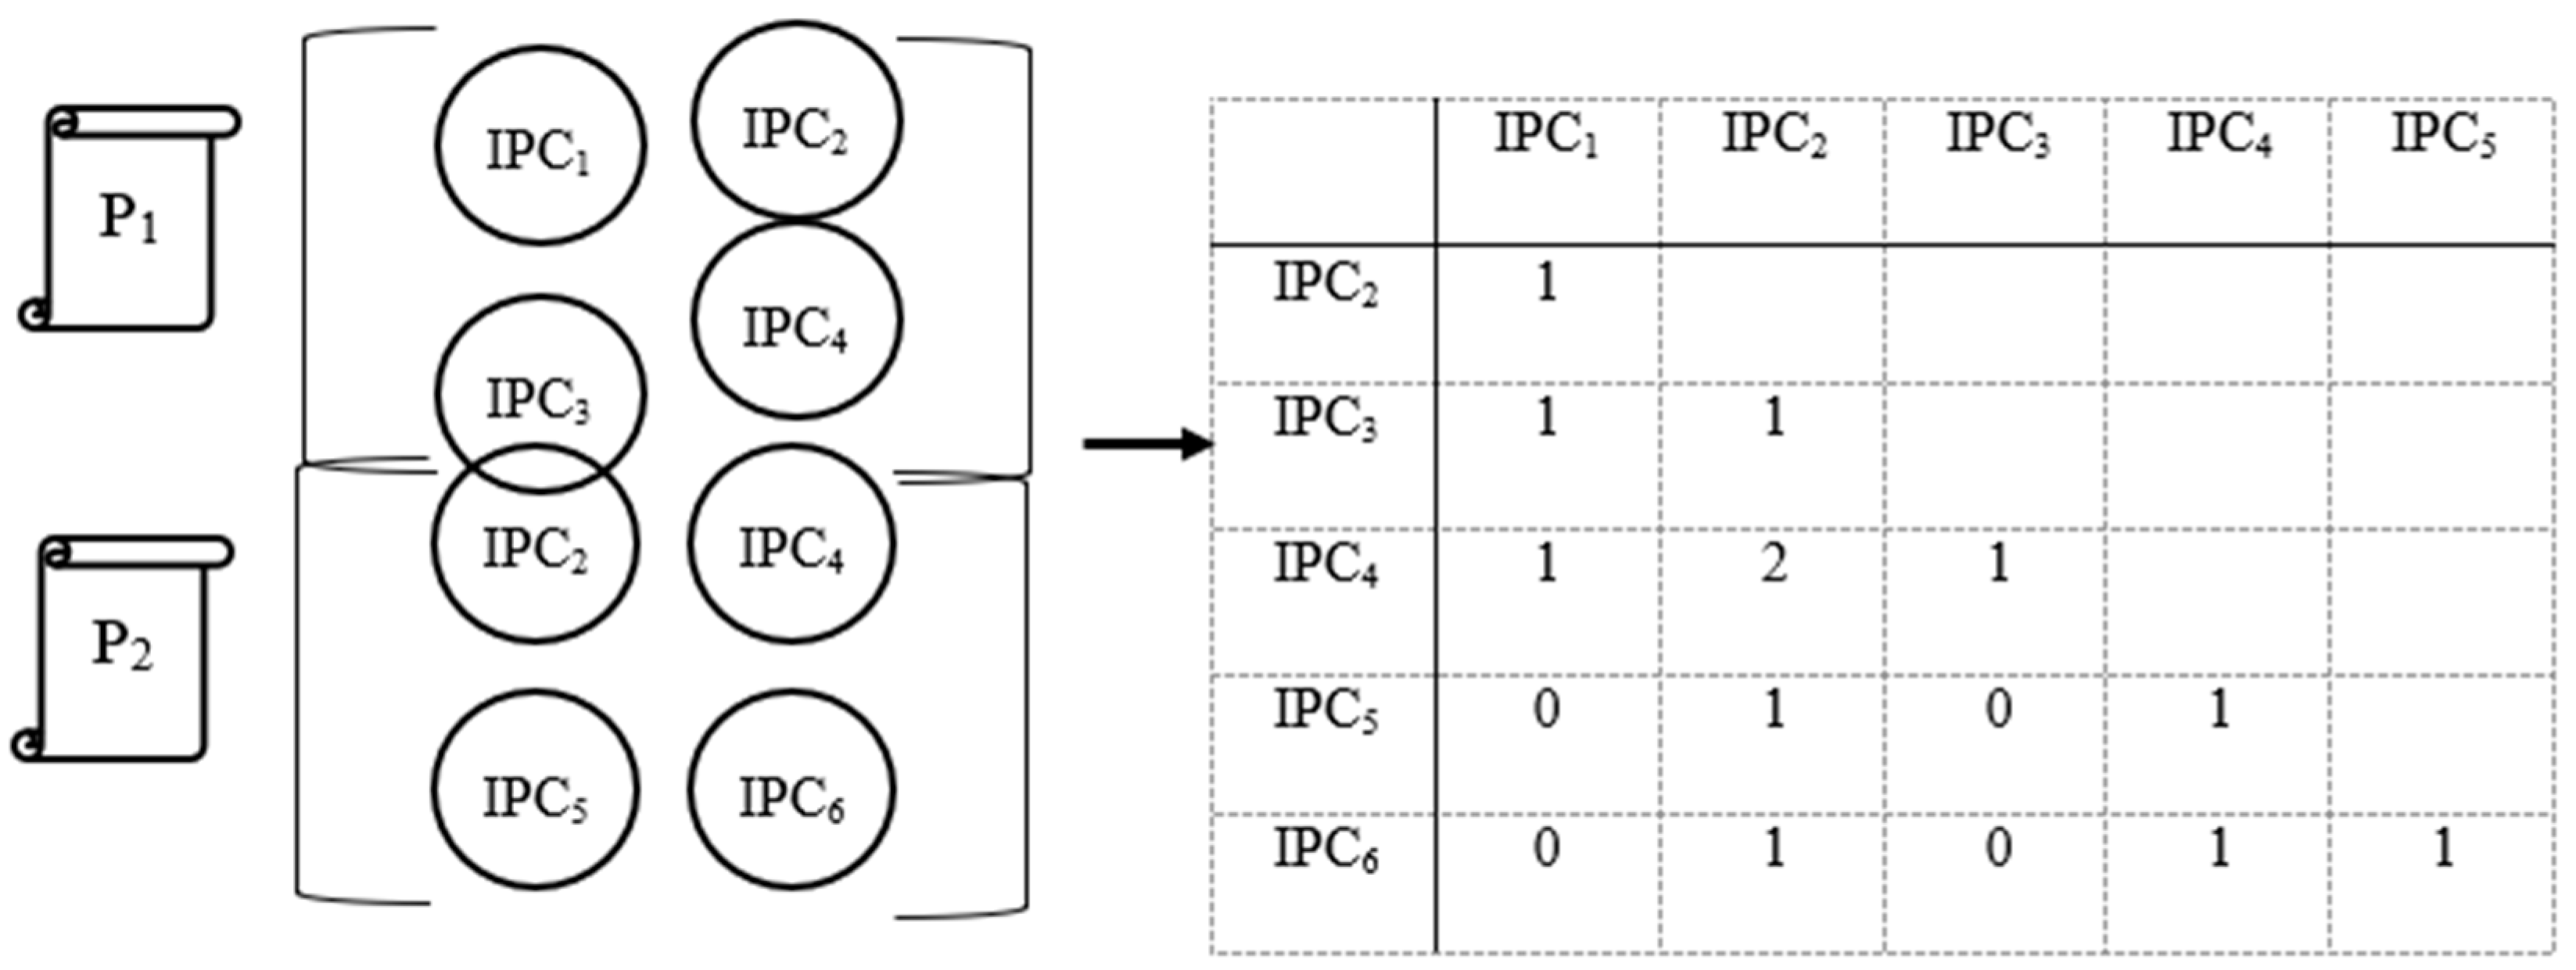
The results of previous studies have suggested that technology co-classification analysis can be used to analyze the relationship between fields of technology [30,31]. Because patents may be subject to multiple patent classification codes, co-classification information can be used to define the relationship between technical fields, as shown in Figure 1.
The numbers in the matrix in Figure 1 represent the frequencies of different IPCs appearing in the same patent. A greater number represents a stronger technical connection between IPCs. For example, the IPCs of P1 belong to IPC1, IPC2, IPC3, and IPC4. Because IPC1, IPC2, IPC3, and IPC4 simultaneously appear in P1, a technical connection exists among IPC1, IPC2, IPC3, and IPC4. Moreover, regarding the relationship between IPC1 and other technical fields, because IPC1, IPC2, IPC3, and IPC4 only appear simultaneously in P1, the technical connections between IPC1 and IPC2, IPC3, and IPC4 were consistently “1”, as shown in the first column of the matrix. Because IPC1 does not concurrently appear with IPC5 and IPC6 in patents, the technical connection of IPC1 to IPC5 and IPC6 is “0”. This approach was adopted to gradually develop co-classification matrices of all technical fields. Therefore, the present study can facilitate plotting of the technology network map through the matrix.
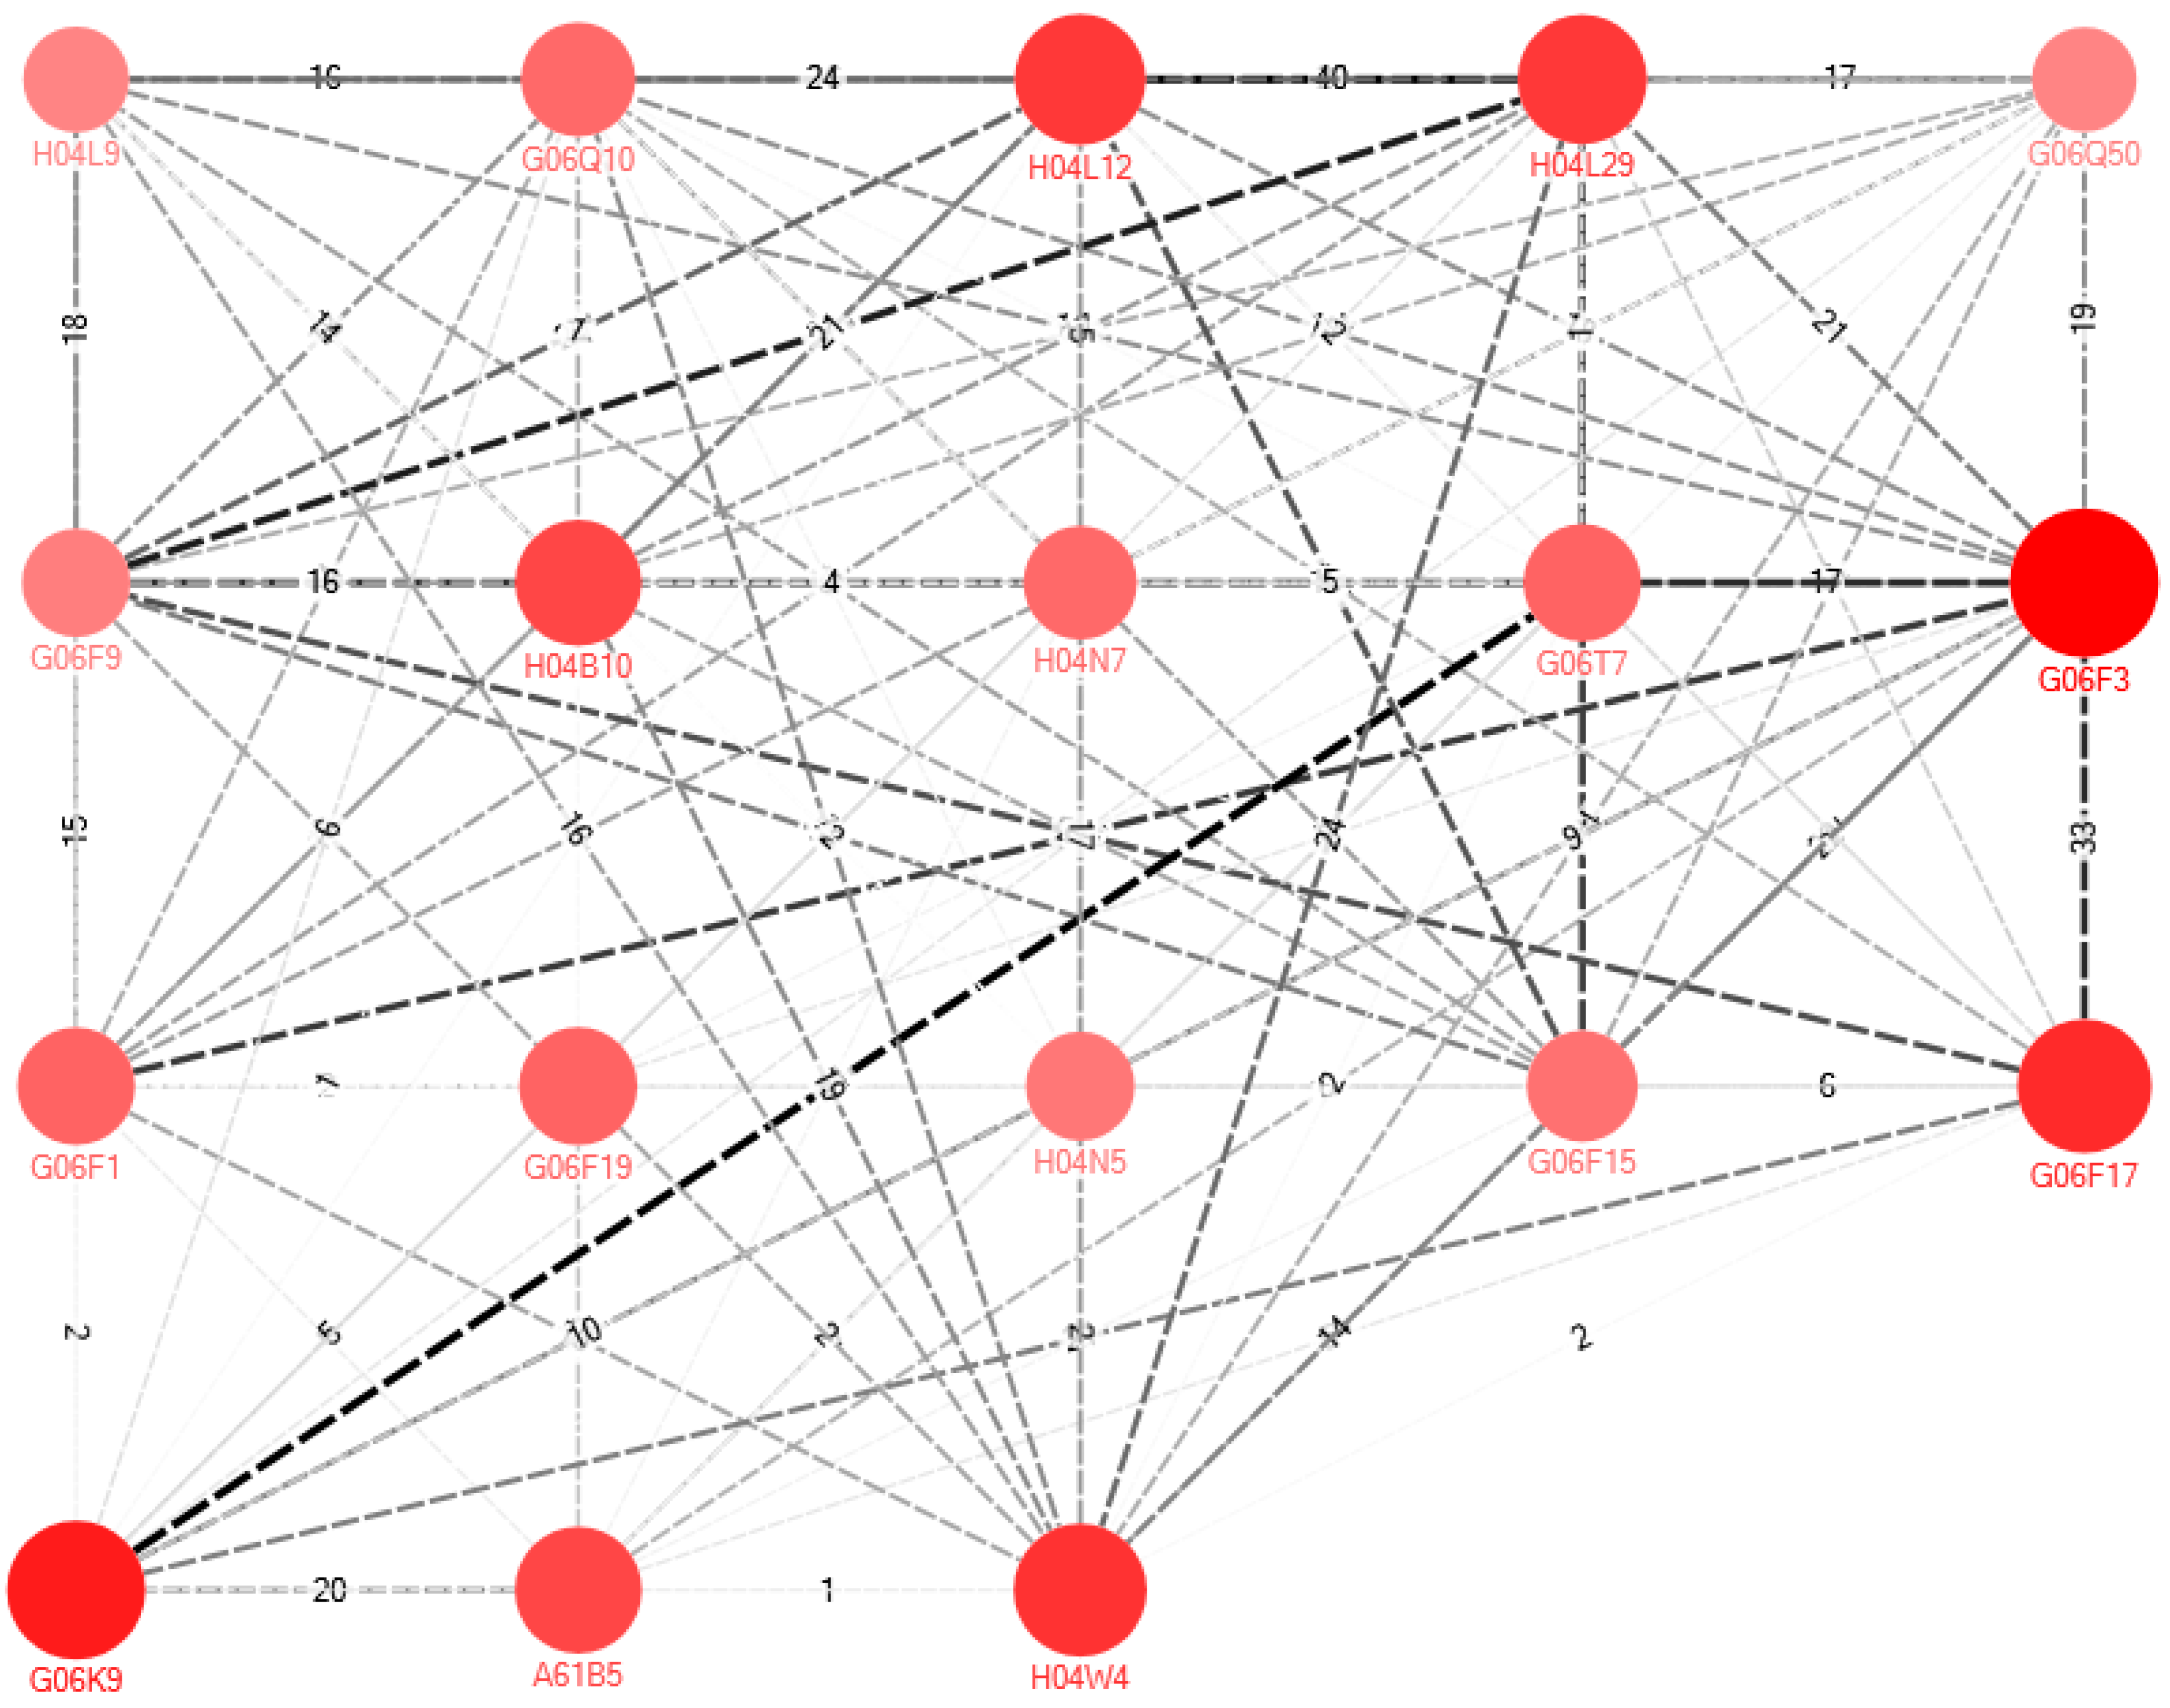
Table 4 presents all parameters used in the technology network analysis. Figure 2 presents the network model of key technologies, and the key IPCs are listed in Table 5. The centrality performance index of the top 10 IPC codes in the frequency analysis (Table 1) has been added to Appendix B.
The overall network, as shown in Table 4, was composed of 407 nodes and 206,194 links; a total of 407 IPCs were related to machine learning technologies in optical communications. The network density and compactness were 0.159 and 0.377, respectively, indicating that the network was sparsely distributed and that the interaction frequency between nodes was low. The average path length was 2.688, meaning that connecting a node to other nodes required nearly 3 steps, on average. The technology nodes depicted in Figure 1 are crucial technology nodes linking more than 60 different technology nodes; that is, they represent the more critical technology fields in patents for machine-learning technologies in optical communications. Regarding degree centrality, eigenvector centrality, and structural hole, the IPCs G06F3, G06F17, H04W4, and H04L12 had more than two indices in the top five technology fields (Table 5). In the overall IPC codes, the mean eigenvector centrality was 0.028, and a larger value indicated greater relative importance of a node. The structural hole effect was measured using the network constraint index. The mean of said index was 0.519, and a higher value indicated a lower structural hole effect. This suggested that key machine-learning technologies in optical communications are mainly concentrated in data input and output devices (e.g., interface arrangements; G06F3), data-processing methods (G06F17), wireless communication networks (H04W4), and the transmission of digital information (H04L12). The IPCs A61B5 and G06F19 only appeared in the structural hole column, which signified that these two technology fields belonged to different technology clusters and played a cross-disciplinary role. Thus, key technologies in the cross-disciplinary uses of machine learning in optical communications were for measurements for diagnostic purposes (A61B5) and information and communication technology (ICT) specially adapted for specific application fields (G06F19).
Additional insights available through network centrality metrics were as follows. Despite the slightly lower frequency of certain technology fields appearing in patents, in terms of the overall technology network, the connected technology nodes were more diverse and had an interdisciplinary nature in terms of applications. For example, although H04W4 and G06F19 are not listed in the top 10 technology fields with the highest frequency in Table 1, H04W4 was observed to connect to more different nodes in terms of degree centrality. Eigenvector centrality considered whether H04W4 was connected to a node with relatively high centrality, whereas structural holes revealed that G06F19 and H04W4 occupied the main channel of network communication; that is, the degree to which the connection between technology clusters depended on G06F1 and H04W4 was revealed.
4.3. Country-Technology Two-Mode Network Analysis
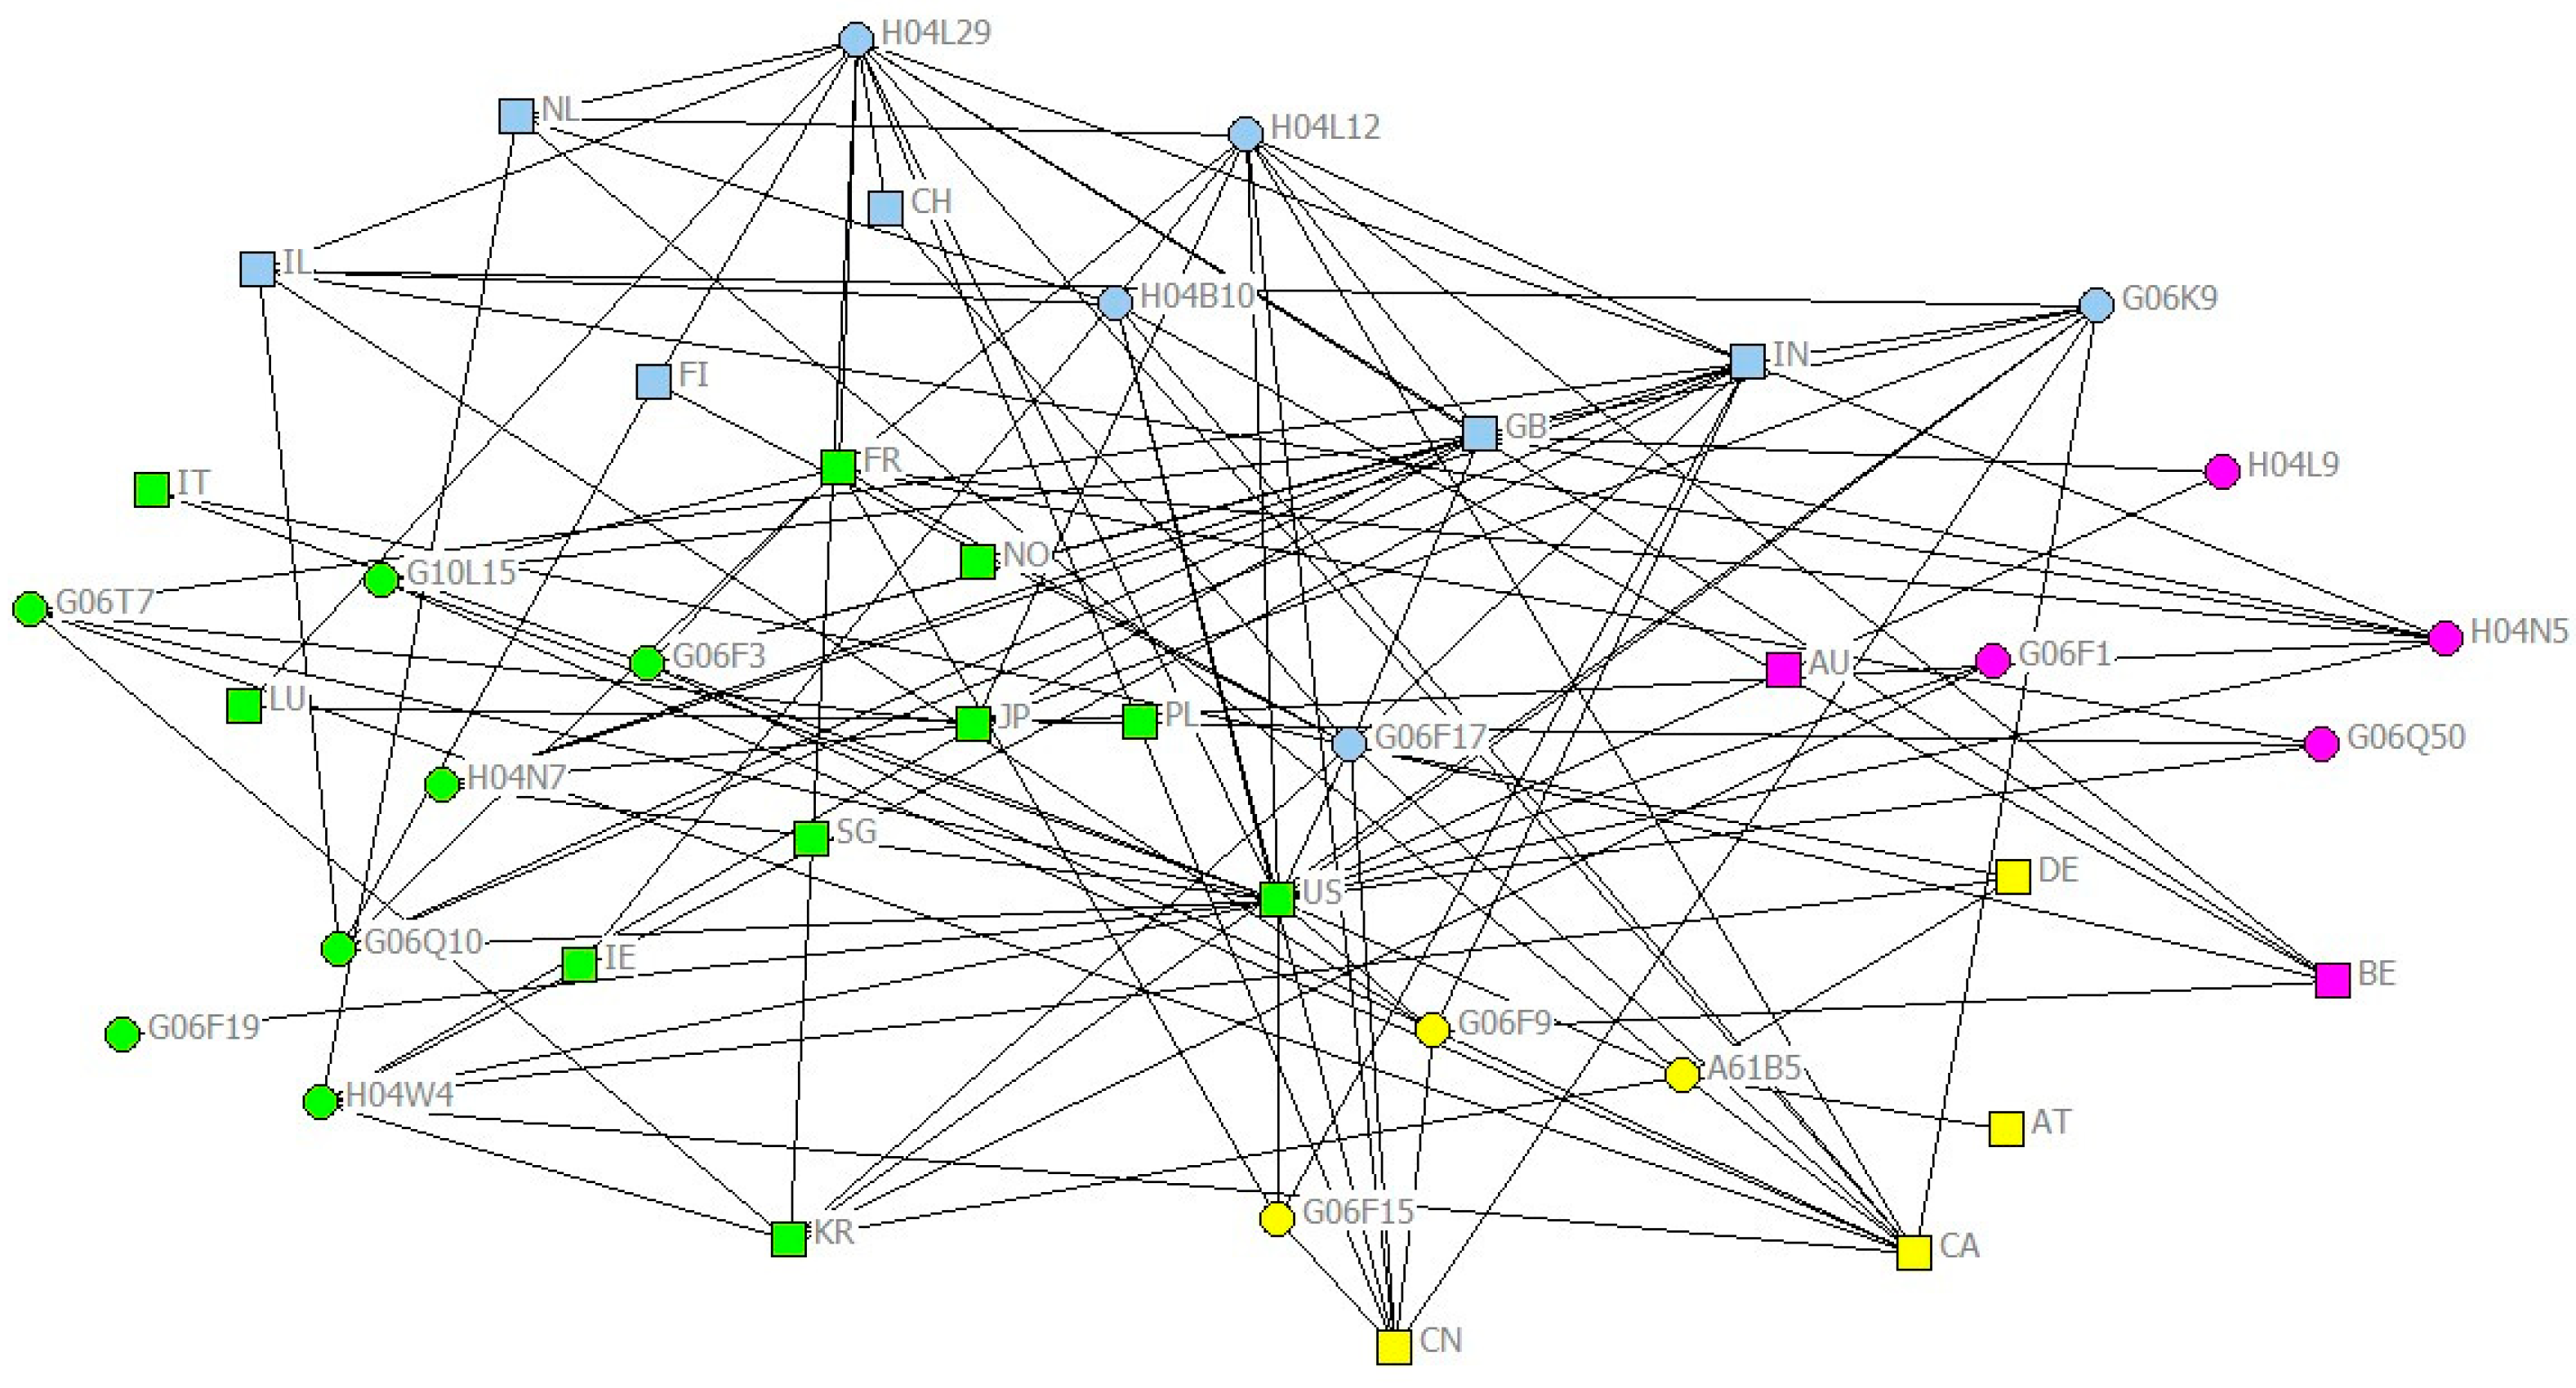
To include more interesting findings, country-technology two-mode network analysis and factionalization analysis were used to understand the strategic cluster of patent technology deployment of each country. Factions analysis was employed to conduct a complete survey of small-world structures. Factions analysis is an explorative tool used to identify subclusters in a social network [36]. In all, four factions were present. The final proposition correct was 0.703, suggesting a favorable fit value. The faction analysis results are presented in Table 6 and Figure 3.
Table 6 and Figure 3 can be used to identify the technology clusters of invention in the most prominent countries and the proximity of technical fields. For example, China and Germany belong to the same technology cluster, with their patents presenting high technical closeness in the A61B5 field. Australia and Belgium have high connectivity in the G06Q50 and H04L9 fields. Switzerland, the United Kingdom, and Israel have high connectivity in the G06F17, G06K9, and H04B10 fields. The United States and Japan have high technical closeness in the G06F3 and H04W4 fields.
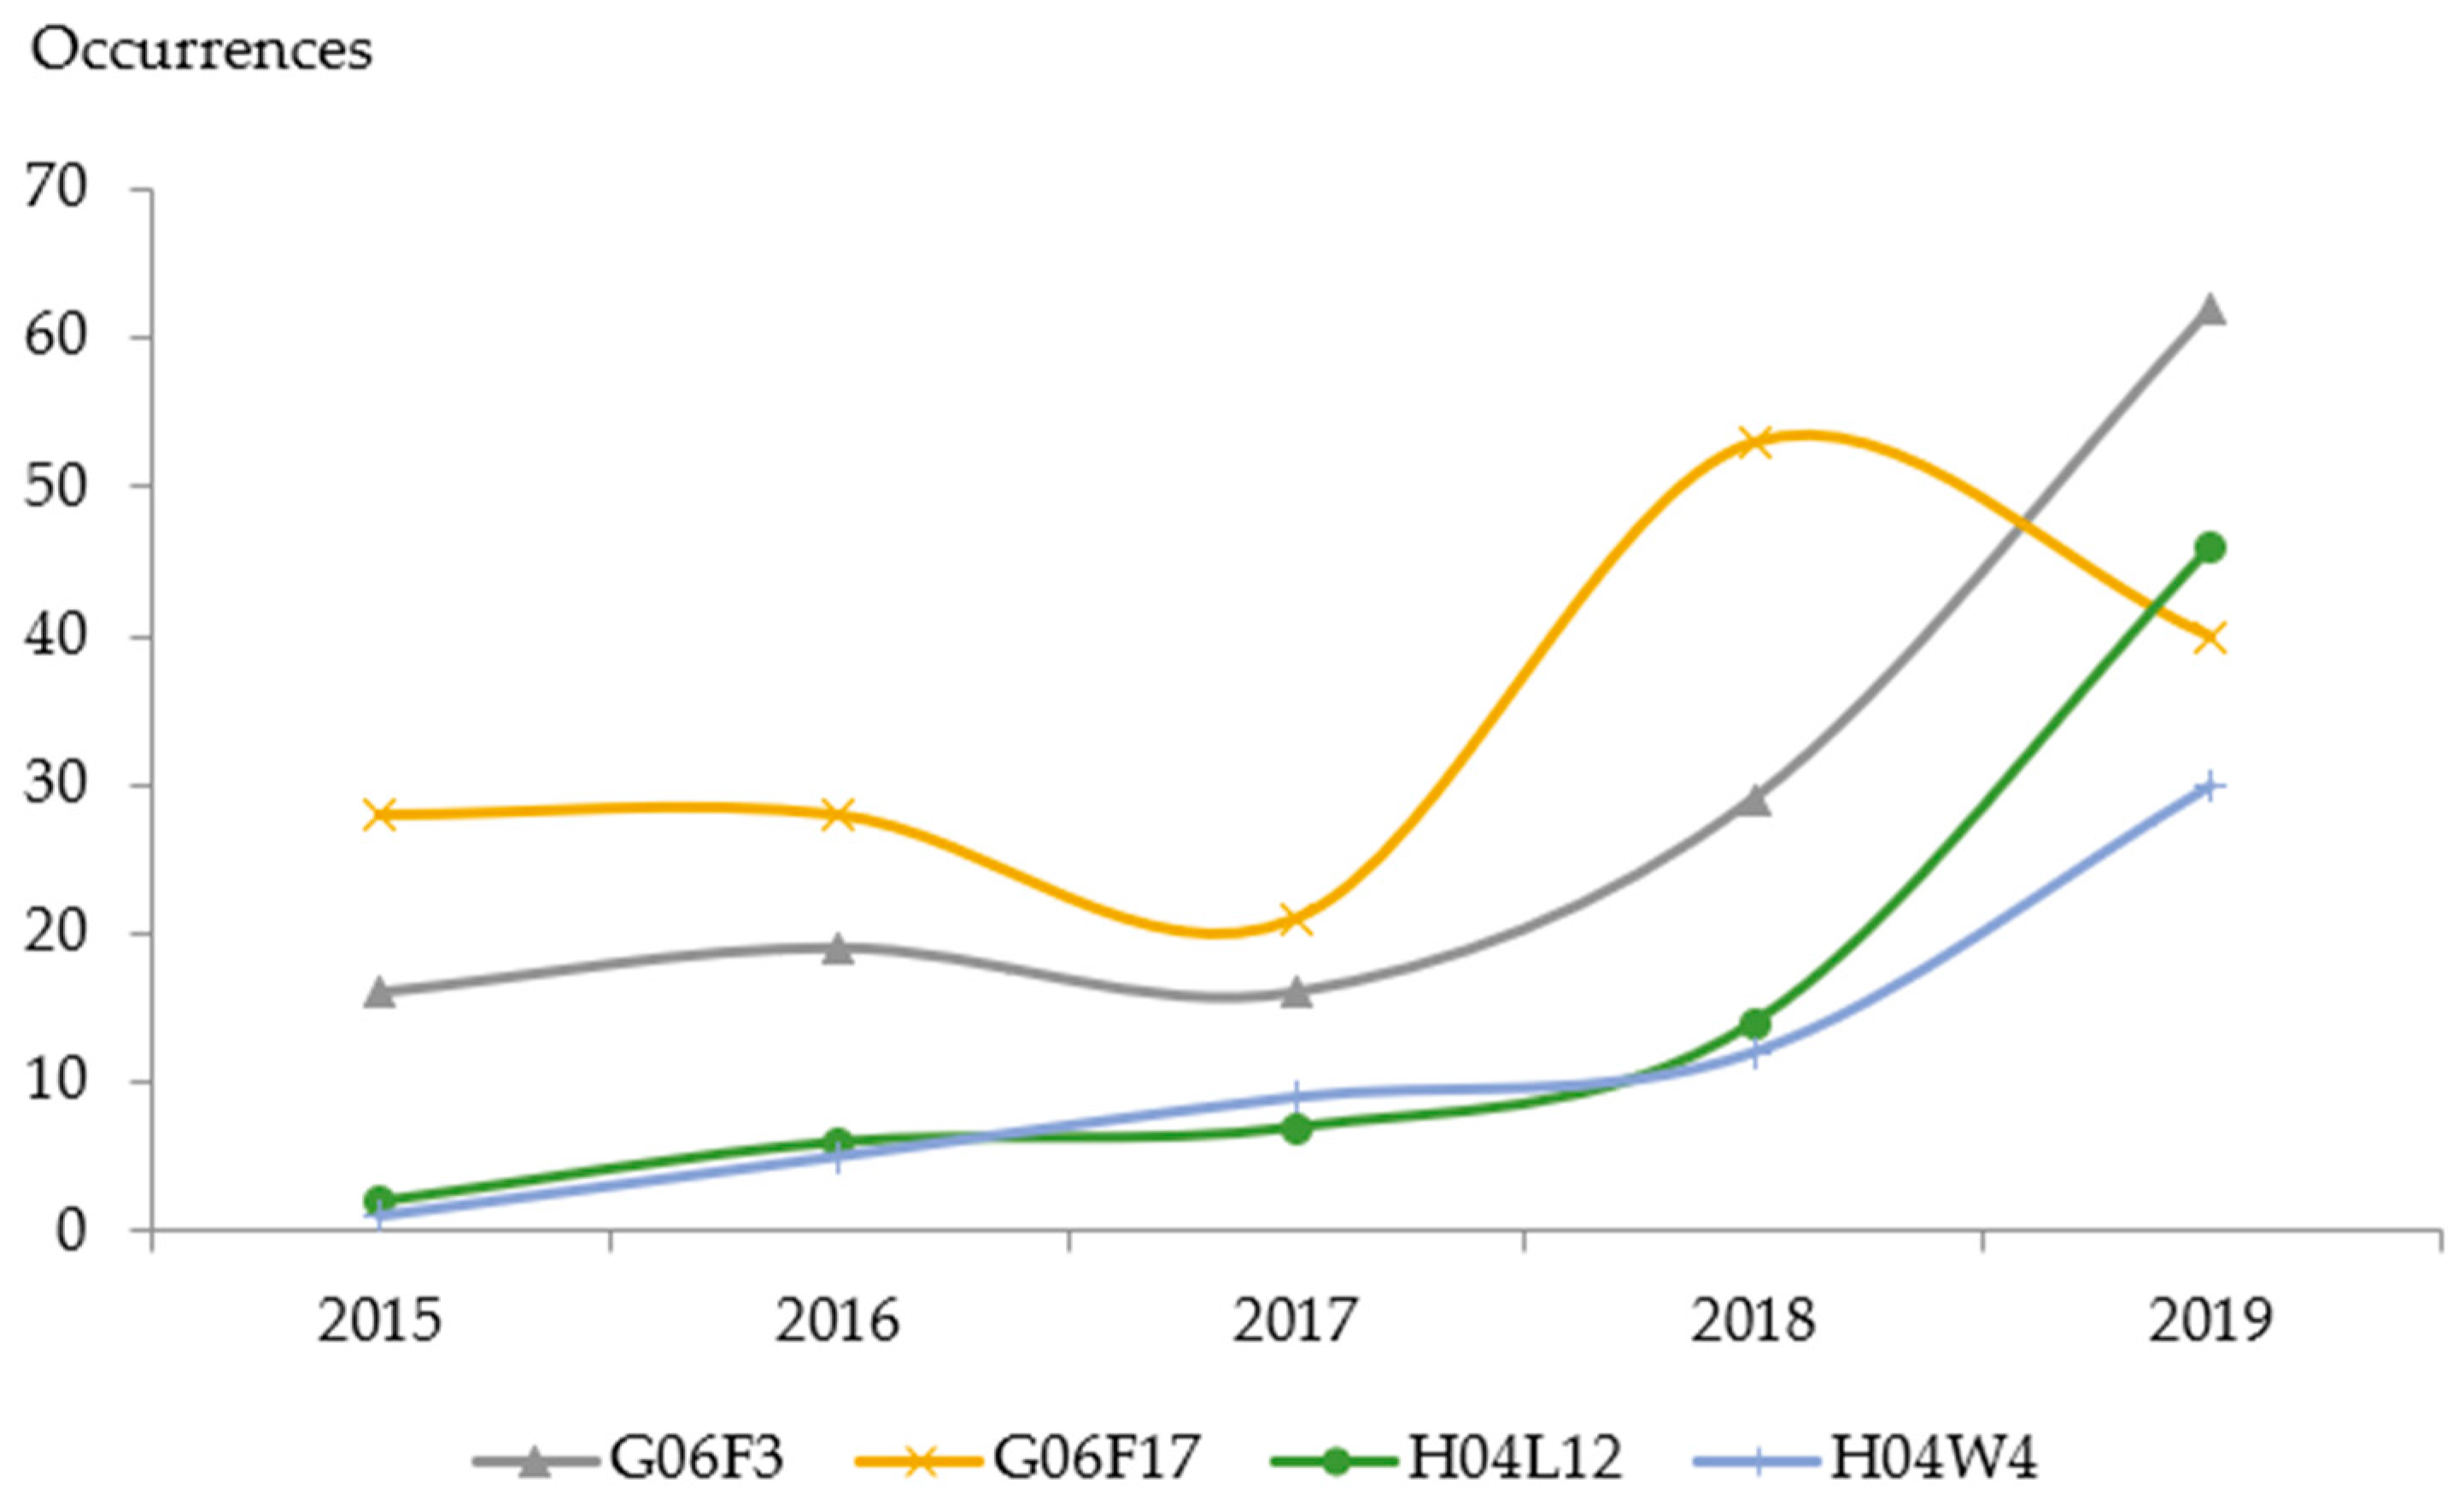
4.4. Key Machine-Learning Technologies in Optical Communications over the Years
The changes in G06F3, G06F17, H04W4, H04L12 patents over the years were analyzed to understand the development trajectory of machine learning in optical communications (Figure 4).
The results indicated that the application and development of G06F3 technologies—optical signals or data input and output devices—have gradually received more attention in recent years (Figure 2).
5. Conclusions
5.1. Results Discussion
In this study, network analysis was performed to explore key machine learning technologies in optical communications. The findings revealed that among data input and output devices, data-processing methods, wireless communication networks, and digital information transmission were key technologies that were not clustered in specific fields. The findings also indicated that machine-learning technologies in optical communications were applied to measurement for diagnostic purposes. Therefore, medical diagnostic applications is a direction that merits future study. In addition, comparing the differences between the network analysis and the most frequent Top 10 IPCs to the fourth digit revealed that wireless communication networks (H04W4) were among the top five in the network analysis; however, in the frequency analysis, their frequency of occurrence was not in the top 10. This indicated that although few patents for machine-learning technologies in optical communications were directly related to wireless communication networks, the connected technology fields were quite diverse. This highlights the importance of wireless communication networks and the advent of the era of wireless optical communications.
Furthermore, analysis of major patentees revealed that major developers are leaders in ICT and intelligent software and services—Apple Inc., SAS Institute Inc., Intel Corporation, and International Business Machines Corporation. Apple Inc. focuses on AI applications in communications, whereas SAS Institute Inc. conducts data exploration to advance algorithmic applications to deploy AI to more industries. Intel Corporation and International Business Machines Corporation are major vendors in chips and information. Although most of the top 10 patentees are leading ICT developers and the number of academic patents is lower than that of patents under general enterprises [37], academic and scientific research has a substantial influence on technology patents. The methods and specific techniques proposed in academic and scientific studies affect industrial development. For example, in the sample analyzed in this study, Carnegie Mellon University’s patent (US10436615B2), authorized in 2019, uses machine learning. The computer system then trains a classifier to serve as a virtual sensor for an event that is correlated to the data from one or more sensor streams within the featured sensor data. The technology is related to the recording of measured values and can be applied in many industrial fields. Another example is a University of Central Oklahoma patent authorized in 2018 (US9922291B2) that proposes a method and apparatus for providing personalized configuration of physical supports for the human body, comprising accepting input including an individual’s demographic information. The patents provide new methods and modes of thinking for computer systems based on specific computational models.
Factions analysis was adopted to determine the technical identification of inventions in prominent countries and to provide references for governments with regard to patent deployment. The results of the factions analysis revealed competition between countries in inventions, as well as the focal fields of each country. China and Germany belong to the same technical cluster, whereas the United States and Japan are in different clusters from those of the United Kingdom and Israel. Moreover, the proximity of technical fields can be observed through the results. For example, methods and devices for recognizing patterns (G06K9) and transmission systems employing electromagnetic waves other than radio-waves (H04B10) belong to the same faction; the co-occurrence of these technological fields in the same patent is highly likely. In technical applications of machine learning in optical communications, high co-occurrence and closeness are present.
The development trend of key machine-learning technologies in optical communications was concentrated in G06F3 or data input and output devices. Recent studies have argued that using machine learning and neural networks can precisely reconstruct digital images, convert blurry and unrecognizable speckle patterns into recognizable digital images, and process distortions caused by environmental disturbances to optic fibers [38]. This technological development is anticipated to advance endoscopic imaging and medical diagnoses [38,39]. In addition, in terms of causality of technology time series, patents for machine-learning technologies in optical communications were mainly focused on the technology field of data processing methods (G06F17), which emphasizes complex mathematical computation. Recently, optical signals as well as data input and output devices (G06F3) began to increase substantially. This indicates that with the development of communication technology and big data, in addition to the improvement of early mathematical computation through the development and application of technology, input devices that transform signals into digital data formats that can be processed by computers have gradually attracted attention, leading to further technological developments and relevant applications.
5.2. Implications Discussion
For theoretical contributions, studies on machine learning in optical communications have mostly explored algorithmic techniques [4,7] or researched specific applications [2,8]. However, these studies have failed to identify focal technical fields, development trends, and network distribution channels among technical fields from a macro perspective, particularly regarding indispensable technologies for the future development of machine learning for optical communications. This observation of technological distribution is particularly critical. This study filled this research gap and adopted a new perspective that centers on technical fields.
In technology development, as was described earlier, the focus of key machine-learning technologies in the optical communications field has been mainly on G06F3. In other words, machine learning is applied to data input and output devices in optical communications. Whether optical communications can achieve the prediction of transmission quality through machine learning is crucial in the development of optical communications technology. Traditional optical communications performance relies on the calculation of network layer parameters, which are based solely on the available flow and flow load of the network. However, whether optical communications are blocked is determined by not only the network layer but also the physical layer. The optical communications network must effectively predict the quality of transmission before new channel deployment of optical communications. The quality of transmission involves physical layer parameters such as signal-to-noise ratio and symbol error rate. How machine learning can be used to effectively predict the quality of transmission is the key to future technology development. The use of analysis models to estimate the damage of physical layers for the provision of accurate results is a fundamental challenge in the implementation of optical communications.
To assist in policy suggestions, this paper provides industries and governments with valuable information in a technical map of machine learning in optical communications. The analysis and understanding of technological development foci in technology networks inform industries on allocating research and development resources and informs governments on promoting emerging technologies. Given the development of IoT applications for driving the transmission volume of digital data, the optical communication field will require the integration of machine learning to construct adaptive smart optical communication system networks. This study found that major key technologies were concentrated in electric digital data processing, wireless communication networks, and the transmission of digital information. Therefore, governments should implement long-term financial support and training programs for talent in these technologies to increase the overall research and development capacity of the optical communication industry.
5.3. Limitations and Future Research Directions
First, this study used the patent keywords classifications that were organized by Derwent as the basis for patent screening. Although the Derwent database has several hundred experts who examine publicly available patent information to manually sort technical keywords, the development of machine-learning technologies in optical communications spans several fields and technical applications; therefore, some patents may not have been included in this analysis despite falling within its scope. Furthermore, this study analyzed large-scale holistic technology networks. Therefore, the empirical basis was limited to the number of approved patents, and the study did not make value judgements for individual patents. For example, this study lacked a discussion on whether the income of the patentees was correlated to the patents they owned, as well as the cost structure that patents imposed on the patentees. In the future, individual case studies into specific high-value patents can include expert interviews or other research methods. Finally, due to personnel and financial reasons, this study only used USPTO—the largest global commercial trading market—as its source of information on patents. Although this database is widely used to measure global innovations [13,14], future researchers with sufficient time and money should include other data sources on patents for observation and verification, such as by including approved standard essential patents in communications or their citation documents to expand their research breadth.
Funding
This research was funded by the Ministry of Science and Technology of the Taiwan, grant number MOST 109-2410-H-492-001.
Acknowledgments
The authors would like to thank the Ministry of Science and Technology of the Taiwan for financially supporting this research under Contract No. MOST 109-2410-H-492-001.
Conflicts of Interest
The authors declare no conflict of interest.
Appendix A

Table A1.
Definition of IPC categories.
| IPC Categories | Meaning |
|---|---|
| A61B5 | Measuring for diagnostic purposes |
| G06F1 | Details not covered by groups G06F 3/00-G06F 13/00 and G06F 21/00 |
| G06F3 | Input arrangements for transferring data to be processed into a form capable of being handled by the computer; Output arrangements for transferring data from processing unit to output unit, e.g., interface arrangements |
| G06F9 | Arrangements for program control, e.g., control units |
| G06F15 | Digital computers in general |
| G06F17 | Digital computing or data processing equipment or methods, specially adapted for specific functions |
| G06F19 | (transferred to G16C 10/00-G16C 60/00, G16Z 99/00); G16C 10/00: Computational theoretical chemistry, i.e., ICT specially adapted for theoretical aspects of quantum chemistry, molecular mechanics, molecular dynamics or the like; G16C 60/00: Computational materials science, i.e., ICT specially adapted for investigating the physical or chemical properties of materials or phenomena associated with their design, synthesis, processing, characterisation or utilization; G16Z 99/00: Subject matter not provided for in other main groups of this subclass |
| G06K9 | Methods or arrangements for reading or recognising printed or written characters or for recognising patterns, e.g., fingerprints |
| G06N3 | Computer systems based on biological models |
| G06N5 | Computer systems using knowledge-based models |
| G06N99 | Subject matter not provided for in other groups of this subclass |
| G06Q10 | Administration; Management |
| G06Q50 | Systems or methods specially adapted for specific business sectors, e.g., utilities or tourism |
| G06T7 | Image analysis |
| G10L15 | Speech recognition |
| H04B10 | Transmission systems employing electromagnetic waves other than radio-waves, e.g., infrared, visible or ultraviolet light, or employing corpuscular radiation, e.g., quantum communication |
| H04L9 | Arrangements for secret or secure communication |
| H04L12 | Data switching networks |
| H04L29 | Arrangements, apparatus, circuits or systems, not covered by a single one of groups |
| H04N5 | Details of television systems |
| H04N7 | Television systems |
| H04W4 | Services specially adapted for wireless communication networks; Facilities thereof |
Appendix B
Table A2.
Centrality indicators of the Top 10 IPC codes with the highest frequency.
| IPC | Degree Centrality | Eigenvector Centrality | Structural Hole |
|---|---|---|---|
| G06F17 | 102 | 0.151 | 0.085 |
| G06F3 | 126 | 0.206 | 0.063 |
| G06K9 | 109 | 0.139 | 0.090 |
| H04L29 | 95 | 0.182 | 0.087 |
| A61B5 | 91 | 0.112 | 0.076 |
| G06F9 | 66 | 0.159 | 0.101 |
| H04L12 | 97 | 0.176 | 0.088 |
| G10L15 | 33 | 0.062 | 0.228 |
| H04B10 | 90 | 0.169 | 0.085 |
| G06T7 | 78 | 0.107 | 0.140 |
References
- Liu, R.; Liu, Y.; Yan, Y.; Wang, J.Y. Iterative deep neighborhood: A deep learning model which involves both input data points and their neighbors. Comput. Intell. Neurosci. 2020, 1–11. [Google Scholar] [CrossRef] [Green Version]
- Ragheb, A.; Saif, W.; Trichili, A.; Ashry, I.; Esmail, M.A.; Altamimi, M.; Almaiman, A.; Altubaishi, E.; Ooi, B.S.; Alouini, M.S.; et al. Identifying structured light modes in a desert environment using machine learning algorithms. Opt. Express 2020, 28, 9753–9763. [Google Scholar] [CrossRef] [PubMed] [Green Version]
- Turpin, A.; Vishniakou, I.; Seelig, J.D. Light scattering control in transmission and reflection with neural networks. Opt. Express 2018, 26, 30911–30929. [Google Scholar] [CrossRef]
- Xu, Y.; He, D.; Wang, Q.; Guo, H.; Li, Q.; Xie, Z.; Huang, Y. An improved method of measuring wave front aberration based on image with machine learning in free space optical communication. Sensors 2019, 19, 3665. [Google Scholar] [CrossRef] [Green Version]
- Argyris, A.; Bueno, J.; Fischer, I. Photonic machine learning implementation for signal recovery in optical communications. Sci. Rep. 2018, 8, 8487. [Google Scholar] [CrossRef] [PubMed]
- Cui, X.; Yin, X.; Chang, H.; Liao, H.; Chen, X.; Xin, X.; Wang, Y. Experimental study of machine-learning-based orbital angular momentum shift keying decoders in optical underwater channels. Opt. Commun. 2019, 452, 116–123. [Google Scholar] [CrossRef]
- Chugh, S.; Gulistan, A.; Ghosh, S.; Rahman, B.M.A. Machine learning approach for computing optical properties of a photonic crystal fiber. Opt. Express 2019, 27, 36414–36425. [Google Scholar] [CrossRef] [PubMed] [Green Version]
- Zong, Y.; Feng, C.; Guan, Y.; Liu, Y.; Guo, L. Virtual network embedding for multi-domain heterogeneous converged optical networks: Issues and challenges. Sensors 2020, 20, 2655. [Google Scholar] [CrossRef] [PubMed]
- Donges, A.; Selgert, F. Technology transfer via foreign patents in Germany, 1843–1877. Econ. Hist. Rev. 2019, 72, 182–208. [Google Scholar] [CrossRef] [Green Version]
- Seo, I.; Sonn, J.W. The persistence of inter-regional hierarchy in technology transfer networks: An analysis of Chinese patent licensing data. Growth Chang. 2019, 50, 145–163. [Google Scholar] [CrossRef] [Green Version]
- Aaldering, L.J.; Song, C.H. Tracing the technological development trajectory in post-lithium-ion battery technologies: A patent-based approach. J. Clean. Prod. 2019, 241, 118343. [Google Scholar] [CrossRef]
- Gwak, J.H.; Sohn, S.Y. A novel approach to explore patent development paths for subfield technologies. J. Assoc. Inf. Sci. Technol. 2018, 69, 410–419. [Google Scholar] [CrossRef]
- Kogler, D.F.; Heimeriks, G.; Leydesdorff, L. Patent portfolio analysis of cities: Statistics and maps of technological inventiveness. Eur. Plan. Stud. 2018, 26, 2256–2278. [Google Scholar] [CrossRef]
- Yan, B.; Luo, J. Filtering patent maps for visualization of diversification paths of inventors and organizations. J. Assoc. Inf. Sci. Technol. 2017, 68, 1551–1563. [Google Scholar] [CrossRef] [Green Version]
- Helmers, L.; Horn, F.; Biegler, F.; Oppermann, T.; Müller, K.-R. Automating the search for a patent’s prior art with a full text similarity search. PLoS ONE 2019, 14, e0212103. [Google Scholar] [CrossRef] [Green Version]
- Woo, H.-G.; Yeom, J.; Lee, C. Screening Early stage ideas in technology development processes: A text mining and K-nearest neighbours approach using patent information. Technol. Anal. Strateg. Manag. 2019, 31, 532–545. [Google Scholar] [CrossRef]
- Cetintas, S.; Si, L. Effective query generation and postprocessing strategies for prior art patent search. J. Am. Soc. Inf. Sci. Technol. 2012, 63, 512–527. [Google Scholar] [CrossRef]
- Hansen, P.; Järvelin, A.; Järvelin, A. Exploring manual and automatic query formulation in patent IRInitial query construction and query generation process. J. Doc. 2013, 69, 873–898. [Google Scholar] [CrossRef]
- Mahdabi, P.; Crestani, F. The effect of citation analysis on query expansion for patent retrieval. Inf. Retr. J. 2014, 17, 412–429. [Google Scholar] [CrossRef] [Green Version]
- MarketsandMarkets. Optical Communication and Networking Equipment Market by Component (Fiber, Transceiver, and Switch), Technology, Application (Telecom, Data Center, and Enterprise), Data Rate, Vertical, and Region–Global Forecast to 2025; MarketsandMarkets: Northbrook, IL, USA, 2020. [Google Scholar]
- Mata, J.; de Miguel, I.; Durán, R.J.; Merayo, N.; Singh, S.K.; Jukan, A.; Chamania, M. Artificial intelligence (AI) methods in optical networks: A comprehensive survey. Opt. Switch. Netw. 2018, 28, 43–57. [Google Scholar] [CrossRef]
- Gu, R.; Yang, Z.; Ji, Y. Machine learning for intelligent optical networks: A comprehensive survey. J. Netw. Comput. Appl. 2020, 157, 102576. [Google Scholar] [CrossRef] [Green Version]
- Khan, F.N.; Fan, Q.; Lau, A.P.T.; Lu, C. Applications of machine-learning in optical communications and networks. Next-Generation Optical Communication: Components, Sub-Systems, and Systems IX. In Proceedings of the 2020 Optical Fiber Communications Conference and Exhibition (OFC), San Diego, CA, USA, 8–12 March 2020; p. 113090L. [Google Scholar]
- Cochoy, F.; Soutjis, B. Back to the future of digital price display: Analyzing patents and other archives to understand contemporary market innovations. Soc. Stud. Sci. 2020, 50, 3–29. [Google Scholar] [CrossRef] [PubMed]
- Kim, K.; Jung, S.; Hwang, J. Technology convergence capability and firm innovation in the manufacturing sector: An approach based on patent network analysis. RD Manag. 2019, 49, 595–606. [Google Scholar] [CrossRef]
- de Paulo, A.F.; Ribeiro, E.M.S.; Porto, G.S. Mapping countries cooperation networks in photovoltaic technology development based on patent analysis. Scientometrics 2018, 117, 667–686. [Google Scholar] [CrossRef]
- Zhu, L.; Zhu, D.; Wang, X.; Cunningham, S.W.; Wang, Z. An integrated solution for detecting rising technology stars in co-inventor networks. Scientometrics 2019, 121, 137–172. [Google Scholar] [CrossRef]
- Chen, Z.; Guan, J. The core-peripheral structure of international knowledge flows: Evidence from patent citation data. RD Manag. 2016, 46, 62–79. [Google Scholar] [CrossRef]
- Sonmez, Z. Inventor mobility and the geography of knowledge flows: Evidence from the US biopharmaceutical industry. Sci. Public Policy 2017, 44, 670–682. [Google Scholar] [CrossRef]
- Kwon, O.; An, Y.; Kim, M.; Lee, C. Anticipating technology-driven industry convergence: Evidence from large-scale patent analysis. Technol. Anal. Strateg. Manag. 2020, 32, 363–378. [Google Scholar] [CrossRef]
- Mun, C.; Yoon, S.; Park, H. Structural decomposition of technological domain using patent co-classification and classification hierarchy. Scientometrics 2019, 121, 633–652. [Google Scholar] [CrossRef]
- Leydesdorff, L.; Nooy, W. Can ‘hot spots’ in the sciences be mapped using the dynamics of aggregated journal-journal citation Relations? J. Assoc. Inf. Sci. Technol. 2017, 68, 197–213. [Google Scholar] [CrossRef] [Green Version]
- Borgatti, S.P.; Everett, M.G.A. Graph-theoretic perspective on centrality. Soc. Netw. 2006, 28, 466–484. [Google Scholar] [CrossRef]
- Burt, R.S. Structural Holes; Harvard University Press: Cambridge, MA, USA, 1992. [Google Scholar]
- Tseng, C.Y.; Ting, P.H. Patent analysis for technology development of artificial intelligence: A country-level comparative study. Innov. Manag. Policy Pract. 2013, 15, 463–475. [Google Scholar] [CrossRef]
- Cunningham, D.; Everton, S.; Murphy, P. Understanding Dark Networks: A Strategic Framework for the Use of Social Network Analysis; Rowman & Littlefield: Lanham, MD, USA.
- Wong, P.K.; Singh, A. University patenting activities and their link to the quantity and quality of scientific publications. Scientometrics 2010, 83, 271–294. [Google Scholar] [CrossRef]
- Borhani, N.; Kakkava, E.; Moser, C.; Psaltis, D. Learning to see through multimode fibers. Optica 2018, 5, 960–966. [Google Scholar] [CrossRef]
- Flusberg, B.A.; Cocker, E.D.; Piyawattanametha, W.; Jung, J.C.; Cheung, E.L.M.; Schnitzer, M.J. Fiber-optic fluorescence imaging. Nat. Methods 2005, 2, 941–950. [Google Scholar] [CrossRef]
Figure 1.
Technical field co-classification analysis schematic. Note: P1 and P2 represent two patents; IPC1, IPC2, IPC3…IPC6 represent six technical fields.
Figure 1.
Technical field co-classification analysis schematic. Note: P1 and P2 represent two patents; IPC1, IPC2, IPC3…IPC6 represent six technical fields.

Figure 2.
IPC network for machine learning in optical communications. Note: node size represents the number of connections with a node, and the arc thickness represents the strength of a connection. This diagram only displays nodes with 60 or more connections.
Figure 2.
IPC network for machine learning in optical communications. Note: node size represents the number of connections with a node, and the arc thickness represents the strength of a connection. This diagram only displays nodes with 60 or more connections.

Figure 3.
Two-mode network diagram based on faction analysis. Note: To simplify the figure, only technology nodes that appear in Table 1 and Table 5, and Figure 2 are used.

Figure 4.
Key machine-learning technologies in optical communications over the years.

Table 1.
Top 10 International Patent Classifications (IPCs) to the fourth digit.
| Ranking | IPC Classification | Frequency | Percentage |
|---|---|---|---|
| 1 | G06F17 | 170 | 5.17% |
| 2 | G06F3 | 142 | 4.31% |
| 3 | G06K9 | 108 | 3.28% |
| 4 | H04L29 | 102 | 3.10% |
| 5 | A61B5 | 89 | 2.70% |
| 6 | G06F9 | 82 | 2.49% |
| 7 | H04L12 | 75 | 2.28% |
| 8 | G10L15 | 71 | 2.16% |
| 9 | H04B10 | 69 | 2.10% |
| 10 | G06T7 | 58 | 1.76% |
Table 2.
Top 10 patentees.
| Ranking | Patentee | Patents | Percentage | No. of Inventors |
|---|---|---|---|---|
| 1 | Apple Inc. | 67 | 8.15% | 142 |
| 2 | SAS Institute Inc. | 51 | 6.20% | 92 |
| 3 | Intel Corporation | 33 | 4.01% | 65 |
| 4 | International Business Machines Corporation | 24 | 2.92% | 67 |
| 5 | Volcano Corporation | 29 | 3.53% | 29 |
| 6 | Elwha LLC | 28 | 3.41% | 33 |
| 7 | Microsoft Technology Licensing, LLC | 17 | 2.07% | 51 |
| 8 | Google LLC | 16 | 1.95% | 42 |
| 9 | Fitbit, Inc. | 14 | 1.70% | 10 |
| 10 | HPS Investment partners, LLC, as Collateral Agent | 13 | 1.58% | 18 |
Table 3.
Computational models classification results.
| Methods | Frequency | Percentage |
|---|---|---|
| Computer systems based on biological models | 36 | 27.48% |
| Computer systems using knowledge-based models | 28 | 21.37% |
| Subject matter not provided for in other groups of this subclass | 28 | 21.37% |
| Others | 39 | 29.77% |
Table 4.
Parameters related to technology network analysis.
| Items | Technology Network Analysis |
|---|---|
| Nodes | 407 |
| Links | 206,194 |
| Average path length | 2.688 |
| Network density | 0.159 |
| The average degree | 16.015 |
| Compactness | 0.377 |
Table 5.
Top 5 IPC codes for machine learning in optical communications.
| IPC | Degree Centrality | IPC | Eigenvector Centrality | IPC | Structural Hole |
|---|---|---|---|---|---|
| G06F3 | 126 | G06F3 | 0.206 | G06F3 | 0.063 |
| G06K9 | 109 | H04W4 | 0.183 | A61B5 | 0.076 |
| G06F17 | 102 | H04L29 | 0.182 | G06F19 | 0.077 |
| H04W4 | 100 | H04L12 | 0.176 | H04W4 | 0.082 |
| H04L12 | 97 | H04B10 | 0.169 | G06F17 | 0.085 |
Table 6.
Faction analysis results.
| Faction | Actors |
|---|---|
| Faction 1 | G06F1, G06Q50, H04L9, H04N5, AU, BE |
| Faction 2 | G06F17, G06K9, H04B10, H04L12, H04L29, CH, FI, GB, IL, IN, NL |
| Faction 3 | A61B5, G06F9, G06F15, AT, CA, CN, DE |
| Faction 4 | G06F3, G06F19, G06Q10, G06T7, G10L15, H04N7, H04W4, FR, IE, IT, JP, KR, LU, NO, PL, SG, US |
Publisher’s Note: MDPI stays neutral with regard to jurisdictional claims in published maps and institutional affiliations. |
© 2020 by the author. Licensee MDPI, Basel, Switzerland. This article is an open access article distributed under the terms and conditions of the Creative Commons Attribution (CC BY) license (http://creativecommons.org/licenses/by/4.0/).
Share and Cite
MDPI and ACS Style
Chang, S.-H. Patent Technology Network Analysis of Machine-Learning Technologies and Applications in Optical Communications. Photonics 2020, 7, 131. https://0-doi-org.brum.beds.ac.uk/10.3390/photonics7040131
AMA Style
Chang S-H. Patent Technology Network Analysis of Machine-Learning Technologies and Applications in Optical Communications. Photonics. 2020; 7(4):131. https://0-doi-org.brum.beds.ac.uk/10.3390/photonics7040131
Chicago/Turabian StyleChang, Shu-Hao. 2020. "Patent Technology Network Analysis of Machine-Learning Technologies and Applications in Optical Communications" Photonics 7, no. 4: 131. https://0-doi-org.brum.beds.ac.uk/10.3390/photonics7040131
Note that from the first issue of 2016, this journal uses article numbers instead of page numbers. See further details here.