Tumor Phantom with Incorporated SERS Tags: Detectability in a Turbid Medium


1
Institute of Biochemistry and Physiology of Plants and Microorganisms, Russian Academy of Sciences, 410049 Saratov, Russia
2
Saratov State University, 410012 Saratov, Russia
*
Author to whom correspondence should be addressed.
Photonics 2021, 8(5), 144; https://0-doi-org.brum.beds.ac.uk/10.3390/photonics8050144
Submission received: 6 April 2021
/
Revised: 23 April 2021
/
Accepted: 23 April 2021
/
Published: 26 April 2021
(This article belongs to the Special Issue Topical Problems of Biophotonics)
Abstract
:Surface-enhanced Raman scattering (SERS) tags have proven to be excellent labels for tissue bioimaging because of their low interference from biological matrices, high photostability, and possibility for using as theranostic agents. Although SERS tags are widely used for the imaging of tumors in vivo, in practice, the low contrast of the tag accumulation in the tissue and strong light scattering can significantly affect their detectability. In this work, we studied these effects by using a phantom of tumor tissue with incorporated SERS tags. The phantom is a 2 mm sphere of calcium alginate with incorporated SERS tags at a concentration of 0.625 × 10⁸–2 × 109 cm−3. To simulate the surrounding medium with differing turbidities, the phantom was placed in a 4 mm thick agarose gel containing intralipid at a concentration of 0–1%. SERS bioimaging was carried out using standard backscattering geometry with different light focusing conditions. We found that shielding the phantom with a turbid medium led not only to a decrease in detectability but also to a decrease in the apparent size of the imaging object. Our results can help develop more accurate algorithms for processing SERS data for bioimaging.
1. Introduction
Existing bioimaging technologies provide various opportunities for application in oncology through different imaging modalities, such as computed X-ray tomography [1], magnetic resonance imaging [2], ultrasound [3], positron emission tomography [4], and optical imaging [5]. Among other methods, SERS imaging provides an ultrastable and specific spectral signature, high signal-to-noise ratio, multiplexing capabilities, and excitation in NIR region within the biotissue transparency window [6]. The basic component of label-based Raman technique is the SERS tag [7]. This label consists of a plasmonic metal nanoparticle with adsorbed [8] or embedded [9] Raman active molecules, covered with protective layer or biospecific molecules (antibodies, peptides, DNA, etc.). Compared with traditional fluorescent labels, SERS tags provide several advantages, including greater photostability and the excitation of different labels with a single laser wavelength. On the other hand, there are several important disadvantages related with need for powerful laser excitation, nanoscale size of labels and low imaging speed. To overcome these difficulties, the rational design of plasmonic nanoparticles for higher SERS response is an active area of research. Many types of plasmonic nanoparticles have already been reported as labels for in vivo tumor bioimaging including colloidal gold [10,11], nanorods [12], nanostars [13], gap-enhanced Raman tags [14,15,16] and others [8,17]. Recently, a novel type of nanoparticle called petal-like gap-enhanced Raman tags [18] have been suggested as ultrabright labels that can overcome the current bottleneck in the field of SERS-based bioimaging.
Regardless of the type of labels used, a typical in vivo cancer bioimaging experiment includes the following main stages. First, the rational design of SERS tags for high signal and biocompatibility. The second stage is intravenous administration of a colloidal solution of tags. It is assumed that due to biospecific binding [19] (in the case of targeted delivery) or due to the enhanced permeability and retention effect [20], it will be possible to achieve a contrast of the accumulation of SERS tags in the tumor compared to healthy tissue. Finally, a preoperative [11] or intraoperative [16] scan of the tumor in a Raman microscope is performed. Using the characteristic spectral lines of the SERS tags, the image of the tumor is reconstructed and its borders are determined. For the successful application of this approach, it is necessary to accurately calculate the dose of injected particles. Insufficient SERS tags accumulated in the tumor will not provide a high signal-to-noise ratio to clearly define the boundaries. Too many injected particles will lead to non-specific accumulation and side effects. In this regard, the first question to which we give an answer in this work is how many particles must accumulate in a tumor to be able to detect them using a conventional Raman microscope?
The second important factor affecting the detectability of SERS tags is the shielding of the tumor by a biotissue layer. Biological tissues have a relatively high scattering coefficient even in the tissue transparency window. Depending on the type of biological tissue, the scattering coefficient of light at a wavelength of 785 nm can vary from 1 to 20 cm−1 [21]. Although SERS response is an important factor of detectability, optical throughput and setup geometry also can play a major role. Indeed, in a turbid medium the exciting light will be weakened and the Raman photons will scatter. All this leads to a significant decrease in the depth of possible imaging up to hundreds of microns. Several approaches have been developed to overcome these difficulties including spatially offset Raman spectroscopy (SORS) [22], timeresolved Raman spectroscopy (TRRS) [23] and transmission Raman spectroscopy (TRS) [24]. In contrast to conventional backscattering Raman microscopy, deep Raman techniques are able to acquire the SERS signal from a depth of up to several centimeters [25]. Despite this conventional backscattering, Raman microscopy still holds a leading position in SERS bioimaging in vivo due to the simplicity and availability of equipment. In this paper, we developed a tumor phantom with incorporated SERS tags (petal-like gap-enhanced Raman tags). By using this phantom we evaluated the performance of the conventional backscattering Raman microscopy in biologically relevant turbid medium.
2. Materials and Methods
2.1. Reagents
Cetyltrimethylammonium bromide (CTAB, 96%; Fluka), cetyltrimethylammonium chloride (CTAC; 25% water solution), l-ascorbic acid (AA, >99.9%), 4-nitrobenzenethiol (NBT), hydrochloric acid (HCl, 37 wt.% in water) and sodium borohydride (NaBH4, 99%), sodium alginate, calcium chloride (CaCl2, 99.99%), agarose and intralipid (IL, 20% solution) were purchased from Sigma–Aldrich. Hydrogen tetrachloroaurate trihydrate (HAuCl4, 99.99%) was purchased from Alfa Aesar
2.2. Petal-Like Gap-Enhanced Raman Tag Synthesis
Petal-like gap-enhanced Raman (p-GERTs) tags were obtained by using a template based two-step protocol according to a previous paper [26]. Briefly, at the first stage 20-nm spherical Au cores were prepared according [27]. After synthesis, 20-nm Au nanoparticles were centrifuged at 12,000× g 30 min and resuspended in 50 mM CTAC to have an optical density 4 at 521 nm in cuvette with 1 cm optical length. This value corresponds to the number concentration of particles 1.8 × 10¹² mL−1.
The obtained Au cores (10 mL) were mixed with 300 μL of NBT ethanol solution (2 mM) for 20 min. The modified cores were centrifuged at 12,000× g for 30 min and dispersed in 10 mL 50 mM CTAC. The p-GERTs was prepared by mixing 4 mL 50 mM CTAC, 50 µL of cores, 5 µL of 2 mM NBT solution, 50 µL of 100 mM AA and 50 µL of 10 mM HAuCl4. After 1 h of incubation, the resulting p-GERTs were centrifuged (6000× g, 10 min) and resuspended in 4.5 mL of water. According to our protocol the number concentration of p-GERTs was 2 × 10¹⁰ mL−1
2.3. Incorporation of p-GERTs into Calcium Alginate Spheres
Samples of 100 µL of p-GERTs colloid with concentrations of 2 × 10¹⁰ mL−1, 1010 mL−1, 5 × 10⁹ mL−1, 2.5 × 10⁹ mL−1, 1.25 × 10⁹ mL−1, 0.625 × 10⁹ mL−1 were mixed with 900 µL of 1% sodium alginate. After mixing, 20 µL of the above solutions were dropped into 0.1% calcium chloride solution under vigorous stirring. Sodium alginate immediately reacted with calcium ions followed by formation of calcium alginate (CA) spheres with incorporated SERS tags. These spheres were solid with a diameter of about 2 mm. The concentrations of p-GERTs in the CA spheres were 2 × 109 cm−3, 109 cm−3, 5 × 108 cm−3, 2.5 × 108 cm−3, 1.25 × 108 cm−3, 0.625 × 108 cm−3. Finally, gel spheres were washed and stored in water before use.
2.4. Phantom
A measure of 1 mL of hot 1% agarose was added to the wells of 6-well plastic plate. After cooling a 2-mm agarose layer formed in each well. Six CA spheres containing SERS tags at different concentrations were placed on the agarose surface. Then 2 mL of hot 1% agarose containing intralipid with concentrations of 0, 0.25, 0.5 and 1% were added to the wells. After cooling the phantoms were transferred from wells, washed with water and used for further characterization and study.
2.5. Characterisation and SERS Study
Extinction spectra were measured with a Specord 250 spectrophotometer (Analytik, Jena, Germany). Transmission electron microscopy (TEM) images were recorded on a Libra-120 transmission electron microscope (Carl Zeiss, Jena, Germany) at the Simbioz Center for the Collective Use of Research Equipment in the Field of Physical–Chemical Biology and Nanobiotechnology, IBPPM RAS, Saratov. SERS spectra in colloids were measured with a Peak Seeker Pro 785 Raman spectrometer (Ocean Optics) in 1 cm quartz cuvettes under 785 nm irradiation (30 mW). Raman map of phantom-containing p-GERTS was made by using Renisaw inVia Raman microscope (785 nm, 30 μW, 50× objective, NA = 0.5, working distance 8 mm, 1 s per point). The scanned area inside the test zone was 6 × 10 mm, the step size was 100 μm (in total 6000 pixels were recorded). Data acquisition time at each pixel was 0.1 s, and the total image acquisition time was about 15 min. The SERS images were analyzed using Gwyddion software (Czech Metrology Institute, http://gwyddion.net) and the characteristic peak of p-GERTs at 1331 cm−1 was analyzed.
3. Results
3.1. Synthesis and Characterisation of p-GERTs
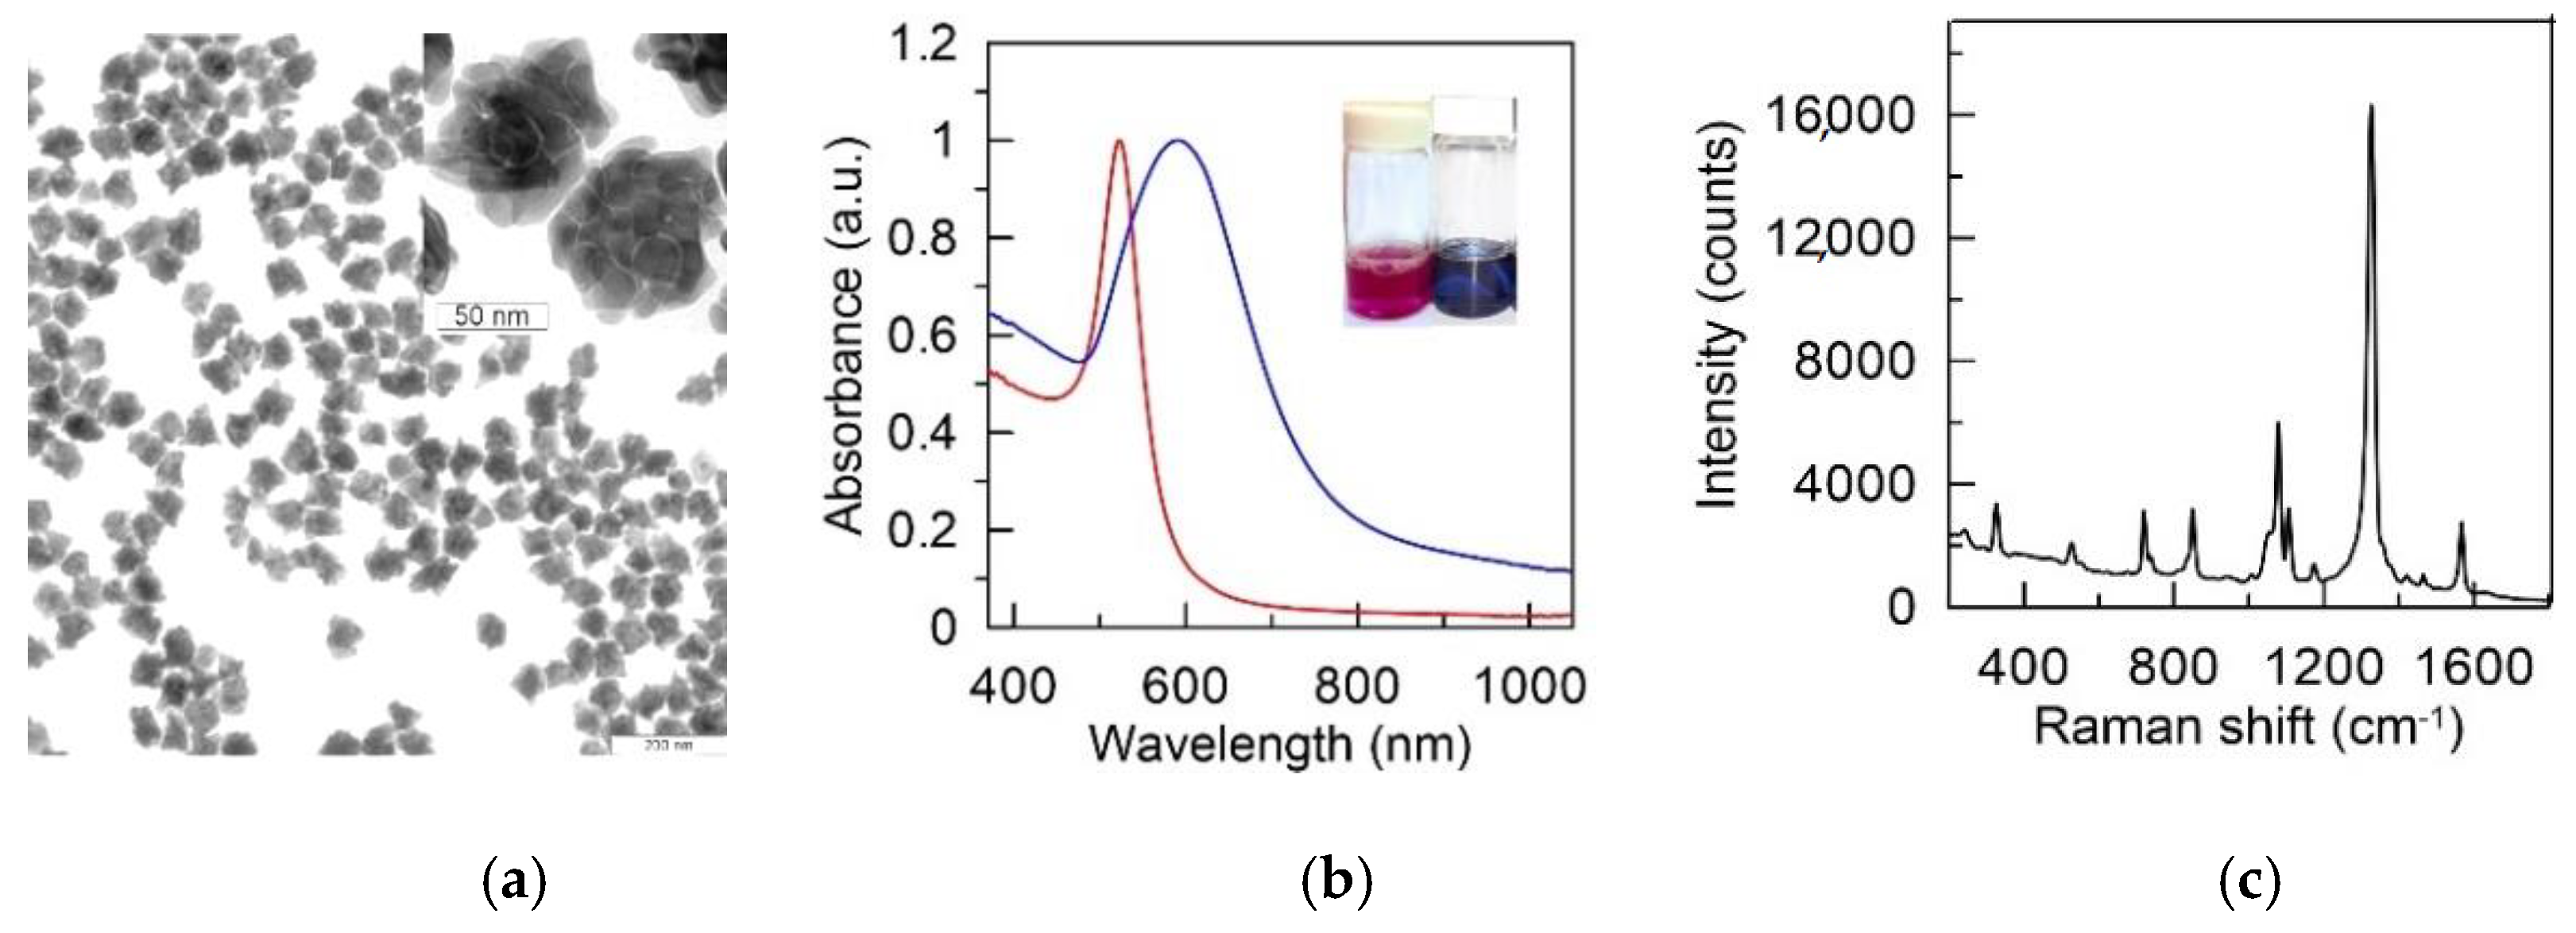
We used a petal-like gap-enhanced Raman tag as a model SERS label. The protocol of p-GERTs synthesis consisted of three main steps. First, the monodisperse Au spherical particles served as seeds were synthesized. Then, these seeds were functionalized with 4-nitrobenzenethiol molecules. At the final step, the petal-like Au shell was grown on the surface of the modified core by reduction of Au ions with ascorbic acid in the presence of CTAC and 4-nitrobenzenethiol.
Figure 1a shows the TEM image of p-GERTs. The nanoparticles were relatively isodisperse and had an average size of about 70 nm. The magnified image allowed the evaluation of the internal structure of the particle. The p-GERTs had a uniform 20 nm Au core, a petal-like shell with a continuous interior nanogap and multiple external nanogaps. Note, all these nanogaps were filled with Raman reporter 4-nitrobenzenethiol and the thickness of the nanogaps of 0.7–1 nm was optimal for the formation of hot-spots under 785 nm laser excitation. From the optical point of view, the p-GERTs had a broadband plasmonic peak in the range of 600–620 nm and the colloid was a blue color (Figure 1b, blue curve).
The broadening and redshift of the extinction peak compared with the one for 20 nm Au cores (Figure 1b, red curve) was due to a large number of electromagnetic hot spots formed in the petal-like shell of p-GERTs. We further measured the SERS spectra from the colloid of nanoparticles (Figure 1c). In agreement with previously reported data [28], the SERS spectrum had characteristic Raman bands dominated by the strongest mode of ν (NO2) at 1331 cm−1 and several minor modes at 723, 854, 1083, 1575, 359 cm−1. The intensity of the strongest Raman line was about 16,000 counts (30 mW, 10 s) which was in line with our previous study [26]. We chose the p-GERTs as the SERS tag because they have the strongest SERS response and photostability compared with such tags as Au Nanorods, Ag nanocubes, Au nanostars and gap-enhanced Raman tags with a solid shell [26].
3.2. Characterisation of Phantom
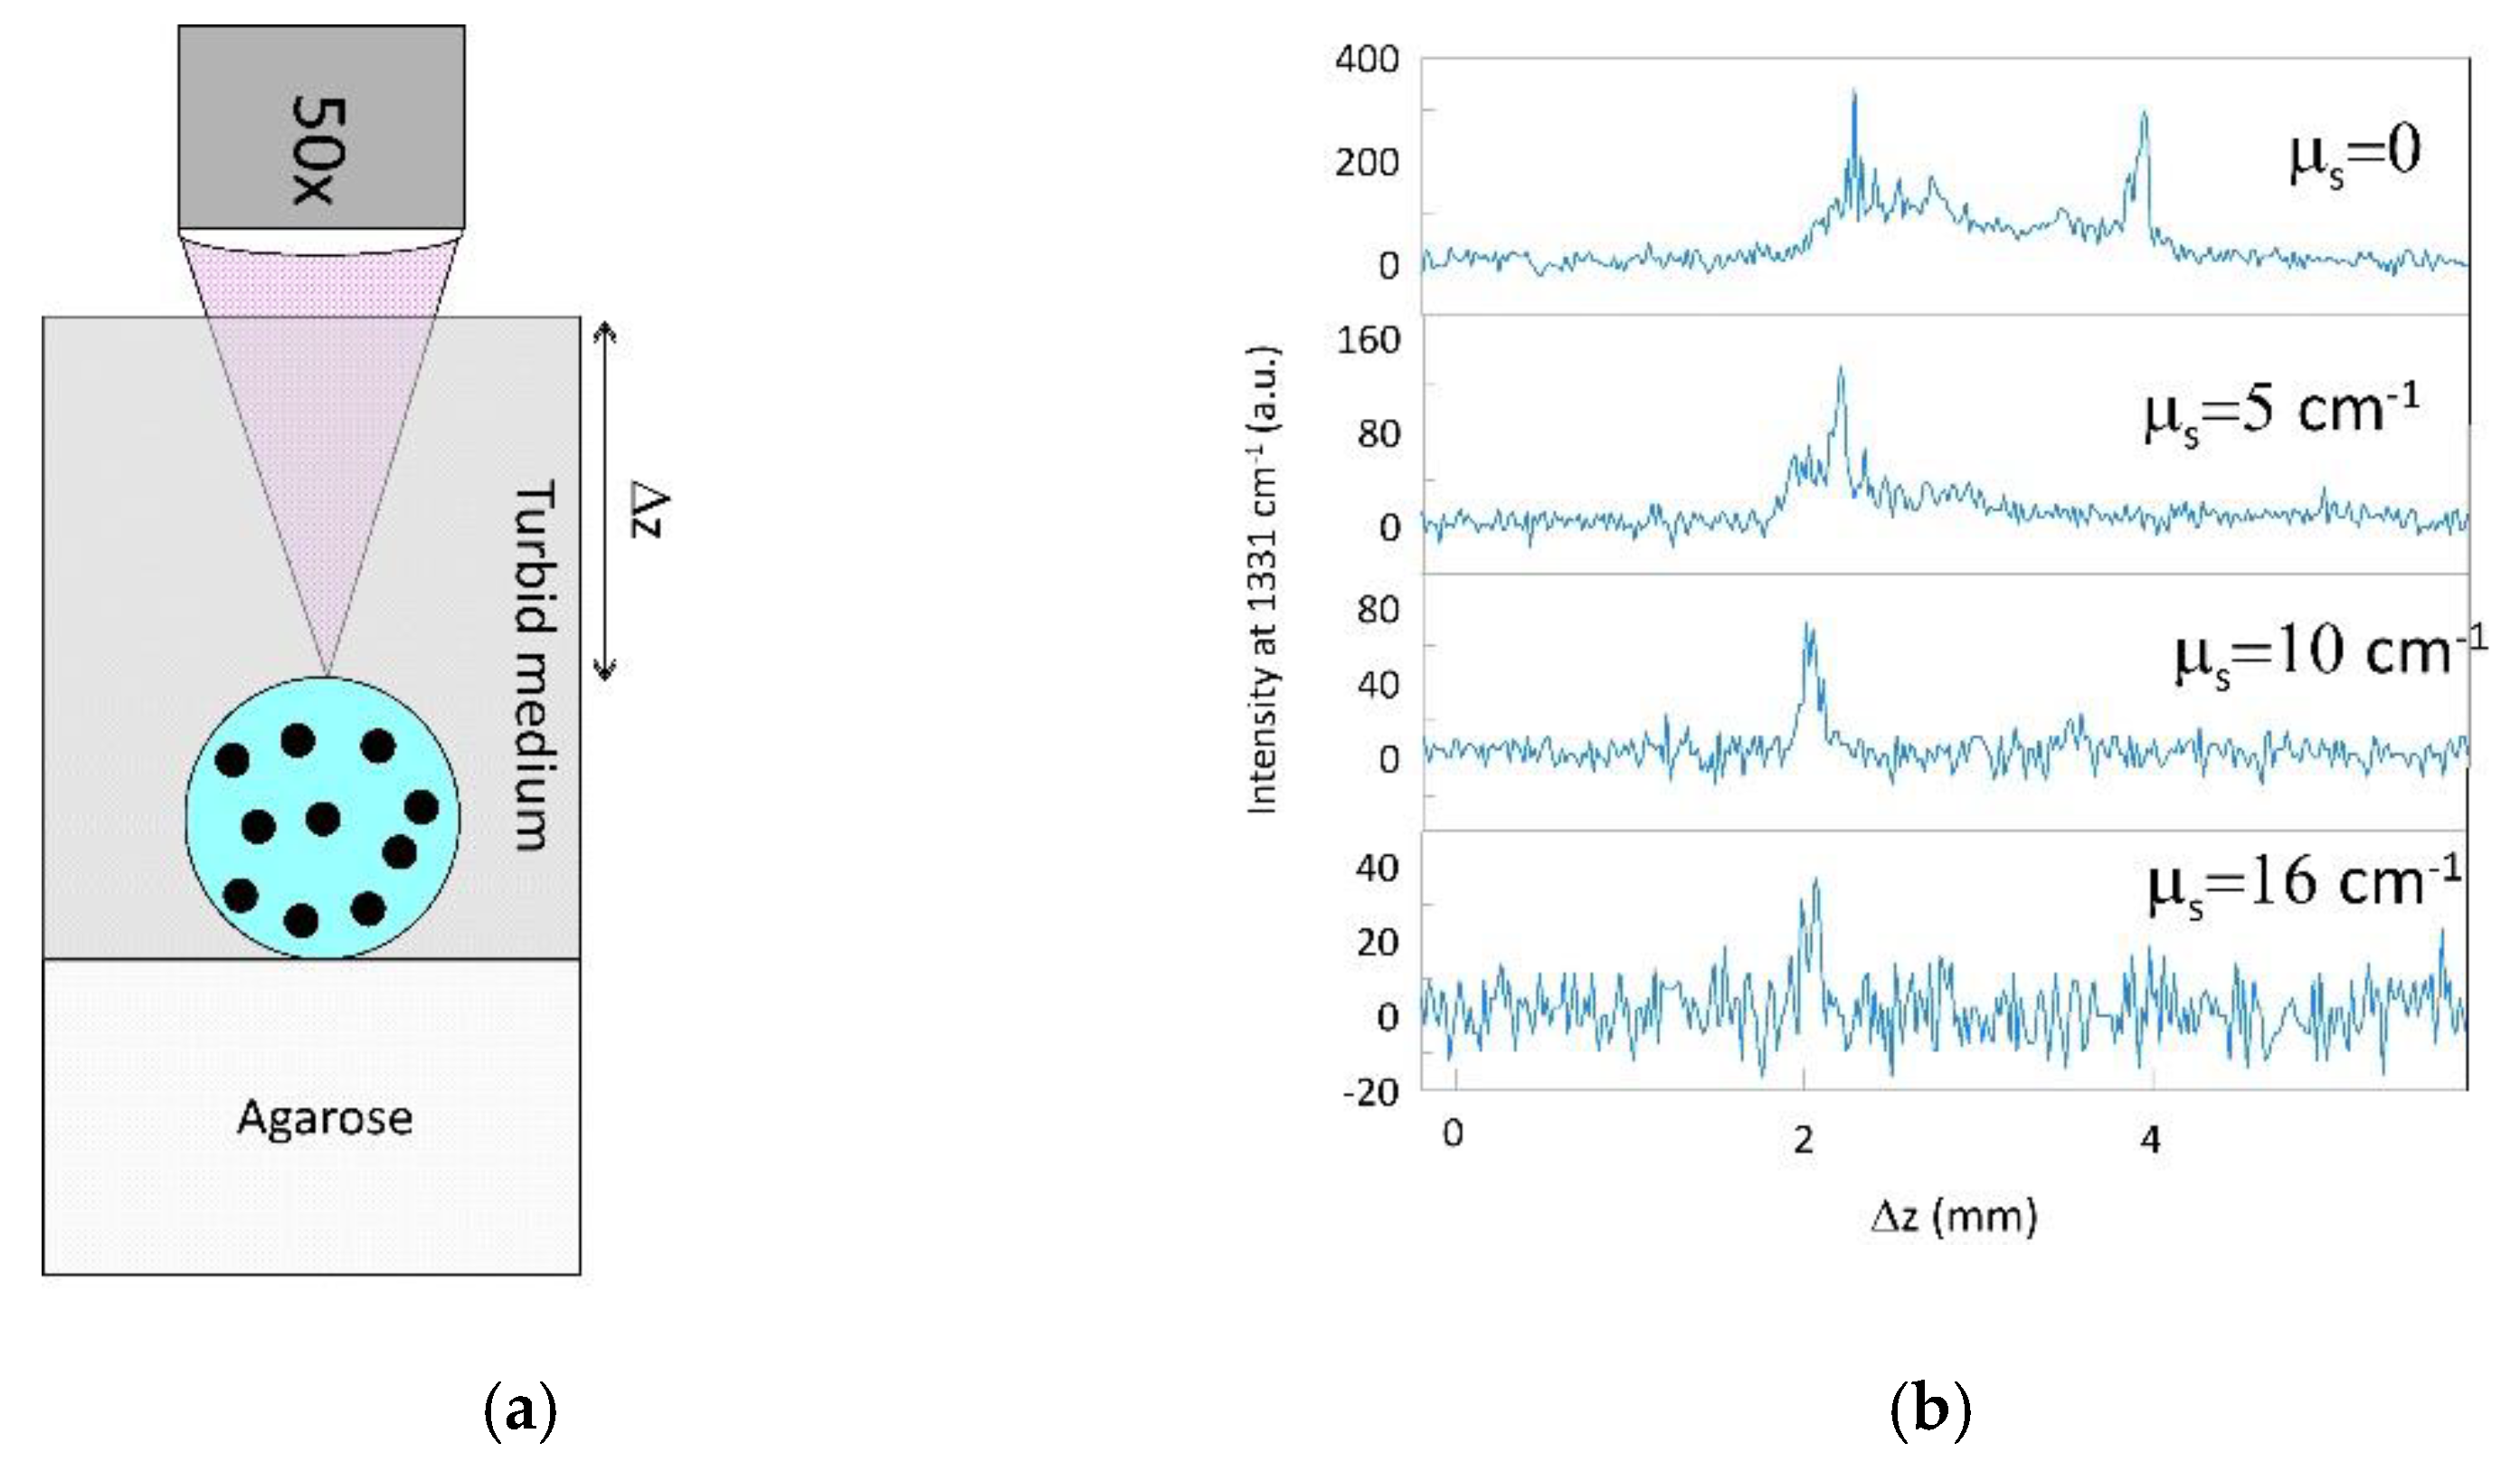
In a typical Raman imaging experiment, it is assumed that particles accumulate in the tumor in a larger amount than in the surrounding tissue. From this point of view, the simplest tumor phantom should be a certain volumetric object with incorporated SERS tags. In this work, we proposed to use 2 mm calcium alginate spheres with p-GERTs included. To determine the concentration threshold of detection, we synthesized 6 types of such CA spheres with SERS tag concentrations ranging from 0.625 × 10⁸ to 2 × 109 cm−3. These concentrations are in agreement with the values that would be expected for non-specific accumulation of gold particles in solid tumors after intravenous injection [29]. To simulate the surrounding biological tissue with a different turbidity, we placed CA spheres in agarose containing intralipid. The scheme of the resulting phantom is shown in the Figure 2a.
The phantom bottom layer consisted of a 2 mm thick agarose support. On top of this support were placed spheres with incorporated SERS tags. The upper layer of the phantom was either 1% agarose gel (transparent medium) or a suspension of intralipid with concentrations 0.25, 0.5, 1% (turbid medium). The thickness of the top layer was 4 mm. Taking into account the size of the spheres, the distance from the top of the sphere to the beginning of the top layer was about 2 mm.
The first question that needs to be answered before studying a phantom with incorporated particles is related to the SERS tags colloidal stability in calcium alginate. The aggregation of particles during gel formation or their nonuniform distribution can significantly affect their optical and SERS properties. We measured the extinction spectra of p-GERTs in water and in calcium alginate (Figure 2b). Taking into account the difference in particle concentration by 10 times and the difference in the optical path length by 5 times, we concluded that both the position and the half-width of the spectral maximum remained unchanged. The SERS spectrum of p-GERTs dispersed in calcium alginate at a concentration of 0.625 × 10⁸ is shown in the Figure 2c. The spectral signature of the p-GERTs in CA was similar to that measured in water. However, we observed a slight decrease in the SERS intensity, which may be associated with a change in the local dielectric environment of the particles. Optical microscopy of the CA alginate spheres with embedded SERS tags (Figure S3, Supplementary Materials) showed an absence of the “coffee ring” effect. In general, the spectral measurements together with optical microscopy allowed us to conclude that the particles were distributed uniformly, did not aggregate, and retained their SERS properties.
Finally, to characterize the phantom, we measured the scattering coefficient for the upper layer of the turbid medium. The spectrum of the scattering coefficient for various concentrations of intralipid is shown in the Figure 2d. Of greatest interest to us were the wavelength of laser radiation at 785 nm and the spectral range of Raman photons of 800–850 nm. For pure agarose gel the scattering coefficient was close to zero. With an increase of the intralipid concentration in the gel, the scattering coefficient µs = 5 cm−1 for 0.25%, reached 10 for 0.5%, and 16 cm−1 for 1%. These values cover the range of scattering coefficients for most biological tissues [21]. Thus, we developed a tumor phantom with incorporated SERS tags and placed it in a tissue-mimicking medium of different turbidities.
3.3. SERS Study
Because the laser focusing conditions affect the detectability of the SERS tags inside the tissue, we decided to find the optimal parameters. The laser could be focused on the surface of our sample, on the surface of the tumor phantom inside the model biological tissue, inside the phantom or deeper than it. Based on the simplest considerations, we can assume that focusing the laser inside the phantom leads to the irradiation of the maximum number of p-GERTs and, consequently, to the highest SERS response. However, defocusing conditions have been shown to significantly increase the probing depth of Raman microscopy [30]. We used the phantom with the highest concentration of SERS tags and measured the intensity of the SERS signal under different focusing of the laser beam from top to bottom with 100 µm Δz-step (Figure 3a).
The study was carried out for the phantom with the highest concentration of incorporated SERS tags and placed in media with different turbidities. We used the SERS intensity at 1331 cm−1 as a quantitative parameter of detectability. Figure 3b shows the dependences of SERS intensity on the depth of the laser focusing for different scattering coefficients of the upper layer. When focusing the laser on the sample surface, the SERS signal intensity was at the noise level (about 18 counts). The signal fluctuated around the noise level for all focusing depths until the focus was on the phantom surface. Upon reaching this limit, the signal rose sharply. Note that the signal intensity directly depended on the turbidity of the medium in which the phantom with incorporated SERS tags was placed. So for a transparent environment the maximum signal corresponded to 320 counts while in the case of the highest turbidity it reached only about 30 counts. A further increase in the depth of focus inside the phantom led to a gradual decrease in the signal. Two important differences should be noted between detection in transparent and detection in turbid media. First, in a transparent medium, the signal is detectable along the entire depth of the phantom. Due to the overall lower signal value in a turbid environment it decreases quickly enough to the noise level. Thus, for a phantom placed in a medium with a scattering coefficient µs = 5 cm−1, the detection depth is 700 µm from the phantom surface while and for a phantom in a medium with a turbidity of 16 cm−1 it is only 100–200 µm. Second, upon detection in a transparent medium, we observed an increase in the signal when focusing near the far boundary of the phantom. We assumed that this was simply the effect of the imperfection of our sample. The increase in the signal in this case occurred due to the reflection of light from the border of the two agarose layers. However, the observed effects were reproducible from sample to sample. For example, the Figure S2 (Supplementary Materials) shows SERS intensity distributions similar to those shown in the Figure 3b, but measured for a different series of phantoms.
The experiment carried out on a simple phantom allowed us to draw a number of conclusions related to real in vivo experiments on SERS bioimaging. It is advisable to carry out a z-scan to determine the distribution of the SERS signal because to obtain the high-contrast Raman image the laser should be focused not on the surface of the sample but on the surface of the tumor inside the biological tissue. When working in turbid environments, focusing errors of even hundreds of micrometers can lead to completely false negative results. This is especially important when working with real samples, when the curvature of the surface can reach several millimeters in the scanned area.
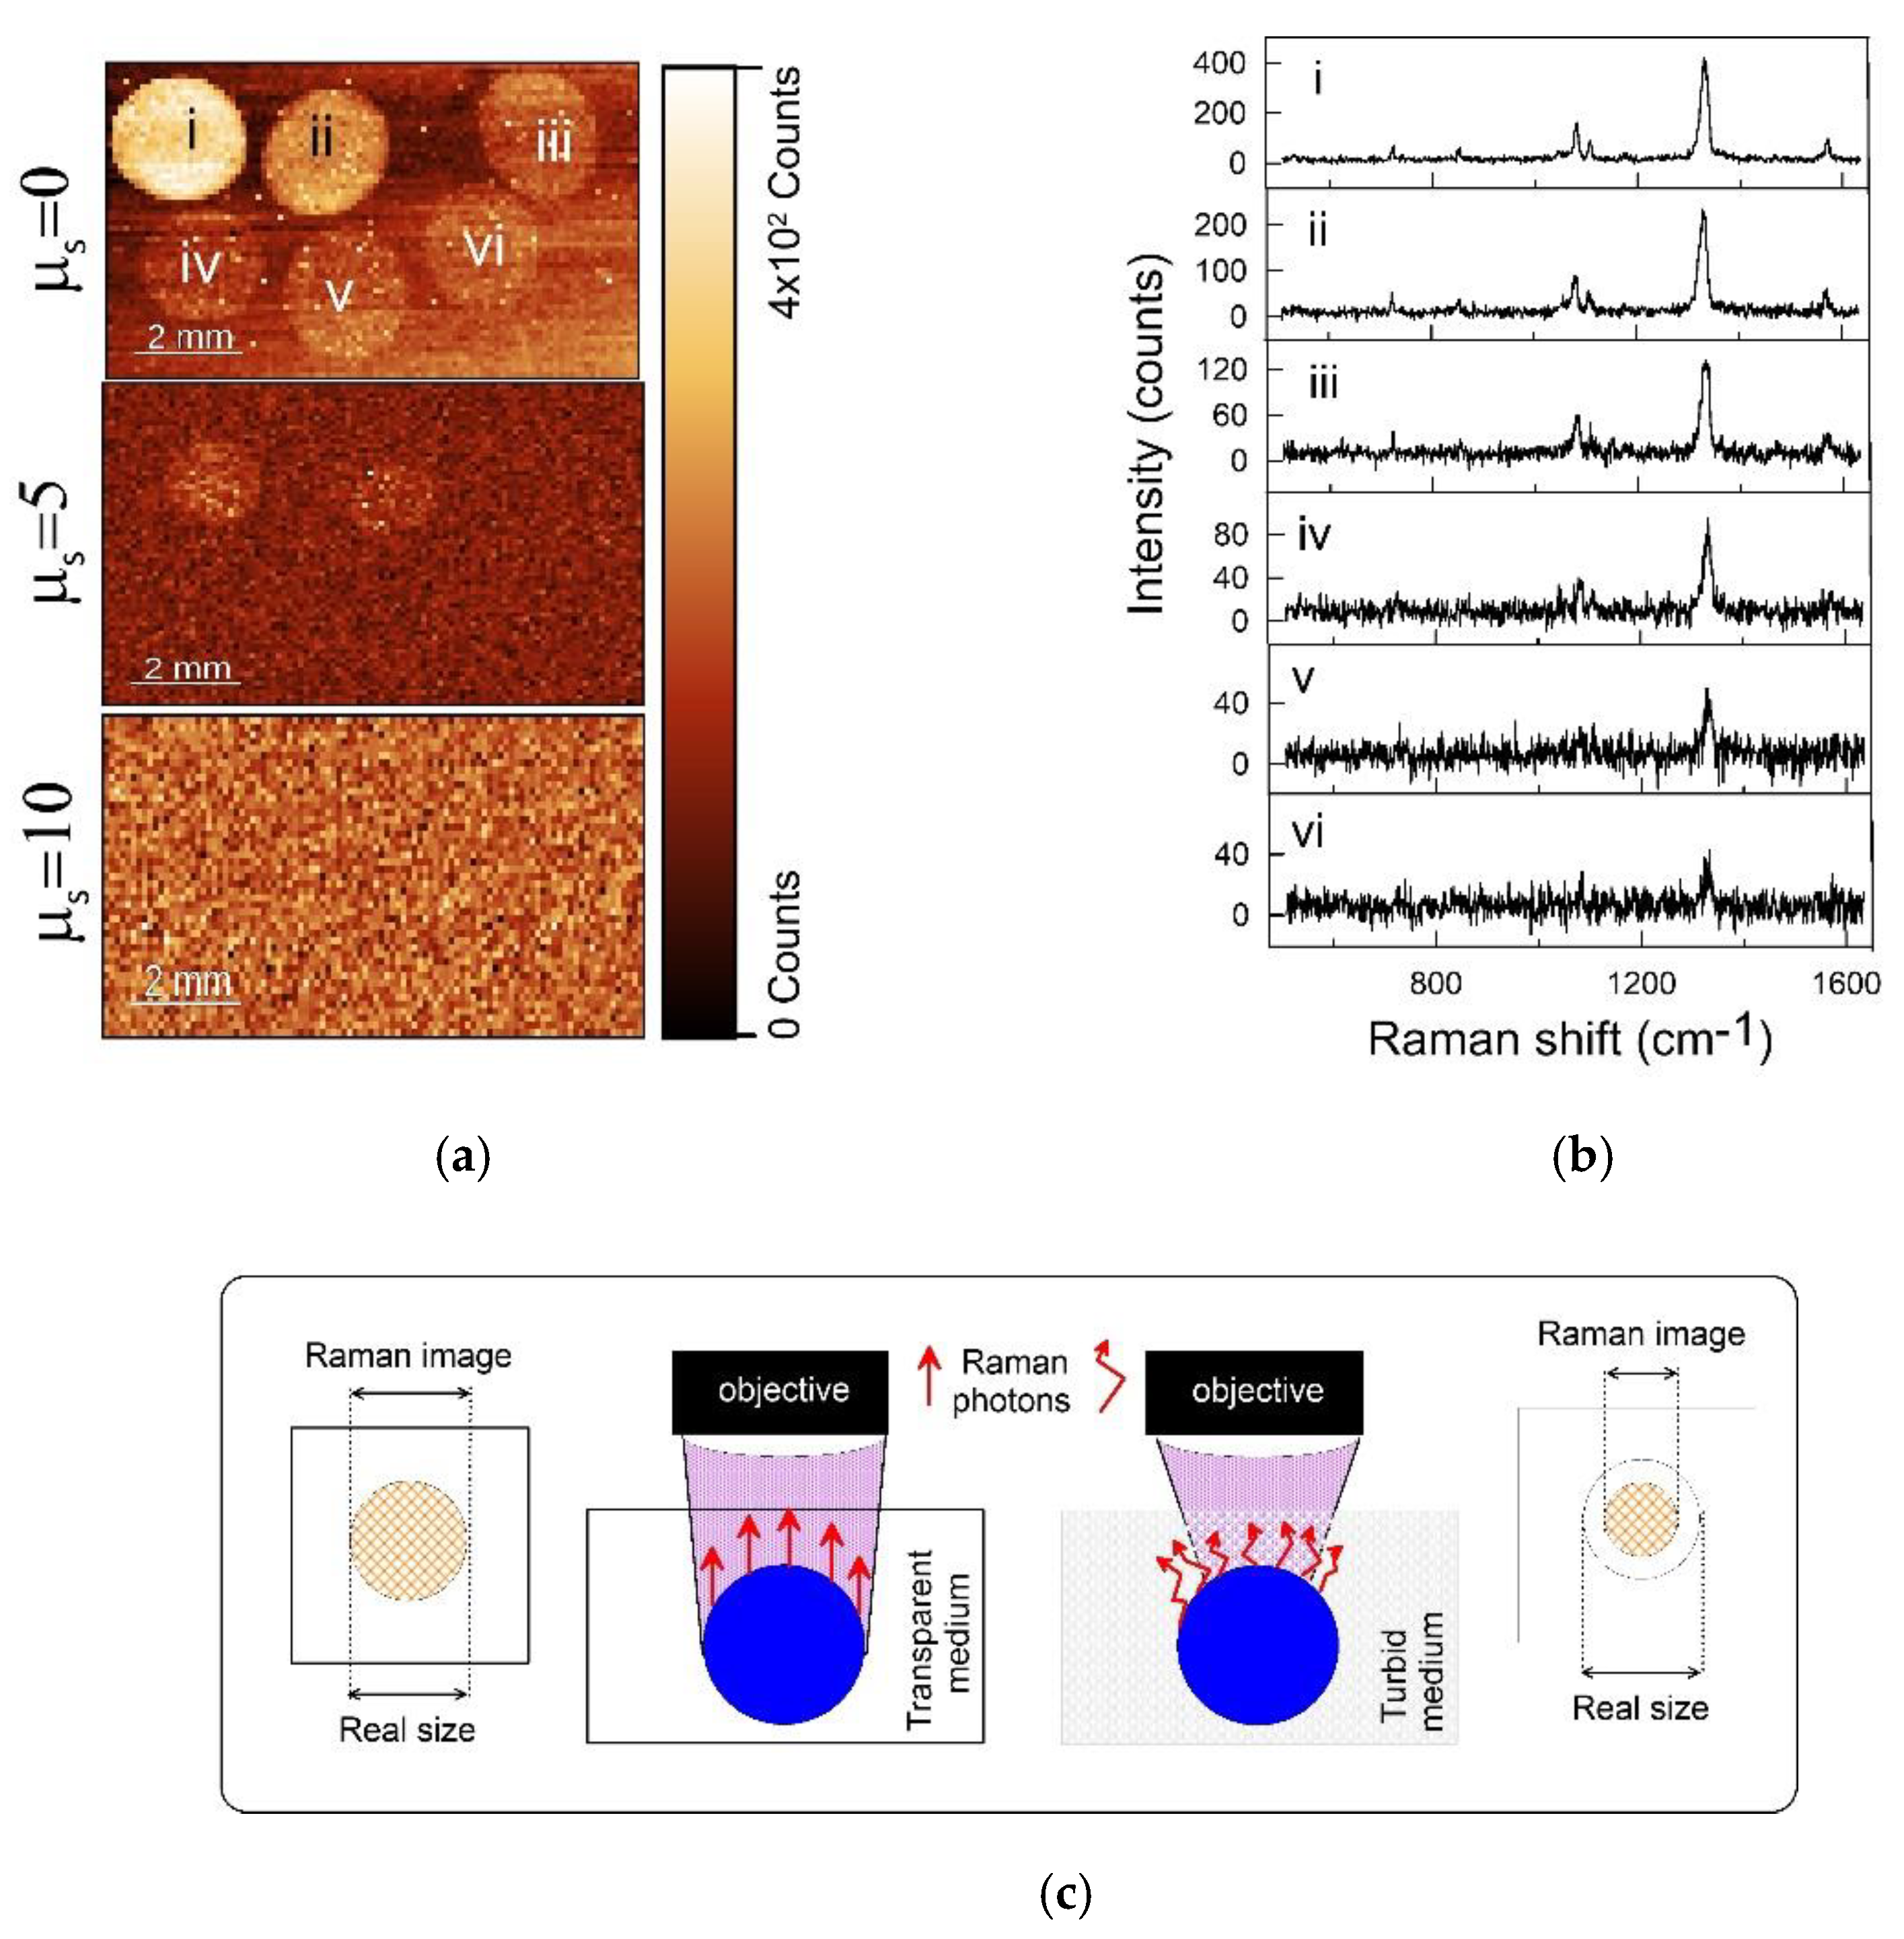
Next, we performed Raman mapping of the phantoms. The main tasks were to elucidate the dependence of the phantom detectability on the amount of SERS tags and the turbidity of the environment. We used the following laser excitation parameters: wavelength 785 nm, laser beam spot 3 μm, power 30 µWatts, signal accumulation time 0.1 s per point, focusing on the phantom surface, imaging area 6 × 10 mm, step 100 μm. The choice of the power and time of irradiation was dictated by the need to match the values used in real, in vivo experiments. An increase in the power density above 100 W / cm2 can lead to nonspecific photothermal damage of biological tissues during imaging. The minimum accumulation time per point was chosen to have a total imaging time above 15 min.
Figure 4a shows Raman maps of the tumor phantoms with incorporated Raman reporters placed into medium with a scattering coefficient of 0 (top), 5 (middle) and 10 cm−1 (bottom). In the transparent medium the phantoms were clearly seen for all concentrations of embedded SERS tags. The intensity of the strongest Raman line at 1331 cm−1 gradually decreased with decreasing tag concentration. Figure 4b shows typical SERS spectra from points in the center of the phantoms. Under our measurement conditions, the signal reached 400 counts for the phantom with the highest concentration of particles (phantom i) and about 30 counts for the lowest concentration (phantom vi). A further decrease in the concentration of particles in the phantom led to a decrease of the signal to the noise level. In this case, the Raman image was not contradictory. Thus, for visualization of a tumor by Raman microscopy in an optically transparent medium the accumulation of at least 0.5 × 10⁸ SERS tags per cm3 is needed. The turbidity of the environment significantly affects the detectability of the phantom. For example, with the scattering coefficient µs = 5 cm−1, we could obtain images of only the first two phantoms with particle concentrations 2 × 10⁹) and 109 cm−3 (Figure 4a, middle). For more turbid media, phantom detection using our Raman mapping parameters became impossible (Figure 4a, bottom). We found another important point: in a transparent medium, the size of the phantoms, determined by Raman mapping, coincided with the real size of the samples (about 2 mm).
However, in a turbid environment, this size decreased significantly (about 1.2 mm, µs = 5). An explanation of this phenomenon is shown schematically in Figure 4c. The phantom is a sphere and has a curvature of the surface. The distance from the top of the phantom to the edges of the turbid medium and air is less than this distance from the edges of the phantom. Raman photons emitted from the edges of the sample are diffusely scattered and do not enter the objective. This leads to a decrease in the apparent size of the phantom. Thus, the lack of accounting for light scattering in Raman mapping can lead to significant errors. This issue is very important when using Raman microscopy to define tumor boundaries in pre- and intraoperative bioimaging.
Finally, we demonstrated that alginate spheres with incorporated SERS tags could be used as a phantom in a real sample. To do this, we implanted CA sphere (2.2 mm diameter, p-GERTs concentration 2 × 109 cm−3) under a chicken skin ex vivo. The thickness of the coverage layer of skin and fat was about 1 mm. An image of the sample is shown in Figure 5a. The localization of the sphere was visible to the naked eye, but defining its boundaries was problematic. We performed Raman mapping of the implantation area (indicated in the Figure 5a by a blue square). To reduce the scanning time, a scanning step of 200 µm was chosen. The Raman image is shown in the Figure 5b. The overplayed optical and Raman image allowed the identification of the location of the phantom under the layer of skin and subcutaneous fat. The size of the object, determined using this mapping, also turned out to be slightly smaller than the real one. In particular, the Raman map showed the CA sphere size of 1.6 mm instead of the actual 2.2 mm.
4. Conclusions
We have developed a solid tumor phantom to study the parameters required for contrast Raman bioimaging in turbid medium. The phantom consists of SERS tags integrated in a 2-mm calcium alginate sphere placed in a medium with different turbidities. We have shown that using this simplified model we can determine important parameters, such as the minimum concentration of particles in the tumor required for bioimaging and the depth of focus of the laser beam. An interesting finding was the decrease in the apparent size of the phantom when imaged through a layer of turbid medium. Although we have demonstrated the use of a phantom to determine the optimal parameters for backscattered Raman microscope, we believe that our phantom could be used for a wider range of deep Raman imaging methods, including spatially offset Raman spectroscopy, time resolved Raman spectroscopy and transmission Raman spectroscopy.
Supplementary Materials
The following are available online at https://0-www-mdpi-com.brum.beds.ac.uk/article/10.3390/photonics8050144/s1, Figure S1. False-color Raman maps of the CA spheres with incorporated Raman reporters placed into medium with scattering coefficient 0 (a), 2 (b) cm−1. Color decoding bar is shown on the right. Concentrations of incorporated SERS tags are 2 × 10⁹ mL−1, gel thickness is 6 mm. Figure S2. The dependence of SERS strongest peak intensity at 1331 cm−1 on the deepness of laser focusing. Δz = 0 corresponds to top of the agarose gel while Δz = 6 mm corresponds to bottom of the sample. The data for different scattering coefficients of the upper layer from µs = 0 to 16 cm−1. Figure S3. Optical image of the CA spheres with incorporated Raman reporters under 50× (a), 100× (b) magnification. Concentrations of incorporated SERS tags are 2 × 109 cm−3.
Author Contributions
Conceptualization, B.K. and N.K.; methodology, B.K.; nanoparticle synthesis, A.B.; phantom study, B.K. and A.B.; Raman microscopy, D.B.; writing—original draft preparation, B.K.; writing—review and editing, N.K. All authors have read and agreed to the published version of the manuscript.
Funding
This research was supported by the Russian Scientific Foundation (project no. 18-14-00016-П).
Data Availability Statement
The data presented in this study are available on request from the corresponding author.
Conflicts of Interest
The authors declare no conflict of interest.
References
- Yeh, B.M.; Fitzgerald, P.F.; Edic, P.M.; Lambert, J.W.; Colborn, R.E.; Marino, M.E.; Evans, P.M.; Roberts, J.C.; Wang, Z.J.; Wong, M.J.; et al. Opportunities for new CT contrast agents to maximize the diagnostic potential of emerging spectral CT technologies. Adv. Drug Deliv. Rev. 2017, 113, 201–222. [Google Scholar] [CrossRef] [Green Version]
- Clough, T.J.; Jiang, L.; Wong, K.-L.; Long, N.J. Ligand design strategies to increase stability of gadolinium-based magnetic resonance imaging contrast agents. Nat. Commun. 2019, 10, 1420. [Google Scholar] [CrossRef] [PubMed] [Green Version]
- Zhou, L.-Q.; Li, P.; Cui, X.-W.; Dietrich, C.F. Ultrasound nanotheranostics in fighting cancer: Advances and prospects. Cancer Lett. 2020, 470, 204–219. [Google Scholar] [CrossRef] [PubMed]
- Menon, H.; Guo, C.; Verma, V.; Simone, C.B. The Role of Positron Emission Tomography Imaging in Radiotherapy Target Delineation. PET Clin. 2020, 15, 45–53. [Google Scholar] [CrossRef] [PubMed]
- Yoon, S.; Kim, M.; Jang, M.; Choi, Y.; Choi, W.; Kang, S.; Choi, W. Deep optical imaging within complex scattering media. Nat. Rev. Phys. 2020, 2, 141–158. [Google Scholar] [CrossRef] [Green Version]
- Tuchin, V.V. Handbook of Optical Biomedical Diagnostics, 2nd ed.; SPIE Press: Bellingham, WA, USA, 2016; pp. 215–306. [Google Scholar]
- Wang, Y.; Yan, B.; Chen, L. SERS tags: Novel optical nanoprobes for bioanalysis. Chem. Rev. 2013, 113, 1391–1428. [Google Scholar] [CrossRef]
- Fabris, L. SERS Tags: The Next Promising Tool for Personalized Cancer Detection? ChemNanoMat 2016, 2, 249–258. [Google Scholar] [CrossRef]
- Lim, D.-K.; Jeon, K.-S.; Hwang, J.-H.; Kim, H.; Kwon, S.; Suh, Y.D.; Nam, J.-M. Highly uniform and reproducible surface-enhanced Raman scattering from DNA-tailorable nanoparticles with 1-nm interior gap. Nat. Nanotechnol. 2011, 6, 452–460. [Google Scholar] [CrossRef]
- Karabeber, H.; Huang, R.; Iacono, P.; Samii, J.M.; Pitter, K.; Holland, E.C.; Kircher, M.F. Guiding brain tumor resection using surface-enhanced Raman scattering nanoparticles and a hand-held Raman scanner. ACS Nano 2014, 10, 9755–9797. [Google Scholar] [CrossRef] [Green Version]
- Zavaleta, C.L.; Smith, B.R.; Walton, I.; Doering, W.; Davis, G.; Shojaei, B.; Natan, M.J.; Gambhir, S.S. Multiplexed imaging of surface enhanced Raman scattering nanotags in living mice using noninvasive Raman spectroscopy. Proc. Natl. Acad. Sci. USA 2009, 106, 13511–13516. [Google Scholar] [CrossRef] [Green Version]
- Liu, Z.; Ye, B.; Jin, M.; Chen, H.; Zhong, H.; Wang, X.; Guo, Z. Dye-free near-infrared surface-enhanced Raman scattering nanoprobes for bioimaging and high-performance photothermal cancer therapy. Nanoscale 2015, 7, 6754–6761. [Google Scholar] [CrossRef]
- Zeng, L.; Pan, Y.; Wang, S.; Wang, X.; Zhao, X.; Ren, W.; Lu, G.; Wu, A. Raman Reporter-Coupled Agcore@Aushell Nanostars for in Vivo Improved Surface Enhanced Raman Scattering Imaging and Near-infrared-Triggered Photothermal Therapy in Breast Cancers. ACS Appl. Mater. Interfaces 2015, 7, 16781–16791. [Google Scholar] [CrossRef]
- Darrigues, E.; Nima Al Sudani, Z.A.; Watanabe, F.; Biris, A.S. Plasmonic gap-enhanced Raman tag nanorods for imaging 3D pancreatic spheroids using surface-enhanced Raman spectroscopy and darkfield microscopy. Nanotechnology 2021, 32, 095104. [Google Scholar] [CrossRef]
- Khlebtsov, N.G.; Lin, L.; Khlebtsov, B.N.; Ye, J. Gap-enhanced Raman tags: Fabrication, optical properties, and theranostic applications. Theranostics 2020, 10, 2067–2094. [Google Scholar] [CrossRef]
- Bao, Z.; Zhang, Y.; Tan, Z.; Yin, X.; Di, W.; Ye, J. Gap-enhanced Raman tags for high-contrast sentinel lymph node imaging. Biomaterials 2018, 163, 105–115. [Google Scholar] [CrossRef]
- Du, Z.; Qi, Y.; He, J.; Zhong, D.; Zhou, M. Recent advances in applications of nanoparticles in SERS in vivo imaging. Wiley Interdiscip. Rev. Nanomed. Nanobiotechnol. 2020. [Google Scholar] [CrossRef]
- Zhang, Y.; Gu, Y.; He, J.; Thackray, B.D.; Ye, J. Ultrabright gap-enhanced Raman tags for high-speed bioimaging. Nat. Commun. 2019, 10, 3905. [Google Scholar] [CrossRef] [PubMed] [Green Version]
- Yoon, H.Y.; Jeon, S.; You, D.G.; Park, J.H.; Kwon, I.C.; Koo, H.; Kim, K. Inorganic nanoparticles for image-guided therapy. Bioconjug. Chem. 2017, 28, 124–134. [Google Scholar] [CrossRef] [PubMed]
- Huang, D.; Sun, L.; Huang, L.; Chen, Y. Nanodrug delivery systems modulate tumor vessels to increase the enhanced permeability and retention effect. J. Pers. Med. 2021, 11, 124. [Google Scholar] [CrossRef] [PubMed]
- Sandell, J.L.; Zhu, T.C. A review of in-vivo optical properties of human tissues and its impact on PDT. J. Biophotonics 2011, 4, 773–787. [Google Scholar] [CrossRef] [PubMed] [Green Version]
- Nicolson, F.; Kircher, M.F.; Stone, N.; Matousek, P. Spatially offset Raman spectroscopy for biomedical applications. Chem. Soc. Rev. 2021, 50, 556–568. [Google Scholar] [CrossRef]
- Kögler, M.; Heilala, B. Time-gated Raman spectroscopy—A review. Meas. Sci. Technol. 2021, 32, 012002. [Google Scholar] [CrossRef]
- Panikar, S.S.; Cialla-May, D.; De la Rosa, E.; Salas, P.; Popp, J. Towards translation of surface-enhanced Raman spectroscopy (SERS) to clinical practice: Progress and trends. TrAC Trends Anal. Chem. 2021, 134, 116122. [Google Scholar] [CrossRef]
- Stone, N.; Faulds, K.; Graham, D.; Matousek, P. Prospects of deep Raman spectroscopy for noninvasive detection of conjugated surface enhanced resonance Raman scattering nanoparticles buried within 25 mm of mammalian tissue. Anal. Chem. 2010, 82, 3969–3973. [Google Scholar] [CrossRef]
- Khlebtsov, B.N.; Burov, A.M.; Bratashov, D.N.; Tumskiy, R.S.; Khlebtsov, N.G. Petal-like gap-enhanced Raman tags with controllable structures for high-speed Raman imaging. Langmuir 2020, 36, 5546–5553. [Google Scholar] [CrossRef]
- Khlebtsov, B.N.; Tumskiy, R.S.; Burov, A.M.; Pylaev, T.E.; Khlebtsov, N.G. Quantifying the Numbers of Gold Nanoparticles in the Test Zone of Lateral Flow Immunoassay Strips. ACS Appl. Nano Mater. 2019, 2, 5020–5028. [Google Scholar] [CrossRef] [Green Version]
- Khlebtsov, B.N.; Bratashov, D.N.; Khlebtsov, N.G. Tip-functionalized Au@Ag nanorods as ultrabright surface-enhanced Raman scattering probes for bioimaging in off-resonance mode. J. Phys. Chem. C 2018, 122, 17983–17993. [Google Scholar] [CrossRef]
- Terentyuk, G.S.; Maslyakova, G.N.; Suleymanova, L.V.; Khlebtsov, B.N.; Kogan, B.Y.; Akchurin, G.G.; Shantrocha, A.V.; Maksimova, I.L.; Khlebtsov, N.G.; Tuchin, V.V. Circulation and distribution of gold nanoparticles and induced alterations of tissue morphology at intravenous particle delivery. J. Biophotonics 2009, 2, 292–302. [Google Scholar] [CrossRef] [PubMed]
- Eliasson, C.; Claybourn, M.; Matousek, P. Deep subsurface Raman spectroscopy of turbid media by a defocused collection system. Appl. Spectrosc. 2007, 61, 1123–1127. [Google Scholar] [CrossRef]
Figure 1.
(a) TEM image of p-GERTs. The insert shows the magnified image of single p-GERT; (b) extinction spectra of 20-nm Au seeds (red curve) and p-GERTs (blue curve) the insert shows photoimages of seed and p-GERT colloids; (c) SERS spectra of p-GERTs in colloid.
Figure 1.
(a) TEM image of p-GERTs. The insert shows the magnified image of single p-GERT; (b) extinction spectra of 20-nm Au seeds (red curve) and p-GERTs (blue curve) the insert shows photoimages of seed and p-GERT colloids; (c) SERS spectra of p-GERTs in colloid.

Figure 2.
(a) Scheme of the tumor phantom incorporated in the turbid medium; (b) extinction spectra p-GERTs colloid in water (2 mm optical length, red curve) and in calcium alginate (1 cm optical length, blue curve); (c) SERS spectra of p-GERTs in calcium alginate; (d) measured scattering coefficient of intralipid in agarose.

Figure 3.
(a) Scheme of the z-scan measurement of SERS intensity. (b) The dependence of SERS strongest peak intensity at 1331 cm−1 on the depth of laser focusing. Δz = 0 corresponds to the top of the agarose gel while Δz = 6 mm corresponds to the bottom of the sample. The data for different scattering coefficients of the upper layer from µs = 0 to 16 cm−1.

Figure 4.
(a) False-color Raman maps of the CA spheres with incorporated Raman reporters placed into medium with scattering coefficient 0 (top), 5 (middle) and 10 (bottom). Color decoding bar is shown on the right. Concentrations of incorporated SERS tags were 2 × 109 cm−3 (sphere i), 109 cm−3 (sphere ii), 5 × 108 cm−3 (sphere iii), 2.5 × 108 cm−3 (sphere iv), 1.25 × 108 cm−3 (sphere v), 0.625 × 108 cm−3 (sphere vi).; (b) Typical SERS spectra obtained from different tumor phantoms; (c) Scheme of the decrease in the apparent size of a phantom in Raman mapping in a turbid medium.

Figure 5.
(a) Image of chicken tissue with CA sphere implanted under skin (left). Blue square indicated Raman mapping area. False-color Raman maps of the CA spheres with incorporated Raman reporters implanted under chicken skin and fat layer with thickness of 1 mm. Color decoding bar is shown on the right. (b) Overplayed image and Raman map.

Publisher’s Note: MDPI stays neutral with regard to jurisdictional claims in published maps and institutional affiliations. |
© 2021 by the authors. Licensee MDPI, Basel, Switzerland. This article is an open access article distributed under the terms and conditions of the Creative Commons Attribution (CC BY) license (https://creativecommons.org/licenses/by/4.0/).
Share and Cite
MDPI and ACS Style
Khlebtsov, B.; Bratashov, D.; Burov, A.; Khlebtsov, N. Tumor Phantom with Incorporated SERS Tags: Detectability in a Turbid Medium. Photonics 2021, 8, 144. https://0-doi-org.brum.beds.ac.uk/10.3390/photonics8050144
AMA Style
Khlebtsov B, Bratashov D, Burov A, Khlebtsov N. Tumor Phantom with Incorporated SERS Tags: Detectability in a Turbid Medium. Photonics. 2021; 8(5):144. https://0-doi-org.brum.beds.ac.uk/10.3390/photonics8050144
Chicago/Turabian StyleKhlebtsov, Boris, Daniil Bratashov, Andrey Burov, and Nikolai Khlebtsov. 2021. "Tumor Phantom with Incorporated SERS Tags: Detectability in a Turbid Medium" Photonics 8, no. 5: 144. https://0-doi-org.brum.beds.ac.uk/10.3390/photonics8050144
Note that from the first issue of 2016, this journal uses article numbers instead of page numbers. See further details here.