Types/Applications of Photoacoustic Contrast Agents: A Review


1
Department of Chemical and Biomolecular Engineering, Sogang University, 35 Baekbeom-ro, Mapo-gu, Seoul 04107, Korea
2
Department of Biomedical Engineering, Sogang University, 35 Baekbeom-ro, Mapo-gu, Seoul 04107, Korea
*
Author to whom correspondence should be addressed.
†
These authors contributed equally to this work.
Photonics 2021, 8(7), 287; https://0-doi-org.brum.beds.ac.uk/10.3390/photonics8070287
Submission received: 24 May 2021
/
Revised: 27 June 2021
/
Accepted: 9 July 2021
/
Published: 19 July 2021
(This article belongs to the Special Issue Photoacoustic Imaging and Systems)
Abstract
:Ultrasound imaging, one of the common diagnosis techniques, is frequently used since it is safe, cost-efficient technique and real-time imaging can be conducted. However, various organs and tissues reflect ultrasonic waves, which leads to difficulty in imaging small biomolecules and to a low spatial resolution for deep-tissue images. As such, there have been significant advances in photonics and optical molecular probes in recent years, and photoacoustic (PA) tomography (PAT) has emerged as a promising modality that can overcome the limitations of ultrasound. PAT relies on the photoacoustic effect, which is the conversion of absorbed optical energy into acoustic energy. Since fewer biomolecules exhibit the photoacoustic effect compared to the scattering or reflection of ultrasound, PAT can be employed to generate high-resolution images. PAT also has a number of other advantages when compared to conventional biomedical imaging modalities such as optical tomography, ultrasound imaging, computed tomography, positron emission tomography and magnetic resonance imaging. This review provides a general overview of the contrast agents used for PAT, including organic, inorganic and hybrid contrast agents, and describes their application. This review also identifies limitations of current PAT contrast agents and suggests future research directions for their development.
1. Introduction
In the medical field, ultrasound imaging has become an important tool in the accurate diagnosis of disease. However, organs and tissues reflect ultrasonic waves, making the imaging of small biomolecules challenging and leading to a low spatial resolution for deep-tissue imaging [1,2,3]. Photoacoustic (PA) tomography (PAT) has emerged as a promising modality that could overcome the limitations of ultrasound. PAT relies on the photoacoustic effect, which is the conversion of absorbed optical energy into acoustic energy [4]. Since fewer biomolecules exhibit a photoacoustic effect compared to the scattering or reflection of ultrasound waves, PAT can generate high-resolution images.
Compared with other major biomedical imaging modalities, PAT offers a number of important advantages. For example, PAT can produce deeper images with a higher spatial resolution within the entire field of view which shows much higher performance than pure optical tomography, such as diffuse optical tomography (DOT) and fluorescence tomography (FMT). In addition, in contrast with ultrasound imaging, PAT offers rich intrinsic and extrinsic optical contrast with various materials and is free of speckle artifacts. Compared with X-ray computed tomography (X-ray CT) and positron emission tomography (PET), PAT uses nonionizing laser illumination, which eliminates radiation exposure. Finally, PAT is much faster and less expensive than magnetic resonance imaging (MRI). In general, PAT offers rich endogenous and exogenous optical contrast based on signals from the optical absorption of externally injected molecules or molecules already present in the body. For example, imaging hemoglobin with or without oxygen illustrates the vascular structure, oxygen saturation (SO2) [5], the blood flow rate [6] and the metabolic rate of oxygen [7]. The molecular imaging of specific biomolecules can be achieved by injecting materials such as dyes, nanoparticles (NPs) and reporter genes, which affect the exogenous optical contrast of PAT. Materials used to increase the contrast-to-noise ratio (CNR) are referred to as PAT contrast agents. They exhibit a strong photoacoustic effect, thus producing a stronger ultrasonic signal under laser exposure.
In recent decades, PAT has evolved rapidly, with its potential applications and photoacoustic contrast agents actively investigated in vascular biology [8,9], ophthalmology [10,11], oncology [12], neurology [13], dermatology [14] and cardiology [15]. This review provides a general overview of PAT contrast agents. Section 2 summarizes the fundamental principles of PAT, including the mechanisms underlying the photoacoustic effect and the resulting imaging process. Section 3 introduces the three main types of PAT contrast agent: organic, inorganic and hybrid, while Section 4 describes their applications. The final section highlights the limitations of current PAT contrast agents and suggests future research directions.
2. Principles of the Photoacoustic Effect
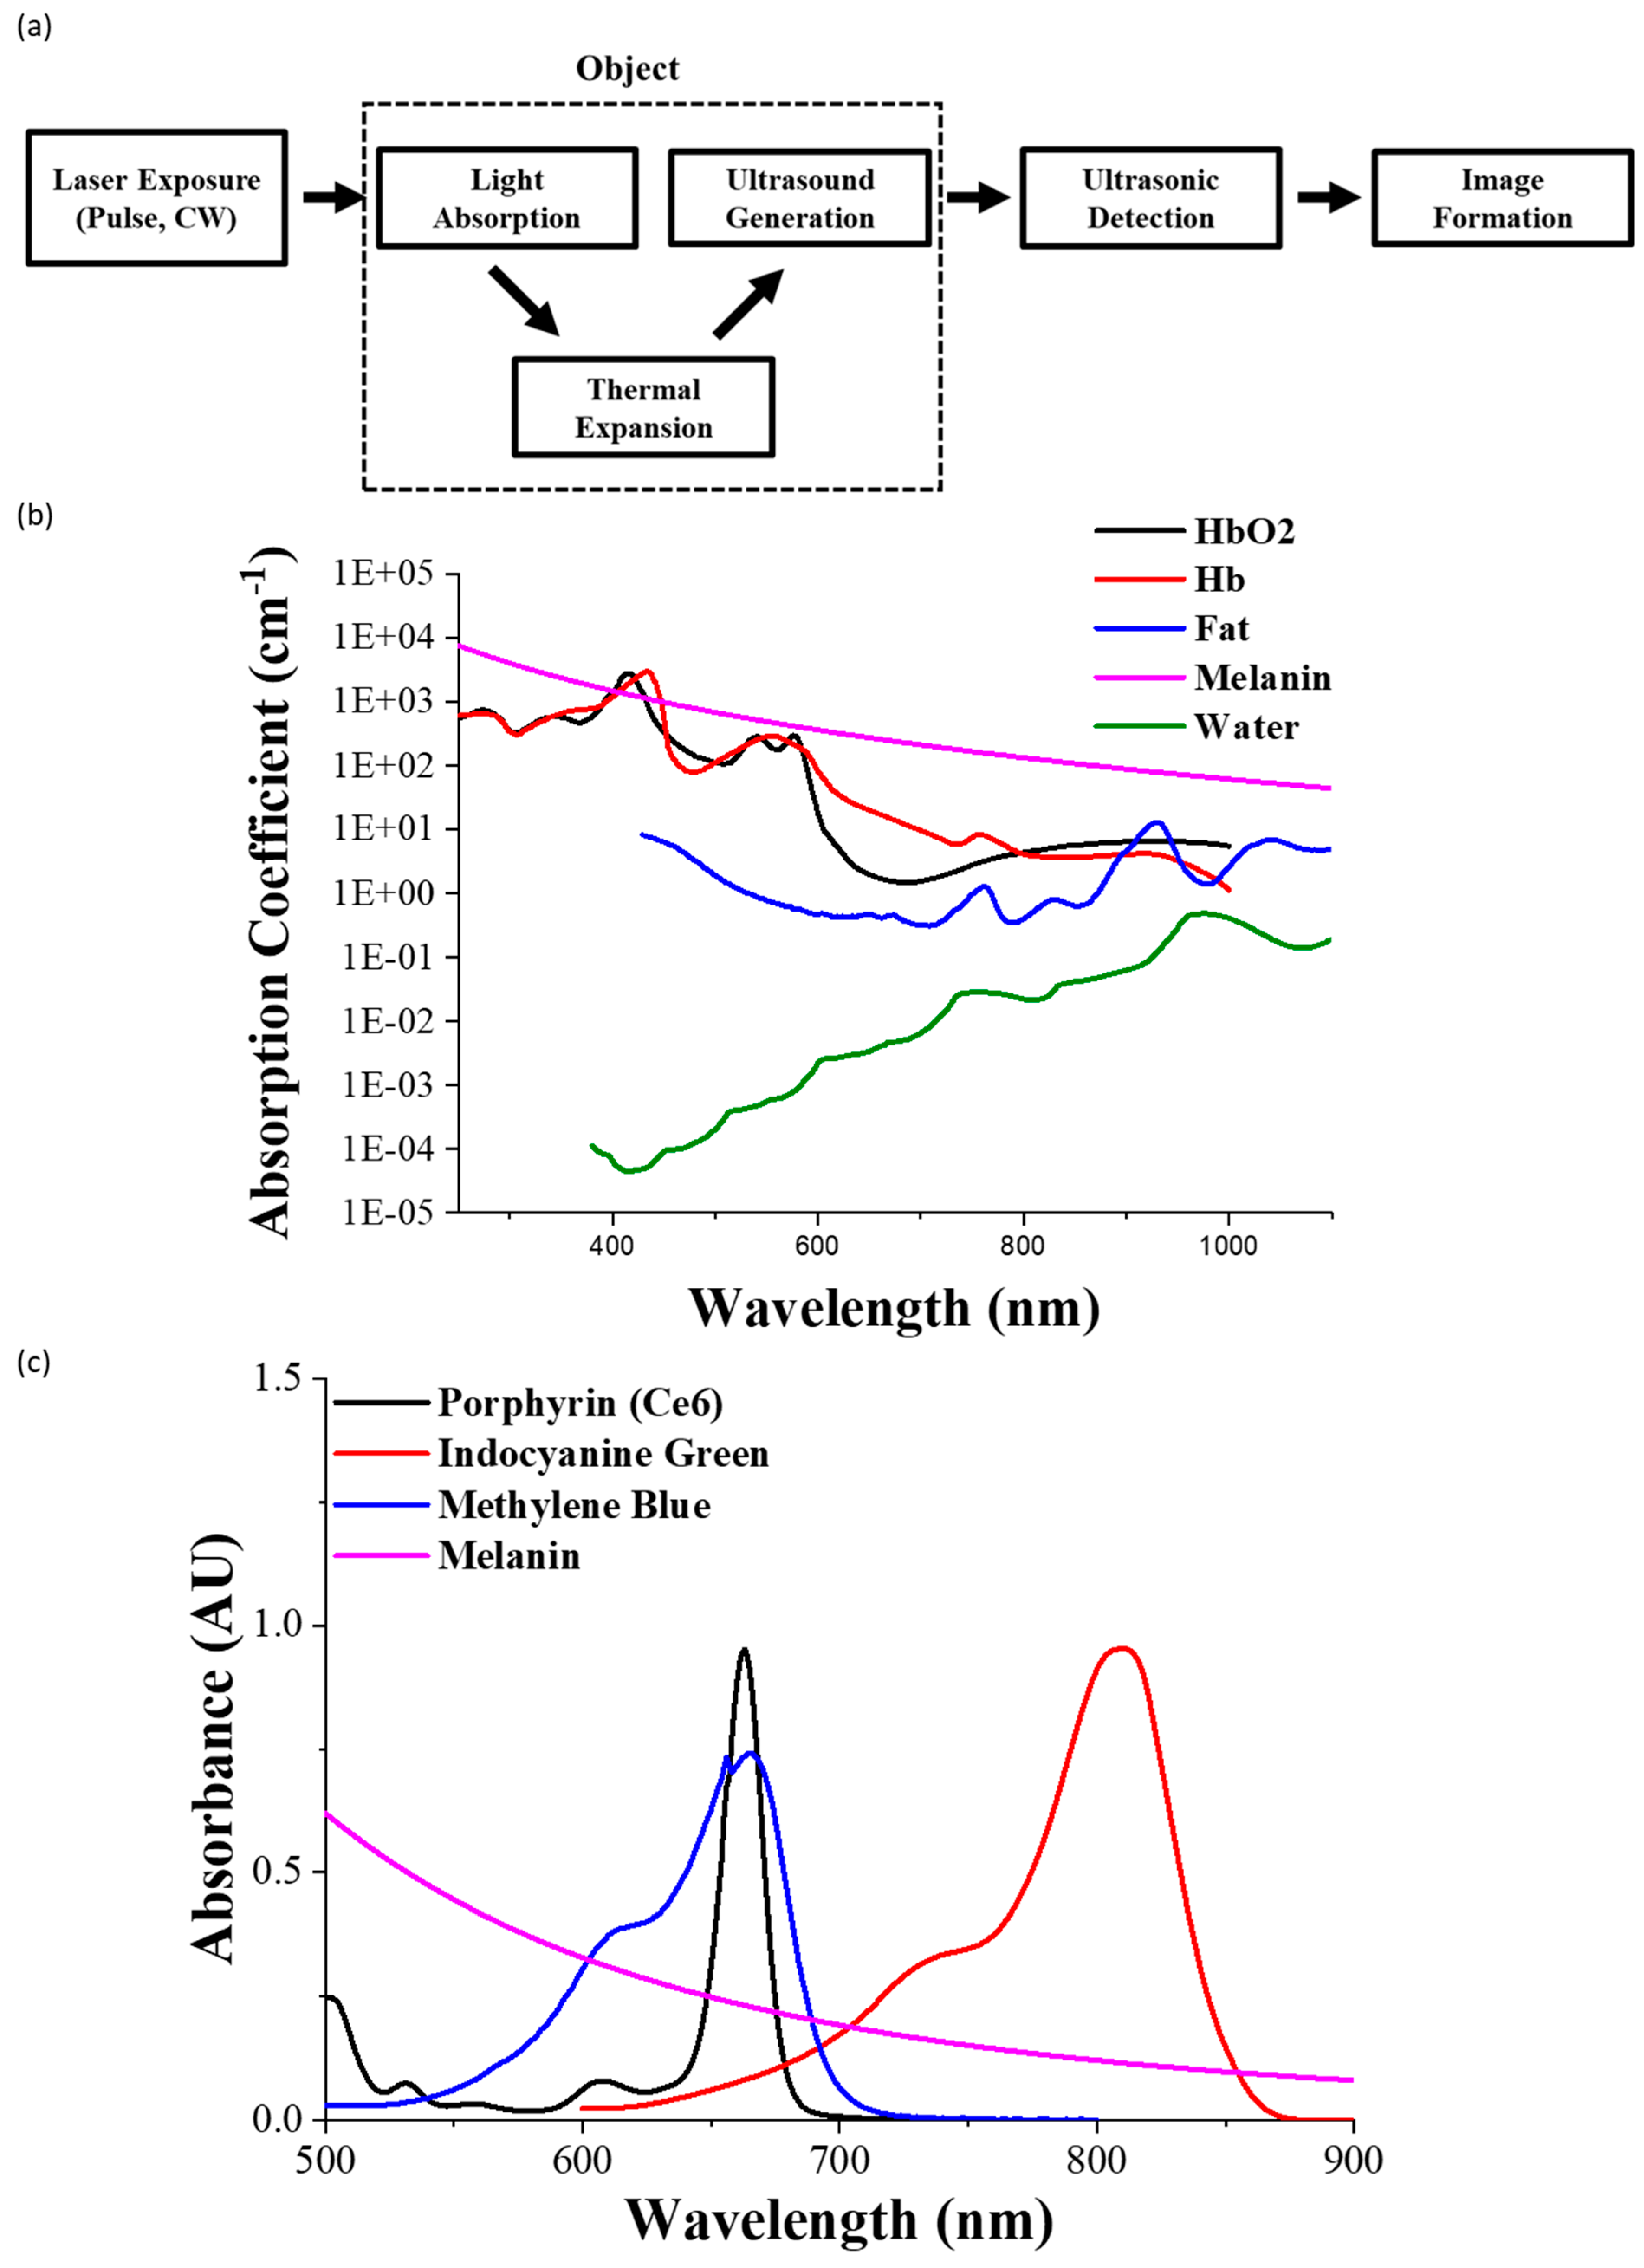
Figure 1a displays the PAT process from laser irradiation to photoacoustic imaging. External laser irradiation first delivers optical energy to an absorptive target, such as tissue, hemoglobin or an injected photoacoustic contrast agent. This target absorbs some of the energy from the laser and rapidly converts it to heat energy. The rapid thermal expansion leads to the generation of vibrations to release the heat energy, producing acoustic waves with an MHz frequency (i.e., ultrasound). These ultrasonic signals are recorded using a set of piezoelectric detectors. The amplitude of the signal and the time taken to receive the ultrasound waves after the laser pulse are used for image processing. Thus, the ultrasonic signals generate a morphological two- or three-dimensional image of the absorptive target.
2.1. Laser Irradiation in PAT
To generate the photoacoustic effect, the thermal expansion triggered by the external laser needs to be time-variant. This requirement can be met using a pulsed [16,17] or a continuous-wave (CW) laser [18,19]. However, pulsed excitation is preferable because it generates a higher signal-to-noise ratio than does CW excitation [20,21]. Selecting the wavelength of the laser is also important for photoacoustic imaging. Near-infrared (NIR) light is commonly used as a laser pulse for photoacoustic imaging because it can easily penetrate the skin, which absorbs less light at longer wavelengths [22]. However, common biological tissue chromophores, including hemoglobin, melanin and water, act as optical absorbers (Figure 1b). Since optical absorption coefficients are sensitive to the wavelength, the wavelength of the laser for photoacoustic imaging should be carefully selected to optimize the resolution of the photoacoustic images of the target biomarker or contrast agent. Most lasers have a wavelength within the NIR window (650–1350 nm) [23], at which light has its maximum depth of penetration in biological tissue.
2.2. Photoacoustic Signal Generation
Under laser exposure, the target biological tissue or contrast agent converts optical energy into heat energy. The sudden volume expansion leads to vibrations, thus converting the heat energy into acoustic energy, which is released as ultrasound waves. This process is referred to as the photoacoustic effect, and it is governed by a pair of coupled differential equations [24,25,26] for temperature (τ) and pressure (p) given by
where c is the speed of sound, γ is the heat capacity ratio, ρ is the density, α is the optical absorption coefficient, β is the thermal expansion coefficient, Cp is the specific heat capacity under constant pressure, K is the thermal conductivity and H is the energy deposited per unit volume and time by radiation source [27,28]. Except for extremely small volumes, the time scale for heat diffusion is much longer than that for sound generation. Therefore, it is commonly assumed that the thermal conductivity is zero when determining the properties of photoacoustic pressure. The coupled equations can be reduced to a single wave equation [29]:
This obviates the need for a solution to the fourth-order equation [30,31] that corresponds to (1). The absorbed laser light, followed by the corresponding rise in temperature, generates the source term in the acoustic wave equation. A local region of high optical absorption will generate stronger propagating acoustic waves.
Under stress confinement, in which the duration of the laser pulse is less than the characteristic confinement time, the amplitude of the acoustic wave generated by an optical absorber depends only on the total amount of energy absorbed, not on its time profile. The acoustic wave is thus given by ΓμaF, where μa is the optical absorption coefficient and F is the optical fluence at the absorber. The specific shape of the acoustic wave is determined by the boundary conditions for all of the optical absorbers heated by the laser. At the limit of highly localized, instantaneous absorption, the acoustic pulse shape is approximated by the time derivative of the optical pulse [28]. Once the initial pressure p0 is generated, it splits into two waves of equal magnitude traveling in opposite directions. The shape of the waves depends on the geometry of the object. For a spherical object, two spherical waves will be generated, one traveling outward and the other traveling inward, because of compression and rarefaction. Thus, the photoacoustic signal has a bipolar shape and the distance between the two peaks is proportional to the size of the object; a smaller object generates a photoacoustic signal with higher frequency components.
3. PA Contrast Agents
3.1. Organic PA Contrast Agents
Dyes and polymers are the most common organic contrast agents (Figure 1c) [32]. Dyes such as melanin [33,34] and porphyrin derivatives [35,36] react with other polymers to improve the PA signal. Polymers that have been employed as contrast agents include protein [37,38], phospholipid [39] and biodegradable polymers [40,41]. These polymers can be used in the form of NPs via precipitation and dispersion, which leads to self-assembly, and in the form of dots. Dyes and polymers are both excellent NIR absorbers for PA imaging because of their high absorption efficiency and low cytotoxicity. This section summarizes some important organic PA contrast agents.
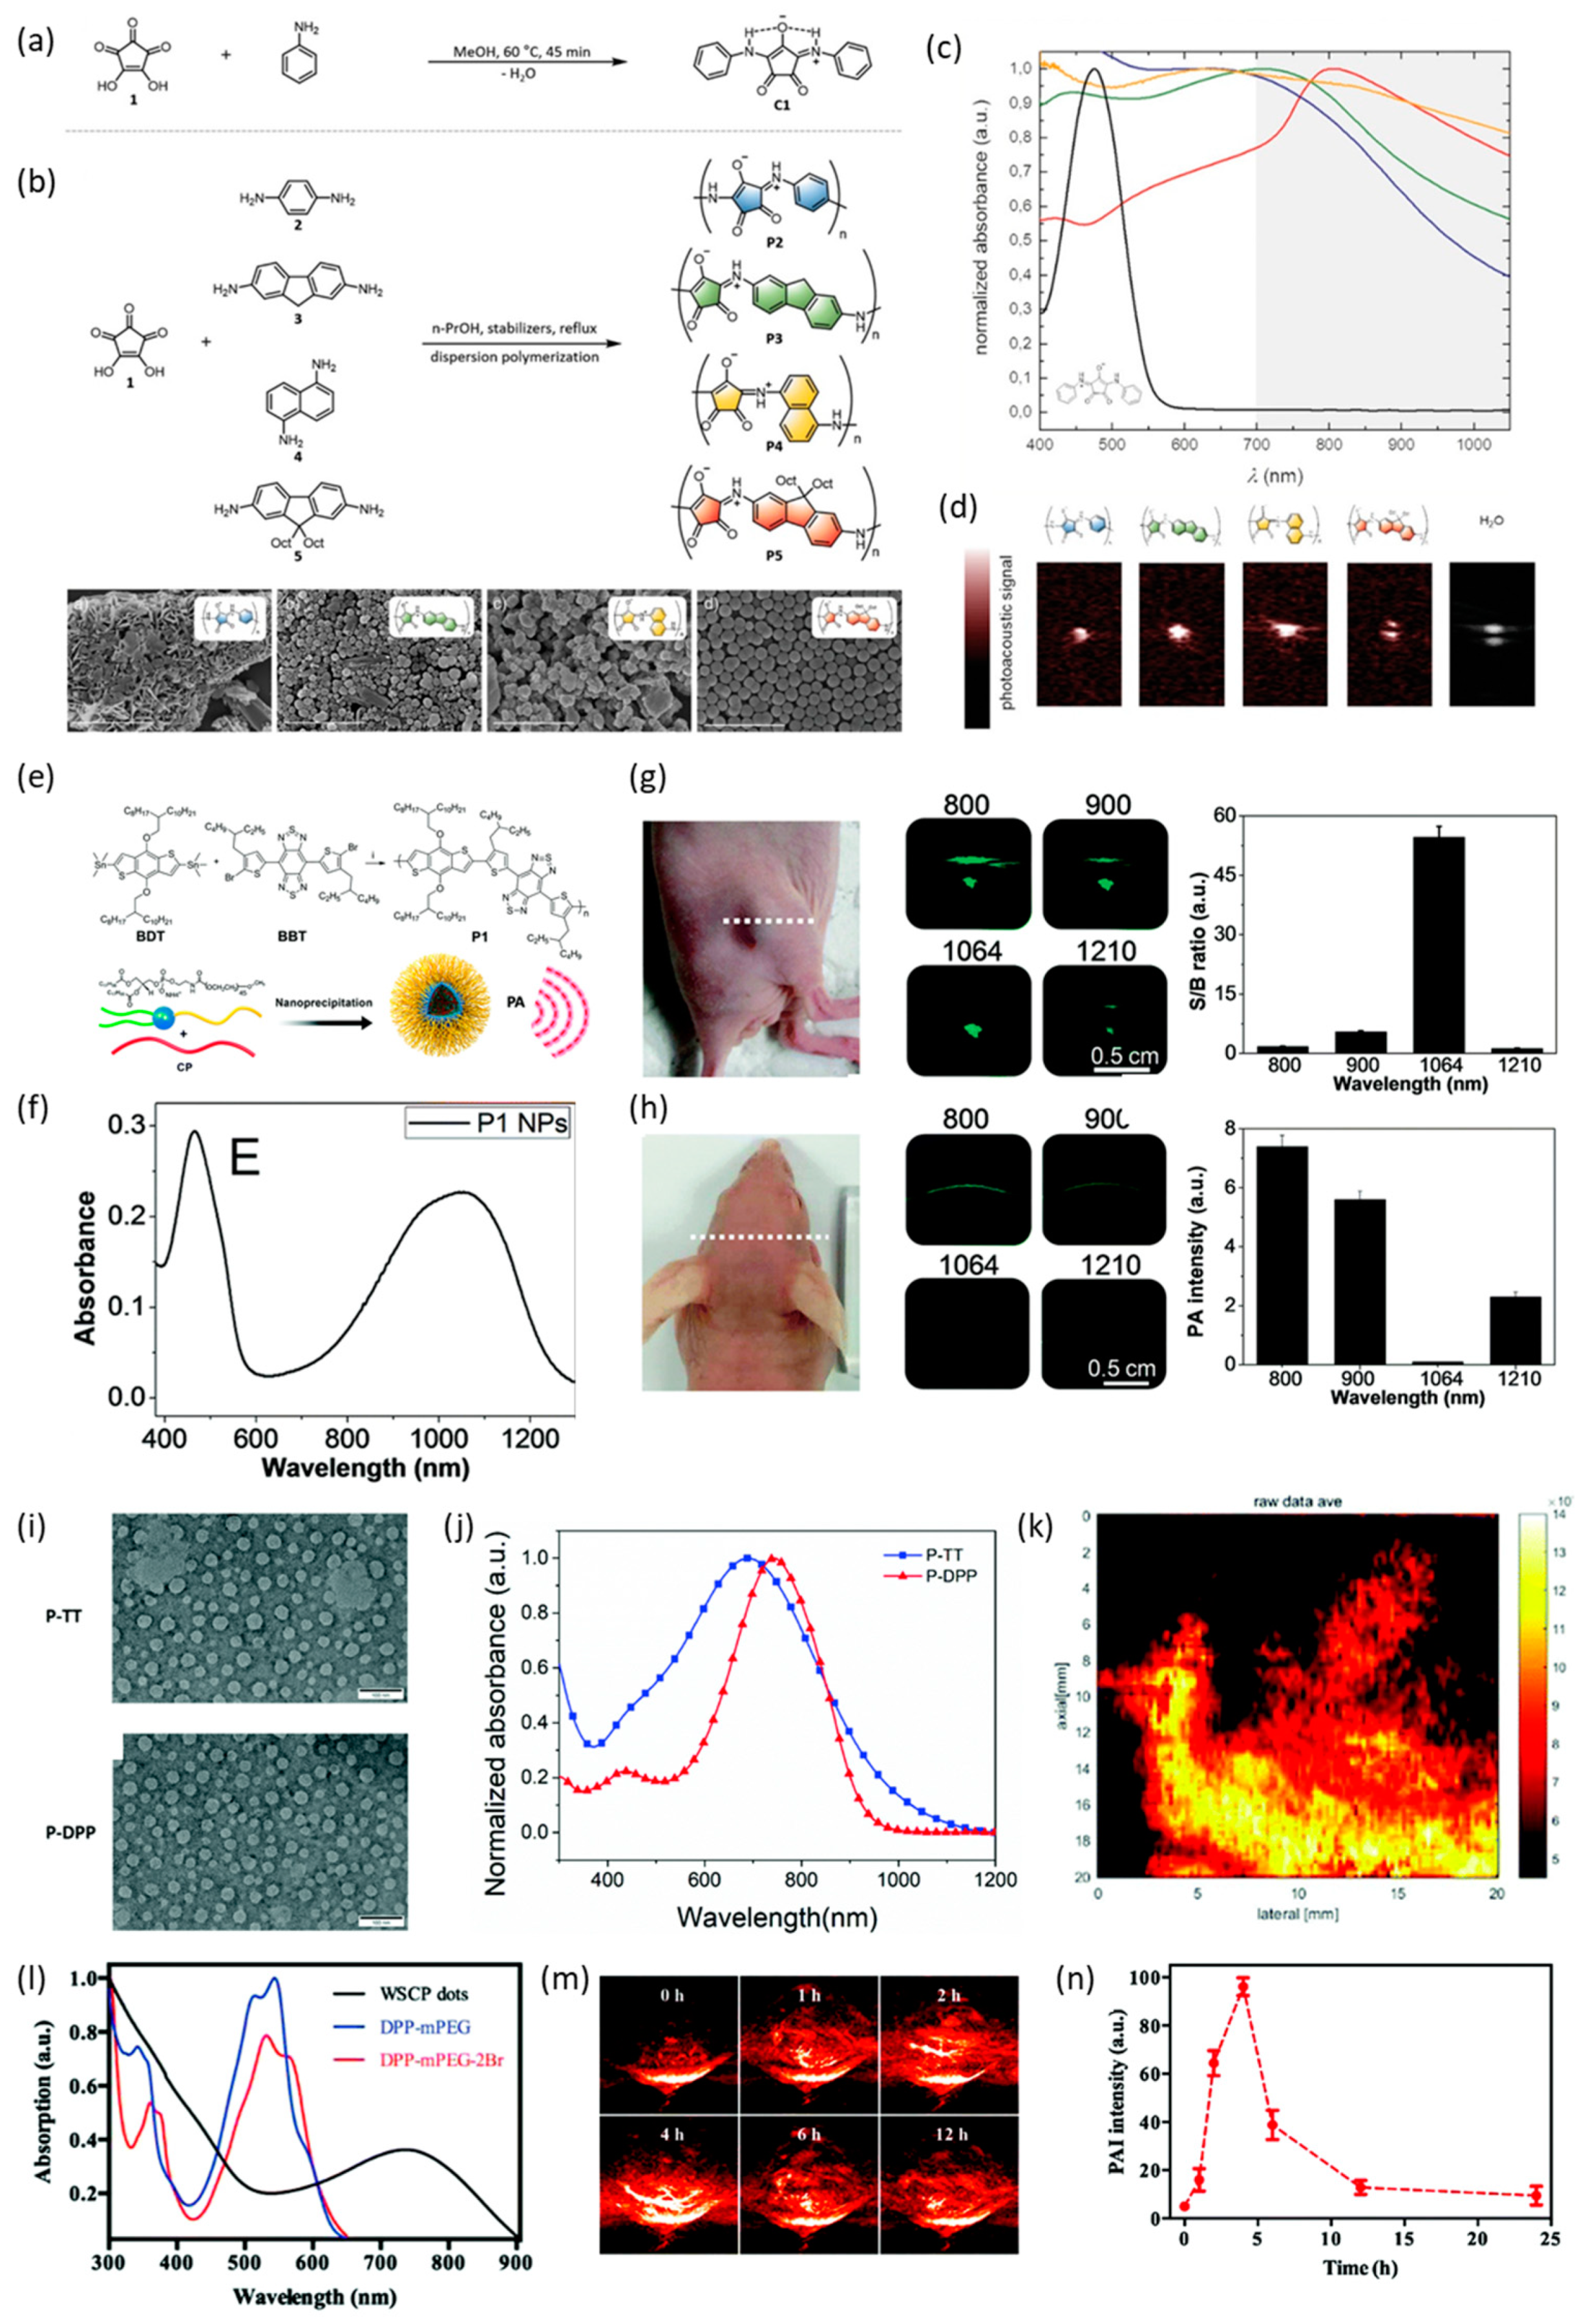
Oxocarbon dyes, such as squaraine and croconine, are particularly promising candidates for PA imaging (Figure 2a). Jansen et al. [42] produced NPs from a polymer in a dispersed form using croconic acid. Figure 2b presents four PA contrast polymers (P2–P5) that were produced by reacting croconic acid with various monomers. It was confirmed that these polymers had a wide absorption wavelength over the NIR range (Figure 2c). In contrast with croconine dye, which consists of small molecules, the high-molecular-weight polymer NPs had a wide absorption band. The authors also succeeded in controlling the size and wavelength of the NPs. By changing the concentration of the initial monomer, the size of the monodispersed particles ranged from 380 nm to 1.2 μm. They also observed that, as the particle size increased, it moved to a higher wavelength. These four types of polymer were able to be used for PA imaging between 750 and 920 nm, with the strongest photoacoustic activity observed at 820 nm (Figure 2d). In addition, they reported a linear relationship between the photoacoustic response and the particle concentration. A subsequent evaluation of the agglomeration and stability of the photoacoustic contrast agent proved its suitability as a biological contrast agent. In addition, it was confirmed that the cells were biocompatible as a result of treatment with 5–100 μg/mL of NPs.
Guo et al. developed contrast agent NPs using a conjugated polymer [43]. Benzodithiophene (BDT), which has a large extinction coefficient with a symmetrical and planar structure, was reacted with benzobisthiadiazole (BBT) to form P1 (Figure 2e). The resulting P1 NPs were then added to 1,2-distearoyl-sn-glycero-3-phosphoethanolamine-N-[amino(polyethylene glycol)-2000] (DSPE-PEG2000) to impart water dispersibility. The resulting manufactured NPs exhibited a wide absorption range from the NIR I to the NIR II region (740–1210 nm) with an absorption peak at 1064 nm (Figure 2f). They also confirmed that a wavelength of 1064 nm was effective in penetrating the skull, with background interference using this wavelength the lowest for the target tumor (Figure 2g,h). In addition, there was no significant change in the biochemical index, which was confirmed with H&E staining after the injection of the NPs at a concentration 10 times higher than that used for contrast imaging. There was no abnormality as a result of in vitro toxicity test, and additionally, it was confirmed that there were no special abnormalities as a result of in vivo H&E staining.
Zhu et al. developed contrast agent NPs using 1,2-distearoyl-sn-glycero-3-phosphoethanolamine-N-[methoxy(polyethylene glycol)-2000] (DSPE-mPEG2000), octyl 4,6-dibromothieno [3,4-b]thiophene-2-carboxylate (TT) and 3,6-bis(5-bromothiophen-2-yl)-2,5-bis(2-ethylhexyl)pyrrolo[3,4-c]pyrrole-1,4(2H,5H)-dione (DPP) [39]. They conjugated DSPE-mPEG2000 with TT or DPP to form P-TT and P-DPP, respectively. The average size of these particles was 80–100 nm (Figure 2i), and the absorption wavelength was 686 nm for P-TT and 763 nm for P-DPP (Figure 2j). They confirmed successful PA contrast at 680–900 nm. They also conducted in vivo PA imaging in the liver of mice (Figure 2k). After 2 weeks of observation after injecting NPs into mice, there were no specific abnormalities.
Shi et al. created water-soluble conjugated polymer (WSCP) dots using the self-assembly of DPP-mPEG and DPP-mPEG-2Br with sonication [44]. The size of the WSCP dots was ~16 nm, and their absorption peak was in the 700–800 nm range (Figure 2l). They were injected into a mouse for PA imaging of a tumor (Figure 2m). After injection, the intensity of the PA images continued to increase until 4 h and then weakened thereafter (Figure 2n). In addition, as a result of weight measurement after injecting WSCP dots into mice, it was confirmed that the particles were biocompatible.
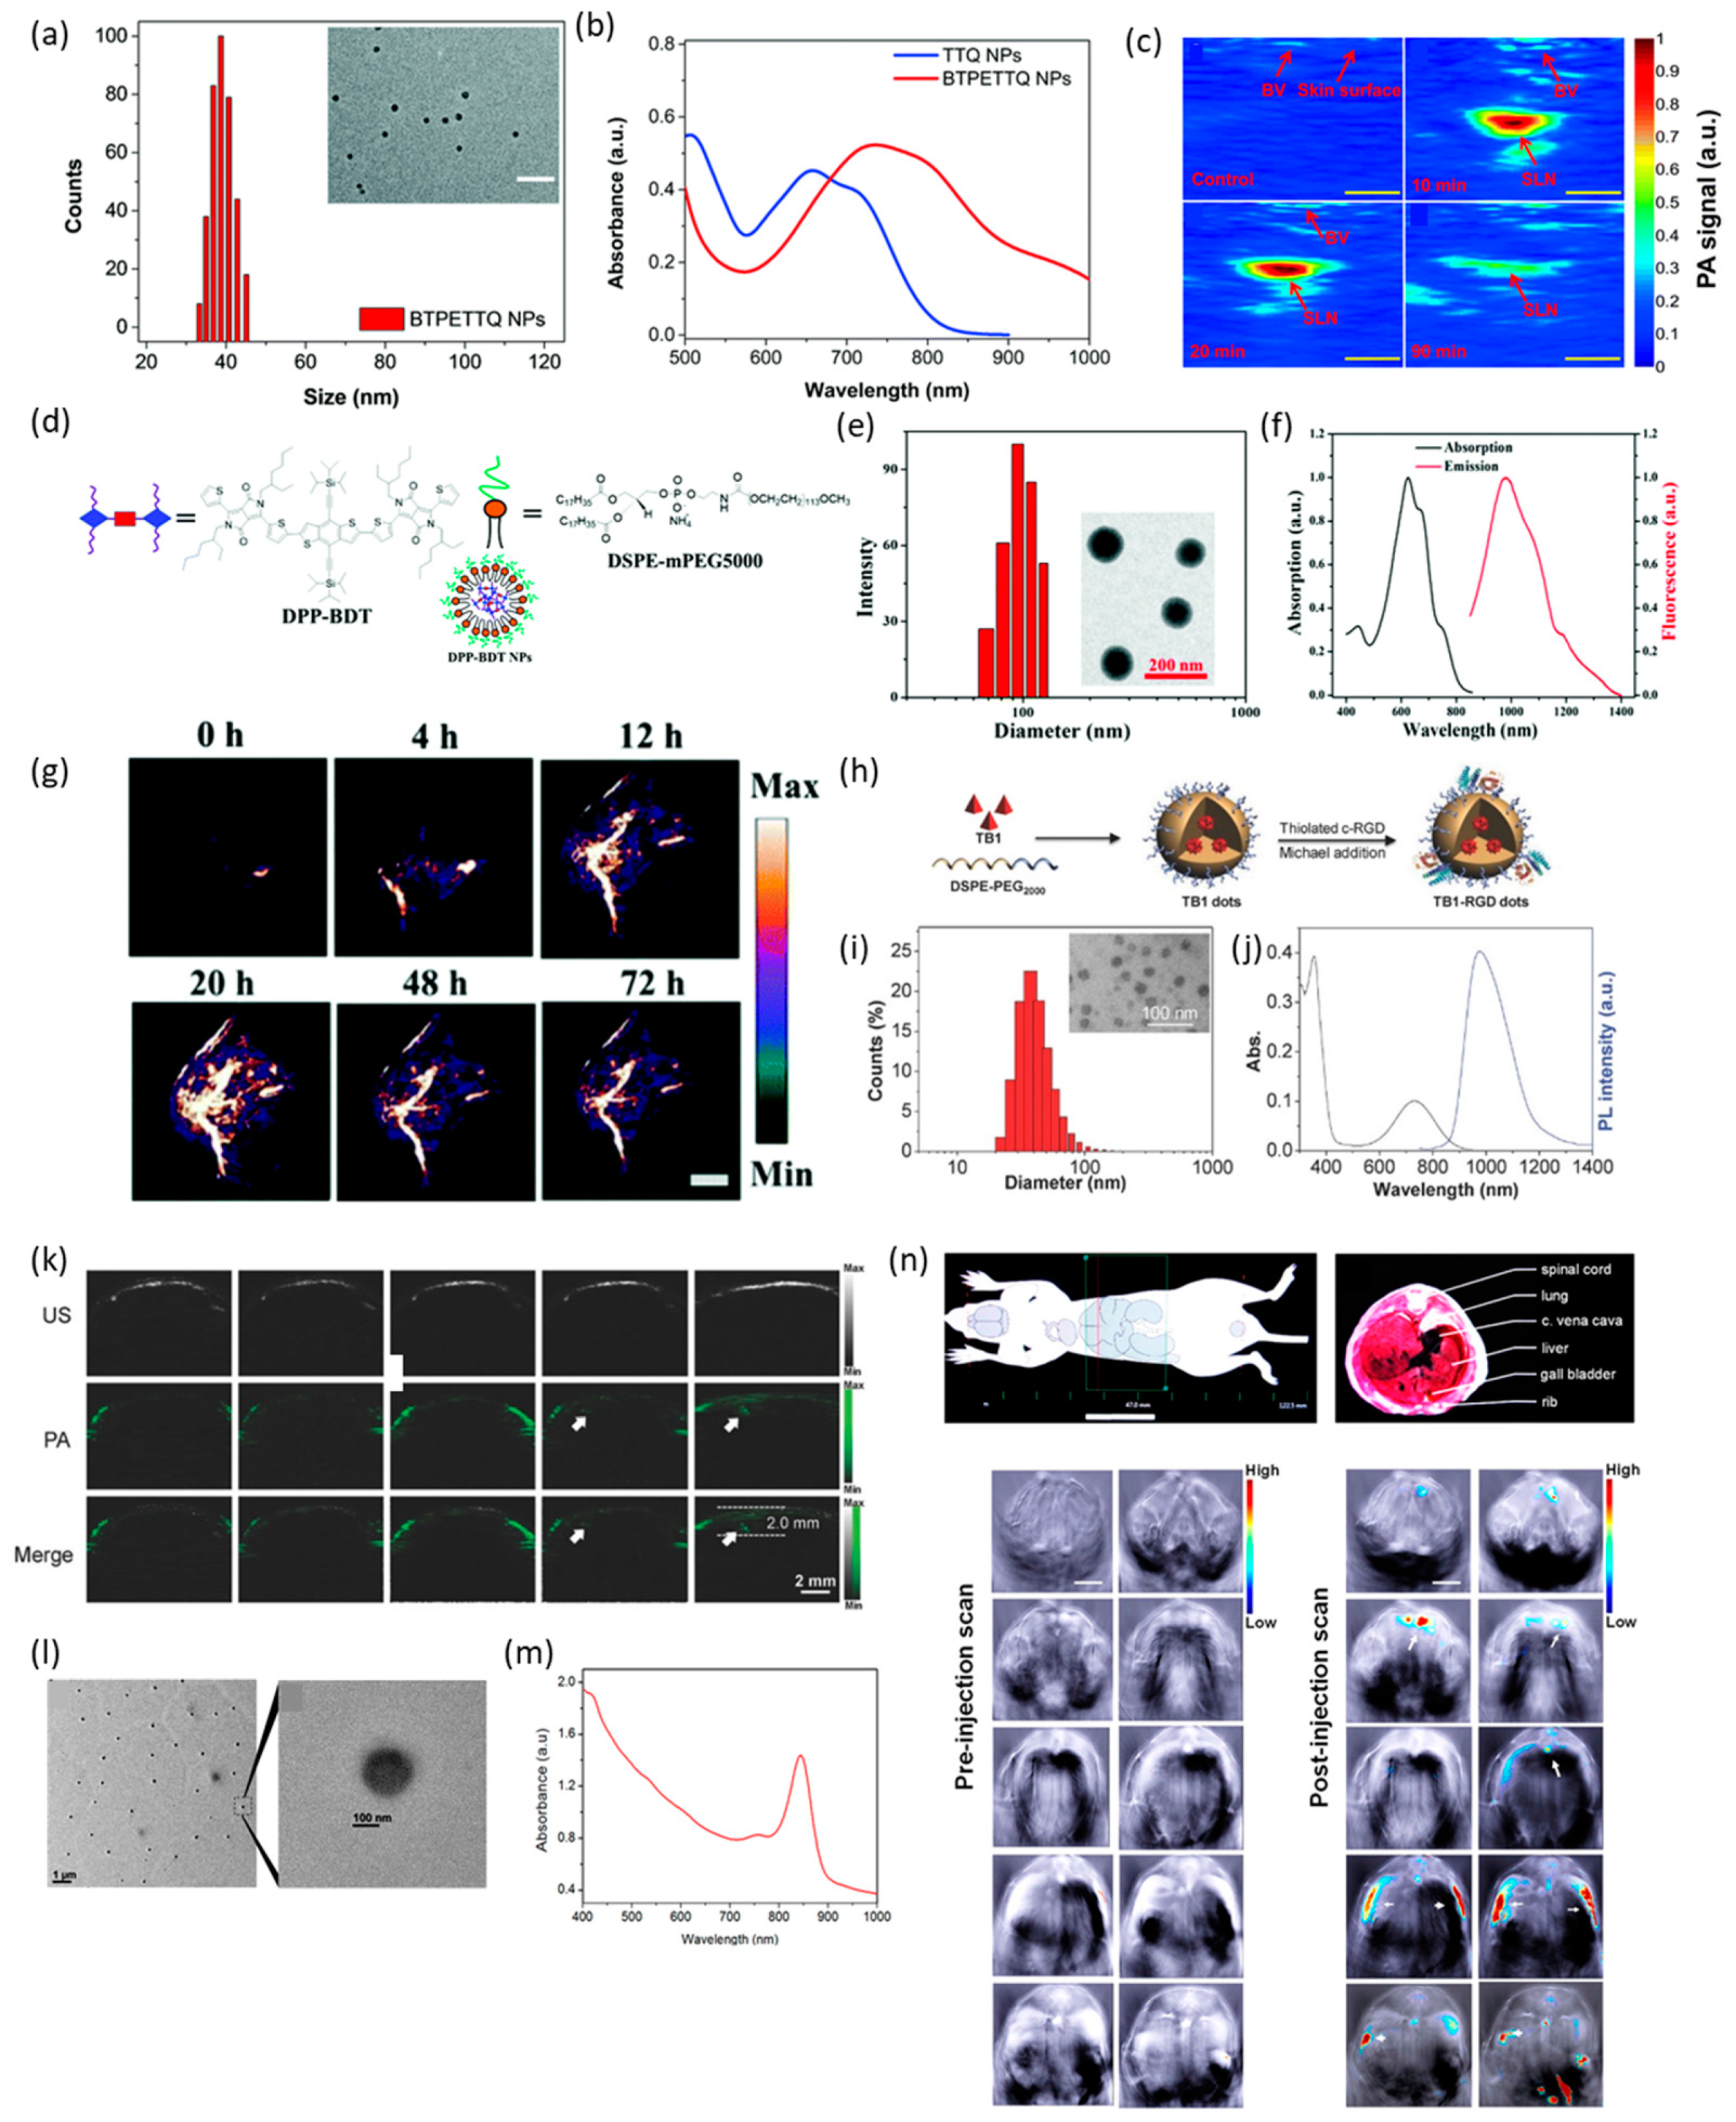
Cai et al. developed contrast NPs (BTPETTQ) that were prepared via the titration of DSPE-PEG200 into a D-A-D polymer, which has a propeller structure created by reacting 1-(4-(4,4,5,5-tetramethyl-1,3,2-dioxaborolan-2-yl)phenyl)-1,2,2-triphenylethylene (as a donor) and 4,9-Bis(5-bromothiophen-2-yl)-6,7-bis(4-(hexyloxy)phenyl)-[1,2,5]thiadiazolo[3,4-g]quinoxaline (TTQ) (as an acceptor) [45]. The BTPETTQ NPs had a size of ~40 nm and exhibited a broad peak at 550–1000 nm with peak absorption at 724 nm (Figure 3a,b). The PA signal from the BTPETTQ NPs was superior to that of gold nanorods (AuNRs) of the same mass (Figure 3c). In addition, it was confirmed that cytotoxicity did not appear up to 15 μg/mL.
Wang et al. developed a diketopyrrolopyrrole–benzodithiophene (DPP-BDT) conjugate dye with an absorption wavelength in the NIR II range. They conjugated DPP, a strong electron acceptor, with BDT, an electron donor and encapsulated the resulting DPP-BDT in DSPE-mPEG500 NPs (Figure 3d) [46]. The size of the NPs was about 90 nm, and the absorption peaks were observed at 625 nm, 667 nm and 750 nm (Figure 3e,f). In vivo PA imaging was conducted for HeLa tumor-bearing mice. The PA signal intensity increased from 4 h after the injection and peaked at 20 h (Figure 3g). Additionally, biocompatibility was added through PEGylation, and it was confirmed that there was no toxicity up to 25 μg/mL through MTT assay.
Sheng et al. created D-A-shaped dots by conjugating benzobisthiadiazole (BBT), a strong electron acceptor and N,N-diphenyl-4-(1,2,2-triphenylvinyl)aniline (DPTPEA), an electron donor [47]. The resulting conjugated polymer (TB1) was wrapped with DSPE-PEG2000 and the cyclo(Arg-Gly-Asp-D-Phe-Lys(mpa)) peptide (c-RGD) was covalently attached (Figure 3h). The size of the TB1-RGD dots was about 36–41 nm, and the absorption peak was at 740 nm (Figure 3i,j). PA imaging of a brain tumor in vivo showed that the signal became observable 6 h after injection, and PA imaging remained possible after 24 h. The tumor PA signals reached the maxima in 6h and tumor regions as deep as 2.0mm were able to be imaged (Figure 3k). In addition, TB1-RGD dots showed a hemolysis rate of less than 1% up to 400 μg/mL.
Sreejith et al. developed a micelle form of a contrast agent encapsulating squaraine dye (D1) using a nonionic surfactant (Plkuoronic F-127) which is known as biocompatible polymer [48]. The size of the D1-encapsulated micelles was about 70–130 nm, with a broad peak at 800–900 nm and the strongest signal at 840 nm (Figure 3l,m). In addition, PA signals were observed 35 min after injection in individual anatomy sections for in vivo PA imaging (Figure 3n).
3.2. Inorganic PA Contrast Agents
Noble-metal-based NPs are widely used as PA contrast agents due to their strong and tunable light absorption via surface plasmon resonance (SPR). In SPR, the free charge on the surface of precious-metal NPs vibrates with the electromagnetic field, causing light absorption that is 4–5 times higher than that of the dye, resulting in an intense PA effect and high photothermal conversion efficiency [49,50,51,52]. The most commonly used metallic PA contrast agent is gold [53,54]. Various types of gold NP have been developed for the acquirement of PA images targeting specific diseases. [55,56,57,58,59,60,61]. Other metals such as platinum and silver have also been investigated for use in PA imaging [50,62,63,64,65]. In this section, we review previously reported metallic PA contrast agents with high absorption due to SPR.
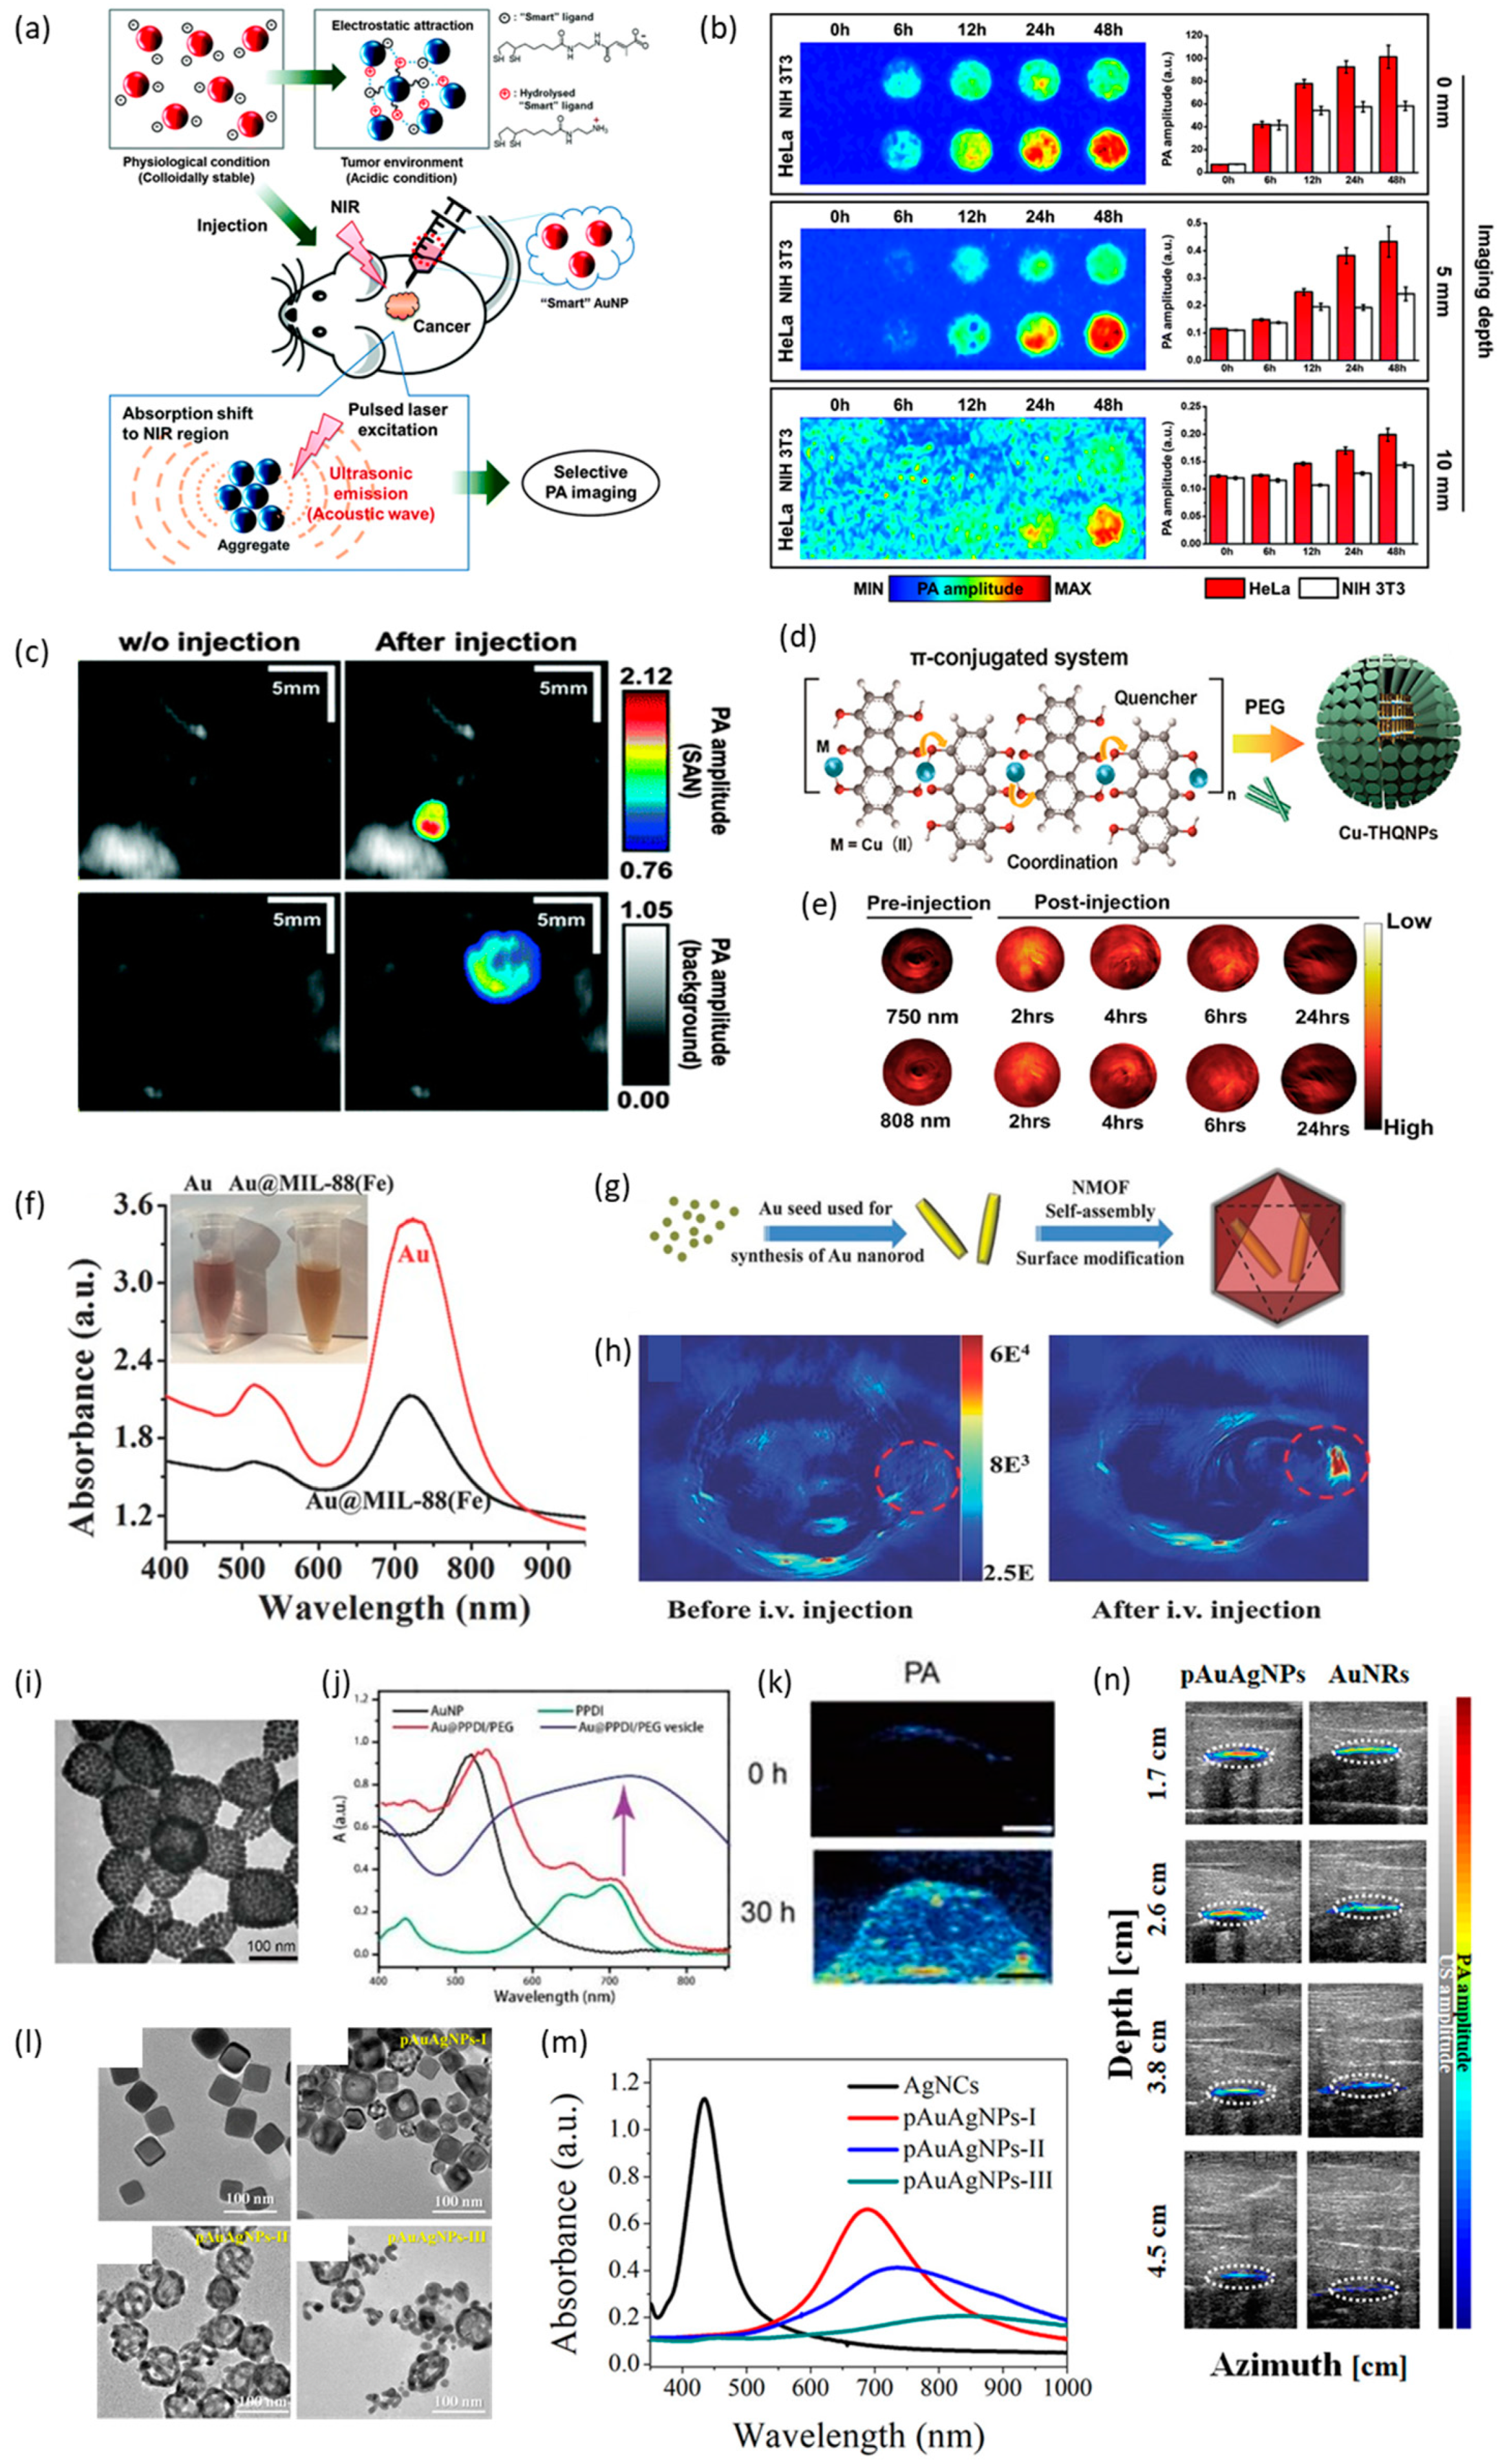
Song et al. developed smart AuNPs (SANs), which have pH-responsive citraconic amides as surface ligands, leading to aggregation at a low pH (Figure 4a) [66]. Since cancer creates acidic conditions, the aggregation of SANs occurs when they reach the cancerous area. These aggregated SANs have an absorbance of about 680 nm, which enables PA imaging to take place. PA imaging was conducted in vitro using HeLa cells (Figure 4b), and a sufficient PA signal was detected 12 h after the application of the SANs, with the strongest signal detected after 24 h. PA imaging was also conducted in vivo (Figure 4c). Since tumors create acidic conditions, the aggregation of SANs continued in the tumor, resulting in more intense PA signals.
Zhang et al. developed Cu-THQNPs that disassemble in acidic conditions [67]. CuCl2 (pH 7.4) was first combined with THQ through C-OH/C=O and Cu(II) coordinate covalent bonds in a mixed solution of deionized water and ethanol at a volume ratio of 2:1. After stirring for 1 h, the product was centrifuged and modified with polyethylene glycol-amine (PEG-(NH2)2) to improve its water stability (Figure 4d). PA imaging was conducted in vivo for 24 h after injection of the Cu-THQNPs (Figure 4e). Since cancer is acidic, disassembly occurred, resulting in the release of Cu and intense PA signals for 2–4 h. In addition, there is no cytotoxicity up to a concentration of 0.012 mg/mL.
Shang et al. developed low-cytotoxicity AuNRs with cetyltrimethylammonium bromide (CTAB) ligands on the surface [68]. In these NRs, 11-mercaptoundecanoic acid (MUA) molecules were substituted to modification. MUA molecules provide a COOH terminal and remove the cytotoxicity of CTAB. A metal–organic framework (MOF) crystal was then grown by encapsulating the AuNRs with the COOH terminal as the core using an ionic liquid/microemulsion (AU@MIL-88(Fe)) (Figure 4g). The crystal had a size of ~89 nm and a UV absorbance peak at 720 nm (Figure 4f). PA imaging in mouse tumors was performed with Au@MIL-88(Fe), and PA imaging 12 h after i.v. injection exhibited a higher intensity PA signal (Figure 4h). In addition, it was confirmed that there is no cytotoxicity up to a concentration of 400 nM.
Yang et al. created semiconducting plasmonic vesicles by grafting high-density poly (PPDI) and PEG onto AuNPs (AU@PPDI/PEG) [69]. AU@PPDI/PEG nanovesicles were created via self-assembly with thin-film rehydration [63,64]. The particle size was ~95 nm, and the UV absorption peak was strongest at around 700 nm (Figure 4i,j). As a result of in vivo PA imaging after i.v. injection, it was confirmed that PA intensity was highest after 30 h (Figure 4k). In addition, AuNPs (AU@PPDI/PEG) itself were not toxic via H&E staining.
Lee et al. developed colloidal porous alloyed AuAg NPs (pAuAgNPs) [70]. A galvanic replacement reaction involving silver nanocubes (AgNCs) was conducted with the slow addition of HAuCl4 to an aqueous polyvinylpyrrolidone (PVP) solution, which transformed the AgNCs into pAuAgNPs. The size of the particles was approximately 25–75 nm (Figure 4l). It was found that the higher the Au content, the lower the peak’s height (Figure 4m). PA imaging was performed in vivo using pAuAg NPs. It was confirmed that PA imaging at a depth of 4.5 cm was possible for pAuAgNPs but not for AuNRs, which are a well-known PA contrast agent (Figure 4n). In addition, the intensity of the PA imaging was 2.7 times stronger than that with AuNRs. When the pAuAgNPs were coated with a silica layer, the signal increased 1.8-fold compared to pAuAgNPs without the coating. In addition, as a result of testing for pAuAgNPs at concentrations of 2.5, 5 and 10 nM, cell viability was shown around 85–90%.
4. Application of PA Contrast Agents
4.1. Theragnosis
Previously, various organic and inorganic PA contrast agents were reviewed. There are several applications for using a PA contrast agent [71,72,73,74]. Theragnosis, which is a combination of “therapy” and “diagnosis” [75,76], refers to simultaneous diagnosis and treatment. In recent years, theragnosis using PA imaging and various cancer therapies, including photothermal therapy [77,78,79], chemotherapy [80,81,82], photodynamic therapy [83,84,85], sonodynamic therapy [86,87,88] and a combination of therapies [60,89,90,91], have been actively investigated. Photoacoustic contrast NPs can be used in therapeutic applications by adding organic or inorganic materials that increase the targeting ability, hydrophilicity and biocompatibility of the NPs [92,93,94,95]. This section summarizes the use of organic and inorganic PA contrast agents in PA imaging in conjunction with therapeutic applications.
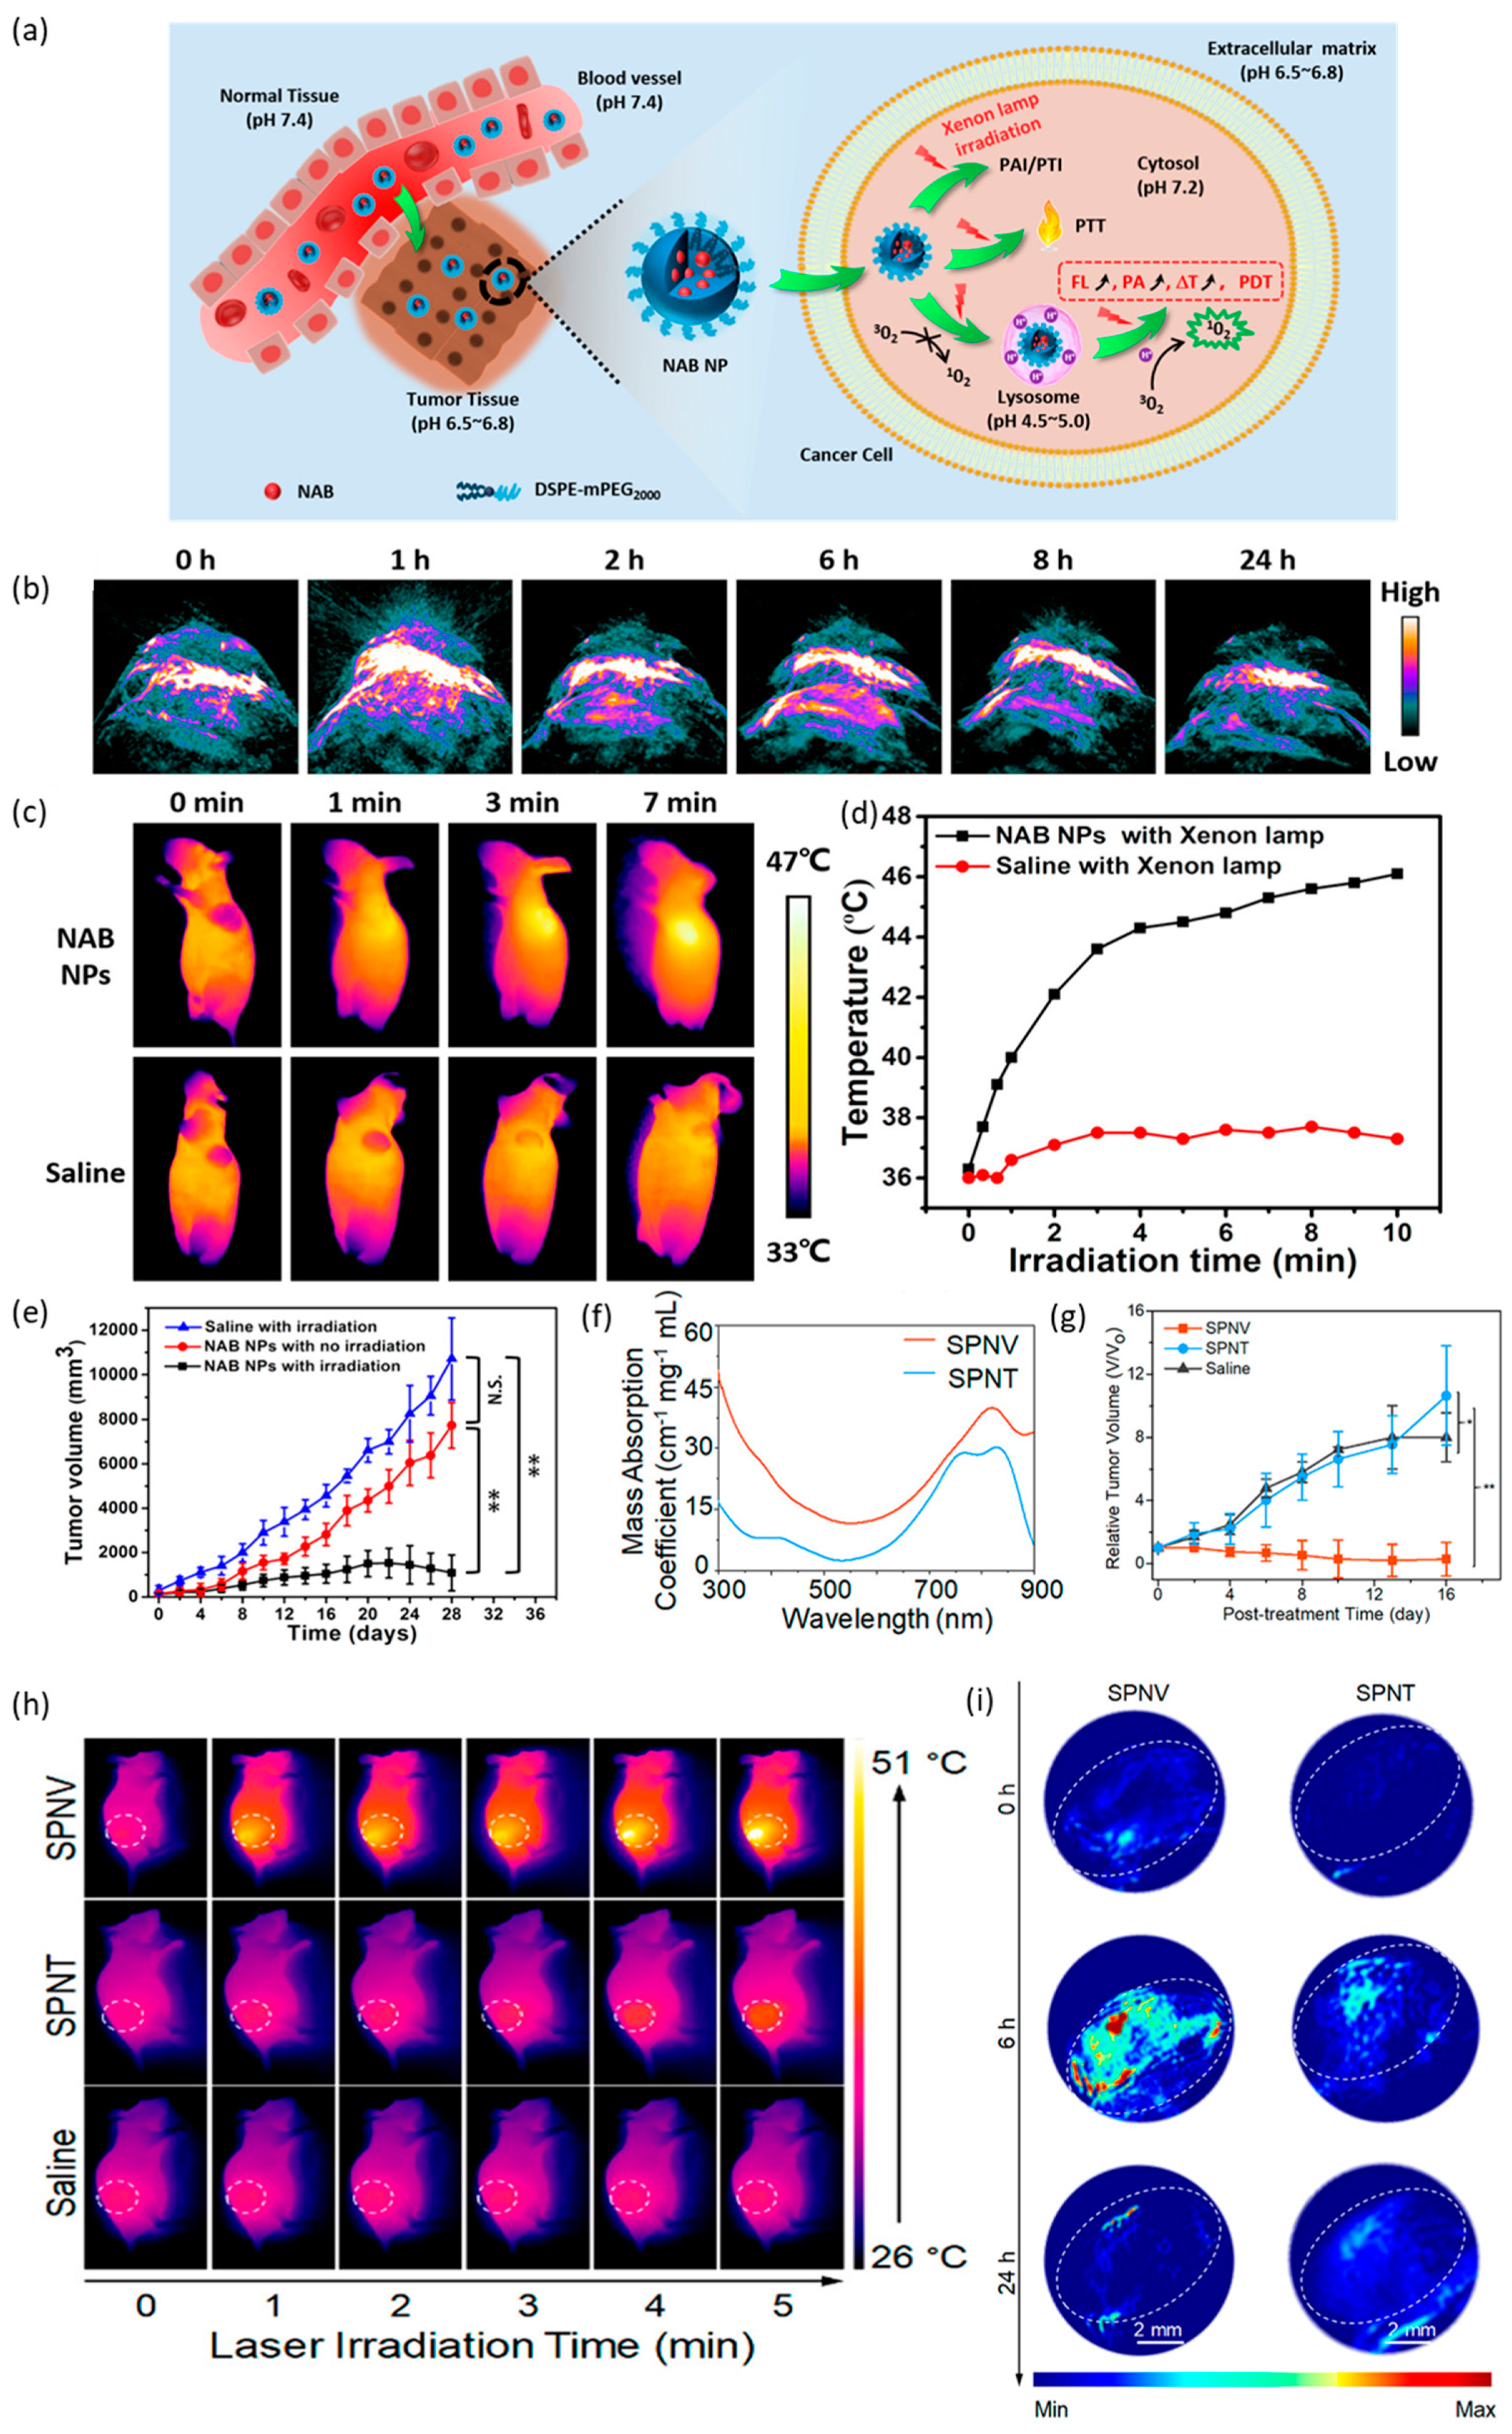
Tang et al. developed a pH-sensitive photosensitizer by introducing a pH-sensitive receptor to the aza-BODIPY core (NAB) for PA and photothermal imaging and for photothermal and photodynamic therapy (PTT and PDT, respectively) (Figure 5a) [96]. The hydrophobic NAB was then enveloped with DSPE-mPEG2000 to hydrate the compound. The size of the particles was ~30 nm, with an absorption peak at 792 nm, thus making PA imaging with NAB NPs possible (Figure 5b). NAB NPs are pH-sensitive and activated in a weakly acidic environment, with the received light generating reactive oxygen species.
Photothermal imaging was also possible with NAB NPs (Figure 5c,d), meaning PDT could be conducted in acidic cancerous regions. As a result, following the i.v. injection of NAB NPs into mice, PA imaging of tumors was possible while PDT was also carried out, leading to a significant reduction in the tumor volume compared to other groups (Figure 5e). In addition, it was confirmed that there is almost no cytotoxicity up to the 130 μM concentration of NAB NPs.
Lyu et al. performed both PA imaging and PTT using semiconducting polymer NPs (SPNs) [97]. First, SPNs was fabricated using by two biodegradable semiconducting polymers, poly{2,2′-[(2,5-bis(2-hexyldecyl)-3,6-dioxo-2,3,5,6-tetrahydropyrrolo[3,4-c]pyrrole-1,4-diyl)-dithiophene]-5,5′-diyl-alt-vinylene} (DPPV) and poly{2,2′-[(2,5-bis(2-hexyldecyl)-3,6-dioxo-2,3,5,6-tetrahydropyrrolo[3,4-c]pyrrole-1,4-diyl)-dithiophene]-5,5′-diyl-alt-thiophene-2,5-diyl} (DPPT). To render them water-soluble, they were conjugated using PLGA-PEG and a self-assembly method to produce SPNV and SPNT, respectively. The size of these particles was ~36 nm, and both particles had broad absorption peaks ranging from 600 to 900 nm (Figure 5f). SPNV had the highest absorption peak at 819 nm, while that for SPNT was at 828 nm. It was found that the intensity of PA and PT imaging was strong only for SPNV (Figure 5h,i). In addition, following irradiation, SPNV had significant therapeutic efficacy in decreasing the volume of a tumor (Figure 5g). Finally, there is no cytotoxicity up to 150 μg/mL for SPNV and SPNT.
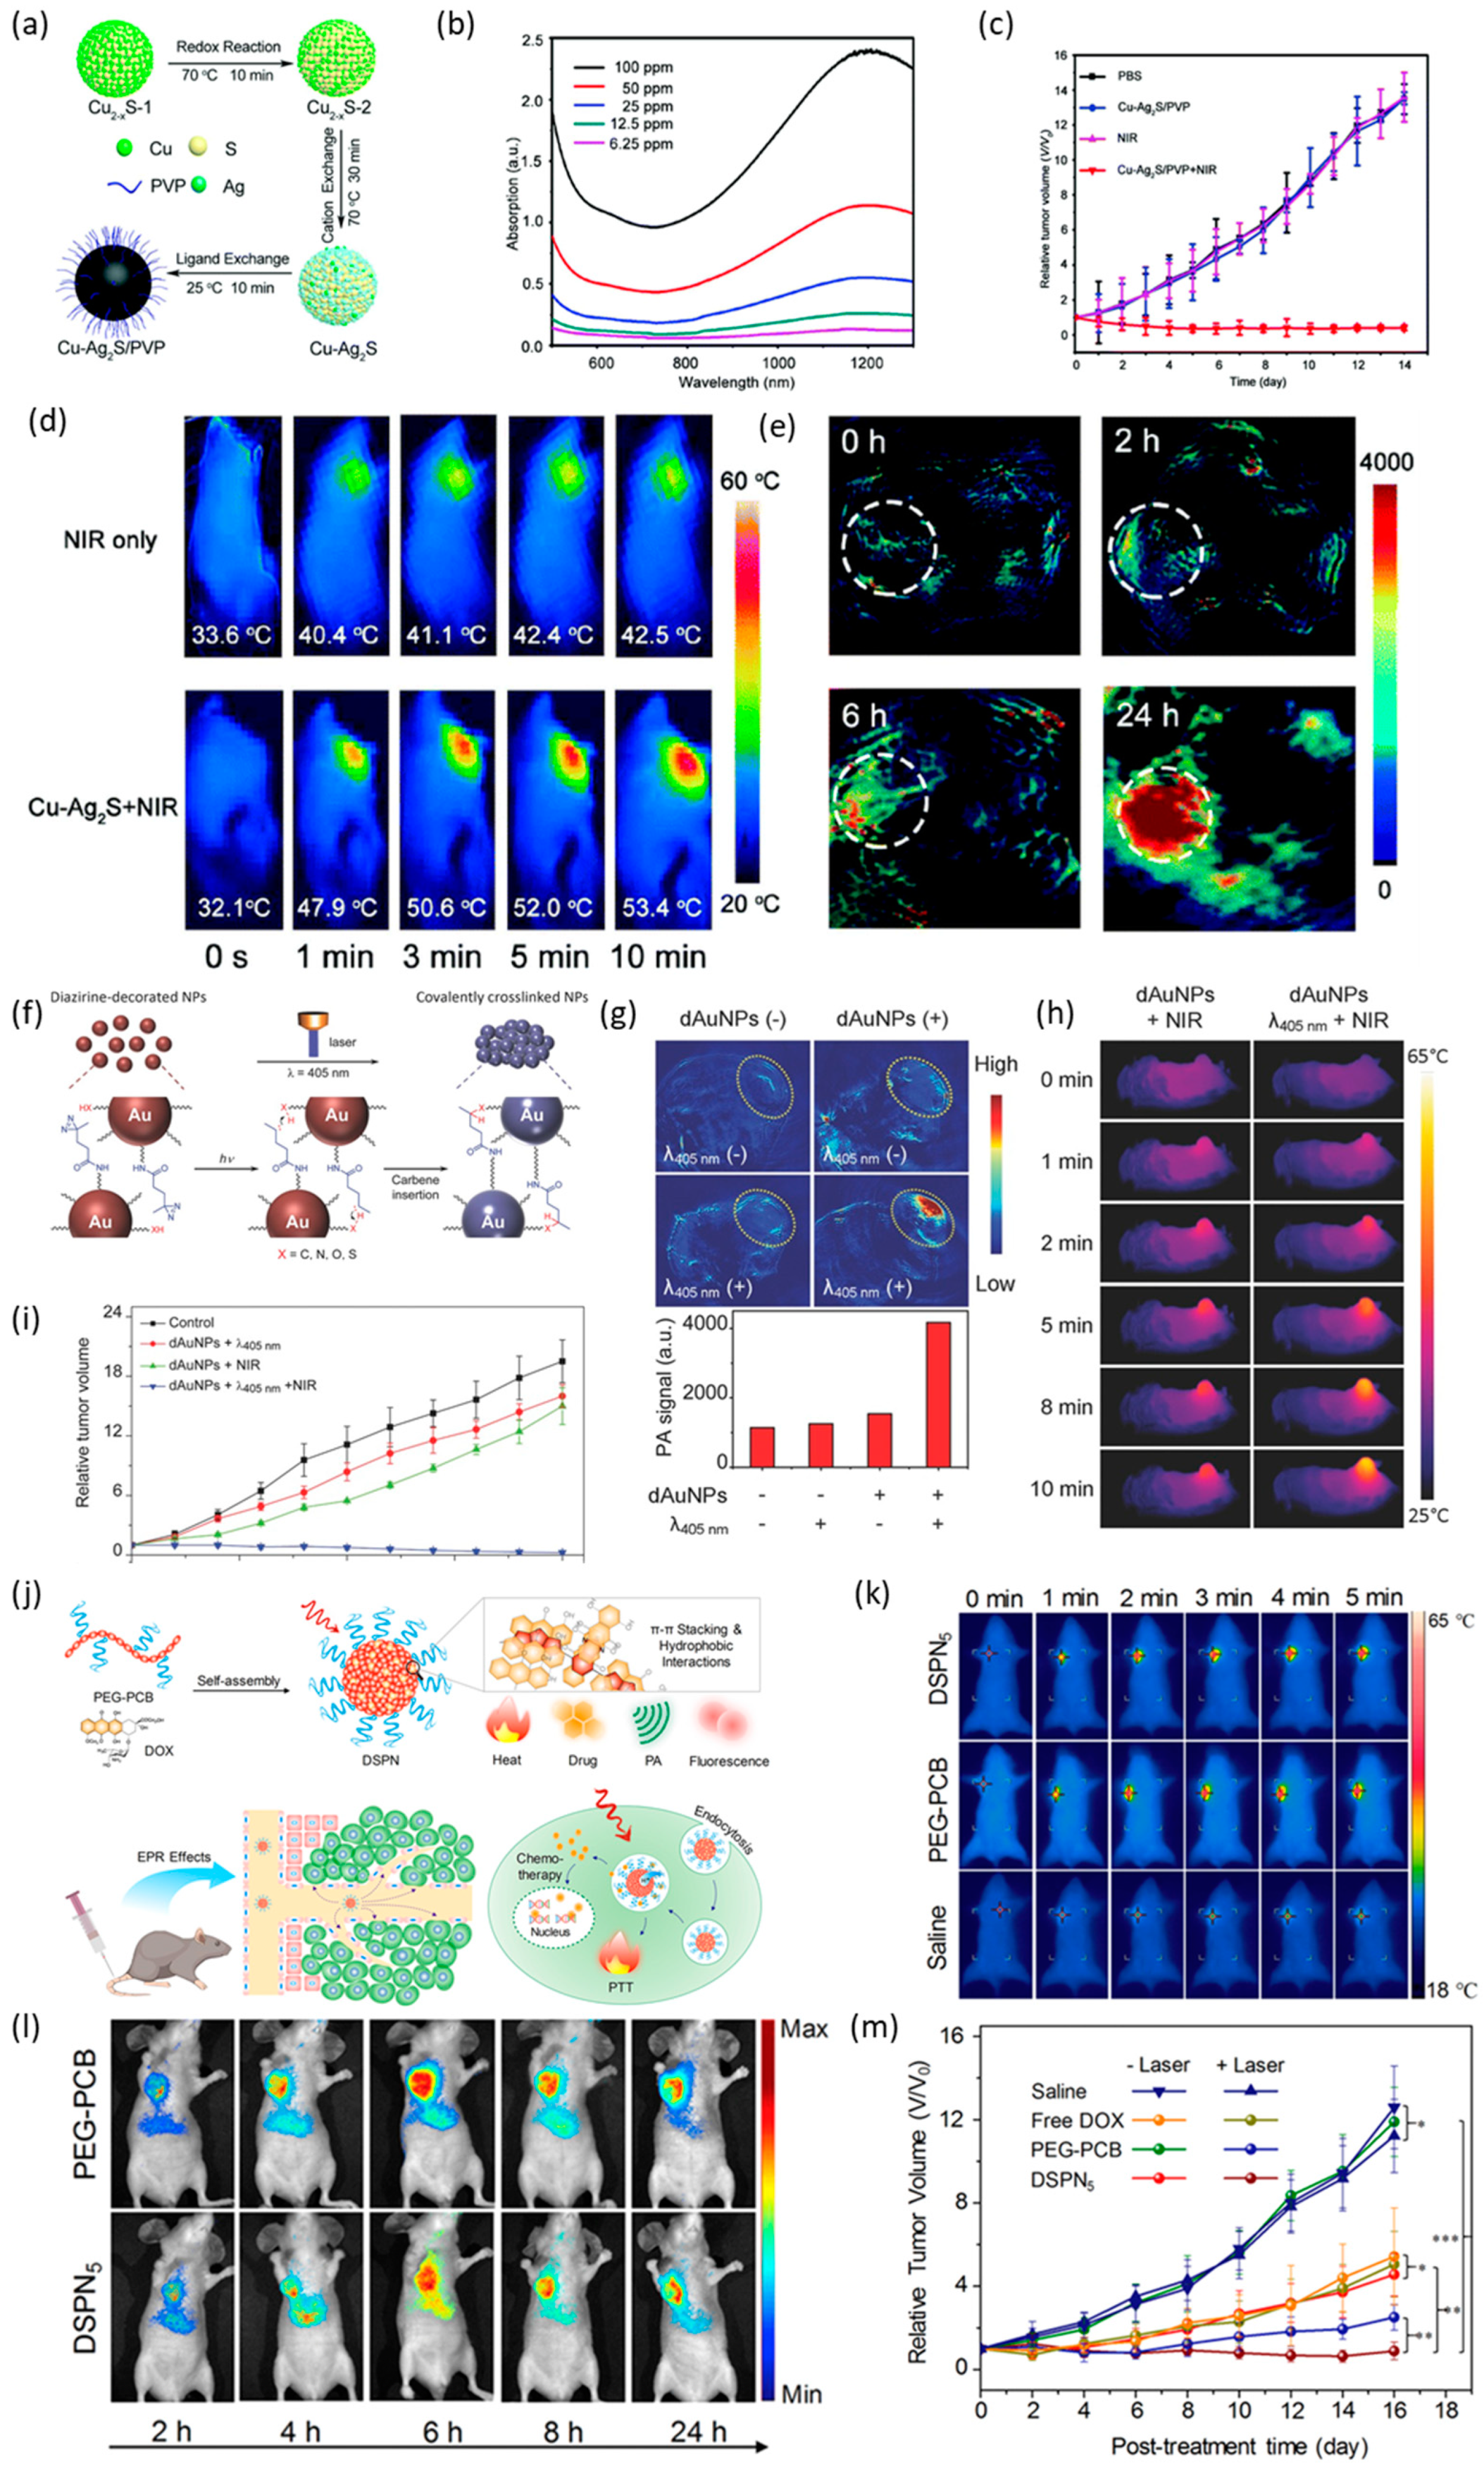
Dong et al. developed Cu-Ag2S NPs, which were capable of both PA imaging and PTT [98]. The Cu-Ag2S NPs were coated with polyvinylpyrrolidone to produce Cu-Ag2S/PVP NPs (Figure 6a). The average diameter of these particles was 8.6 nm, with a wide NIR absorption peak (Figure 6b). They had a higher photothermal conversion efficiency (58.2%) than most PTT formulations. In addition, these particles readily accumulated in a tumor via the permeability and retention (EPR) effect due to their good dispersibility. Therefore, it was confirmed that the PA imaging and PTT of a tumor was possible using Cu-Ag2S/PVP NPs and photothermal therapy simultaneously (Figure 6d,e). PA imaging revealed a slight change starting at 2 h, with a high-intensity PA signal observed after 24 h. In terms of photothermal therapy, it was shown that the temperature increased for 10 min within the tumor. As a result, the size of the tumor decreased significantly compared to other groups (Figure 6c). In addition, up to 200 ppm of Cu concentration, more than 80% cell viability was shown.
AuNPs have also been proposed for use in PTT and PA imaging [99]. However, only spherical AuNPs larger than 50 nm had a sufficiently strong NIR absorbance for PA imaging and PTT. Therefore, there have been various attempts to strengthen the NIR absorbance or to increase the biocompatibility. For example, Cheng et al. created unstable AuNPs by introducing a diazirine (DA) terminal group of PEG5000 (polyethylene glycol, Mn = 5000) to the surface of the AuNPs (dAuNPs) (Figure 6f) [100]. When these unstable AuNPs were subjected to a 405-nm laser, covalently crosslinked particle aggregation occurred. Using this principle, a tumor was irradiated with the 405-nm laser to selectively cause aggregation of the NPs. It was confirmed that the PA intensity in the tumor region was much higher following irradiation with the 405-nm laser than when irradiation was not employed (Figure 6g). PTT was verified by measuring the increase in temperature for 10 min when irradiated with the 405-nm laser, with the tumor volume decreasing over time (Figure 6h,i). As a result of observation at 24 h and 48 h after treatment with dAuAPs, the cell viability was more than 80% up to 200 μg/mL.
In addition to the studies that have combined PA imaging with a single therapy, research has also been actively conducted in which drugs are loaded into NPs for PTT/PDT and chemotherapy. For example, Jiang et al. developed PEG-PCB NPs with a load of the anti-cancer drug doxorubicin (DOX) (Figure 6j) [101]. By attaching poly(cyclopentadithiophene-alt-benzothiadiazole) (PCB) and amphiphilic PEG, semiconducting PEG-PCB NPs were fabricated via self-assembly. At this time, DOX was added to the self-assembly process. The size of the DOX-loaded PEG-PCB particles (DSPNs) was 40–100 nm, which was sufficient to induce the EPR effect and thus allow more i.v. injected DSPNs to be accumulated in the tumor, resulting in a stronger signal of fluorescence imaging (Figure 6l). Chemotherapy and PTT were also possible with exposure of the DSPNs to an external laser, leading to the suppression of tumor growth (Figure 6k,m).
4.2. Sensing of pH, Hypoxia and Metal Ions
In the human body, pH is regulated by homeostasis. A change in the pH can affect the charge of proteins and other polymers, which can have critical effects. Indeed, changes in pH have been linked to several diseases such as tumors [102] and hyperventilation [103]. For this reason, imaging changes in pH within the body is very important.
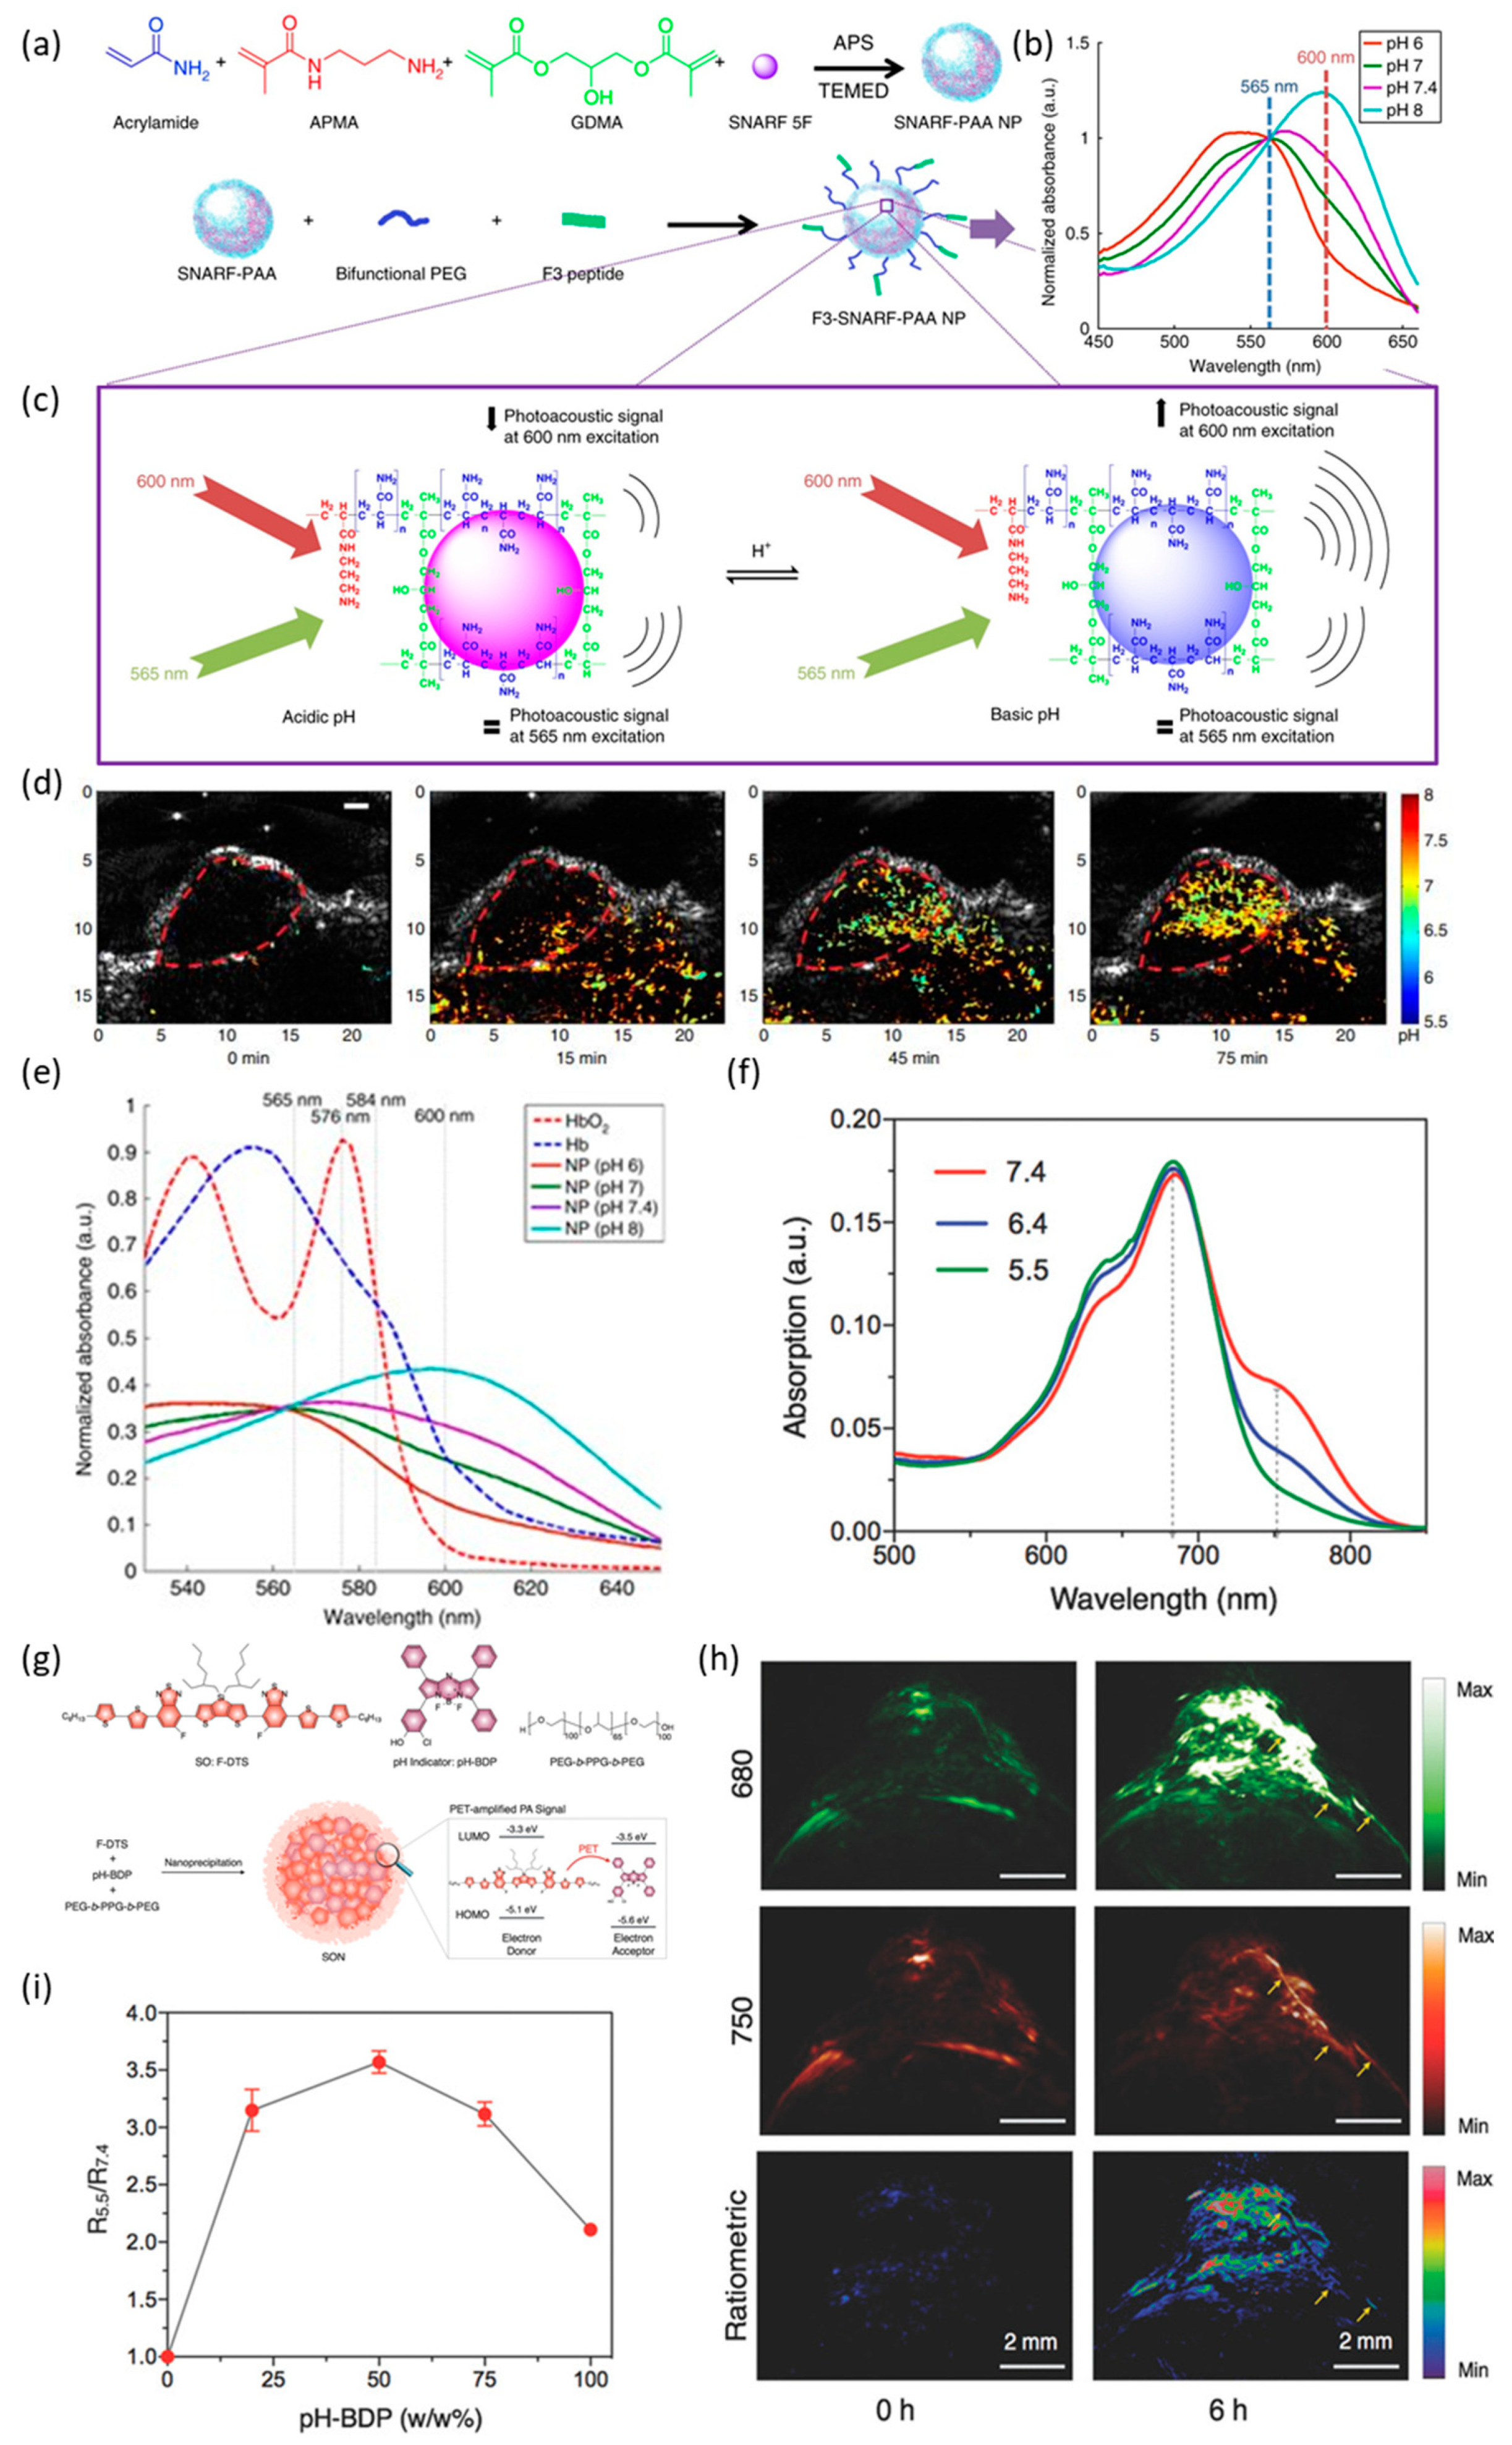
Jo et al. developed a pH-sensing nanoprobe and multi-wavelength PA imaging system for pH imaging that was not affected by the background light absorption of hemoglobin [104]. The commercially available optical pH indicator SNARF-5F was encapsulated in polyacrylamide to create pH-sensitive SNARF-PAA NPs (Figure 7a). The SNARF-PAA NPs did not interact with external molecules and protected the pH indicator, thus allowing the targeting of cancer tumors and avoiding the immune system. When the SNARF-PAA NPs detected a difference in pH, they adapted to the pH environment within a few seconds, resulting in a change in their absorption spectrum (Figure 7b,c). These absorption peaks for the SNARF-PAA NPs associated with pH did not overlap with the absorption peaks for HbO2 and Hb (Figure 7e). Tumors were observed by US imaging and PA imaging following the injection of the SNARF-PAA NPs. US imaging allowed the boundaries of the tumor to be defined. Since the SNARF-PAA NPs exhibited a different absorption spectrum with a difference in pH, the pH distribution in the tumor region could be determined using PA imaging (Figure 7d). The pH varied from 6.72 ± 0.29 to 6.97 ± 0.35, decreasing with the depth of the tumor.
Miao et al. developed SON particles synthesized using a semiconductor oligomer (SO), a BODIPY dye that acts as a PA enhancer and a pH indicator, and an amphiphilic triblock copolymer (PEG-b-PPG-b-PEG) (Figure 7g) [105]. These SONs exhibited an absorption peak at 680 nm regardless of the pH. However, the absorption at 750 nm differed according to the pH (Figure 7f). The size of the SONs was ~8.5 nm. pH imaging was performed on a HeLa tumor in vivo (Figure 7h). As a result of imaging the tumor 6 h after the injection of SONs, it was possible to determine the pH in the tumor as a ratio (Figure 7i). In addition, cytotoxicity was not confirmed when 30 μg/mL was treated on HeLa Cells for 24 h.
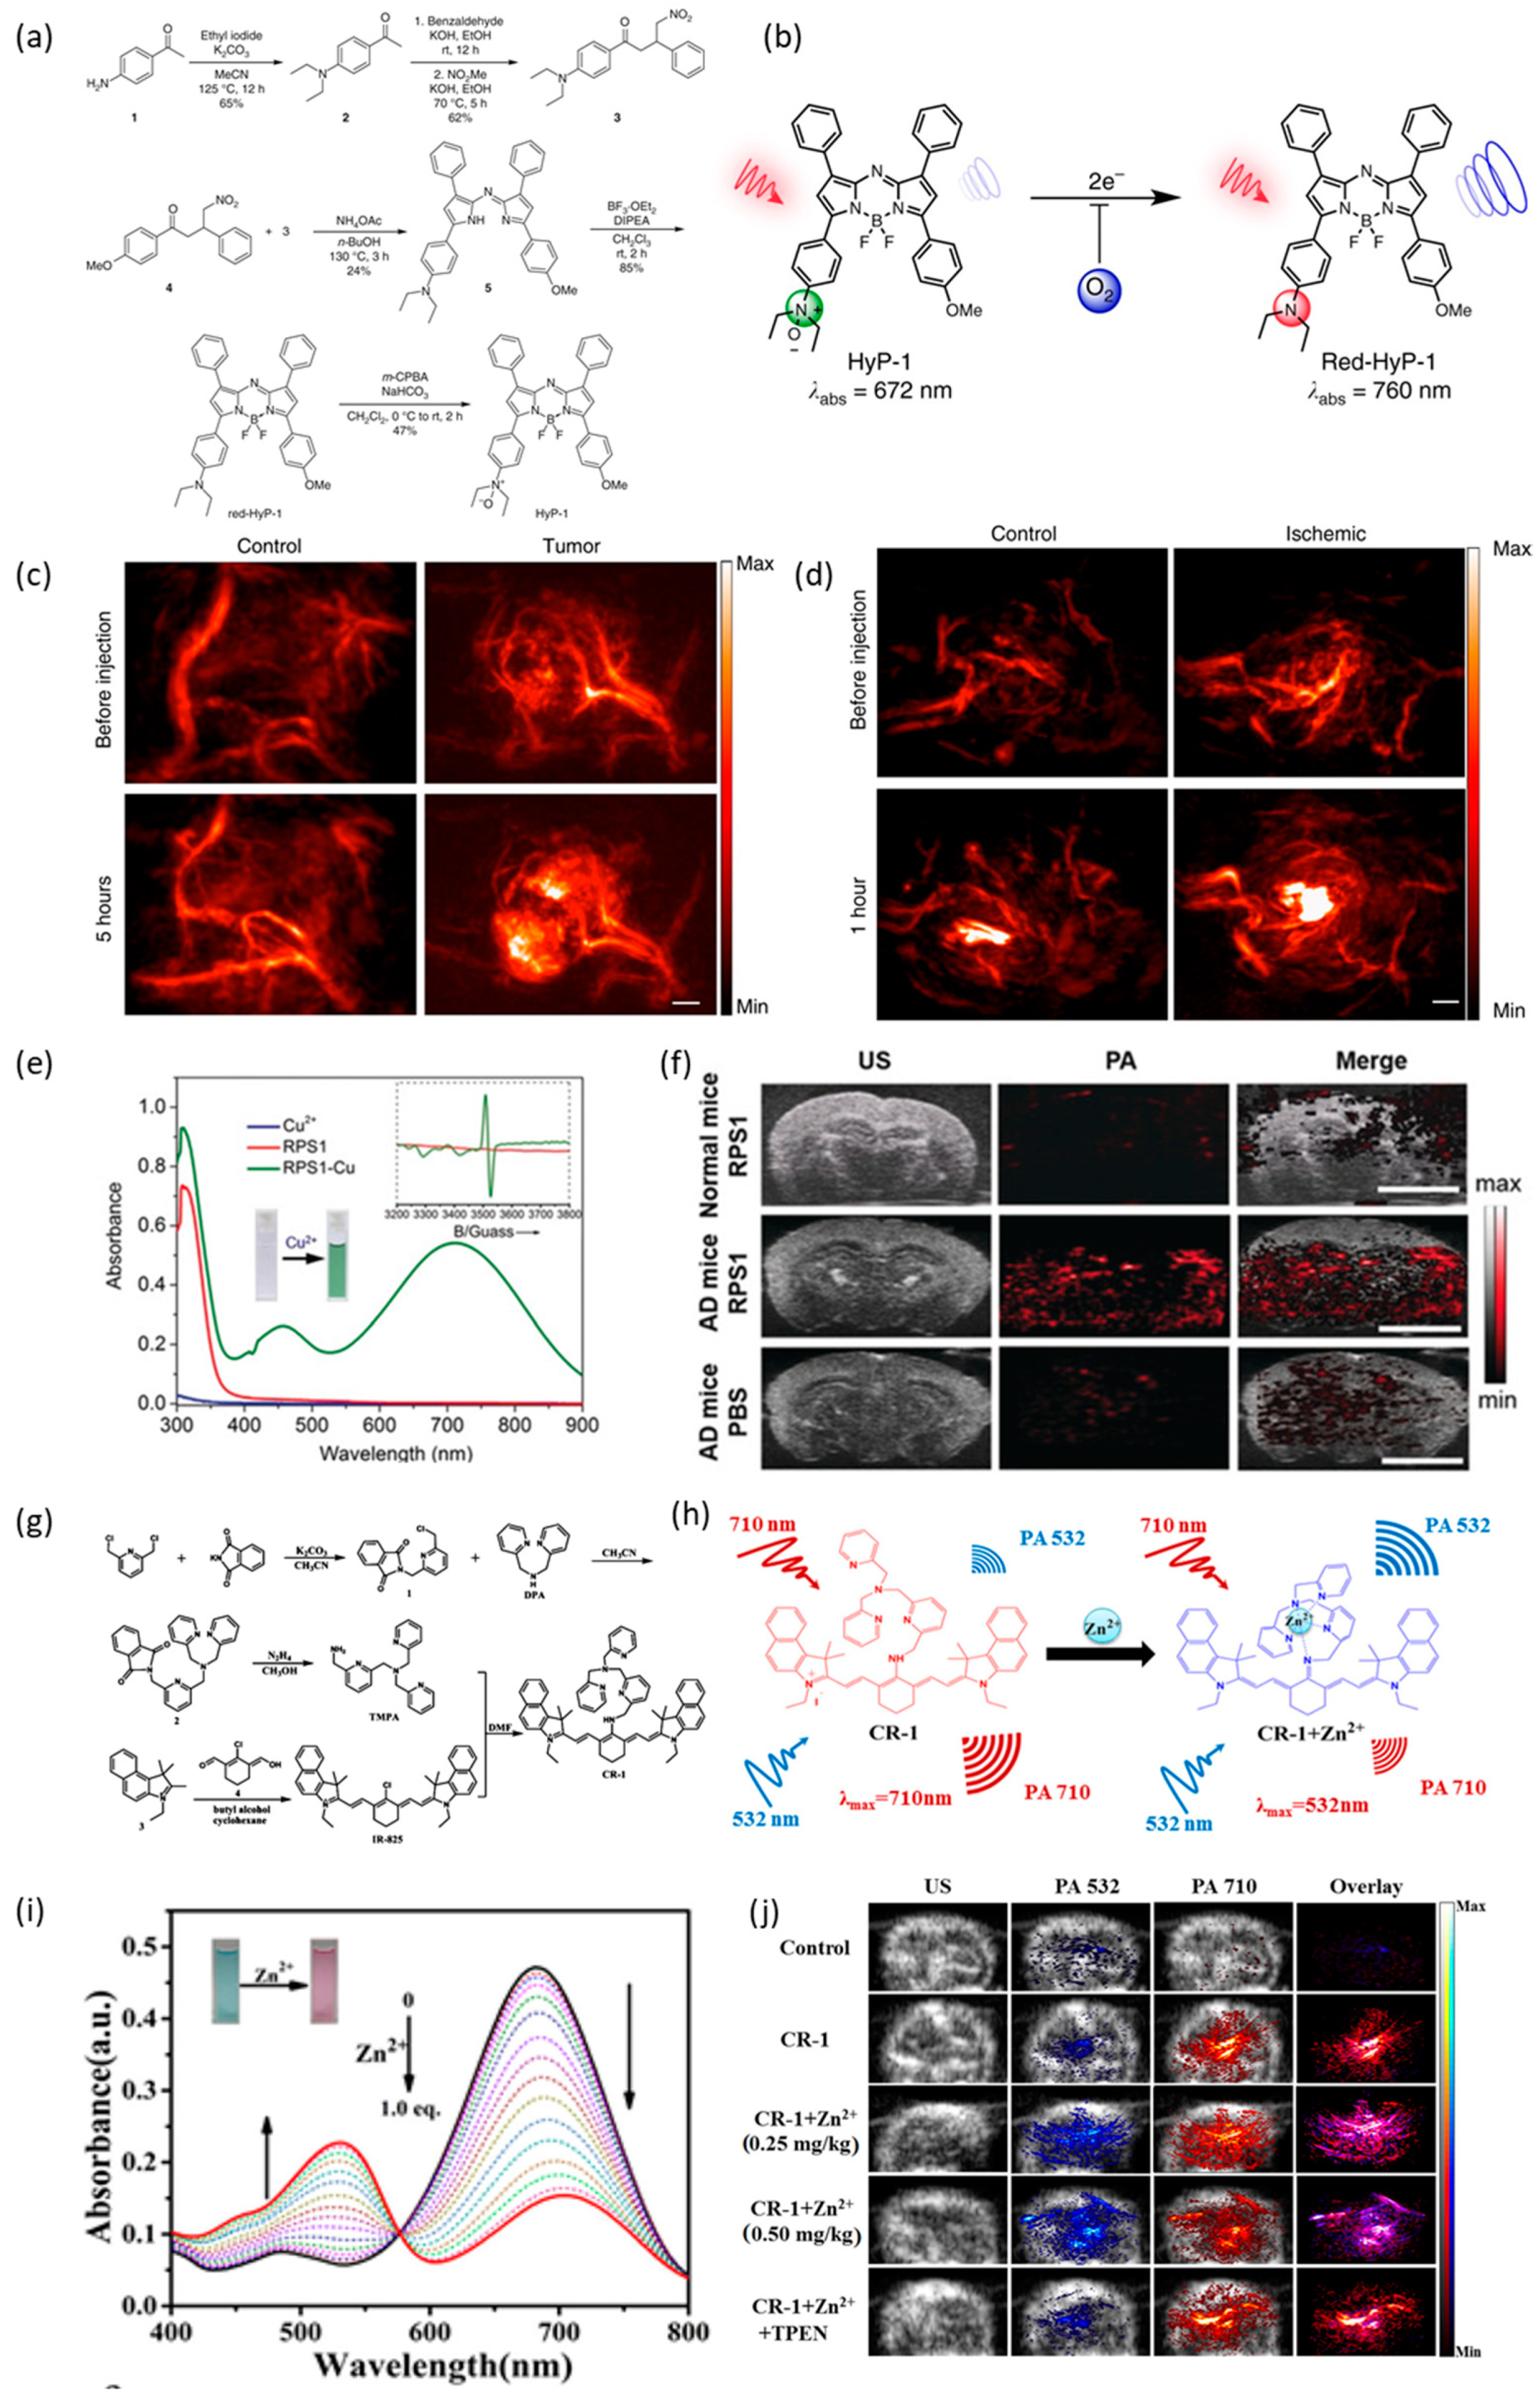
Hypoxia is a pathological characteristic of many diseases, including cancer and ischemia. Therefore, the detection of hypoxia is useful in the treatment of these diseases. Knox et al. created HyP-1 to detect hypoxia (Figure 8a) [106]. HyP-1 can be converted into Red-HyP-1 by adding two electrons and oxygen using enzymes. Since the absorption peak of HyP-1 (672 nm) differs from that of Red-HyP-1 (760 nm), hypoxia can be detected by comparing PA images for the two wavelengths (Figure 8b). PA imaging 5 h after the injection of HyP-1 into a tumor-bearing mouse model produced a more intense PA signal compared to the control group (Figure 8c). PA imaging 1 h after the intramuscular injection of HyP-1 into a murine hindlimb ischemia model also led to more intense PA signals compared to the control group (Figure 8d).
The impaired regulation of transition metal ions in vivo causes various diseases, such as Alzheimer’s [107,108] and Parkinson’s disease [109]. Therefore, the accurate sensing of metal ions can act as a guide to the detection of these diseases. Wang et al. created RPS1, RPS2, RPS3 and RPS4 to identify the incorrect regulation of Cu2+ in the brain, which is one of the symptoms of Alzheimer’s [110]. Of these molecules, RPS1 exhibited the strongest sensing effect. RPS1 reacted with Cu2+ to create RPS1-Cu, which had an absorption peak at 713 nm (Figure 8e). After the intravenous injection of RPS1 into an Alzheimer’s disease mouse model, no PA signals were detected in normal mice, whereasstrong PA signals were detected in the Alzheimer’s group (Figure 8f). In addition, no toxicity was observed in in vitro during the treatment of 0–200 μM of RPS1 for 24 h, and it was confirmed that there was no tissue damage through H&E staining of major organs in vivo.
Zhang et al. developed CR-1 (Figure 8g,h), which can determine the concentration of Zn2+ (Figure 8i,j) [111]. CR-1 reacts with Zn2+ to form CR-1+Zn2+, and the absorption peak shifts from 710 nm to 532 nm. Therefore, Zn2+ can be monitored using PA imaging with a 532-nm laser. In vivo imaging trials with CR-1 demonstrated that Zn2+ was imaged clearly even in deep tissue. In addition, as a result of MTT assay with CR-1 of 5–100 μM after 24 h, cell viability was over 85% and there was no abnormality in the weight change for 2 weeks after injection into mice.
5. Discussion and Conclusions
In this paper, we reviewed the principles of the photoacoustic effect, techniques for photoacoustic imaging, various organic/inorganic contrast agents and applications of photoacoustic imaging. Imaging techniques using PA contrast agents lead to stable real-time imaging of deep tissue at a high resolution. Cancer can be diagnosed via imaging with cancer-tracking drugs. For this process, PA contrast agents can be modified to selectively move and accumulate in cancer cells or to exhibit changes in their PA signal characteristics depending on the surrounding environmental conditions (e.g., pH and oxygen concentration). PA imaging can also be employed in conjunction with chemotherapy, PDT and PTT in theragnostic applications.
To date, PA contrast agents in the form of metals or dyes have been studied. Researchers have developed novel PA contrast agents to obtain clearer PA images by increasing the strength of PA signals or by shifting the absorption spectrum from the UV/Vis region, where high-intensity PA signals from biomolecules can be detected, to the NIR region. In addition, previous studies have developed PA contrast agent particles that change their structure in order to overcome the typically short half-life of contrast agents in PA imaging.
However, despite these efforts, there are still many limitations to be overcome. The main obstacles for PA contrast agents are the lack of biocompatibility and targeting ability. PA contrast agents should be non-toxic both before and after their decomposition and chemically stable. They should also not cause any immune response in the body nor stimulate other components of the nervous system during systemic circulation. They also need to be biodegradable so that they are readily discharged from the body rather than accumulating. PA contrast agents require targeting ability to ensure that they accumulate in the target area. Simply injecting PA contrast agents does not highlight the region of interest but rather increases the PA signal in nearby regions. Many studies on PA contrast agents have been conducted to overcome these issues, but no practical solution has yet been reported.
Therefore, in future research, for the development of PA contrast agents, it will be necessary to consider various factors and improve them. First, PA contrast agents basically should focus on biocompatibility and biodegradability. This is because no matter how excellent the PA contrast agent is, it cannot be used as a PA contrast agent if it is toxic or if it damages the immune system. If the above two conditions are satisfied, the development direction of the PA contrast agent should be designed to have better contrast ability than the existing PA contrast agents. Contrast ability refers to the absolute intensity value of the contrast agent, high-definition imaging and its half-life in vivo. Finally, as mentioned in Section 4 of this review paper, PA contrast agents are used to simultaneously diagnose and treat various disease models. Therefore, the development of PA contrast agents must be able to target a specific disease model, and at the same time, it is a necessity to deliver a treatment-enabled substance together. In the future, research on improving PA imaging by combining multiple compounds should continue in order to develop more effective commercial PA contrast agents.
Author Contributions
Conceptualization, J.J., Y.J. and M.K.; methodology, J.J., Y.J. and M.K; software, J.J. and Y.J.; validation, J.J. and Y.J.; formal analysis, J.J. and Y.J.; investigation, J.J. and Y.J.; resources, J.J. and Y.J.; data curation, J.J. and Y.J.; writing—original draft preparation, J.J. and Y.J.; writing—review and editing, H.K. and Y.J.; visualization, J.J.; supervision, H.K.; project administration, H.K.; funding acquisition, H.K. All authors have read and agreed to the published version of the manuscript.
Funding
This research was supported by the Basic Science Research Program through the National Research Foundation of Korea (NRF), funded by the Ministry of Education, Science and Technology (NRF-2016R1A6A1A03012845, and NRF- 2020R1A2B5B02001733), Republic of Korea.
Institutional Review Board Statement
Not applicable.
Informed Consent Statement
Not applicable.
Acknowledgments
This research was supported by the Basic Science Research Program through the National Research Foundation of Korea (NRF), funded by the Ministry of Education, Science and Technology (NRF-2016R1A6A1A03012845 and NRF- 2020R1A2B5B02001733), Republic of Korea.
Conflicts of Interest
The authors declare no conflict of interest.
References
- Harris, R.A.; Follett, D.H.; Halliwell, M.; Wells, P.N.T. Ultimate limits in ultrasonic imaging resolution. Ultrasound Med. Biol. 1991, 17, 547–558. [Google Scholar] [CrossRef]
- Herment, A.; Guglielmi, J.P.; Dumee, P.; Peronneau, P.; Delouche, P. Limitations of ultrasound imaging and image restoration. Ultrasonics 1987, 25, 267–273. [Google Scholar] [CrossRef]
- Ray, A.A.; Ghiculete, D.; Pace, K.T.; Honey, R.J. Limitations to ultrasound in the detection and measurement of urinary tract calculi. Urology 2010, 76, 295–300. [Google Scholar] [CrossRef]
- Sack, I.; Schaeffter, T. Quantification of Biophysical Parameters in Medical Imaging; Springer: Berlin, Germany, 2018. [Google Scholar]
- Wood, C.; Harutyunyan, K.; Sampaio, D.R.; Konopleva, M.; Bouchard, R.J.P. Photoacoustic-based oxygen saturation assessment of murine femoral bone marrow in a preclinical model of leukemia. Photoacoustics 2019, 14, 31–36. [Google Scholar] [CrossRef]
- Yao, J.J.; Maslov, K.I.; Shi, Y.F.; Taber, L.A.; Wang, L.H.V. In vivo photoacoustic imaging of transverse blood flow by using Doppler broadening of bandwidth. Opt. Lett. 2010, 35, 1419–1421. [Google Scholar] [CrossRef]
- Chatni, M.R.; Xia, J.; Sohn, R.; Maslov, K.; Guo, Z.J.; Zhang, Y.; Wang, K.; Xia, Y.N.; Anastasio, M.; Arbeit, J.; et al. Tumor glucose metabolism imaged in vivo in small animals with whole-body photoacoustic computed tomography. J. Biomed. Opt. 2012, 17, 076012. [Google Scholar] [CrossRef] [Green Version]
- Lu, W.; Huang, Q.; Geng, K.B.; Wen, X.X.; Zhou, M.; Guzatov, D.; Brecht, P.; Su, R.; Oraevsky, A.; Wang, L.V.; et al. Photoacoustic imaging of living mouse brain vasculature using hollow gold nanospheres. Biomaterials 2010, 31, 2617–2626. [Google Scholar] [CrossRef] [Green Version]
- Taruttis, A.; Timmermans, A.C.; Wouters, P.C.; Kacprowicz, M.; van Dam, G.M.; Ntziachristos, V. Optoacoustic Imaging of Human Vasculature: Feasibility by Using a Handheld Probe. Radiology 2016, 281, 256–263. [Google Scholar] [CrossRef] [Green Version]
- Zhang, W.; Li, Y.X.; Nguyen, V.P.; Huang, Z.Y.; Liu, Z.P.; Wang, X.D.; Paulus, Y.M. High-resolution, in vivo multimodal photoacoustic microscopy, optical coherence tomography, and fluorescence microscopy imaging of rabbit retinal neovascularization. Light-Sci. Appl. 2018, 7, 103. [Google Scholar] [CrossRef] [Green Version]
- Nam, S.Y.; Emelianov, S.Y. Array-Based Real-Time Ultrasound and Photoacoustic Ocular Imaging. J. Opt. Soc. Korea 2014, 18, 151–155. [Google Scholar] [CrossRef] [Green Version]
- Agarwal, A.; Huang, S.W.; O’Donnell, M.; Day, K.C.; Day, M.; Kotov, N.; Ashkenazi, S. Targeted gold nanorod contrast agent for prostate cancer detection by photoacoustic imaging. J. Appl. Phys. 2007, 102, 064701. [Google Scholar] [CrossRef] [Green Version]
- Lv, J.; Li, S.; Zhang, J.D.; Duan, F.; Wu, Z.Y.; Chen, R.H.; Chen, M.M.; Huang, S.S.; Ma, H.S.; Nie, L.M. In vivo photoacoustic imaging dynamically monitors the structural and functional changes of ischemic stroke at a very early stage. Theranostics 2020, 10, 816–828. [Google Scholar] [CrossRef]
- Chen, Z.; Rank, E.; Meiburger, K.M.; Sinz, C.; Hodul, A.; Zhang, E.; Hoover, E.; Minneman, M.; Ensher, J.; Beard, P.C.; et al. Non-invasive multimodal optical coherence and photoacoustic tomography for human skin imaging. Sci. Rep. 2017, 7, 17975. [Google Scholar] [CrossRef] [PubMed]
- Graham, M.; Assis, F.; Allman, D.; Wiacek, A.; Gonzalez, E.; Gubbi, M.; Dong, J.X.; Hou, H.Y.; Beck, S.; Chrispin, J.; et al. In Vivo Demonstration of Photoacoustic Image Guidance and Robotic Visual Servoing for Cardiac Catheter-Based Interventions. IEEE Trans. Med. Imaging 2020, 39, 1015–1029. [Google Scholar] [CrossRef]
- Gao, F.; Feng, X.H.; Zhang, R.C.; Liu, S.Y.; Ding, R.; Kishor, R.; Zheng, Y.J. Single laser pulse generates dual photoacoustic signals for differential contrast photoacoustic imaging. Sci. Rep. 2017, 7, 626. [Google Scholar] [CrossRef] [PubMed]
- Hariri, A.; Fatima, A.; Mohammadian, N.; Mahmoodkalayeh, S.; Ansari, M.A.; Bely, N.; Avanaki, M.R.N. Development of low-cost photoacoustic imaging systems using very low-energy pulsed laser diodes. J. Biomed. Opt. 2017, 22, 075001. [Google Scholar] [CrossRef] [PubMed]
- Zhao, Y.; Yang, S.H. Photoacoustic Viscoelasticity Imaging of Biological Tissues with Intensity-Modulated Continuous-Wave Laser. J. Innov. Opt. Health Sci. 2013, 6, 1350033. [Google Scholar] [CrossRef] [Green Version]
- Maslov, K.; Wang, L.V. Photoacoustic imaging of biological tissue with intensity-modulated continuous-wave laser. J. Biomed. Opt. 2008, 13, 024006. [Google Scholar] [CrossRef]
- Lashkari, B.; Mandelis, A. Comparison between pulsed laser and frequency-domain photoacoustic modalities: Signal-to-noise ratio, contrast, resolution, and maximum depth detectivity. Rev. Sci. Instrum. 2011, 82, 094903. [Google Scholar] [CrossRef]
- Paproski, R.J.; Forbrich, A.E.; Wachowicz, K.; Hitt, M.M.; Zemp, R.J. Tyrosinase as a dual reporter gene for both photoacoustic and magnetic resonance imaging. Biomed. Opt. Express 2011, 2, 771–780. [Google Scholar] [CrossRef]
- Avci, P.; Gupta, A.; Sadasivam, M.; Vecchio, D.; Pam, Z.; Pam, N.; Hamblin, M.R. Low-Level Laser (Light) Therapy (LLLT) in Skin: Stimulating, Healing, Restoring. Semin. Cutan. Med. Surg. 2013, 32, 41–52. [Google Scholar]
- Smith, A.M.; Mancini, M.C.; Nie, S.M. BIOIMAGING Second window for in vivo imaging. Nat. Nanotechnol. 2009, 4, 710–711. [Google Scholar] [CrossRef] [PubMed] [Green Version]
- Morse, P.M.; Ingard, K.U. Theoretical Acoustics; Princeton University Press: Princeton, NJ, USA, 1986; p. 927. [Google Scholar]
- Gusev, V.; Karabutov, A. Laser Optoacoustics; American Institute of Physics: New York, NY, USA, 1993. [Google Scholar]
- Lyamshev, L.M. Radiation Acoustics; CRC Press: Boca Raton, FL, USA, 2004. [Google Scholar]
- Tam, A. Applications of photoacoustic sensing techniques. Rev. Mod. Phys 1986, 58, 381. [Google Scholar] [CrossRef]
- Diebold, G.; Sun, T. Properties of photoacoustic waves in one, two, and three dimensions. Acta Acust. United Acust. 1994, 80, 339–351. [Google Scholar]
- Westervelt, P.J.; Larson, R.S.J.T.J.o.t.A.S.o.A. Laser-excited broadside array. J. Acoust. Soc. Am. 1973, 54, 121–122. [Google Scholar] [CrossRef]
- Morse, P.M.; Feshbach, H. Methods of Theoretical Physics; McGraw-Hill: New York, NY, USA, 1953. [Google Scholar]
- Sun, T.; Morais, J.; Diebold, G.; Zimmt, M.B. Investigation of viscosity and heat conduction effects on the evolution of a transient picosecond photoacoustic grating. J. Chem. Phys. 1992, 97, 9324–9334. [Google Scholar] [CrossRef]
- Yang, X.; Stein, E.W.; Ashkenazi, S.; Wang, L.V. Nanoparticles for photoacoustic imaging. Wiley Interdiscip Rev. Nanomed. Nanobiotechnol. 2009, 1, 360–368. [Google Scholar] [CrossRef] [PubMed] [Green Version]
- Fan, B.; Yang, X.; Li, X.; Lv, S.; Zhang, H.; Sun, J.; Li, L.; Wang, L.; Qu, B.; Peng, X.J.N. Photoacoustic-imaging-guided therapy of functionalized melanin nanoparticles: Combination of photothermal ablation and gene therapy against laryngeal squamous cell carcinoma. Nanoscale 2019, 11, 6285–6296. [Google Scholar] [CrossRef] [PubMed]
- Rajadhyaksha, M.; Grossman, M.; Esterowitz, D.; Webb, R.H.; Anderson, R.R. In vivo confocal scanning laser microscopy of human skin: Melanin provides strong contrast. J. Investig. Dermatol. 1995, 104, 946–952. [Google Scholar] [CrossRef] [PubMed] [Green Version]
- Abuteen, A.; Zanganeh, S.; Akhigbe, J.; Samankumara, L.P.; Aguirre, A.; Biswal, N.; Braune, M.; Vollertsen, A.; Röder, B.; Brückner, C.; et al. The evaluation of NIR-absorbing porphyrin derivatives as contrast agents in photoacoustic imaging. Phys. Chem. Chem. Phys. 2013, 15, 18502–18509. [Google Scholar] [CrossRef] [PubMed] [Green Version]
- Kim, G.; Huang, S.-W.; Day, K.C.; O’Donnell, M.; Agayan, R.R.; Day, M.A.; Kopelman, R.; Ashkenazi, S. Indocyanine-green-embedded PEBBLEs as a contrast agent for photoacoustic imaging. J. Biomed. Opt. 2007, 12, 044020. [Google Scholar] [CrossRef] [Green Version]
- Sheng, Z.; Song, L.; Zheng, J.; Hu, D.; He, M.; Zheng, M.; Gao, G.; Gong, P.; Zhang, P.; Ma, Y.J.B. Protein-assisted fabrication of nano-reduced graphene oxide for combined in vivo photoacoustic imaging and photothermal therapy. Biomaterials 2013, 34, 5236–5243. [Google Scholar] [CrossRef]
- McDonald, M.A.; Jankovic, L.; Shahzad, K.; Burcher, M.; Li, K.C.P. Acoustic fingerprints of dye-labeled protein submicrosphere photoacoustic contrast agents. J. Biomed. Opt. 2009, 14, 034032. [Google Scholar] [CrossRef]
- Zhu, Y.; Gu, C.; Miao, Y.; Yu, B.; Shen, Y.; Cong, H.J.J.o.M.C.B. D–A polymers for fluorescence/photoacoustic imaging and characterization of their photothermal properties. J. Mater. Chem. B 2019, 7, 6576–6584. [Google Scholar] [CrossRef] [PubMed]
- Yoon, S.J.; Mallidi, S.; Tam, J.M.; Tam, J.O.; Murthy, A.; Johnston, K.P.; Sokolov, K.V.; Emelianov, S.Y. Utility of biodegradable plasmonic nanoclusters in photoacoustic imaging. Opt. Lett. 2010, 35, 3751–3753. [Google Scholar] [CrossRef] [Green Version]
- Hou, Y.; Huang, S.-W.; Ashkenazi, S.; Witte, R.S.; O’Donnell, M. Thin polymer etalon arrays for high-resolution photoacoustic imaging. J. Biomed. Opt. 2008, 13, 064033. [Google Scholar] [CrossRef] [PubMed] [Green Version]
- Jansen, F.; Lamla, M.; Mauthe, D.; Fischer, S.; Barth, H.; Kuehne, A.J.C. Croconaine—Based Polymer Particles as Contrast Agents for Photoacoustic Imaging. Macromol. Rapid Commun. 2020, 44, 2000418. [Google Scholar] [CrossRef]
- Guo, B.; Sheng, Z.; Hu, D.; Lin, X.; Xu, S.; Liu, C.; Zheng, H.; Liu, B.J.M.H. Biocompatible conjugated polymer nanoparticles for highly efficient photoacoustic imaging of orthotopic brain tumors in the second near-infrared window. Mater. Horiz. 2017, 4, 1151–1156. [Google Scholar] [CrossRef]
- Shi, H.X.; Wang, Y.; Huang, X.Y.; Liang, P.P.; Tang, Y.Y.; Zhang, Y.W.; Fu, N.N.; Huang, W.; Dong, X.C. NIR-Absorbing water-soluble conjugated polymer dots for photoacoustic imaging-guided photothermal/photodynamic synergetic cancer therapy. J. Mater. Chem. B 2018, 6, 7402–7410. [Google Scholar] [CrossRef]
- Cai, X.L.; Liu, J.; Liew, W.H.; Duan, Y.K.; Geng, J.L.; Thakor, N.; Yao, K.; Liao, L.D.; Liu, B. Organic molecules with propeller structures for efficient photoacoustic imaging and photothermal ablation of cancer cells. Mater. Chem. Front. 2017, 1, 1556–1562. [Google Scholar] [CrossRef]
- Wang, Q.; Xia, B.; Xu, J.Z.; Niu, X.R.; Cai, J.; Shen, Q.M.; Wang, W.J.; Huang, W.; Fan, Q.L. Biocompatible small organic molecule phototheranostics for NIR-II fluorescence/photoacoustic imaging and simultaneous photodynamic/photothermal combination therapy. Mater. Chem. Front. 2019, 3, 650–655. [Google Scholar] [CrossRef]
- Sheng, Z.; Guo, B.; Hu, D.; Xu, S.; Wu, W.; Liew, W.H.; Yao, K.; Jiang, J.; Liu, C.; Zheng, H.J.A.M. Bright aggregation-induced-emission dots for targeted synergetic NIR-II fluorescence and NIR-I photoacoustic imaging of orthotopic brain tumors. Adv. Mater. 2018, 30, 1800766. [Google Scholar] [CrossRef]
- Sreejith, S.; Joseph, J.; Lin, M.J.; Menon, N.V.; Borah, P.; Ng, H.J.; Loong, Y.X.; Kang, Y.; Yu, S.W.K.; Zhao, Y.L. Near-Infrared Squaraine Dye Encapsulated Micelles for in Vivo Fluorescence and Photoacoustic Bimodal Imaging. ACS Nano 2015, 9, 5695–5704. [Google Scholar] [CrossRef]
- Hashimoto, S.; Werner, D.; Uwada, T. Studies on the interaction of pulsed lasers with plasmonic gold nanoparticles toward light manipulation, heat management, and nanofabrication. J. Photochem. Photobiol. C Photochem. Rev. 2012, 13, 28–54. [Google Scholar] [CrossRef]
- Homan, K.A.; Souza, M.; Truby, R.; Luke, G.P.; Green, C.; Vreeland, E.; Emelianov, S. Silver nanoplate contrast agents for in vivo molecular photoacoustic imaging. ACS Nano 2012, 6, 641–650. [Google Scholar] [CrossRef] [Green Version]
- Zhang, J.; Atay, T.; Nurmikko, A.V. Optical detection of brain cell activity using plasmonic gold nanoparticles. Nano Lett. 2009, 9, 519–524. [Google Scholar] [CrossRef] [PubMed]
- Sharifi, M.; Attar, F.; Saboury, A.A.; Akhtari, K.; Hooshmand, N.; Hasan, A.; El-Sayed, M.A.; Falahati, M. Plasmonic gold nanoparticles: Optical manipulation, imaging, drug delivery and therapy. J. Control. Release 2019, 311, 170–189. [Google Scholar] [CrossRef] [PubMed]
- Li, W.; Chen, X. Gold nanoparticles for photoacoustic imaging. Nanomedicine 2015, 10, 299–320. [Google Scholar] [CrossRef] [Green Version]
- Huang, P.; Lin, J.; Li, W.; Rong, P.; Wang, Z.; Wang, S.; Wang, X.; Sun, X.; Aronova, M.; Niu, G. Biodegradable gold nanovesicles with an ultrastrong plasmonic coupling effect for photoacoustic imaging and photothermal therapy. Angew. Chem. Int. Ed. Engl. 2013, 125, 14208–14214. [Google Scholar] [CrossRef]
- Song, J.; Yang, X.; Jacobson, O.; Huang, P.; Sun, X.; Lin, L.; Yan, X.; Niu, G.; Ma, Q.; Chen, X. Ultrasmall gold nanorod vesicles with enhanced tumor accumulation and fast excretion from the body for cancer therapy. Adv. Mater. 2015, 27, 4910–4917. [Google Scholar] [CrossRef]
- Bao, C.; Conde, J.; Pan, F.; Li, C.; Zhang, C.; Tian, F.; Liang, S.; Jesus, M.; Cui, D. Gold nanoprisms as a hybrid in vivo cancer theranostic platform for in situ photoacoustic imaging, angiography, and localized hyperthermia. Nano Res. 2016, 9, 1043–1056. [Google Scholar] [CrossRef] [Green Version]
- Liang, R.; Xie, J.; Li, J.; Wang, K.; Liu, L.; Gao, Y.; Hussain, M.; Shen, G.; Zhu, J.; Tao, J. Liposomes-coated gold nanocages with antigens and adjuvants targeted delivery to dendritic cells for enhancing antitumor immune response. Biomaterials 2017, 149, 41–50. [Google Scholar] [CrossRef]
- Prost, A.; Poisson, F.; Bossy, E. Photoacoustic generation by a gold nanosphere: From linear to nonlinear thermoelastics in the long-pulse illumination regime. Phys. Rev. B 2015, 92, 115450. [Google Scholar] [CrossRef] [Green Version]
- Li, W.; Sun, X.; Wang, Y.; Niu, G.; Chen, X.; Qian, Z.; Nie, L. In vivo quantitative photoacoustic microscopy of gold nanostar kinetics in mouse organs. Biomed. Opt. Express 2014, 5, 2679–2685. [Google Scholar] [CrossRef] [PubMed] [Green Version]
- Cao, Y.; Yi, J.W.; Yang, X.G.; Liu, L.; Yu, C.L.; Huang, Y.X.; Sun, L.G.; Bao, Y.L.; Li, Y.X. Efficient cancer regression by a thermosensitive liposome for photoacoustic imaging-guided photothermal/chemo combinatorial therapy. Biomacromolecules 2017, 18, 2306–2314. [Google Scholar] [CrossRef] [PubMed]
- Zoric, I.; Zach, M.; Kasemo, B.; Langhammer, C. Gold, platinum, and aluminum nanodisk plasmons: Material independence, subradiance, and damping mechanisms. Acs Nano 2011, 5, 2535–2546. [Google Scholar] [CrossRef] [PubMed]
- Homan, K.A.; Shah, J.; Gomez, S.; Gensler, H.; Karpiouk, A. Silver nanosystems for photoacoustic imaging and image-guided therapy. J. Biomed. Opt. 2010, 15, 021316. [Google Scholar] [CrossRef] [Green Version]
- Ray, A.; Mukundan, A.; Xie, Z.X.; Karamchand, L.; Wang, X.D.; Kopelman, R. Highly stable polymer coated nano-clustered silver plates: A multimodal optical contrast agent for biomedical imaging. Nanotechnology 2014, 25. [Google Scholar] [CrossRef]
- Su, J.L.; Karpiouk, A.B.; Wang, B.; Emelianov, S. Photoacoustic imaging of clinical metal needles in tissue. J. Biomed. Opt. 2010, 15, 021309. [Google Scholar] [CrossRef]
- Liu, X.; Lee, C.; Law, W.C.; Zhu, D.W.; Liu, M.X.; Jeon, M.; Kim, J.; Prasad, P.N.; Kim, C.; Swihart, M.T. Au-cu2-x se heterodimer nanoparticles with broad localized surface plasmon resonance as contrast agents for deep tissue imaging (vol 13, pg 4333, 2013). Nano Lett. 2013, 13, 6298. [Google Scholar] [CrossRef]
- Song, J.; Kim, J.; Hwang, S.; Jeon, M.; Jeong, S.; Kim, C.; Kim, S. Smart gold nanoparticles for photoacoustic imaging: An imaging contrast agent responsive to the cancer microenvironment and signal amplification via ph-induced aggregation. Chem. Commun. 2016, 52, 8287–8290. [Google Scholar] [CrossRef] [PubMed]
- Zhang, D.; Xu, H.; Zhang, X.L.; Liu, Y.B.; Wu, M.; Li, J.; Yang, H.H.; Liu, G.; Liu, X.L.; Liu, J.F.; et al. Self-quenched metal-organic particles as dual-mode therapeutic agents for photoacoustic imaging-guided second near-infrared window photochemotherapy. ACS Appl. Mater. Interfaces 2018, 10, 25203–25212. [Google Scholar] [CrossRef]
- Shang, W.T.; Zeng, C.T.; Du, Y.; Hui, H.; Liang, X.; Chi, C.W.; Wang, K.; Wang, Z.L.; Tian, J. Core-shell gold nanorod@metal-organic framework nanoprobes for multimodality diagnosis of glioma. Adv. Mater. 2017, 29, 1604381. [Google Scholar] [CrossRef] [PubMed]
- Yang, Z.; Song, J.B.; Dai, Y.L.; Chen, J.Y.; Wang, F.; Lin, L.S.; Liu, Y.J.; Zhang, F.W.; Yu, G.C.; Zhou, Z.J.; et al. Self-assembly of semiconducting-plasmonic gold nanoparticles with enhanced optical property for photoacoustic imaging and photothermal therapy. Theranostics 2017, 7, 2177–2185. [Google Scholar] [CrossRef] [Green Version]
- Lee, W.J.; Park, E.Y.; Choi, D.; Lee, D.; Koo, J.; Min, J.G.; Jung, Y.; Hong, S.B.; Kim, K.; Kim, C.; et al. Colloidal porous auag alloyed nanoparticles for enhanced photoacoustic imaging. ACS Appl. Mater. Interfaces 2020, 12, 32270–32277. [Google Scholar] [CrossRef]
- Boyer, D.; Tamarat, P.; Maali, A.; Lounis, B.; Orrit, M. Photothermal imaging of nanometer-sized metal particles among scatterers. Science 2002, 297, 1160–1163. [Google Scholar] [CrossRef]
- Huang, X.H.; El-Sayed, I.H.; Qian, W.; El-Sayed, M.A. Cancer cell imaging and photothermal therapy in the near-infrared region by using gold nanorods. J. Am. Chem. Soc. 2006, 128, 2115–2120. [Google Scholar] [CrossRef]
- Berciaud, S.; Cognet, L.; Blab, G.A.; Lounis, B. Photothermal heterodyne imaging of individual nonfluorescent nanoclusters and nanocrystals. Phys. Rev. Lett. 2004, 93, 257402. [Google Scholar] [CrossRef] [Green Version]
- Jain, P.K.; Huang, X.H.; El-Sayed, I.H.; El-Sayed, M.A. Noble metals on the nanoscale: Optical and photothermal properties and some applications in imaging, sensing, biology, and medicine. Accounts Chem. Res. 2008, 41, 1578–1586. [Google Scholar] [CrossRef]
- Lee, D.E.; Koo, H.; Sun, I.C.; Ryu, J.H.; Kim, K.; Kwon, I.C. Multifunctional nanoparticles for multimodal imaging and theragnosis. Chem. Soc. Rev. 2012, 41, 2656–2672. [Google Scholar] [CrossRef] [PubMed]
- Kim, K.; Kim, J.H.; Park, H.; Kim, Y.S.; Park, K.; Nam, H.; Lee, S.; Park, J.H.; Park, R.W.; Kim, I.S.; et al. Tumor-homing multifunctional nanoparticles for cancer theragnosis: Simultaneous diagnosis, drug delivery, and therapeutic monitoring. J. Control. Release 2010, 146, 219–227. [Google Scholar] [CrossRef]
- Huang, X.H.; Jain, P.K.; El-Sayed, I.H.; El-Sayed, M.A. Plasmonic photothermal therapy (pptt) using gold nanoparticles. Laser Med. Sci. 2008, 23, 217–228. [Google Scholar] [CrossRef] [PubMed]
- Hessel, C.M.; Pattani, V.P.; Rasch, M.; Panthani, M.G.; Koo, B.; Tunnell, J.W.; Korgel, B.A. Copper selenide nanocrystals for photothermal therapy. Nano Lett. 2011, 11, 2560–2566. [Google Scholar] [CrossRef] [Green Version]
- Shah, J.; Park, S.; Aglyamov, S.; Larson, T.; Ma, L.; Sokolov, K.; Johnston, K.; Milner, T.; Emelianov, S.Y. Photoacoustic imaging and temperature measurement for photothermal cancer therapy. J. Biomed. Opt. 2008, 13, 034024. [Google Scholar] [CrossRef]
- DeVita, V.T., Jr.; Chu, E. A history of cancer chemotherapy. Cancer Res. 2008, 68, 8643–8653. [Google Scholar] [CrossRef] [Green Version]
- Chabner, B.A.; Roberts, T.G. Timeline—Chemotherapy and the war on cancer. Nat. Rev. Cancer 2005, 5, 65–72. [Google Scholar] [CrossRef] [PubMed]
- Zhang, Y.Q.; Yu, J.C.; Kahkoska, A.R.; Gu, Z. Photoacoustic drug delivery. Sensors 2017, 17, 1400. [Google Scholar] [CrossRef] [Green Version]
- Dougherty, T.J.; Gomer, C.J.; Henderson, B.W.; Jori, G.; Kessel, D.; Korbelik, M.; Moan, J.; Peng, Q. Photodynamic therapy. J. Natl. Cancer Inst. 1998, 90, 889–905. [Google Scholar] [CrossRef] [Green Version]
- Dolmans, D.E.; Fukumura, D.; Jain, R.K. Photodynamic therapy for cancer. Nat. Rev. Cancer 2003, 3, 380–387. [Google Scholar] [CrossRef] [PubMed]
- Gao, S.; Wang, G.H.; Qin, Z.N.; Wang, X.Y.; Zhao, G.Q.; Ma, Q.J.; Zhu, L. Oxygen-generating hybrid nanoparticles to enhance fluorescent/photoacoustic/ultrasound imaging guided tumor photodynamic therapy. Biomaterials 2017, 112, 324–335. [Google Scholar] [CrossRef] [PubMed] [Green Version]
- Tachibana, K.; Feril, L.B., Jr.; Ikeda-Dantsuji, Y. Sonodynamic therapy. Ultrasonics 2008, 48, 253–259. [Google Scholar] [CrossRef]
- Kuroki, M.; Hachimine, K.; Abe, H.; Shibaguchi, H.; Kuroki, M.; Maekawa, S.; Yanagisawa, J.; Kinugasa, T.; Tanaka, T.; Yamashita, Y. Sonodynamic therapy of cancer using novel sonosensitizers. Anticancer Res. 2007, 27, 3673–3677. [Google Scholar]
- Huang, J.; Liu, F.Q.; Han, X.X.; Zhang, L.; Hu, Z.Q.; Jiang, Q.Q.; Wang, Z.G.; Ran, H.T.; Wang, D.; Li, P. Nanosonosensitizers for highly efficient sonodynamic cancer theranostics. Theranostics 2018, 8, 6178–6194. [Google Scholar] [CrossRef]
- Zhang, W.; Guo, Z.Y.; Huang, D.Q.; Liu, Z.M.; Guo, X.; Zhong, H.Q. Synergistic effect of chemo-photothermal therapy using pegylated graphene oxide. Biomaterials 2011, 32, 8555–8561. [Google Scholar] [CrossRef]
- Zha, Z.B.; Zhang, S.H.; Deng, Z.J.; Li, Y.Y.; Li, C.H.; Dai, Z.F. Enzyme-responsive copper sulphide nanoparticles for combined photoacoustic imaging, tumor-selective chemotherapy and photothermal therapy. Chem. Commun. 2013, 49, 3455–3457. [Google Scholar] [CrossRef]
- Bao, T.; Yin, W.Y.; Zheng, X.P.; Zhang, X.; Yu, J.; Dong, X.H.; Yong, Y.; Gao, F.P.; Yan, L.; Gu, Z.J.; et al. One-pot synthesis of pegylated plasmonic moo3-x hollow nanospheres for photoacoustic imaging guided chemo-photothermal combinational therapy of cancer. Biomaterials 2016, 76, 11–24. [Google Scholar] [CrossRef] [PubMed]
- Manivasagan, P.; Bui, N.Q.; Bharathiraja, S.; Moorthy, M.S.; Oh, Y.O.; Song, K.; Seo, H.; Yoon, M.; Oh, J. Multifunctional biocompatible chitosan-polypyrrole nanocomposites as novel agents for photoacoustic imaging-guided photothermal ablation of cancer. Sci. Rep. 2017, 7, 43593. [Google Scholar] [CrossRef] [Green Version]
- Guo, B.; Sheng, Z.H.; Hu, D.H.; Li, A.R.; Xu, S.D.; Manghnani, P.N.; Liu, C.B.; Guo, L.; Zheng, H.R.; Liu, B. Molecular engineering of conjugated polymers for biocompatible organic nanoparticles with highly efficient photoacoustic and photothermal performance in cancer theranostics. ACS Nano 2017, 11, 10124–10134. [Google Scholar] [CrossRef] [PubMed]
- Chanda, N.; Shukla, R.; Zambre, A.; Mekapothula, S.; Kulkarni, R.R.; Katti, K.; Bhattacharyya, K.; Fent, G.M.; Casteel, S.W.; Boote, E.J.; et al. An effective strategy for the synthesis of biocompatible gold nanoparticles using cinnamon phytochemicals for phantom ct imaging and photoacoustic detection of cancerous cells. Pharm. Res.-Dordr. 2011, 28, 279–291. [Google Scholar] [CrossRef] [PubMed] [Green Version]
- Wang, W.Y.; Jing, T.; Xia, X.R.; Tang, L.M.; Huang, Z.Q.; Liu, F.Q.; Wang, Z.G.; Ran, H.T.; Li, M.X.; Xia, J.Z. Melanin-loaded biocompatible photosensitive nanoparticles for controlled drug release in combined photothermal-chemotherapy guided by photoacoustic/ultrasound dual-modality imaging. Biomater. Sci. 2019, 7, 4060–4074. [Google Scholar] [CrossRef]
- Tang, Q.Y.; Xiao, W.Y.; Huang, C.H.; Si, W.L.; Shao, J.J.; Huang, W.; Chen, P.; Zhang, Q.; Dong, X.C. Ph-triggered and enhanced simultaneous photodynamic and photothermal therapy guided by photoacoustic and photothermal imaging. Chem. Mater. 2017, 29, 5216–5224. [Google Scholar] [CrossRef]
- Lyu, Y.; Zeng, J.F.; Jiang, Y.Y.; Zhen, X.; Wang, T.; Qiu, S.S.; Lou, X.; Gao, M.Y.; Pu, K.Y. Enhancing both biodegradability and efficacy of semiconducting polymer nanoparticles for photoacoustic imaging and photothermal therapy. ACS Nano 2018, 12, 1801–1810. [Google Scholar] [CrossRef] [PubMed]
- Dong, L.; Ji, G.; Liu, Y.; Xu, X.; Lei, P.; Du, K.; Song, S.; Feng, J.; Zhang, H. Multifunctional cu-ag2s nanoparticles with high photothermal conversion efficiency for photoacoustic imaging-guided photothermal therapy in vivo. Nanoscale 2018, 10, 825–831. [Google Scholar] [CrossRef]
- Zhang, Q.; Iwakuma, N.; Sharma, P.; Moudgil, B.M.; Wu, C.; McNeill, J.; Jiang, H.; Grobmyer, S.R. Gold nanoparticles as a contrast agent for in vivo tumor imaging with photoacoustic tomography. Nanotechnology 2009, 20, 395102. [Google Scholar] [CrossRef] [PubMed] [Green Version]
- Cheng, X.J.; Sun, R.; Yin, L.; Chai, Z.F.; Shi, H.B.; Gao, M.Y. Light-triggered assembly of gold nanoparticles for photothermal therapy and photoacoustic imaging of tumors in vivo. ADV Mater. 2017, 29, 1604894. [Google Scholar] [CrossRef] [PubMed]
- Jiang, Y.Y.; Cui, D.; Fang, Y.; Zhen, X.; Upputuri, P.K.; Pramanik, M.; Ding, D.; Pu, K.Y. Amphiphilic semiconducting polymer as multifunctional nanocarrier for fluorescence/photoacoustic imaging guided chemo-photothermal therapy. Biomaterials 2017, 145, 168–177. [Google Scholar] [CrossRef] [PubMed]
- Payen, V.L.; Porporato, P.E.; Baselet, B.; Sonveaux, P. Metabolic changes associated with tumor metastasis, part 1: Tumor ph, glycolysis and the pentose phosphate pathway. Cell. Mol. Life Sci. 2016, 73, 1333–1348. [Google Scholar] [CrossRef]
- Folgering, H. The pathophysiology of hyperventilation syndrome. Monaldi Arch. Chest Dis. 1999, 54, 365–372. [Google Scholar]
- Jo, J.; Lee, C.H.; Kopelman, R.; Wang, X.D. In vivo quantitative imaging of tumor ph by nanosonophore assisted multispectral photoacoustic imaging. Nat. Commun. 2017, 8, 1–10. [Google Scholar] [CrossRef] [Green Version]
- Miao, Q.Q.; Lyu, Y.; Ding, D.; Pu, K.Y. Semiconducting oligomer nanoparticles as an activatable photoacoustic probe with amplified brightness for in vivo imaging of ph. Adv. Mater. 2016, 28, 3662–3668. [Google Scholar] [CrossRef]
- Knox, H.J.; Hedhli, J.; Kim, T.W.; Khalili, K.; Dobrucki, L.W.; Chan, J. A bioreducible n-oxide-based probe for photoacoustic imaging of hypoxia. Nat. Commun. 2017, 8, 1–9. [Google Scholar] [CrossRef] [PubMed] [Green Version]
- Multhaup, G.; Schlicksupp, A.; Hesse, L.; Beher, D.; Ruppert, T.; Masters, C.L.; Beyreuther, K. The amyloid precursor protein of alzheimer’s disease in the reduction of copper(ii) to copper(i). Science 1996, 271, 1406–1409. [Google Scholar] [CrossRef] [PubMed]
- Liu, S.T.; Howlett, G.; Barrow, C.J. Histidine-13 is a crucial residue in the zinc ion-induced aggregation of the a beta peptide of alzheimer’s disease. Biochemistry 1999, 38, 9373–9378. [Google Scholar] [CrossRef] [PubMed]
- Rose, F.; Hodak, M.; Bernholc, J. Mechanism of copper(ii)-induced misfolding of parkinson’s disease protein. Sci. Rep. 2011, 1, 11. [Google Scholar] [CrossRef] [PubMed] [Green Version]
- Wang, S.; Sheng, Z.; Yang, Z.; Hu, D.; Long, X.; Feng, G.; Liu, Y.; Yuan, Z.; Zhang, J.; Zheng, H.; et al. Activatable small-molecule photoacoustic probes that cross the blood-brain barrier for visualization of copper(ii) in mice with alzheimer’s disease. Angew. Chem. Int. Ed. Engl. 2019, 58, 12415–12419. [Google Scholar] [CrossRef] [PubMed]
- Zhang, C.; Gao, R.; Zhang, L.; Liu, C.; Yang, Z.; Zhao, S. Design and synthesis of a ratiometric photoacoustic probe for in situ imaging of zinc ions in deep tissue in vivo. Anal. Chem. 2020, 92, 6382–6390. [Google Scholar] [CrossRef]
Figure 1.
(a) A general block diagram of PAT mechanism. (b) Absorption coefficient spectra of biological tissue chromophores Adapted from http://omlc.ogi.edu accessed on 20 June 2021. (c) UV-vis spectrum of dyes Adapted from http://omlc.ogi.edu accessed on 20 June 2021.
Figure 1.
(a) A general block diagram of PAT mechanism. (b) Absorption coefficient spectra of biological tissue chromophores Adapted from http://omlc.ogi.edu accessed on 20 June 2021. (c) UV-vis spectrum of dyes Adapted from http://omlc.ogi.edu accessed on 20 June 2021.

Figure 2.
(a) Preparation of croconaine dye (C1) (adopted from [42]). (b) PA imaging contrast polymers (P2–P5) produced by reacting croconic acid with various monomers. (Adopted from [42]) (c) Normalized absorbance peaks of C1 (black), P2 (blue), P3 (green), P4 (yellow) and P5 (red) (adopted from [42]). (d) PA signal intensity for polymers P2–P5 at 820 nm (adopted from [42]). (e) Conjugation of P1 using BDT and BBT. DSPE-PEG 2000 was added to produce P1 NPs (adopted from [43]). (f) Absorbance peak for the P1 NPs (adopted from [43]). (g) PA imaging of a tumor using P1 NPs (adopted from [43]). (h) PA imaging of a skull using P1 NPs (adopted from [43]). (i) Morphology of P-TT and P-DPP (adopted from [39]). (j) Normalized absorbance peak of P-TT and P-DPP (adopted from [39]). (k) PA imaging of a mouse liver using P-DPP (adopted from [39]). (l) Absorbance peak for WSCP dots, DPP-mPEG and DPP-mPEG-2Br (adopted from [44]). (m) PA imaging of a mouse tumor using WSCP dots (adopted from [44]). (n) PAI intensity over time for WSCP dots (adopted from [44]).

Figure 3.
(a) Size, morphology and (b) absorbance spectrum of BTPETTQ NPs (adopted from [45]). (c) PA image of a sentinel lymph node (SLN) using BTPETTQ NPs (adopted from [45]). (d) Synthesis of DPP-BDT NPs (adopted from [46]). (e) Size distribution and (f) absorbance peak of DPP-BDT NPs (adopted from [46]). (g) PA image of HeLa tumor-bearing mice 0–72 h after the application of DPP-BDT NPs (adopted from [46]). (h) Fabrication of TB1-RGD dots (adopted from [47]). (i) Size distribution, morphology and (j) absorbance spectrum of TB1-RGD dots (adopted from [47]). (k) PA image of a brain tumor using TB1-RGD dots (adopted from [47]). (l) Size, morphology and (m) absorbance spectrum of D1-encapsulating micelles (adopted from [48]). (n) PA image of anatomy sections from mice using D1-encapsulating micelles (adopted from [48]).

Figure 4.
(a) Formation of pH-sensitive smart AuNPs (SANs) with pH-responsive citraconic amides ligands (adopted from [66]). (b) PA image using SANs with HeLa cells from 0 to 48 h (adopted from [66]). (c) PA image using SANs for a mouse tumor (adopted from [66]). (d) Conjugation of Cu-THQNPs (adopted from [67]). (e) PA image of cancer using CU-THQNPs (adopted from [67]). (f) Absorbance spectra of AU and AU@MIL-88(Fe) (adopted from [68]). (g) Synthesis of AU@MIL-88(Fe) (adopted from [68]). (h) PA image of a mouse tumor with AU@MIL-88(Fe) 12 h after the i.v. injection (adopted from [68]). (i) Size, morphology and (j) absorbance spectrum of AU@PPDI/PEG (adopted from [69]). (k) PA image using AU@PPDI/PEG 30 h after the i.v. injection (adopted from [69]). (l) Size, morphology and (m) absorbance spectrum of pAuAgNPs (adopted from [70]). (n) PA image using pAuAgNPs (adopted from [70]).

Figure 5.
(a) Schematic illustration of PA imaging with photodynamic and photothermal therapy using NAB NPs (adopted from [96]). (b) PA image of a mouse tumor with NAB NPs (adopted from [96]). (c) TIC image indicating the increase in temperature with NAB NPs and a xenon lamp and (d) the corresponding plot (adopted from [96]). (e) Change in the tumor volume after photothermal therapy with NAB NPs (adopted from [96]). (f) Absorbance spectra of SPNV and SPNT (adopted from [97]). (g) Change in the tumor volume following treament with SPNV and SPNT (adopted from [97]). (h) PA image and (i) TIC image of mouse tumors treated with SPNV and SPNT (adopted from [97]). *** P < 0.001, ** P < 0.01, * P < 0.05.

Figure 6.
(a) Synthesis of Cu-Ag2S/PVP NPs (adopted from [98]). (b) Absorbance spectrum of Cu-Ag2S/PVP NPs (adopted from [98]). (c) Relative tumor volume following treatment with Cu-Ag2S/PVP NPs (adopted from [98]). (d) TIC image of a mouse treated with Cu-Ag2S/PVP NPs (adopted from [98]). (e) PA image of a mouse tumor with Cu-Ag2S/PVP NPs (adopted from [98]). (f) Synthesis of dAUNPs and aggregation with a 405-nm laser (adopted from [100]). (g) PA image and (h) TIC images of mouse tumors with dAuNPs, a 405-nm laser and an NIR laser (adopted from [100]). (i) Relative tumor volume following treatment with dAuNPs exposed to a 405-nm laser and an NIR laser (adopted from [100]). (j) Synthesis of DSPNs using self-assembly and a schematic illustration of DSPN-based therapy (adopted from [101]). (k) TIC images and (l) biodistribution images of a mouse tumor with DSPNs (adopted from [101]). (m) Relative tumor volume following treatment with DSPNs (adopted from [101]). *** P < 0.001, ** P < 0.01, * P < 0.05.

Figure 7.
(a) Synthesis of F3-SNARF-PAA NPs (adopted from [104]). (b) Absorbance spectrum of F3-SNARF-PAA NPs according to the pH (adopted from [104]). (c) Schematic illustration of photoacoustic signals from F3-SNARF-PAA NPs in acidic and basic conditions (adopted from [104]). (d) pH sensing using PA imaging in an acidic mouse tumor region (adopted from [104]). (e) Normalized absorbance spectra of Hb and NPs at various pH levels (adopted from [104]). (f) Absorbance spetrum of SONs at various pH levels (adopted from [105]). (g) Synthesis of SONs (adopted from [105]). (h) pH sensing using PA imaging in a mouse HeLa tumor with SONs (adopted from [105]). (i) Ratio of R5.5/R7.4 in pH imaging (adopted from [105]).

Figure 8.
(a) Synthesis of HyP-1 (adopted from [106]). (b) Principles underlying the behavior of HyP-1 (adopted from [106]). (c) PA images of a tumor-bearing mouse model with HyP-1 (adopted from [106]). (d) PA images of a murine hindlimb ischemia model with HyP-1 (adopted from [106]). (e) Absorbance spectra of RPS1 and RPS1-Cu (adopted from [110]). (f) in vivo copper (ll) imaging of Alzheimer’s disease model mice with RPS-1 (adopted from [110]). (g) Synthesis of CR-1 (adopted from [111]). (h) Principles underlying Zn2+ ion imaging (adopted from [111]). (i) Absorbance spectra of CR-1 and CR-1+Zn2+ at various concentrations (adopted from [111]). (j) In vivo Zn2+ imaging of deep tissue with CR-1 (adopted from [111]).

Publisher’s Note: MDPI stays neutral with regard to jurisdictional claims in published maps and institutional affiliations. |
© 2021 by the authors. Licensee MDPI, Basel, Switzerland. This article is an open access article distributed under the terms and conditions of the Creative Commons Attribution (CC BY) license (https://creativecommons.org/licenses/by/4.0/).
Share and Cite
MDPI and ACS Style
Jung, J.; Jang, Y.; Kim, M.; Kim, H. Types/Applications of Photoacoustic Contrast Agents: A Review. Photonics 2021, 8, 287. https://0-doi-org.brum.beds.ac.uk/10.3390/photonics8070287
AMA Style
Jung J, Jang Y, Kim M, Kim H. Types/Applications of Photoacoustic Contrast Agents: A Review. Photonics. 2021; 8(7):287. https://0-doi-org.brum.beds.ac.uk/10.3390/photonics8070287
Chicago/Turabian StyleJung, Jaehun, Yongho Jang, Mingyun Kim, and Hyuncheol Kim. 2021. "Types/Applications of Photoacoustic Contrast Agents: A Review" Photonics 8, no. 7: 287. https://0-doi-org.brum.beds.ac.uk/10.3390/photonics8070287
Note that from the first issue of 2016, this journal uses article numbers instead of page numbers. See further details here.