1. Introduction
Ethylene oxide (EtO) is a key raw material for ethylene glycol production, which is the main component in antifreeze and a precursor for polyesters and polyurethanes [
1]. EtO is also used as a sterilizer and a disinfectant [
1]. In 2013, the annual volume for worldwide EtO production was estimated to be 2.5 × 10
10 kg [
2,
3], catalyzed via the selective ethylene (Et) oxidation reaction (Et epoxidation) by α-Al
2O
3 supported 100–1000 nm Ag nanoparticles in the industrial processes [
1]. The desired epoxidation pathway is the following: 2Et + O
2 → 2EtO, ΔH = −105 kJ/mol. However, full oxidation, which is much more exothermic, also occurs: Et + 3O
2 → 2CO
2 + 2H
2O, ΔH = −1327 kJ/mol; and EtO + 2.5O
2 → 2CO
2 + 2H
2O, ΔH = −1223 kJ/mol.
Due to its technological importance, Et epoxidation on Ag surfaces has been the subject of many studies in the literature. In an earlier study, it was suggested that the reaction mechanism includes only atomic oxygen as an adsorbed species [
4]. Since CO
2, H
2O, Et, and EtO are all short-lived species on Ag surfaces, this model could be accurate. In traditional surface science studies performed under ultra-high vacuum (UHV) conditions, there was a great deal of interest in the O/Ag system because various types of adsorbed oxygen species, oxygen-induced surface reconstructions, and oxides can form depending on the conditions. A detailed list of these studies can be found in ref. [
5]. More relevant for heterogeneous catalysis are the studies that were performed at room temperature (RT) and above, and in the presence of O
2 with the goal of identifying various types of oxygen that can be present on the surface and how they play a role in catalyst’s performance [
5,
6,
7,
8,
9,
10,
11,
12]. According to these studies, the two most important oxygen species have different binding energies (BE) in an x-ray photoelectron spectroscopy (XPS) spectrum: a peak at 528.1–528.4 eV that is usually associated with oxygen in the reconstructed surface structures, and another peak at 530.2–530.7 eV that is typically ascribed to atomic oxygen either on the surface or in the tetrahedral and octahedral subsurface sites [
5]. The latter interpretation, however, was recently contested and atomically adsorbed oxygen was assigned to a peak at around 528 eV, which does participate in epoxidation, but the major contributor in epoxidation is still ‘electrophilic oxygen’ at 530.2–530.7 eV with a debated structure [
9,
11]. It has been claimed that when an Ag surface covered with the first type of oxygen is annealed in the presence of Et, it only produces the undesired products of the full-oxidation reaction, i.e., CO
2 and H
2O, hence the name ‘nucleophilic oxygen’ [
13,
14,
15]. However, when the same annealing procedure is applied to Ag that is rich in second type of oxygen species, some EtO is also produced in addition to CO
2 and H
2O [
8,
13,
15,
16].
Ambient pressure (AP)-XPS studies that were performed in the presence of both Et and O
2 gases also resulted in a peak in the O 1s region which is attributed to the second type of oxygen species [
17,
18,
19]. However, surface carbonate species also produce a peak in a similar energy range at around 530.0–530.8 eV [
17,
19,
20,
21,
22,
23,
24]. The carbonate species should also produce a peak at 287.3–288.1 eV, which could be used to distinguish it from adsorbed oxygen (as we discuss below, this is not straightforward). One problem associated with AP-XPS experiments is that the measurements chambers are often contaminated from previous experiments, because most AP-XPS setups are in shared user facilities. In fact, in ref. [
6,
19], exposing Ag surfaces to pure O
2 gas resulted in the build-up of the carbonate-like species on the surface, which should have not formed in “clean” setups. We should also mention that in the studies performed so far, the total pressure was 1 mbar and below [
17,
19]. This is not a major issue, because even Ag single crystals are active in forming EtO even at such low pressures [
8,
15,
17]. However, as we will show in this work, further increasing the pressure to 10 mbar can modify the type of adsorbed species.
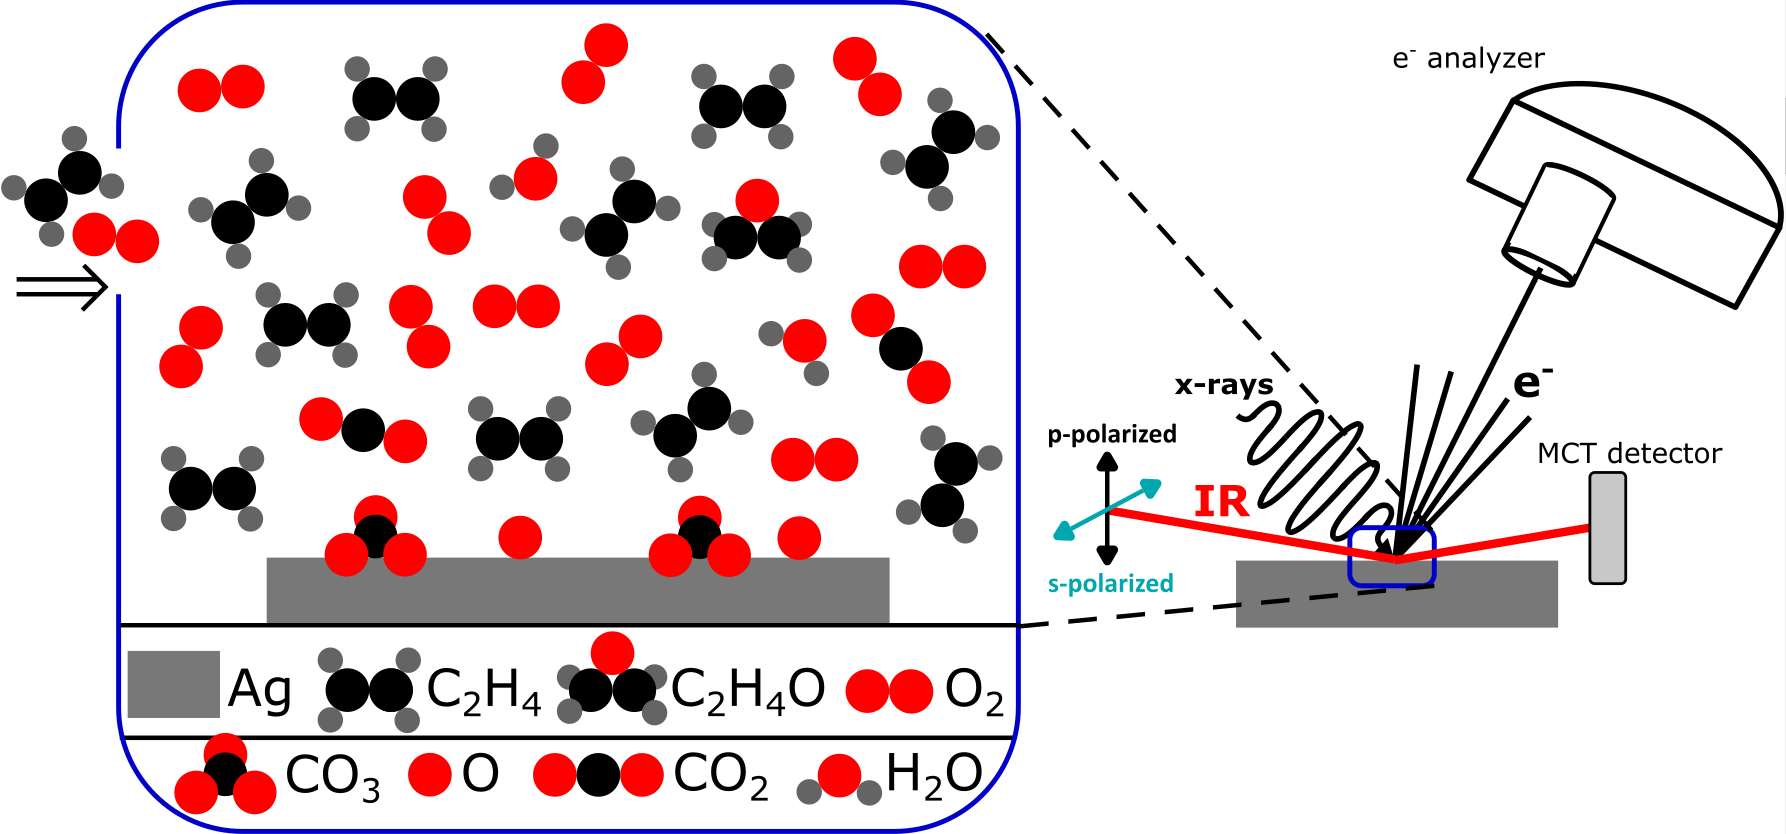
In this work, we performed polarization modulation infrared reflection absorption spectroscopy (PM-IRRAS) and AP-XPS measurements in the presence of Et and O
2 gases. Although the optimized process temperature for epoxidation in industrial practice is 220–280 °C, we performed our experiments at a lower temperature range. This is because the industrial process utilizes chemisorbed chlorine as a promoter, which increases the selectivity towards EtO (likely through changing the nature of adsorbed oxygen species) [
25,
26,
27]. The lower temperature range chosen in this study should result in a higher selectivity towards EtO at the expense of lower overall activity. Our total pressure range is 6 to 11 mbar, which is 3 orders of magnitude lower than the industrial conditions. Thus, in our study conditions the activity is much lower and the selectivity is still towards the undesired CO
2; nevertheless, it is known that some EtO could form under such mild conditions [
8,
17]. Moreover, some of the trends observed in the present study can be extrapolated to higher pressures. We chose Ag(111) as our model catalyst, as the close-packed (111) facets are abundant in industrial catalysts that are 100–1000 nm in size.
Using PM-IRRAS, we found that the only molecular species on the surface is carbonate, which is present in the 10 mbar pressure range, and below a certain temperature that depends on the partial pressure of Et and O2. It produces a single peak at around 1400 cm−1, which suggests a polydentate carbonate with three equivalent C-O bonds that are likely to form at the step edges and other defect sites. Its initial formation requires the temperature to be increased above RT in certain conditions. We do not observe carbonate species in the 1 mbar pressure range. In our AP-XPS measurements, other species are also present on the surface, but these can only be due to cross-contamination or x-ray beam-induced effects. The surface remains largely metallic in all conditions studied here, i.e., no oxides, surface oxides, Ag2CO3 salt, or oxygen-induced surface reconstructions form.
2. Materials and Methods
Both PM-IRRAS and AP-XPS setups consist of three vacuum chambers that are separated by gate valves, dedicated to sample introduction, sample preparation, and measurement. The base-pressures of the preparation and measurements chambers were around 1 × 10⁻¹⁰ mbar in the PM-IRRAS setup, while it was around 1 × 10⁻⁹ mbar in the AP-XPS setup. Base-pressure of the PM-IRRAS setup was recovered prior to each measurement set via conventional bake-out, whereas the base-pressure in the AP-XPS chamber increased to 2 × 10⁻⁸ mbar after the first set of measurements due to residual H2O vapor and hydrocarbons desorbing from the chamber walls. Since H2O is any case a byproduct of the reaction, this was not a major concern.
PM-IRRAS measurements were performed in the mid-IR range using a Nicolet iS50 FTIR spectrometer at a resolution of 4 cm
−1 and a custom-built optical assembly on one side of the measurement chamber, and a ZnSe focusing lens and an MCT detector on the other side [
28]. Slow-modulated IR light exiting the auxiliary output of the spectrometer was guided into the measurement chamber using an optical assembly that consists of Au-coated flat and parabolic mirrors, a linear wire-grid polarizer, and a ZnSe photoelastic modulator (PEM, Hinds Instruments II/ZS50). Both the spectrometer and optical assembly are placed inside dry nitrogen purged boxes to minimize ambient H
2O and CO
2. Measurement chamber is separated from the outside ambient using UHV-sealed KBr viewports. Both the incident and reflected IR beams are at an 80° angle from the surface normal. The linear polarizer generates p-polarized light, which is then fast-modulated with PEM to generate varying p-polarized and s-polarized light (the PEM oscillates at ω
m = 50 kHz). The collected IR light has a DC-component, which is only slow modulated and an AC-component, which is double modulated. These components are split into two different channels with the use of a band-pass filter. The AC-interferogram is demodulated with a demodulator (SSD-100, GWC Technologies) at 2ω
m frequency. After accumulation of at least 1000 scans, the Fourier transforms of the two interferograms are processed to yield J
2(φ
0)*(R
p − R
s) and R
p + R
s single-beam spectra on metallic samples (J
2 is a second order Bessel function of the maximum dephasing φ
0 introduced by PEM, R
p and R
s are the reflectance for p-polarized light and s-polarized light, respectively). The ratio of these two single-beam spectra J
2(φ
0)*(R
p − R
s)/(R
p + R
s) is our PM-IRRAS signal, which cancels out all contributions from the gas-phase species, including those from ambient air, because gas-phase species have no polarization dependence. Only p-polarized light can be absorbed by adsorbed species on metals, and only for vibration modes with a dynamic dipole moment perpendicular to the surface, which is called the surface selection rule of IRRAS. In this study, we used φ
0 of both 1000 cm
−1 and 2600 cm
−1 to cover a wide range of frequencies. We subtract the spectra obtained in UHV from the spectra obtained in the presence of gases to remove the Bessel function.
AP-XPS measurements were performed at the VERSOX beamline B07-C of the Diamond Light Source (DLS), United Kingdom [
29]. The AP-XPS measurement chamber includes a differentially pumped ambient pressure hemispherical electron analyzer (SPECS Phoibos 150 NAP) and a differentially pumped beamline interface that provides soft x-rays, enabling measurements in the presence of gases up to ~10 mbar. The beamline exit slits were opened to 500 µm in the non-dispersive direction and 12.5 µm in the dispersive direction, which results in a spot size of approximately 100 µm × 100 µm. Photon energies (E
hυ) were chosen as 530 eV, 610 eV, and 770 eV, respectively, for the C 1s, Ag 3d, and O 1s regions, to obtain a photoelectron kinetic energy (E
kin) of roughly 250 eV for each element. All spectra were acquired with a pass energy of 10 eV. The combined energy resolution of the analyzer and beamline is <0.4 eV for the energies used herein, as the full width at half maximum (fwhm) of the Ag 3d
5/2 was measured to be 0.42 eV. Similarly, fwhm of the gas-phase Et and O
2 were measured as 0.39 eV and 0.37 eV, respectively. Such a high energy resolution is necessary to unequivocally assign the chemical state of Ag. The binding energy calibration for each spectrum was done by measuring the −1 to 6 eV binding energy range after each region, because the calibration of the monochromator of the beamline can vary slightly each time the photon energy is changed. Whenever apparent, we set the Fermi-level (E
f) to 0 eV. However, this was not always possible because of strong attenuation of intensity and lack of intense d-states near E
f. In such cases, we used the onset of the Ag 4d states as reference, and calibrated each spectrum by setting it to 3.96 eV [
30]. At each condition, we collected a survey scan at E
hυ = 770 eV, to make sure that changes in pressure or temperature did not cause highly undesired contaminants such as S, K, P, I, F, Ca, Cl., etc. to appear on the sample surface (
Figure S1). In addition, we especially checked for potential S-impurities by scanning the S 2p region. We also collected a few survey scans with E
hυ = 1200 eV to check for contaminants with high binding energies such as Na.
The Ag(111) sample (from MaTeck, 99.9999% purity, orientation accuracy <0.1°) was cleaned with conventional Ar+ sputtering (1 keV, 15 min) and annealing (500 °C, 5–10 min) cycles in the preparation chambers before each set of experiments. Prior to PM-IRRAS measurements the sample cleanliness was checked with Auger–Meitner electron spectroscopy (AES) and low-energy electron diffraction (LEED) measurements, whereas prior to AP-XPS measurements the sample cleanliness was confirmed by a reference XPS measurement at the base pressure. Peaks related to potential contaminants (S, Cl, C, O, etc.) were below the detection limit.
We performed our PM-IRRAS experiments at Et and O2 partial pressures of 5 mbar + 5 mbar, 10 mbar + 1 mbar, and 1 mbar + 10 mbar. Et was dosed prior to O2. In each case, starting from RT, we increased the temperature with steps of 50–60 °C until no carbonate peak was apparent, and once this temperature was reached, we started cooling the sample back to RT. Suppliers and purities of the gases used in the PM-IRRAS experiments are the following: O2, 99.999% purity, from SIAD; Et, 99.999% purity, from Advanced Specialty Gases.
AP-XPS experiments were performed at a lower total pressure of 6 mbar, with Et and O2 partial pressures of 3 mbar + 3 mbar and 1 + 5 mbar. We chose a lower total pressure because the signal attenuates significantly due to scattering of low kinetic energy photoelectrons with the gas-phase molecules, rendering it impossible to measure at a total pressure of 10–11 mbar. For instance, we measure the signal attenuation as 3.6 times at 1 mbar of Et, 14 times at 3 mbar of Et, and 78 times in the presence of 3 mbar of Et and 3 mbar of O2. We did not perform AP-XPS at Et-rich conditions, because it was not possible to avoid excessive amounts of hydrocarbons building up on the surface. The same temperature range was used in AP-XPS and PM-IRRAS experiments. Suppliers and purities of the gases used in the AP-XPS experiments are the following: O2, 99.9998% purity and Et, 99.5% purity; both from Air Products.
The electron energy analyzer on the B07-C AP-XPS has a differentially pumped lens system to separate the mbar pressure conditions of the analysis chamber from the UHV of the hemispherical electron energy analyzer. The entrance aperture of the analyzer system is a cone with a 0.3 mm diameter hole, which is located 0.2–0.3 mm from the sample surface (the optimal distance to ensure that the local pressure above the sample of interest is not significantly different from that of the rest of the chamber). A mass spectrometer (Hiden HMT RC) is located in the vacuum space immediately behind this entrance aperture, pumped by a 685 L/s turbo pump. This arrangement results in extremely efficient pumping of any reaction products formed in the region of the sample which is probed by the x-rays directly in front of the analyzer. The crystal under investigation has a diameter of 12 mm so any reactions at the edges of it or from the sample holder itself will have a negligible effect on the products sampled by the analyzer mass spectrometer. For instance, we perform thermal desorption spectroscopy (TDS) measurements with a very similar geometry (same sample and sample holder size, similar orifice diameter, similar sample-to-nozzle distance) and have negligible desorption peaks from the sides of the crystal. We collected mass spectra of masses m/z = 18, 28, 32, 43, and 44 during equal partial pressure conditions while simultaneously collecting AP-XPS spectra.
3. Results and Discussion
We start our analysis by determining the chemical state of the surface, as the chemical state can affect the nature of adsorbed species and thereby their peak position.
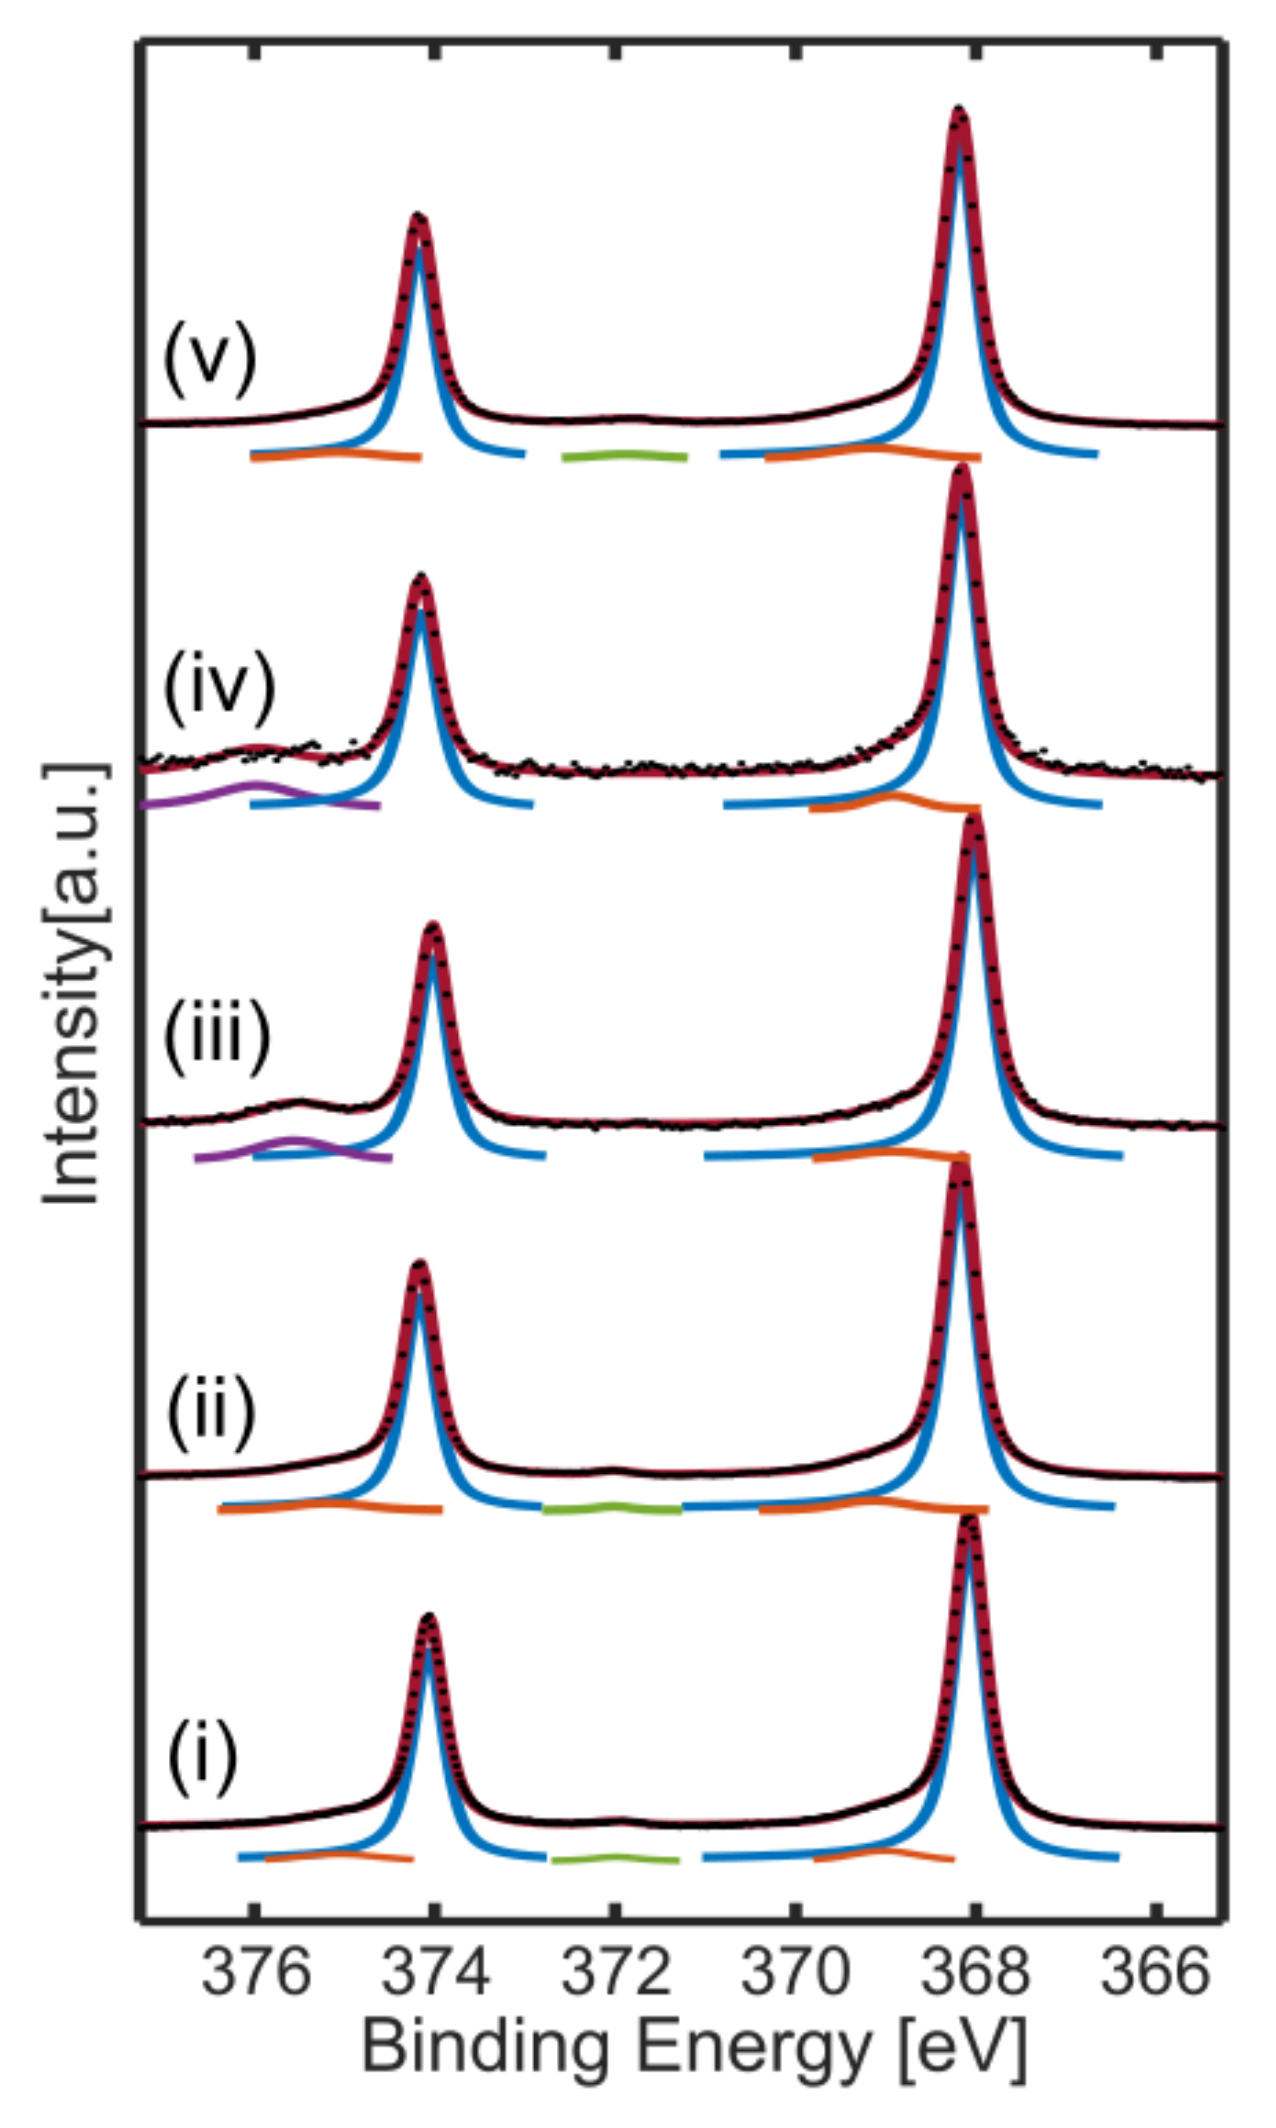
Figure 1 shows a set of representative Ag 3d spectra that are used to determine the chemical state of Ag surface. According to ref. [
31], there is no discernible surface core-level shift for the Ag 3d region, therefore we fit the Ag 3d
5/2 and Ag 3d
3/2 peaks as a single doublet positioned at 368.1 eV and 374.1 eV, for bare Ag(111) in UHV (blue lines in
Figure 1i). We used Gaussian–Lorentzian lineshapes with an asymmetry of 0.04. However, as mentioned in refs. [
5,
30], this lineshape does not provide a perfect fit in the higher binding energy side. Therefore, additional peaks were placed ~1 eV above the main peaks, which are shown with orange lines in
Figure 1i. The plasmonic loss features are positioned at around 371.9 eV and 377.9 eV in the binding energy scale (indicated by green lines).
Figure 1ii–iv show the Ag 3d spectra in presence of 3 mbar Et at RT, a mixture of 3 mbar Et and 3 mbar O
2 at RT, and a mixture of 3 mbar Et and 3 mbar O
2 at 140 °C, respectively. In all conditions, the main Ag 3d
5/2 and Ag 3d
3/2 peaks can be fit with exactly the same lineshape used for metallic Ag reference acquired in UHV. Because of the ~2 orders of magnitude attenuation of intensity in the presence of 6 mbar gas, some of the low-intensity peaks lie in the noise level. An additional peak appears at the high binding energy side due to the energy losses to excitation of the gas-phase molecules by the photoelectrons (purple peaks). AP-XPS spectra were also collected for O
2-rich conditions (5 mbar O
2, 1 mbar Et) at up to 140 °C, and 1:1 conditions (3 mbar O
2, 3 mbar Et) at up to 200 °C, as shown in
Figures S2 and S3 of the Supporting Information (SI), respectively. Similar to the previous case, the main Ag 3d
5/2 and Ag 3d
3/2 peaks can be fit with exactly the same lineshape used for metallic Ag.
In the presence of pure O
2 at 140 °C, the Ag(111) surface gets covered with a Ag(111)-p(4 × 4)-O surface reconstruction [
5,
32], which produces an Ag 3d
5/2 peak at 367.6–367.7 eV that is not observed in any of the spectra presented in
Figure 1. This peak is not unique to a specific structure; it is more general, and it should be observed whenever an ordered O-induced reconstruction is present [
5,
33]. We can thus conclude that no such ordered structure is present on the surface under Et oxidation reaction conditions studied in this work. Similarly, formation of Ag
2O or AgO would have produced an Ag 3d
5/2 peak at lower binding energy than that of metallic Ag [
34,
35,
36], which is not observed in this study. As discussed below, we also do not observe any peak below 530 eV in the O 1s region, which is typically produced by oxides and O-induced reconstructed surfaces of Ag [
5,
36].
Similar to oxides, Ag
2CO
3 formation also produces an Ag 3d
5/2 peak that is around 0.7 eV below the metallic peak [
34,
35,
36,
37]. Such a peak was observed numerous times in the literature, as CO
2 and O
2 present in the air is well-documented to react with each other and form Ag
2CO
3 on Ag surfaces [
35,
36,
38]. As we show below with IR spectroscopy, carbonate also forms on the Ag(111) surface under the Et oxidation reaction condition studied here. However, we do not observe any Ag
2CO
3 features in the Ag 3d region. The reason behind this difference lies in different chemical nature of carbonates: in ref. [
35,
36,
37], Ag
2CO
3 is formed from an initially oxidized Ag, therefore it is likely a thick carbonate layer; whereas a ‘surface carbonate’ with a low coverage forms in the present case, that is, CO
32− adsorbed on Ag(111). In other AP-XPS studies under Et oxidation reaction conditions, no peak was assigned to carbonate in the Ag 3d region despite peaks ascribed to carbonate in the O 1s and C 1s regions [
17,
19]. We should mention that in ref. [
19], there is a peak positioned at 0.4 eV lower energy than the metallic Ag 3d
5/2, which is weak in intensity and is assigned as Ag
δ−. We do not observe such a feature in our spectra. We should also mention that according to combined theoretical and experimental work in ref. [
20], a surface carbonate formation should result in a negative shift in the Ag 3d peak position, which we do not observe (
Figure 1). We believe this discrepancy between our measurements and the literature are due to two reasons which we further discuss below [
19,
20]: low coverage of carbonate forming on the surface under the reaction conditions chosen in the present case, and hydrocarbon contaminants covering the active sites for carbonate formation.
For detecting the molecularly adsorbed surface species, we relied only on the PM-IRRAS spectra. This is because PM-IRRAS has three advantages over AP-XPS: the signal attenuation due to gas-phase molecules is far less significant, AP-XPS setups are usually in shared user facilities and therefore suffer from cross-contamination, and both Et and O2 molecules might get dissociated by high flux density of x-rays. The disadvantage of PM-IRRAS is that it cannot be used to detect atomic species, because the vibrational frequencies of metal-oxygen and metal-carbon bonds are below the cut-off of KBr windows. For such species, we rely on the AP-XPS spectra.
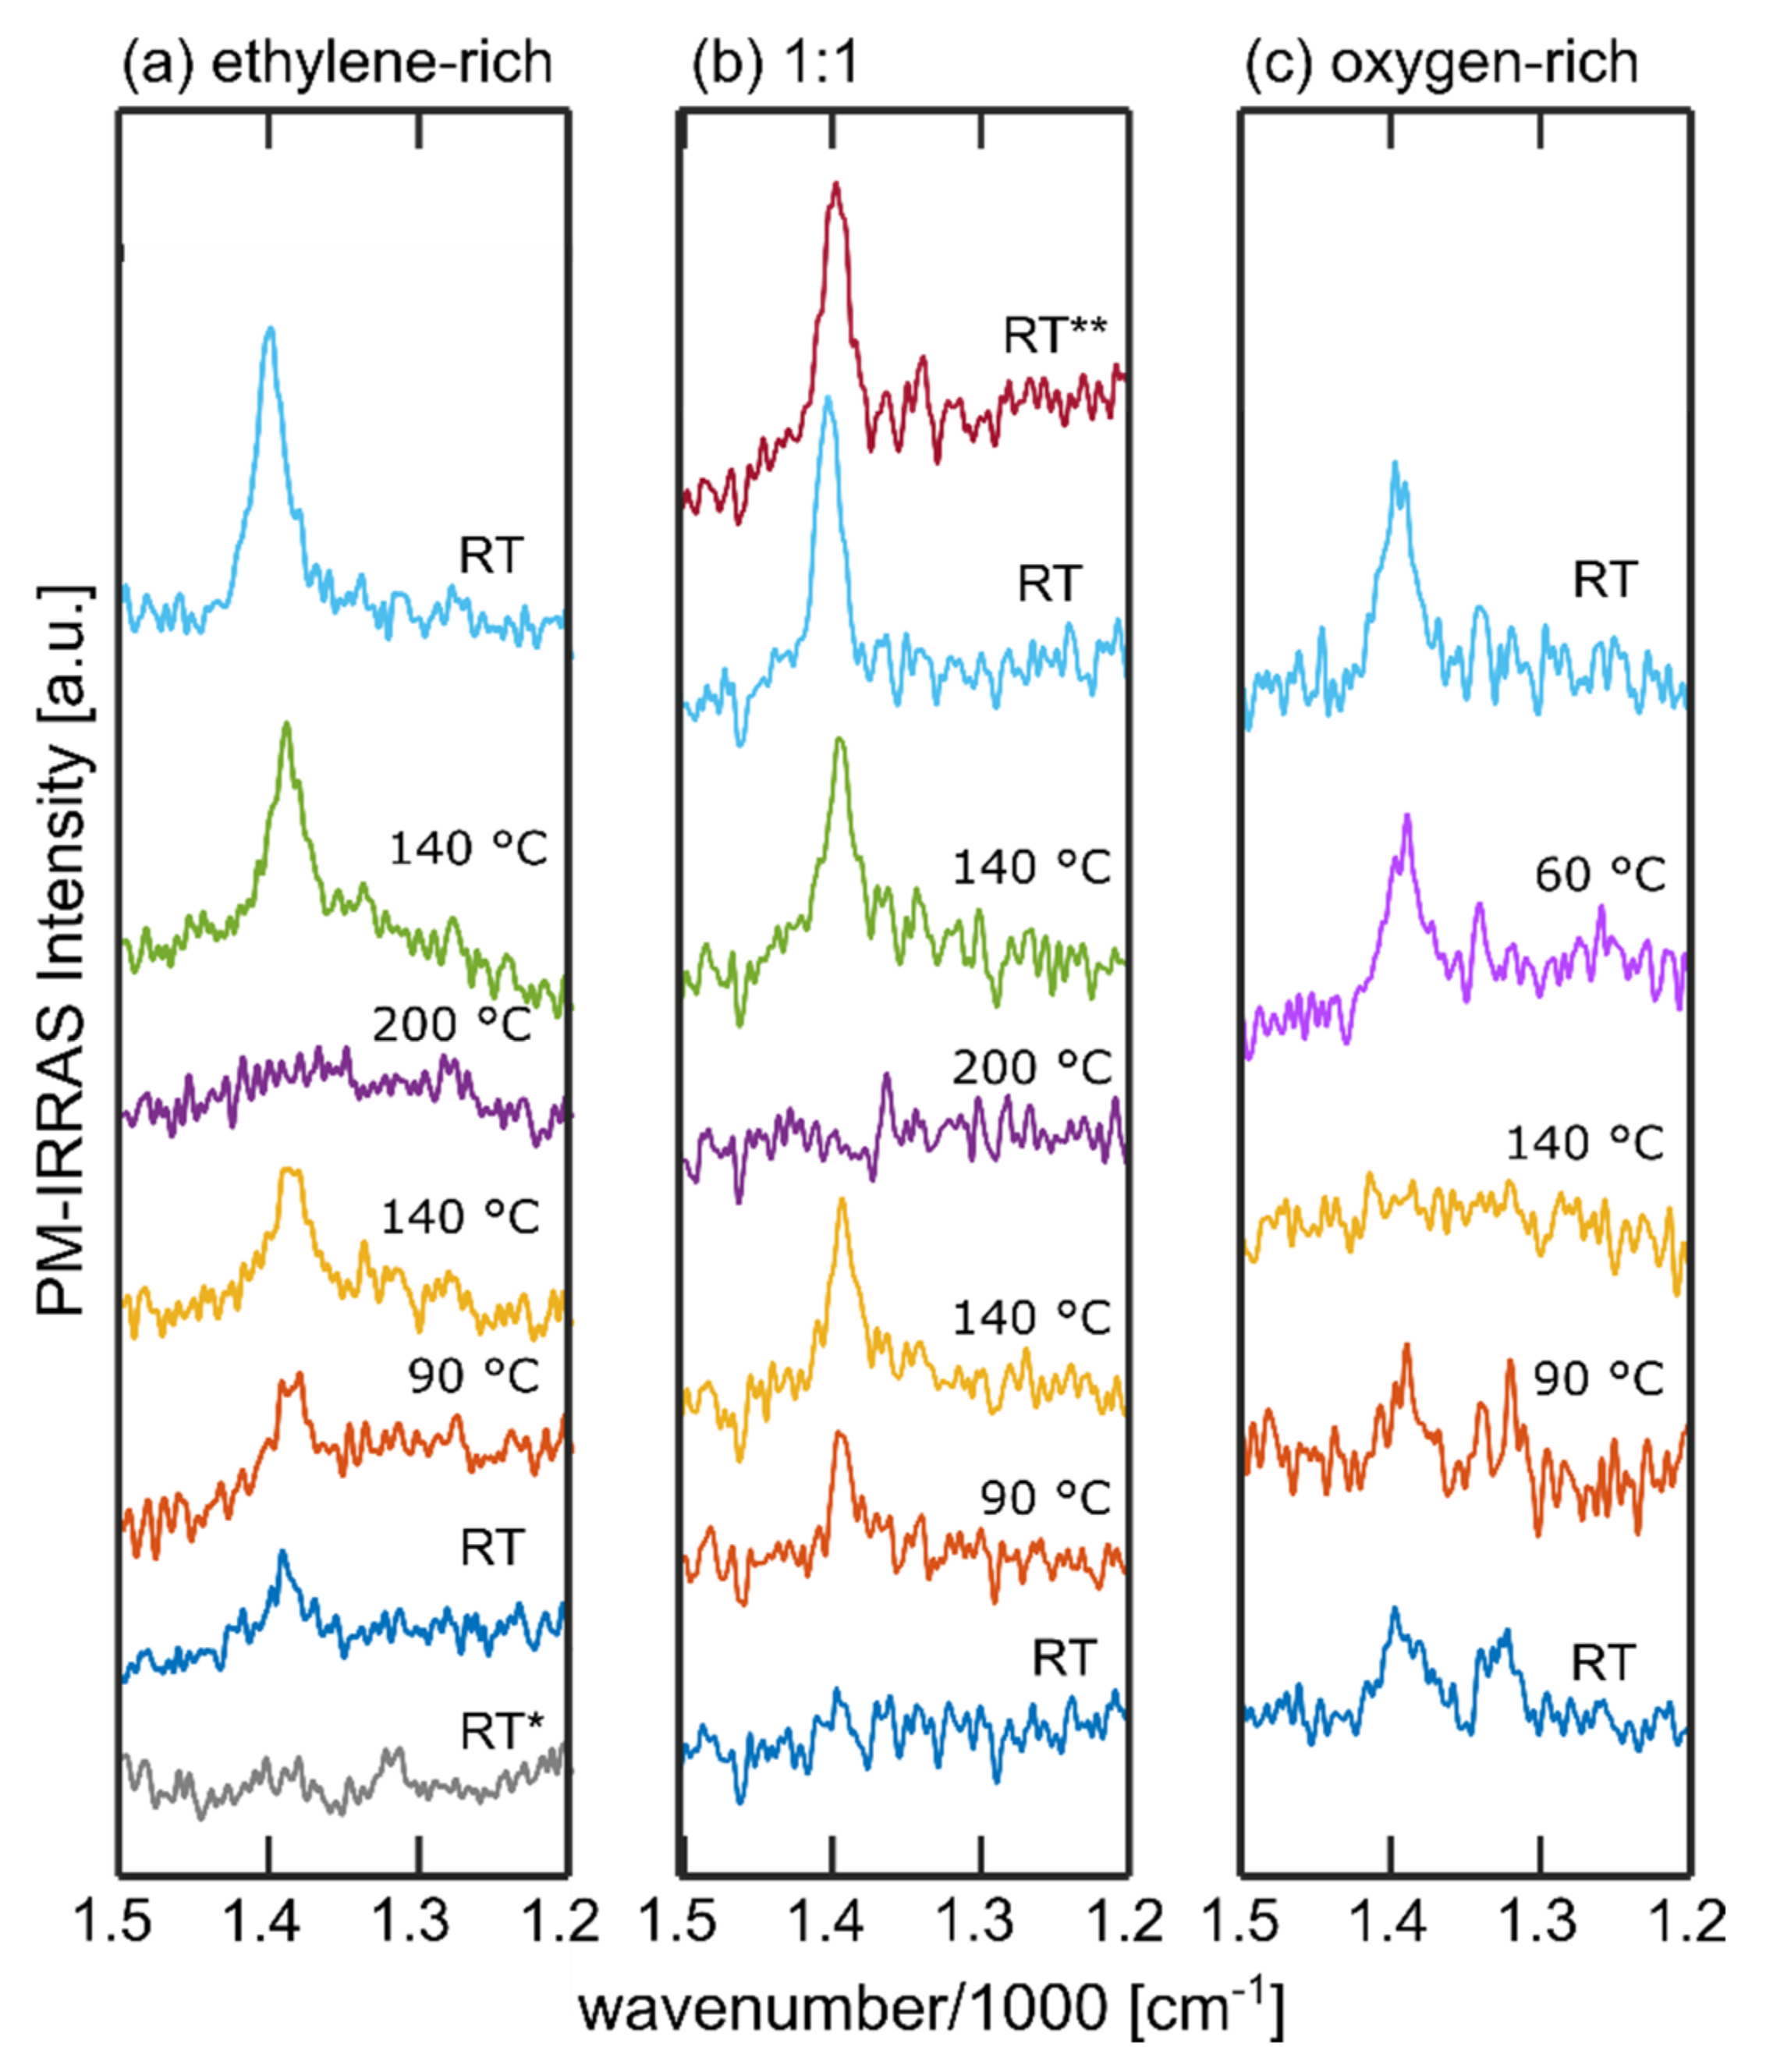
Figure 2 shows the 1200–1500 cm
−1 region of the PM-IRRAS spectra obtained at various temperatures in an Et-rich environment (
Figure 2a), for equal partial pressures of Et and O
2 (
Figure 2b), and in an O
2-rich environment (
Figure 2c). The spectra are presented in such a way that the first acquired spectrum is shown in the bottom, and the last acquired spectrum is shown at the top. As mentioned before, we start measuring at RT, increase the temperature until no peak is apparent, and then decrease the surface temperature back to RT. In some cases, we also measure the spectra in the presence of pure Et prior to mixing O
2 (referred to as RT* in
Figure 2), and in some cases we measure after pumping away both gases (referred to as RT** in
Figure 2). Other than the peaks in the 1200–1500 cm
−1 region, there is no peak that we can detect in the 800–3500 cm
−1 range (
Figure S4). In all the spectra shown in
Figure 2, the most prevalent peak (usually the only peak) is at around 1400 cm
−1, which can be attributed to the O-C-O stretching mode of adsorbed carbonate species [
39]. We do not observe any O-H or C-H related bands, or in general any other peaks due to Et, EtO, CO
2, or H
2O
; most likely their coverage is below the detection limit of PM-IRRAS. We should also mention that carbonates have other vibrationally excited states [
39], but deformation modes are much weaker in intensity compared to stretching modes.
The carbonate peak positions in our IR spectra change with the experimental conditions (
Figure 2), which suggests that carbonate interacts with the surface, i.e., it is a surface-bound species. The fact that carbonate produces a single peak indicates that it is in the form of a polydentate with three equivalent C-O bonds [
40]. Finally, the peak intensities we obtain are low, which could be related to low coverage of surface carbonate and/or the C-O bonds are almost parallel to the surface. NEXAFS studies in ref. [
19] performed with polarized x-rays suggest that the surface carbonate on Ag(111) has flat-lying C-O bonds. In our case, we cannot refer to the carbonate’s configuration as completely flat-lying, as such a configuration would have resulted in no intensity in an IRRAS spectrum due to surface selection rules. We conjecture that the surface carbonate structure consists of 3 oxygen atoms anchored to the surface, while 1 carbon atom is bound to these oxygen atoms.
The carbonate coverage is pressure dependent. When we use a total pressure of 2 mbar instead of 10 mbar, with the same 1:1 partial pressure ratio, we do not observe any peak related to carbonate around 1400 cm
−1 in the RT-200 °C temperature range (
Figure S5). If we extrapolate our results to the bar pressure range used in industrial processes, one could expect the Ag surfaces to be fully covered with carbonates. The effect of chlorine or other promoters on carbonate coverage is hardly explored in the literature; therefore, whether a high coverage of surface carbonate is formed on industrial catalysts eludes us at present.
We sometimes observe an additional peak at around 1322 cm
−1, which disappears once the sample temperature reaches ~80 °C and does not reappear once the sample is cooled back to RT. This peak could be attributed to the symmetric O-C-O stretching frequency of surface formate species that typically appear in the 1330–1350 cm
−1 frequency range on Ag(111) [
41]. Formate is indeed a typical contaminant in ambient pressure experiments [
42]. Its dissociative desorption temperature on Ag(111) was found to be roughly around 75 °C in ref. [
43]. However, lack of any C-H stretching frequency (
Figure S4) rules out the possibility of formate contamination. Therefore, we conclude that the small peak we observe at 1322 cm
−1 is also related to the O-C-O stretching frequency of surface carbonate, but with a different configuration from carbonates that produce the peak at ~1400 cm
−1.
Carbonate formation on Cu surfaces in the presence of high pressures of CO
2 were previously studied with the PM-IRRAS technique in ref. [
43]. The authors found a pressure-dependent peak at 1435 cm
−1 and a vacuum-persistent, stationary peak at 1315 cm
−1, both attributed to the O-C-O stretching frequency of polydentate carbonate. According to the density functional theory (DFT) calculations in the same study, a nearly flat polydentate configuration is only possible at the steps and defect sites [
43]. In accordance with this study, we attribute our peaks at around 1400 cm
−1 and 1322 cm
−1 to carbonate formed on the steps and other defect sites. Since the density of such adsorption sites is very low on Ag(111), it could explain weak IR-peak intensities and the lack of shift in Ag 3d peak position in the present study in connection to the low carbonate coverage. The authors of ref. [
43] also associate the higher wavenumber peak with the high local coverage of carbonate on such low-coordinated sites, which leads to repulsive adsorbate-adsorbate interactions and thereby slightly raised adsorption configuration of surface carbonate.
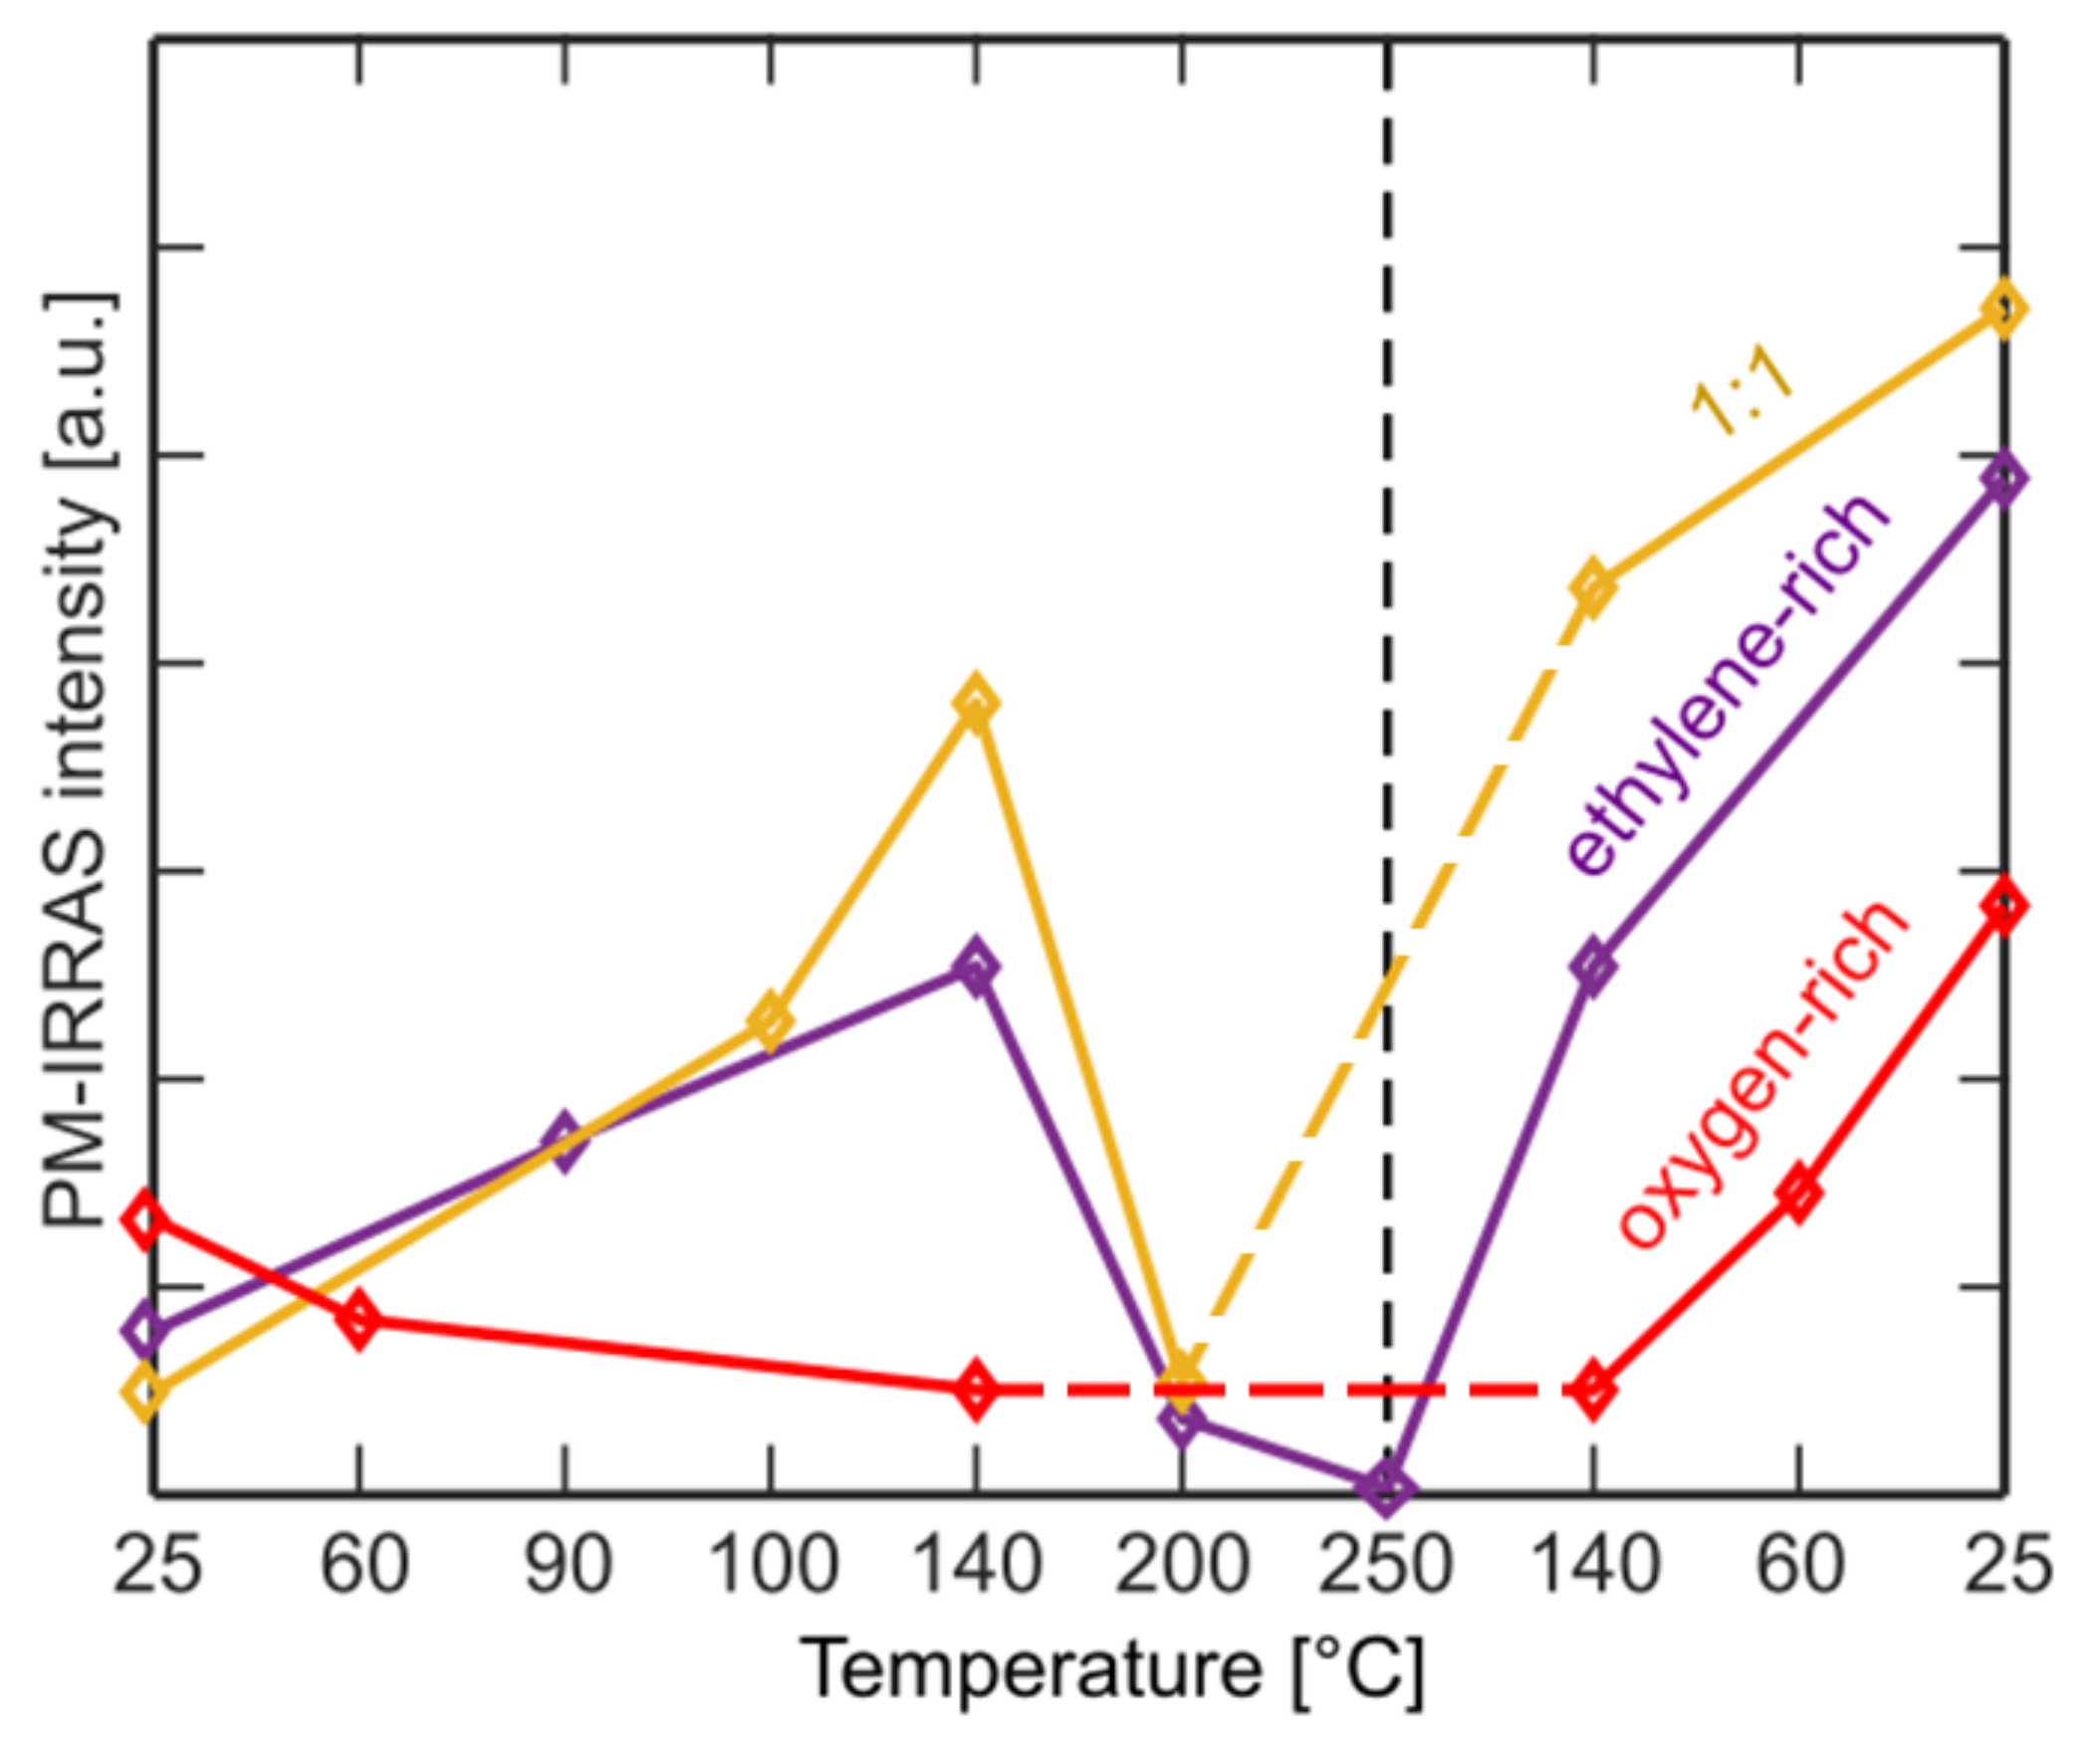
Figure 3 shows the ~1400 cm
−1 peak intensity in different conditions studied in this work. The observed trends in Et-rich and equal partial pressure conditions are similar to each other, whereas the intensity curve in O
2-rich conditions shows a different trend. For the first two cases, initial carbonate intensity is low at RT and increases as the sample temperature is increased to 140 °C due to increased activity. However, the intensity of the carbonate peak decreases at 200 °C, which we believe to be related to the instability of the surface carbonate around this temperature [
13,
44]. In other words, despite the carbonate production rate is higher at high temperatures, so is the rate of dissociative desorption as either CO or CO
2. Apparently, the latter is higher, hence lower surface coverage. As the sample is cooled down from 200 °C back to 140 °C, the intensity of the surface carbonate species is recovered. Further cooling down to RT results in even a higher carbonate intensity, which in return suggests that carbonates are stable at lower temperatures. They are also stable at RT once the gases are evacuated. In O
2-rich conditions the carbonate coverage is below our detection limit already at 140 °C. This could be related to co-adsorption of oxygen-species, which occupies the Et adsorption sites.
We cannot use the C 1s and O 1s regions of our AP-XPS spectra to confirm our PM-IRRAS results because of contamination issues and/or beam-induced effects that become significantly more pronounced in our pressure range [
42,
45,
46]. Moreover, the peak intensities are very low due to ~2 orders of magnitude signal attenuation and potentially low-coverage (for instance, O 1s and C 1s peaks are merely visible in the survey scans in
Figure S1). Nevertheless, for the sake of completeness, we present analyzed C 1s and O 1s spectra in the
supplementary information (Figures S2 and S3). One important outcome of the AP-XPS spectra in the O 1s region is that there is no significant peak below 530 eV that can be attributed to silver oxides, which is in line with the Ag 3d results shown in
Figure 1. Another important feature is the peak between 530 eV and 531 eV, which does not coincide with any typical contamination peaks, and as discussed in the introduction, was attributed to both atomically adsorbed oxygen and surface carbonates in the literature [
17,
18,
19,
20,
21,
22,
23,
24]. A statistical analysis of the peak position for atomic oxygen reported in the literature yields 530.3 eV on average with 0.25 eV standard deviation [
5,
6,
8,
13,
16,
17,
19,
47]. The same analysis for the carbonate peak position also yields 530.3 eV on average with 0.25 eV standard deviation [
17,
19,
20,
21,
22,
23]. However, the literature data might be misleading because it is very difficult to detect the carbon peak of carbonate with an Al-Kα source due to the low photoionization cross section, that is, carbonate might be mistaken as atomic oxygen in many cases. In fact, in two recent papers it was claimed that adsorbed oxygen on Ag(111) actually produces a peak at around 528 eV [
9,
11], and previous interpretations are likely incorrect due to the aforementioned reason. Should this be the case, this would then mean that the atomic oxygen coverage is below our detection limit (roughly 1% of a monolayer) in all the conditions studied in this work. Due to this disagreement in the reference studies in the literature, we cannot draw definite conclusions regarding atomic oxygen covering the surface under the experimental conditions chosen in this study. We can, however, conclude that the peak between 530 eV and 531 eV is partly due to the surface carbonate and partly due to the desired electrophilic oxygen (with debated structure) that results in EtO formation.
Figure S6 shows the changes in the peak position of the ~530 eV peak as function of temperature for both the equal partial pressure and O
2-rich conditions. In our measurements, the convoluted ~530 eV peak appears at lowest binding energy at 140 °C for O
2-rich conditions and at 200 °C for equal partial pressure conditions (
Figure S6), which are the conditions where the carbonate peak in IR spectra diminish (
Figure 3). We also observe the peak shifting to binding energies as high as 530.8 eV once the sample cools down, which corresponds to accumulation of carbonates according to IR spectra (
Figure 3). We can thus conclude the carbonate’s peak position in the O 1s region is higher than that of electrophilic oxygen, which is in agreement with studies that assign both peaks in the same set of spectra [
17,
19].
In view of the O 1s and C 1s spectra, we argue that the lack of surface carbonate (lower binding energy species) in the Ag 3d region shown in
Figure 1 is partially due to hydrocarbon contaminants covering the active step sites where surface carbonate forms. Other reason is the small carbonate peak in the Ag 3d region being overshadowed by the large metallic Ag peak despite the high energy resolution.
In the very detailed catalytic performance study in ref. [
47], the Ag(111) surface was found to have 1% conversion and 2% selectivity towards EtO at 240 °C in the mbar pressure range. Since our experimental conditions are slightly different, we collected mass spectra of the gases that leak to the first pumping stage of the AP-XPS pre-lens system in the presence of 3 mbar Et and 3 mbar O
2 in order to verify that the surface is active. Both
m/
z = 28 and
m/
z = 32 signals, which are the base peak positions of Et and O
2, exceed our detection limit (1.1 × 10
−6 mbar, uncalibrated; but they are detected with another mass spectrometer on the second pumping stage). We observed a noticeable increase in intensity of the H
2O peak at
m/
z = 18 and CO
2 peak
m/
z = 44, with increasing temperature (
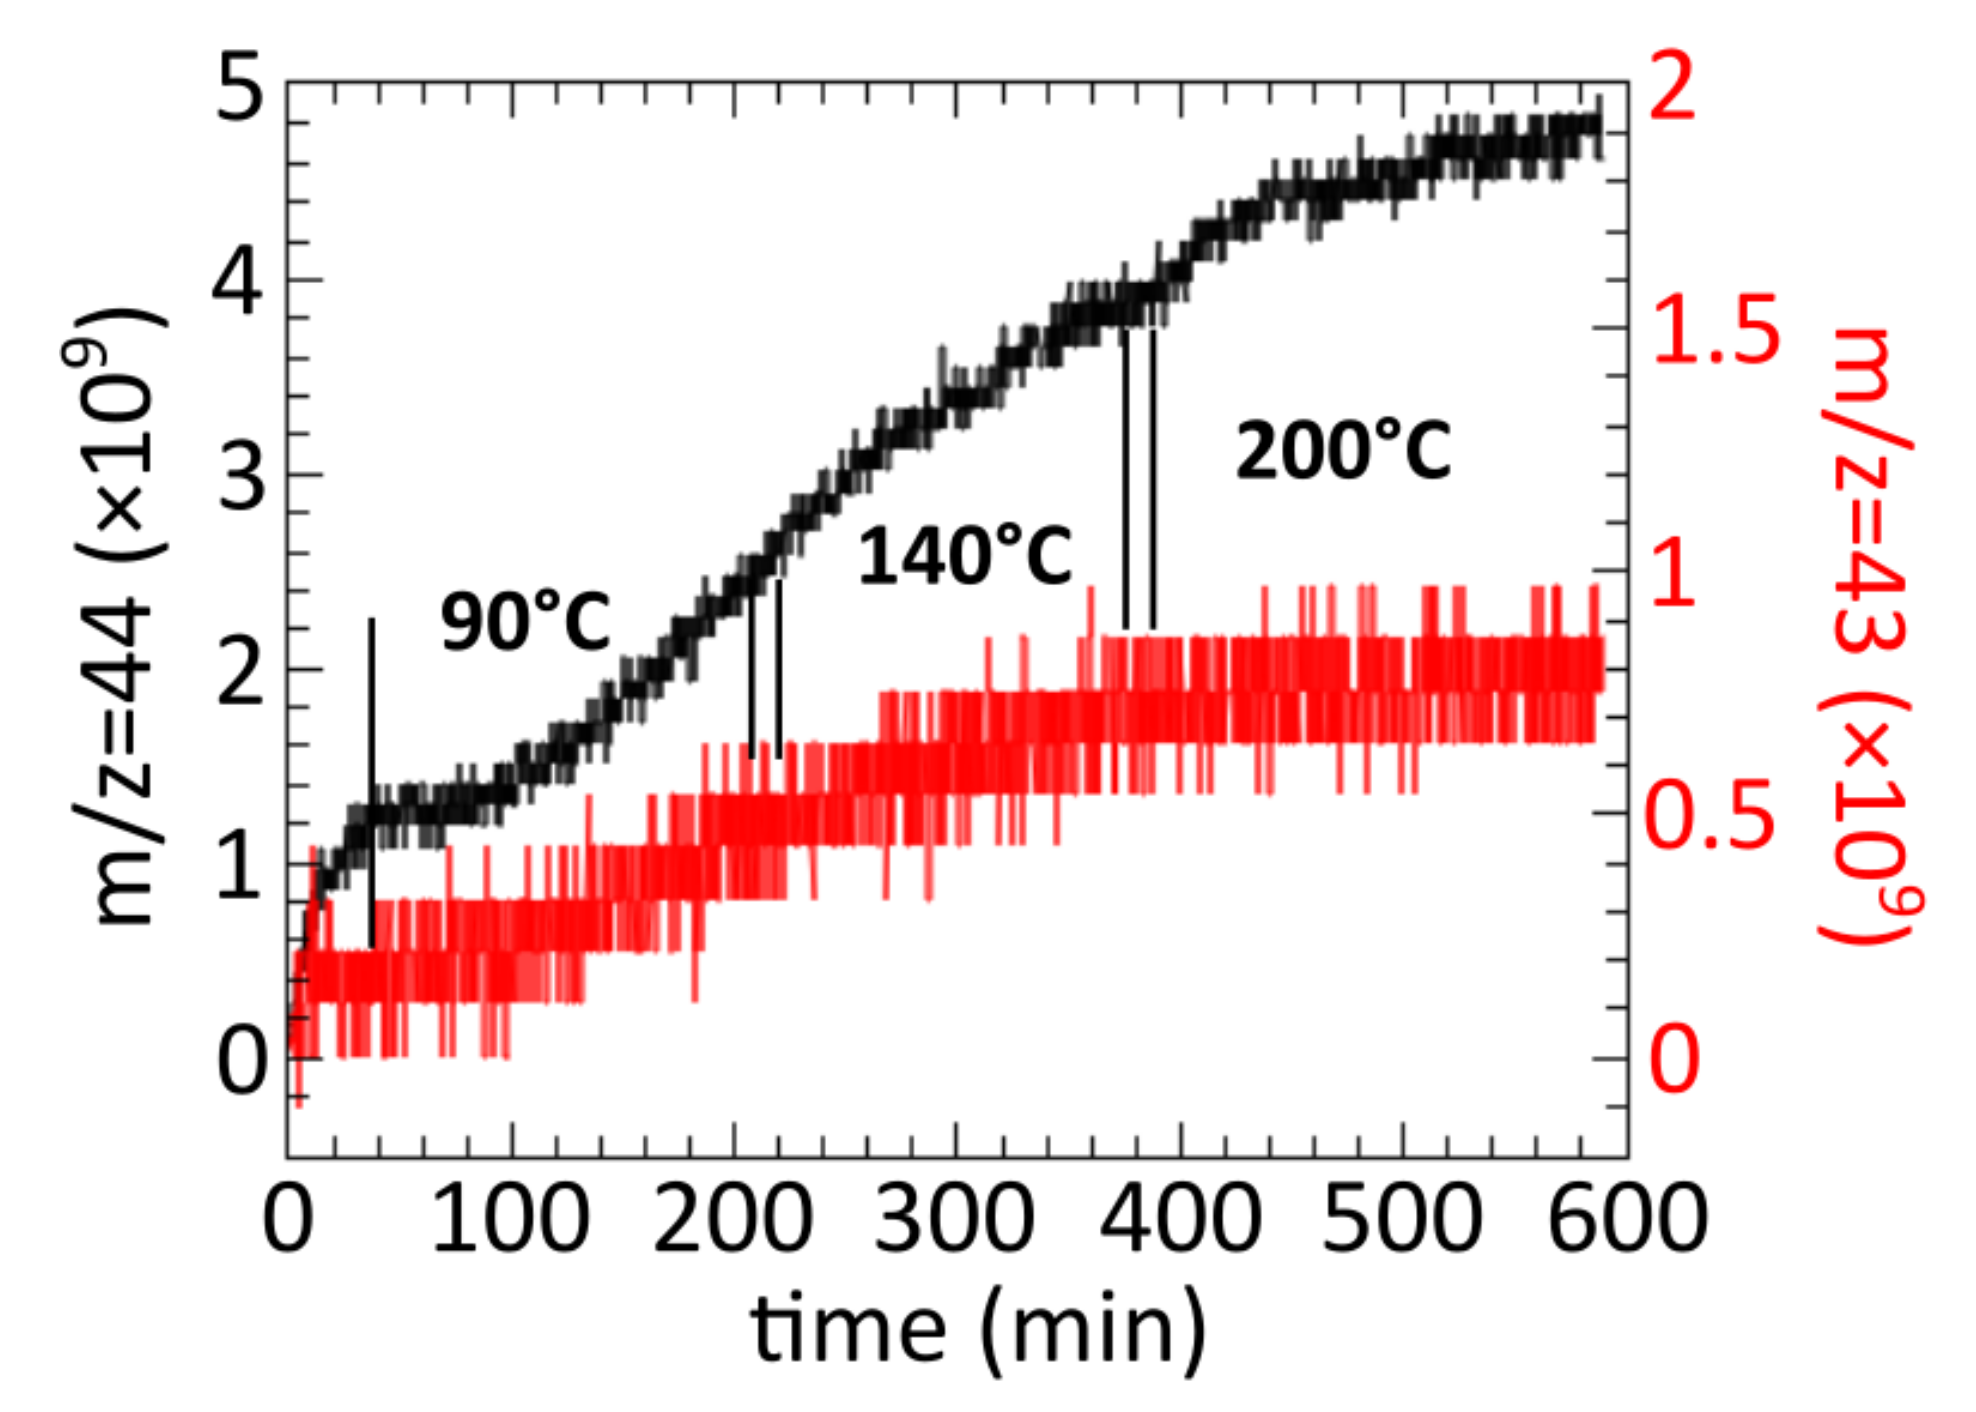
Figure S7). The uncalibrated partial pressures of both of these species are at least 2 orders of magnitude smaller than the partial pressure of the reactants. These peaks are partially produced by the full oxidation of ethylene on the surface, but oxidation of hydrocarbon contaminants also contributes to their intensity. We also observed a very slight but steady increase in the
m/
z = 43 peak, which was attributed to EtO in similar gas-leaking experiments performed by other authors (
Figure 4) [
8]. We should note here that the same authors later suggested that the
m/
z = 43 peak could also be produced by acetaldehyde (AcH), which is a full oxidation product [
48]. They suggested to use the intensity ratio of
m/
z = 43 and
m/
z = 42 peak to distinguish EtO from AcH [
48], which is not possible in the present study due to very low signal-to-noise ratio of
m/
z = 42. Based on
Figure 4, we can confirm that the Ag(111) surface is active, at least for the full oxidation reaction, in the conditions chosen for this spectroscopy study. We should also mention that in ref. [
17], Ag foil was found to have increased activity towards EtO formation at 200 °C and above due to dissociation of surface carbonates at this temperature range. We think the trends shown in
Figure 4 simply follow surface temperature, and there is no direct evidence between the carbonate coverage and surface activity. This is likely due to low carbonate coverage on the Ag(111) surface (weak IR features, no shift in Ag 3d) compared to the more active polycrystalline Ag surfaces that are rich in low-coordinated sites.
We performed an additional experiment to better understand the reaction pathway: We dosed 10 mbar ambient air into the IR measurement chamber. At RT right after dosing, the surface was covered with formate species that produced the peaks at around 1346 cm
−1 and 2819 cm
−1 (
Figure S8), which can be ascribed to the symmetric O-C-O stretching and C-H stretching, respectively [
49]. The absence of asymmetric O-C-O stretch peak in the 1530–1610 cm
−1 range in our spectra indicates bidentate bridging configuration [
41,
49], which was reported to appear at low surface coverages of formate on Ag(111) [
41]. A weaker feature at around 2907 cm
−1 is also present; in fact, the peaks at 2819 cm
−1 and 2907 cm
−1 are a Fermi resonance doublet with the latter one either due to a combination mode of the asymmetric O-C-O stretching and C-H bending or the overtone of C-H bending [
41,
49]. Peak positions for formate slightly differ in the present study compared to published values in the literature [
41,
49], as exact positions depend on coverage and presence of co-adsorbed species such as carbonates and oxygen. Such formate peaks appear due to the formic acid in air [
50]. At 90 °C and 140 °C, these peaks are replaced by the peak at around 1400 cm
−1 due to surface carbonate that forms due to oxidation of atmospheric CO
2 (
Figure S8). This shows that the same type of surface carbonate forms as a result of both Et oxidation and CO
2 oxidation, suggesting that Et is first converted into CO
2 during the former reaction.


