Article

Marker-Assisted Introgression and Stacking of Major QTLs Controlling Grain Number (Gn1a) and Number of Primary Branching (WFP) to NERICA Cultivars

1
Graduate School of Bioagricultural Sciences, Nagoya University, Nagoya 464-8601, Japan
2
Novel Gene Resources Laboratory, Plant Breeding Division, International Rice Research Institute, DAPO Box 7777, Metro Manila, Philippines
3
Graduate School, University of the Philippines Los Banos, College, Laguna 4031, Philippines
4
Current address: Department of Plant and Soil Science, College of Agricultural Sciences and Natural Resources, Texas Tech University, Lubbock, TX 79409, USA
5
Bioscience and Biotechnology Center, Nagoya University, Nagoya 464-8601, Japan
6
Applied Social System Institute of Asia, Nagoya University, Nagoya 464-8601, Japan
7
International Center for Research and Education in Agriculture, Nagoya University, Nagoya 464-8601, Japan
*
Author to whom correspondence should be addressed.
These two authors contributed equally.
Submission received: 18 March 2021 / Revised: 19 April 2021 / Accepted: 19 April 2021 / Published: 22 April 2021
(This article belongs to the Special Issue Genomics, Genetics, and Breeding for Rice Crop Improvement)

Abstract

:
The era of the green revolution has significantly improved rice yield productivity. However, with the growing population and decreasing arable land, rice scientists must find new ways to improve rice productivity. Although hundreds of rice yield-related QTLs were already mapped and some of them were cloned, only a few were utilized for actual systematic introgression breeding programs. In this study, the major yield QTLs Grain Number 1a (Gn1a) and Wealthy Farmer’s Panicle (WFP) were introgressed and stacked in selected NERICA cultivars by marker-assisted backcross breeding (MABB). The DNA markers RM3360, RM3452, and RM5493 were used for foreground selection. At BC3F4 and BC3F5 generation, a combination of marker-assisted selection and phenotypic evaluation were carried out to select lines with target alleles and traits. Further, genotyping-by-sequencing (GBS) was conducted to validate the introgression and determine the recurrent parent genome recovery (RPGR) of the selected lines. The Gn1a and/or WFP introgression lines showed significantly higher numbers of spikelets per panicle and primary branching compared to the recurrent parents. In addition, lines with Gn1a and/or WFP alleles were comparatively similar to the recurrent parents (RP) in most yield-related traits. This study demonstrates the success of utilizing yield QTLs and marker-assisted selection to develop and improve rice cultivars.

1. Introduction

Rice (Oryza sativa L.) is the main staple for almost half of the world’s population. Although mostly consumed in Asia, it is also considered the fastest-growing staple in Africa and Latin America. In sub-Saharan Africa (SSA), rice consumption has significantly increased over the years. This is due to factors such as economic growth, population growth, and changing consumer preference. In SSA countries such as Kenya, Nigeria, and Tanzania, people are changing their food preferences from tubers to rice as their income rises [1]. Given the tight supply–demand in rice across the globe and the decline in rice lands in Asia, being dependent on rice import is seen to be a significant threat to SSA’s food security. Therefore, it is necessary to develop and improve their existing rice varieties [2].
Most agronomic traits such as yield and yield-related components are polygenic and highly influenced by the environment. In rice, panicle is one of the crucial traits for improving rice grain yield. The vital components of rice panicle are the number of spikelets per panicle (NSPP), panicle length (PL), number of primary branches per panicle (PBPP), and number of secondary branches (SBPP) [3]. To understand the mechanism and nature of these agronomic traits, genetic and molecular dissection is needed [4].
The advent of genome sequencing has significantly influenced rice breeding studies. The completion of rice genome sequencing has led to the identification, isolation, and characterization of agronomically important traits and their application in varietal improvement [5,6]. To date, several quantitative trait loci (QTL) have been demonstrated to influence rice yield and yield-related traits such as heading date (Hd1, Ghd7, and Ehd1 [7,8,9]), grain size and weight (GS3, GW2, and GW5 [10,11,12]), grain number (Gn1a and DEP1 [13,14]), and panicle branching (WFP/IPA1 [15]). The major QTL grain number 1a (Gn1a) was first identified in the high-yielding rice variety Habataki. It encodes cytokinin oxidase/dehydrogenase (OsCKX2), an enzyme that degrades bioactive cytokinin. When the expression of OsCKX2 is reduced, cytokinin accumulates, resulting in an increase in the branching of inflorescence [13]. On the other hand, Wealthy Farmer’s Panicle (WFP) was first isolated from the rice line ST12. This gene encodes SQUAMOSA promoter binding protein-like 14 (OsSPL14), which is then regulated by microRNA OsmiR156. An increase in OsSPL14 expression during the vegetative stage suppresses tillering and enhances panicle branching. In rice line ST12, an abundance of OsSPL14 transcripts is regulated by a heritable epigenetic mechanism [15]. The major QTLs Gn1a and WFP were previously used in some breeding programs for improvement of the indica and japonica rice cultivars [16,17,18]. However, the effects of introgression and stacking of these QTLs in an interspecific background, such as NERICA, have yet to be evaluated.
The concept of backcrossing is to transfer the specific allele to the target locus. However, traditional backcrossing is laborious and requires more generations to obtain lines with high RPGR. The inclusion of DNA markers in the backcrossing program is called MABB. As compared to traditional backcrossing, MABB makes use of DNA markers that are tightly linked or flank the target locus [19]. This shifts the selection from phenotype to genotype which is far more efficient and accurate for selecting the target trait [20]. In addition, MABB greatly accelerates the identification and selection of lines with high RPGR, thereby reducing the number of required backcrossing. This method has been proven successful in some breeding programs for biotic stresses [21,22] and abiotic stresses [23].
Over the years, the use of DNA markers in breeding programs has transitioned from the traditional simple sequence repeat (SSR) to single nucleotide polymorphic (SNP) markers. The shift in marker preference is due to the advances in the field of sequencing technology [24,25]. GBS is a reduced representation library method which allows highly multiplexed sequencing of DNA samples. Compared to other genotyping approaches, GBS gives a greater number of markers and more depths per read which is advantageous for detecting heterozygous regions [26]. This method has been successfully used in plant breeding applications such as genetic resource development, QTL mapping, and background genome selection [27,28]. However, utilizing this method for yield improvement has remained marginal.
Introducing beneficial genes alone cannot efficiently improve the target traits due to limiting factors such as genetic and environmental effects [29]. To overcome these limiting factors, critical evaluation of the effects of the target allele in different genomic backgrounds is essential in breeding programs. Therefore, the main objectives of this study are the following: (i) improve the grain number of widely preferred NERICA and related cultivars by introgression of the major QTLs, Gn1a, and WFP, (ii) identify promising lines with improved grain number and primary branching, and (iii) evaluate the effect on the yield and yield-related components of rice. The data obtained in this study is part of the Wonder Rice Initiative for Food Security and Health (WISH) project [30].

2. Results

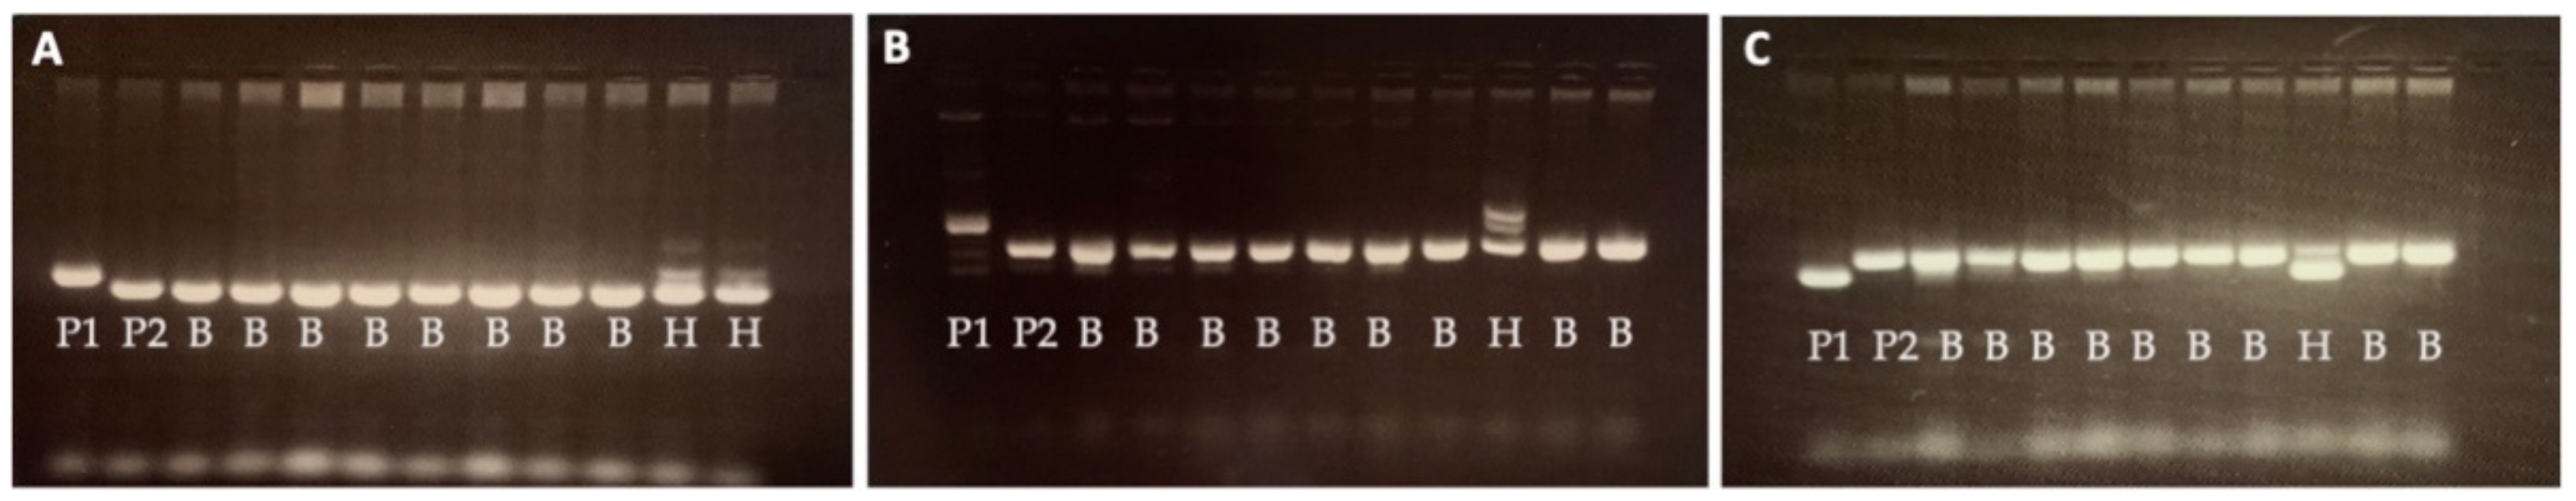
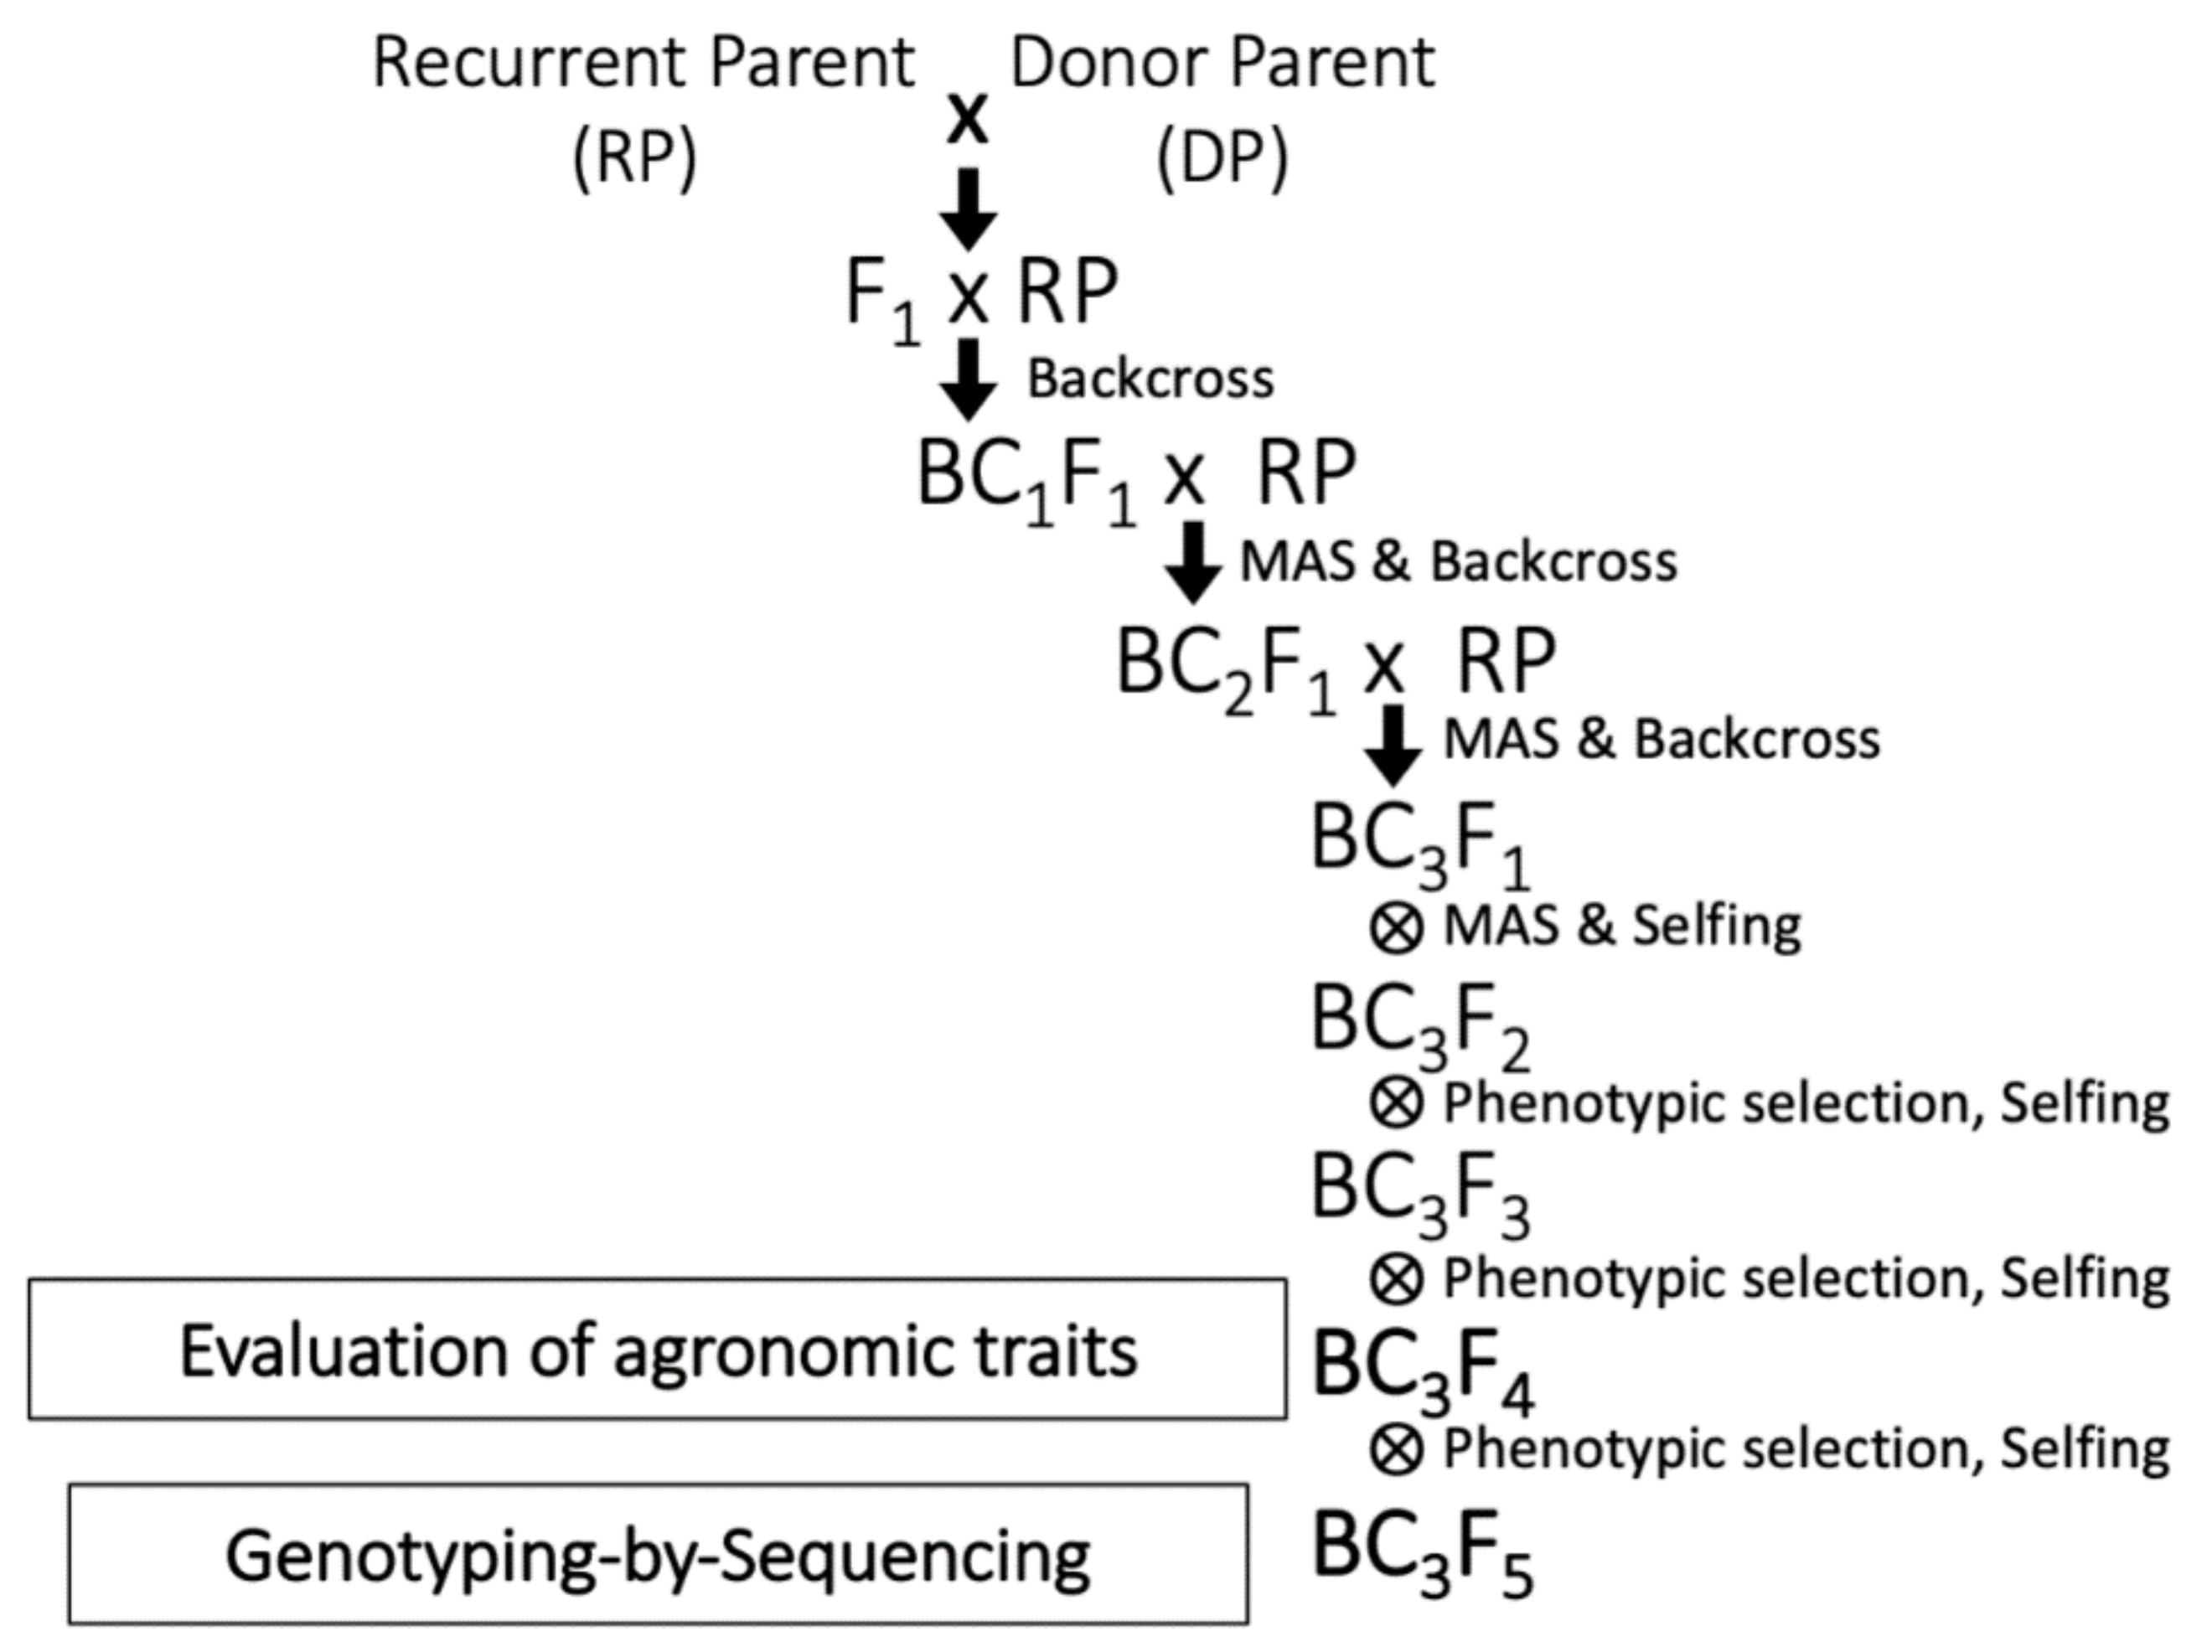
2.1. Marker-Assisted Backcrossing for Development of WISH Lines

The initial crosses of the materials were developed at Nagoya University, Japan. MABB was employed to transfer the major QTLs Gn1a and/or WFP from the donor lines ST12 [15] and ST6 [31] to NERICA and WAB cultivars. The RM3360, which is tightly linked to Gn1a, and RM3452 and RM5493, which flank the WFP locus [32], were used for foreground selection. Progeny at BC1F1 generation were shipped to the International Rice Research Institute (IRRI) for further backcrossing and generation advancement. The selected BC1F1 plants were advanced to BC3F1 and subsequently followed through selfing generations to identify plants carrying homozygous alleles at the target locus. The first two lanes on the gel images (Figure 1) represent the recurrent and donor parent genotypes, respectively. At BC3F4, using the RM3360 (Figure 1A), RM 5493 (Figure 1B), and RM 3452 (Figure 1C), lines with homozygous genotypes were evaluated for target traits and further genotyped using GBS.

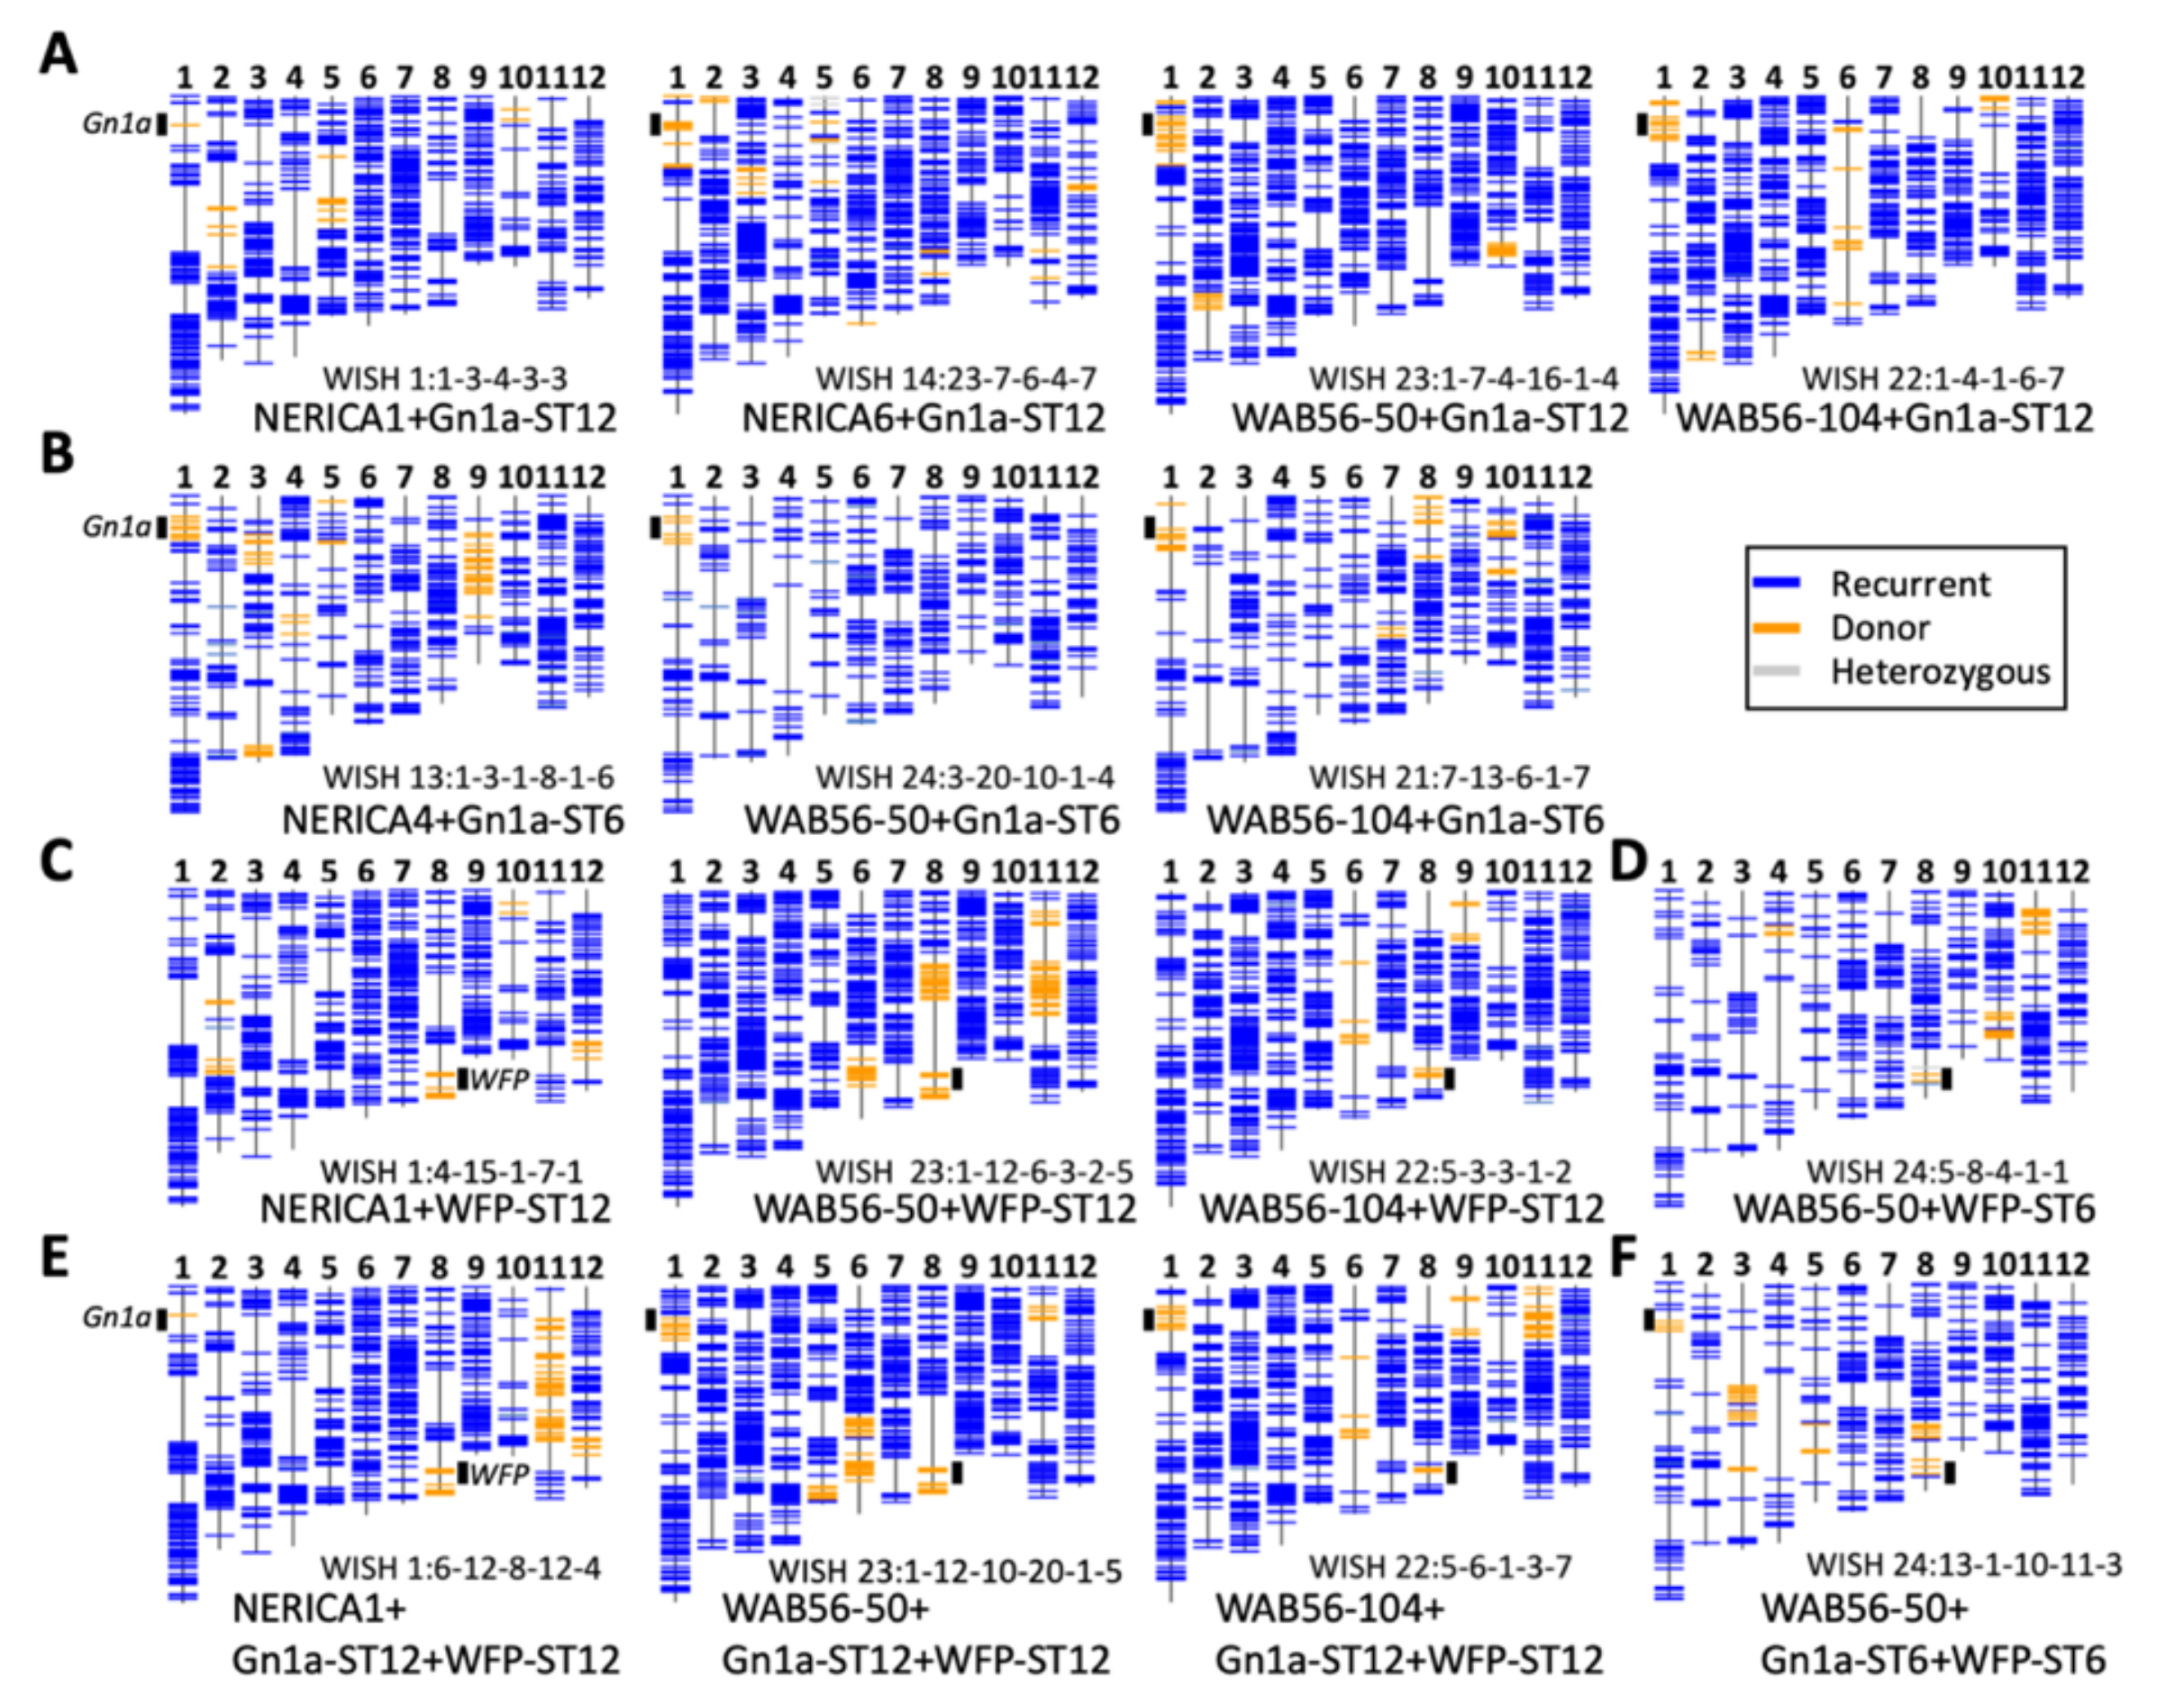
2.2. Recurrent Parent Genome Recovery Analysis on Selected Improved Lines

To validate the introgression and analyze the RPGR, the selected 192 candidate lines were genotyped through GBS following the method by Poland et al. (2012) [33], with a combination of restriction enzyme of KpnI and MspI. A total of 141.8 Gb sequence data were generated from the 192 lines. After the initial filtering and processing, a total of 55,082 SNPs were obtained. Another set of filtering was executed which trimmed down the SNPs to an average of 2500 per genetic background. Finally, after error correction and manual curation, an average of 1400 high-quality SNPs were retained and used for further analysis. The total number of SNPs and range of RPGR in each genetic background are summarized in Table 1.
In the genetic background of NERICA1, lines carrying the Gn1a-ST12, WFP-ST12, and a combination of both alleles had an RPGR ranging from 85.4–98%. The WISH line 1:1-3-4-3-3 (NERICA1 + Gn1a-ST12-1) carrying the Gn1a-ST12 allele had the highest RPGR at 98%. In lines carrying the WFP-ST12, WISH 1:4-15-1-7-1 (NERICA1+WFP-ST12-2) had the highest RPGR at 97.3%, and for lines carrying both alleles, WISH 1:6-12-8-12-4 (NERICA1 + Gn1a + WFP-ST12-1) had the highest RPGR at 92.2%. In the genetic background of NERICA6, WISH 14:23-7-6-4-7 (NERICA6 + Gn1a-ST12-1) had an RPGR of 94.8%. The lines in the genetic background of WAB56-104 with a single QTL introgression and stacked QTLs had an RPGR ranging from 77–96.9%. In lines carrying the Gn1a-ST12 allele, WISH 22:1-4-1-6-7 (WAB56-50 + Gn1a-ST12-3) had the highest RPGR at 96.4%, while in lines carrying the WFP-ST12 allele, WISH 22:5-3-3-1-2 (WAB56-104 + WFP-ST12-4) had the highest RPGR at 96.9%. On the other hand, in lines carrying both alleles, WISH 22:5-6-1-3-7 (WAB56-104 + Gn1a + WFP-ST12-2) showed the highest RPGR at 95.1%. In the genetic background of WAB56-50, lines were identified with an RPGR ranging from 88.3–96.7%. The WISH line 23:1-7-4-16-1-4 (WAB56-50 + Gn1a-ST12-2), carrying the Gn1a-ST12 allele, showed the highest RPGR at 96.7%. In lines carrying the WFP-ST12 allele, WISH 23:1-4-4-16-2-3 had the highest RPGR at 96%. Lastly, WISH 23:1-12-10-20-1-5 (WAB56-50 + Gn1a + WFP-ST12-1) showed the highest RPGR at 94.4%
RPGR was also evaluated in lines carrying an introgression from the donor parent ST6. The lines in the genetic background of NERICA4 x ST6 had an RPGR ranging from 84.5–87.7% with WISH 13:1-3-1-8-1-6 (NERICA4+Gn1a-ST6-1) having the highest RPGR at 87.7%. In the genetic background of WAB56-104, WISH 21:7-13-5-1-5 (WAB56-50 + Gn1a-ST6-4) and WISH 21:7-13-6-1-7 (WAB56-104 + Gn1a-ST6-3) showed the highest RPGR at 93%. The WISH lines 24:3-14-4-1-3 (WAB56-50 + Gn1a-ST6-1) and 24:3-20-10-1-4 (WAB56-50 + Gn1a-ST6-2) showed the highest RPGR at 95%. In the same genetic background, WISH 24:5-8-4-1-1 (WAB56-50 + WFP-ST6-2) showed an RPGR of 94%. In lines carrying both alleles, the WISH line 24:13-1-10-11-3 (WAB56-50 + Gn1a + WFP-ST6-1) showed the highest RPGR at 92.1%. The graphical genotypes of lines with the highest RPGR in each genetic background are presented in Figure 2.

2.3. Effects of Gn1a Allele on Grain Number

The effects of Gn1a on yield and yield-related components were evaluated during the dry season (DS) and wet season (WS) of 2017. In the genetic background of NERICA1, two out of the three lines were observed to have a significant improvement in NSPP during the WS of 2017. The WISH line 1:1-1-3-4-3-3 (NERICA1 + Gn1a-ST12-1) significantly improved by 72.3%, while the WISH line 1:6-16-10-4-1 (NERICA1 + Gn1a-ST12-3) significantly improved by 56.74% as compared to that of NERICA1 (Figure 3A). In the genetic background of NERICA6, the NSPP of WISH line 14:23-7-6-4-7 (NERICA6 + Gn1a-ST12-1) significantly improved by 32.4% during DS and 25.9% during WS (Figure 2B). No significant improvement was observed in the genetic background of WAB56-50 × ST12 (Figure 2C). Among the five introgression lines in the genetic background of WAB56-104 × ST12, only the WISH line 22:3-2-4-1-8 (WAB56-50 + Gn1a-ST12-5) showed a significant improvement in NSPP by 14.2% during DS and 62.5% during WS of 2017 (Figure 3C).
Evaluation of Gn1a-ST6 in the genetic backgrounds of NERICA4, WAB56-50, and WAB56-104 was also carried out. In the genetic background of NERICA4, two lines were observed to have a significantly improved NSPP. The WISH line 13:1-3-2-5-1-7 (NERICA4 + Gn1a-ST6-2) was observed to have a significantly improved NSPP by 28.10% during DS, and 45.13% during the WS of 2017. On the other hand, the NSPP of the WISH line 13:4-5-6-1-7 (NERICA4 + Gn1a-ST6-3) significantly improved by 4.9% during DS (Figure 4A). The same occurred with WAB56-50 × ST12; no significant improvement was observed in the Gn1a introgression lines of WAB56-50 x ST6 (Figure 4B). A consistent improvement in NSPP was observed in the WISH line 21:7-14-7-1-7 (WAB56-104 + Gn1a-ST6-4). The NSPP of this WISH line significantly improved by 14.08% during DS and 18.69% during WS (Figure 4C).

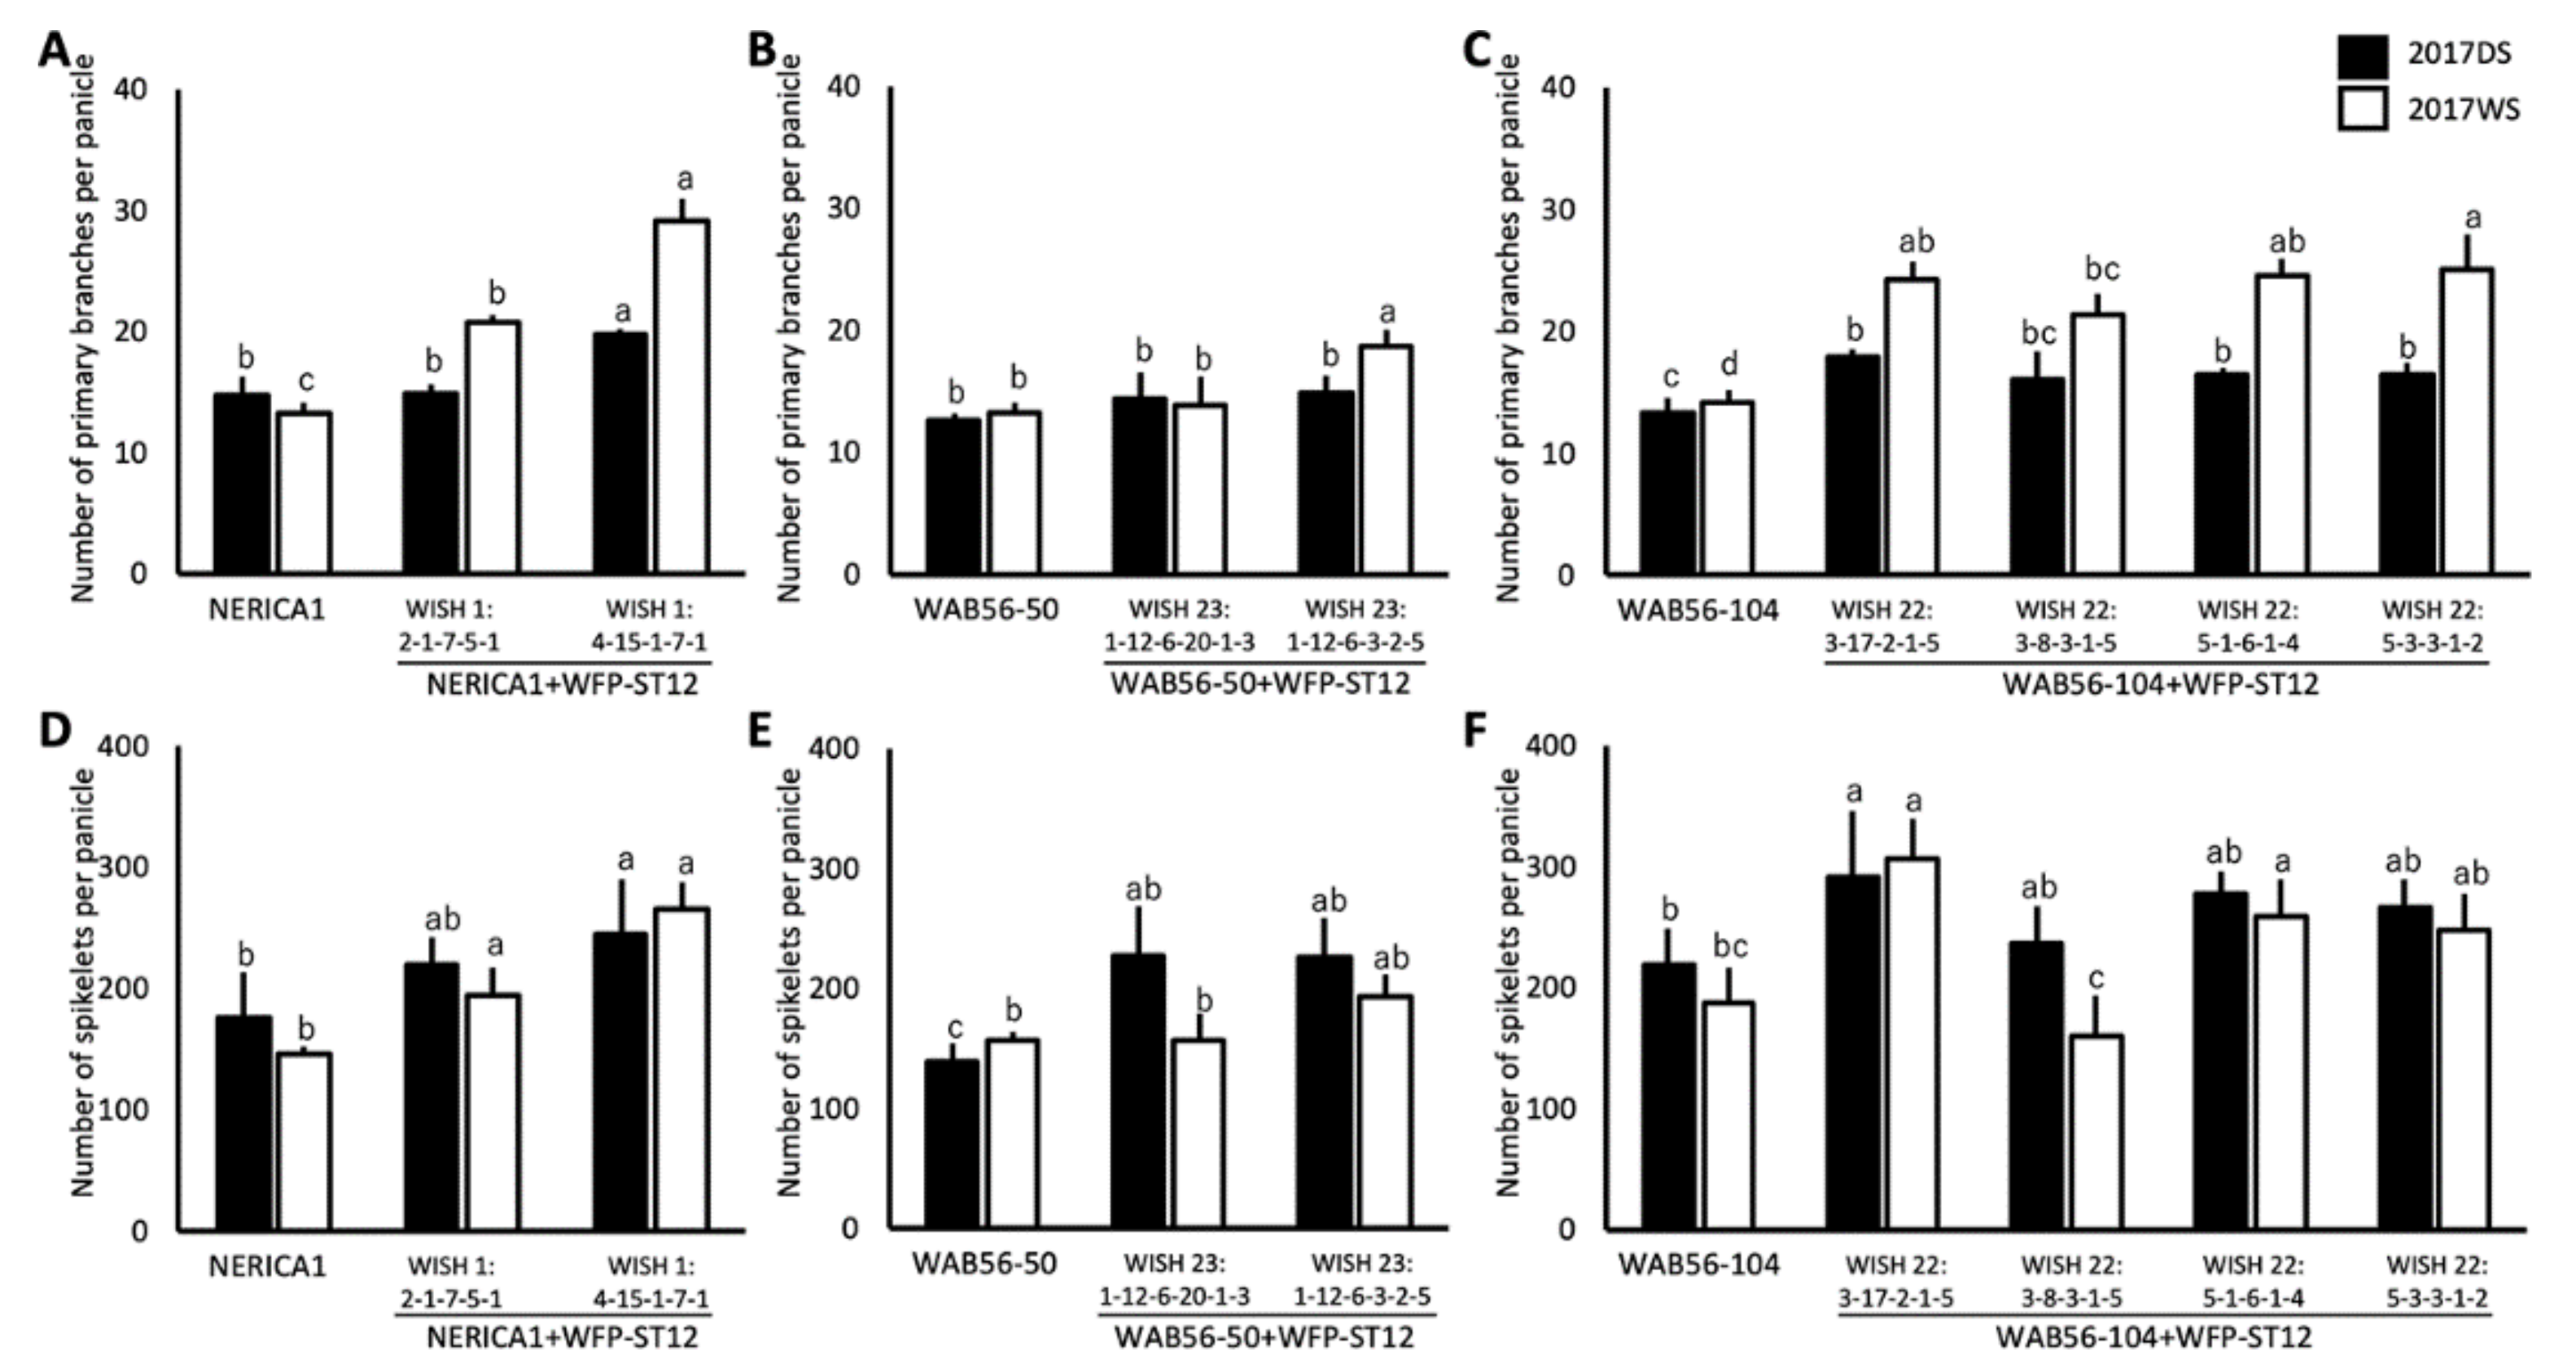
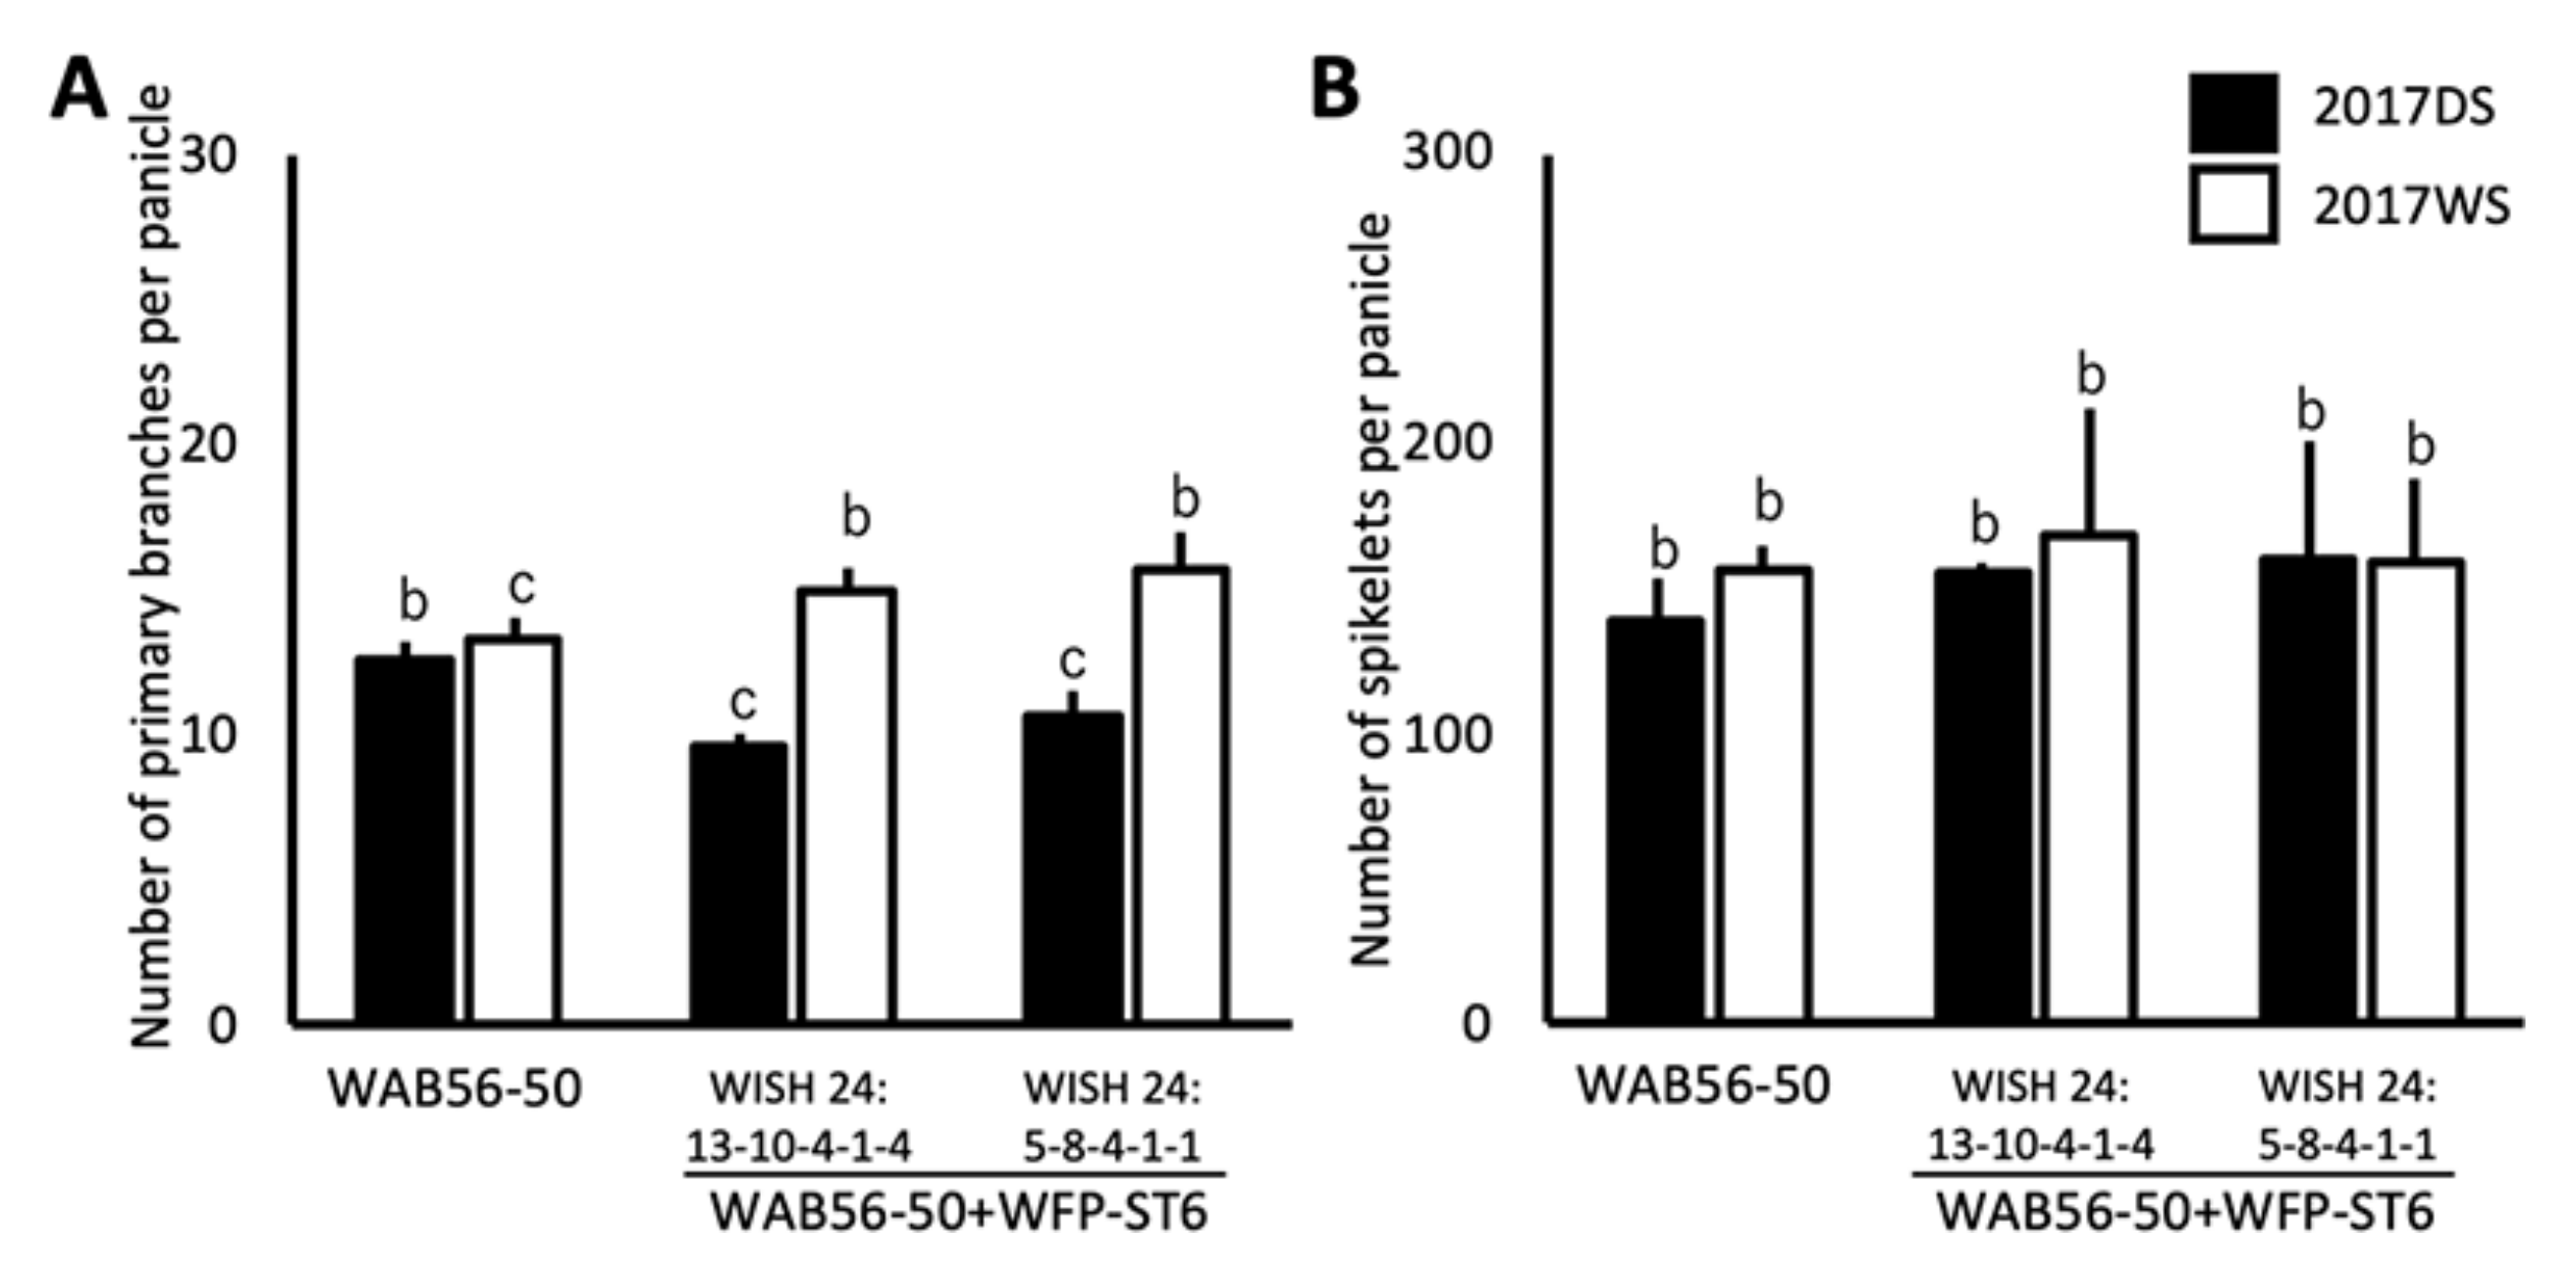
2.4. Effects of WFP Allele on Primary Branching Number and Grain Number

To determine the effects of WFP allele, PBPP and NSPP of WFP-ST12 and WFP-ST6 introgression lines were evaluated. In the genetic background of NERICA1 × ST12, two lines with a significant improvement on PBPP were identified. The WISH line 1:4-15-1-7-1 (NERICA1 + WFP-ST12-2) was observed to have a 33.78% increase in PBPP during DS and 118% during WS, while the WISH line 1:2-1-7-5-1 (NERICA1 + WFP-ST12-1) was observed to have a significant improvement in PBPP by 55.51% during WS (Figure 5A). Out of the two lines, only the WISH line 1:4-15-1-7-1 showed a consistent improvement on NSPP, by 39.05% during DS and 82.25% during WS (Figure 5D). In WAB56-104 × ST12, the WISH lines 22:3-17-2-1-5 (WAB56-104 + WFP-ST12-1), WISH 22:3-8-3-1-5 (WAB56-104 + WFP-ST12-2), WISH 22:5-1-6-1-4 (WAB56-104+WFP-ST12-3), and WISH 22:5-3-3-1-2 (WAB56-104 + WFP-ST12-4) were observed to have a significantly improved PBPP (Figure 5C). The WISH line 22:3-17-2-1-5 (WAB56-104 + WFP-ST12-1) was observed to have improvement in PBPP by 34.89% during DS and 73.17% during WS. This line was also observed to have a higher NSPP compared to the RP, by 33.77% during DS and 62.70% during WS 2017 (Figure 5F). In WAB56-50 × ST12 genetic background, only the WISH line 23:1-12-6-3-2-5 (WAB56-50 + WFP-ST12-2) showed a significant improvement in PBPP, by 40.69% during WS (Figure 5B). In terms of NSPP, the WISH line 23:1-12-6-20-1-3 (WAB56-50 + WFP-ST12-1) showed a significant improvement by 63.35% and the WISH line 23-1-12-6-3-2-5 (WAB56-50 + WFP-ST12-2) by 62.62% during DS (Figure 5E). The graphical image of the primary branches per panicle and spikelets per panicle of the WFP-ST12 introgression lines and their respective RPs are summarized in Figure 5.
The WFP-ST6 introgression lines were evaluated for the same traits. A significant improvement was observed in PBPP of WISH 24:13-10-4-1-4 (WAB56-50 + WFP-ST6-1) and WISH 24:5-8-4-1-1 (WAB56-50 + WFP-ST6-2) during WS (Figure 6A). However, no significant improvement was observed in the NSPP of both lines (Figure 6B).

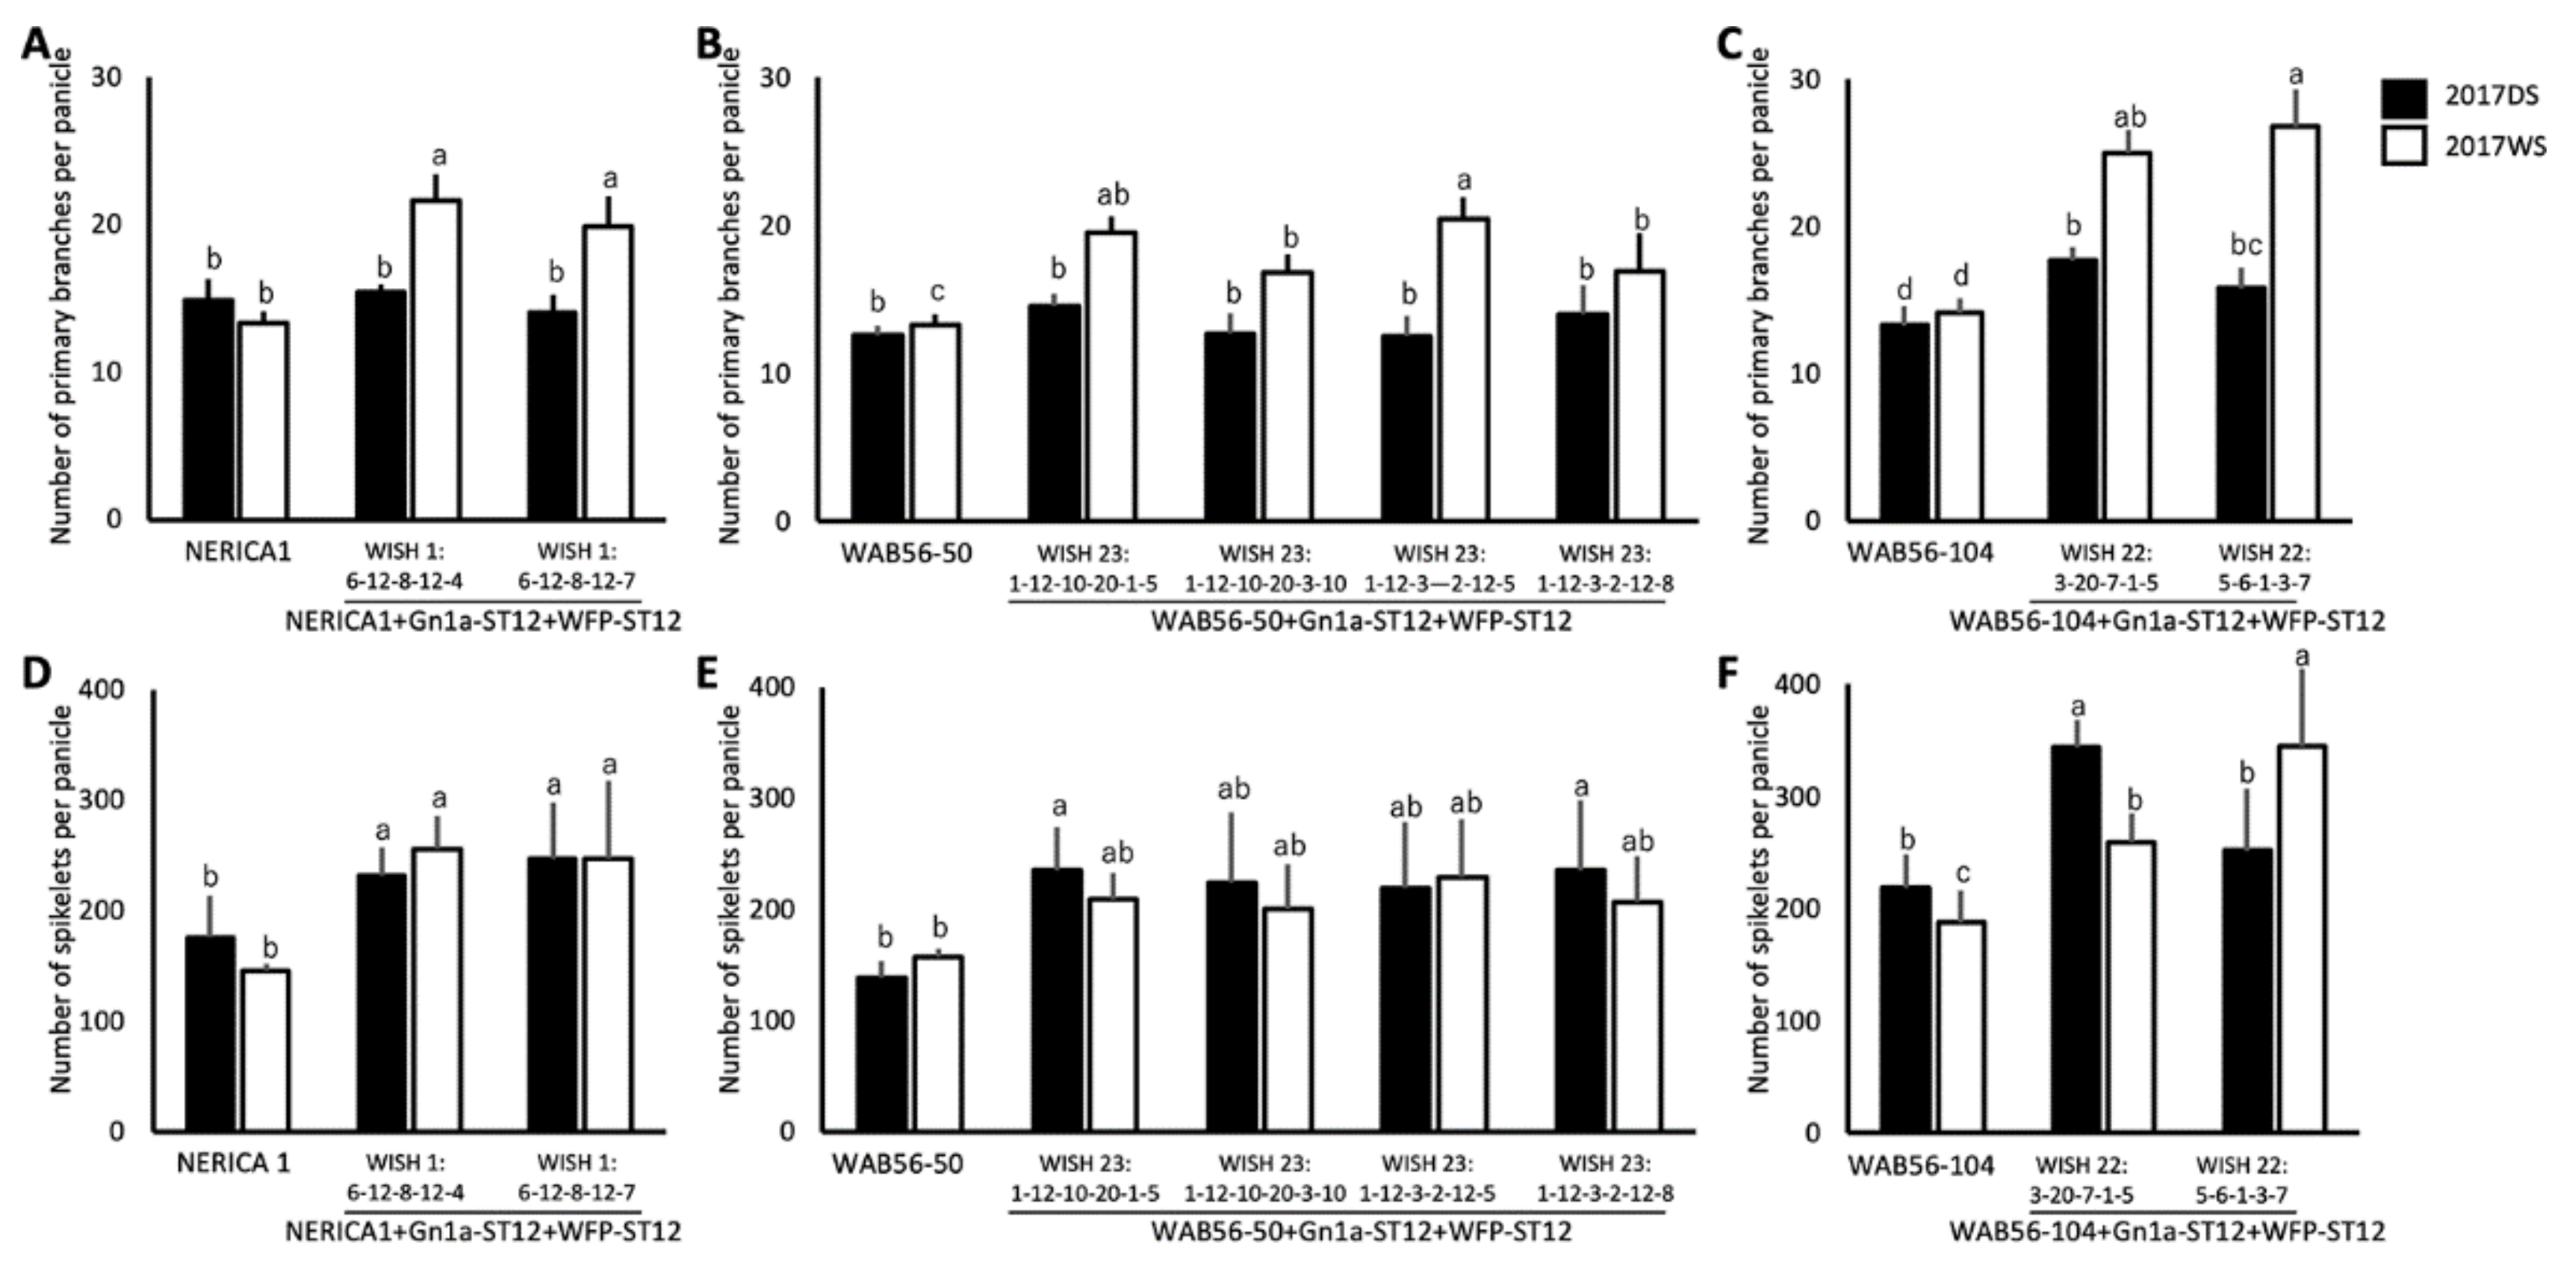
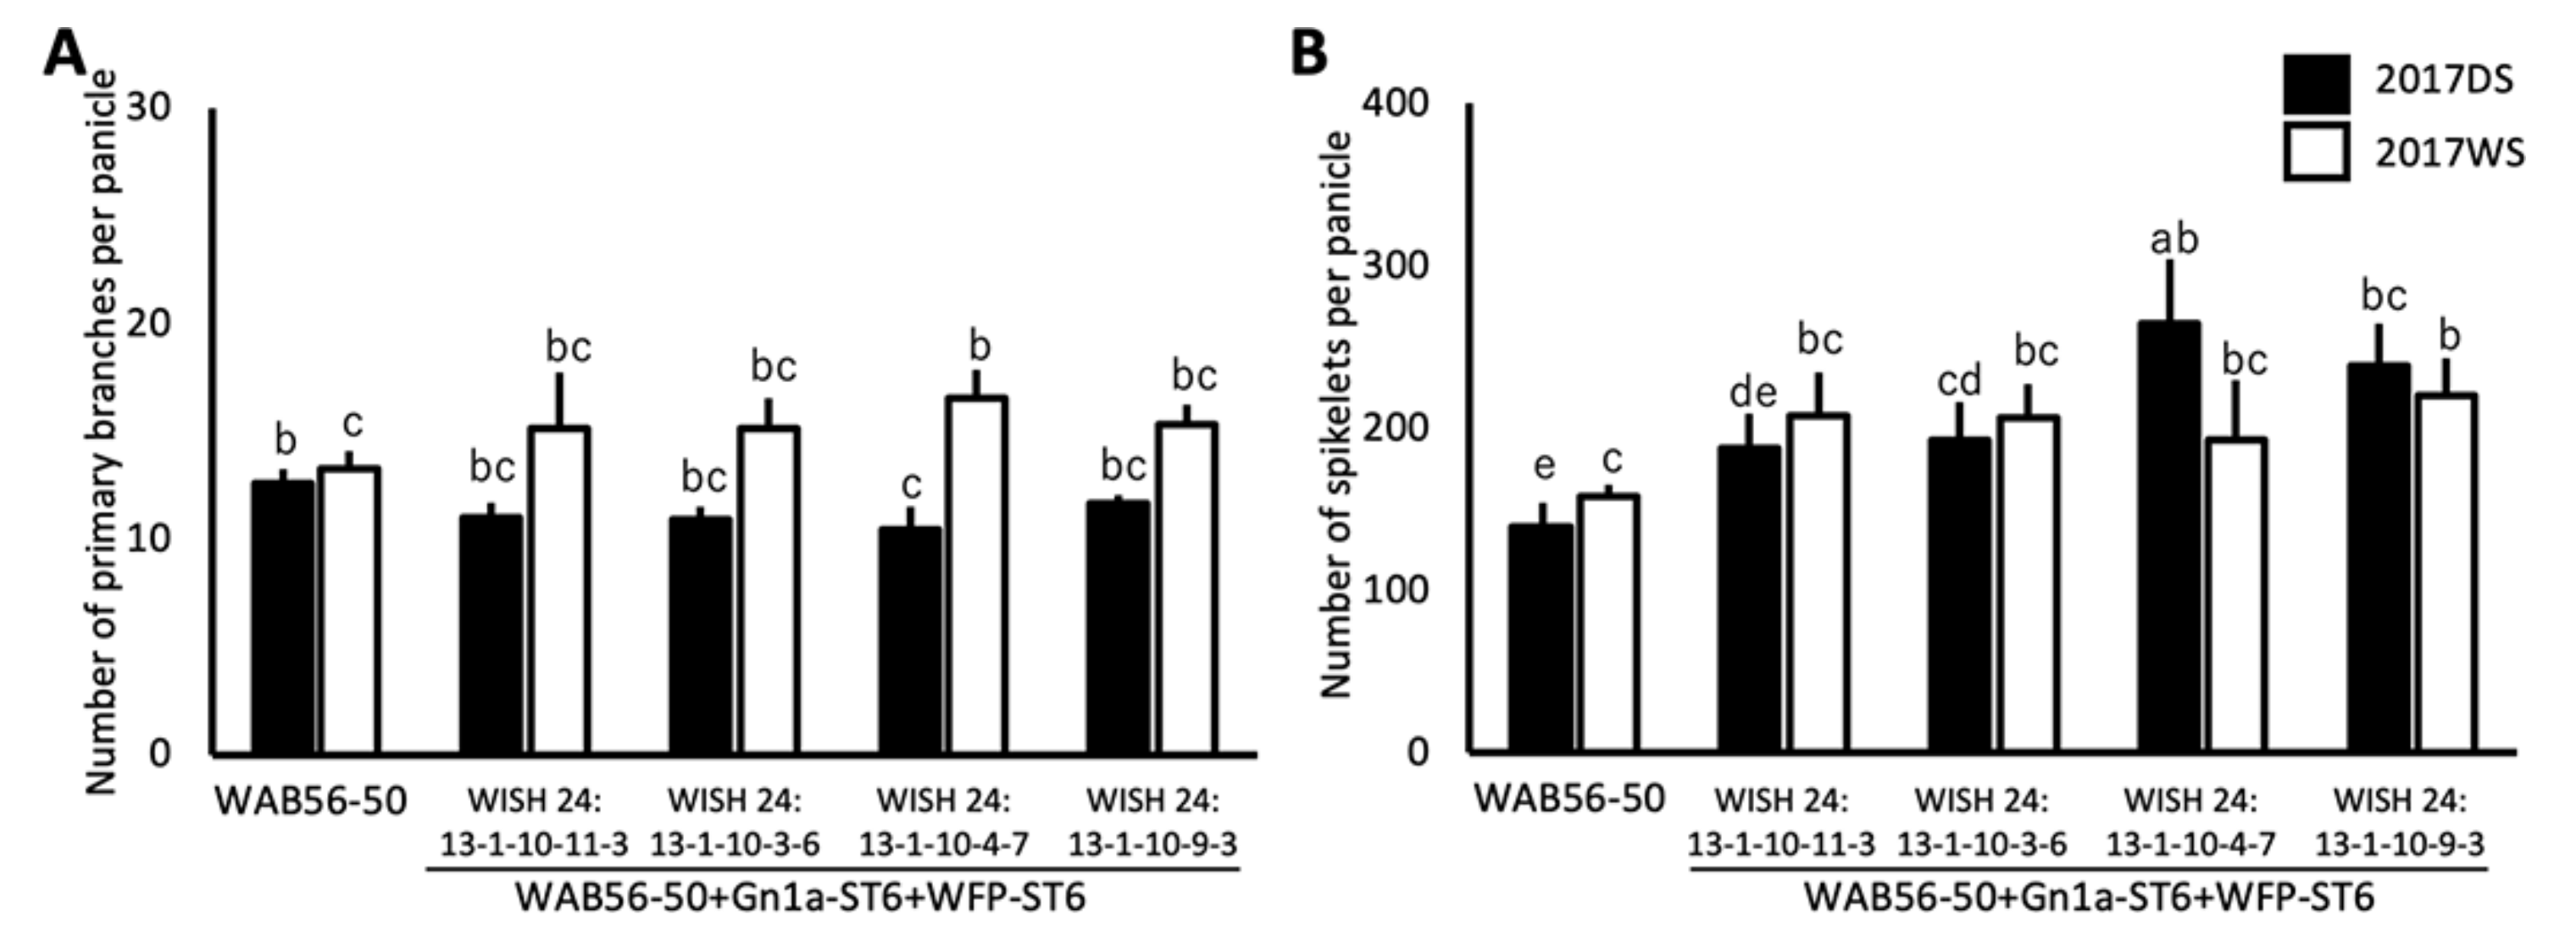
2.5. Effects of Stacking of Gn1a + WFP on Spikelet Number and Primary Branching

In this study, the yield QTLs Gn1a and WFP were stacked in NERICA1, WAB56-50, and WAB56-104. In the genetic background of NERICA1 × ST12, the WISH lines 1:6-12-8-12-4 (NERICA1 + Gn1a+WFP-ST12-1) and 1:6-12-8-12-7 (NERICA1 + Gn1a + WFP-ST12-2) showed a significant improvement in PBPP by 62.57% and 49.51%, respectively (Figure 7A). Consistently, the WISH line 1:6-12-8-12-4 (NERICA1+Gn1a + WFP-ST12-1) showed a significant improvement in NSPP by 31.88% during DS and 74.99% during WS (Figure 7D), while the WISH line 1:6-12-8-12-7 (NERICA1 + Gn1a + WFP-ST12-2) significantly improved by 39.99% during DS and 69.14% during the WS (Figure 7D). For WISH lines in the genetic background of WAB56-50 × ST12, WISH lines 23:1-12-10-20-1-5 (WAB56-50 + Gn1a + WFP-ST12-1), WISH 23-1-12-10-20-3-10 (WAB56-50 + Gn1a + WFP-ST12-2), WISH 23:1-12-3-2-12-5 (WAB56-50 + Gn1a + WFP-ST12-3), and WISH 23:1-12-3-2-12-8 (WAB56-50 + Gn1a + WFP-ST12-4) showed a significant improvement in PBPP during WS (Figure 7B). However, out of these four lines, only the WISH lines 23:1-12-10-20-1-5 (WAB56-50 + Gn1a + WFP-ST12-1) and 23:1-12-3-2-12-8 (WAB56-50 + Gn1a + WFP-ST12-4) showed a significant increase in NSPP by 70% during DS (Figure 7E). In the genetic background of WAB56-104 × ST12, the WISH lines 22:3-20-7-1-5 (WAB56-104 + Gn1a + WFP-ST12-1) and WISH 22:5-6-1-3-7 (WAB56-104 + Gn1a + WFP-ST12-2) showed a significant improvement in PBPP and NSPP. The WISH line 22:5-6-1-3-7 (WAB56-104 + Gn1a + WFP-ST12-2) showed a significant improvement in PBPP by 19.29% during DS and 89.17% during the WS of 2017 (Figure 7C), while the WISH line 22:3-20-7-1-5 (WAB56-104 + Gn1a + WFP-ST12-1) showed a significant improvement in PBPP by 33.16% during DS and 76.93% during WS of 2017 (Figure 7C). In terms of NSPP, the WISH line 22:5-6-1-3-7 (WAB56-104 + Gn1a + WFP-ST12-2) showed a significant improvement by 83.88% only during DS (Figure 7F). The NSPP of the WISH line 22:3-20-7-1-5 (WAB56-104 + Gn1a + WFP-ST12-1) significantly improved by 56.79% during DS and 37.76% during WS (Figure 7F).
In the WAB56-50 × ST6 genetic background, no significant improvement was observed in PBPP (Figure 8A). However, three lines showed a significant improvement in NSPP. The WISH lines 24:13-1-10-3-6 (WAB56-50 + Gn1a + WFP-ST6-2) and 24:13-1-10-4-7 (WAB56-50 + Gn1a + WFP-ST6-3) showed a significant improvement in NSPP by 38.96% and 90.85%, respectively, during DS (Figure 8B). On the other hand, the WISH line 24:13-1-10-9-3 (WAB56-50 + Gn1a + WFP-ST6-4) showed a constant improvement in NSPP by 71.71% during DS and 39.68% during WS (Figure 8B).

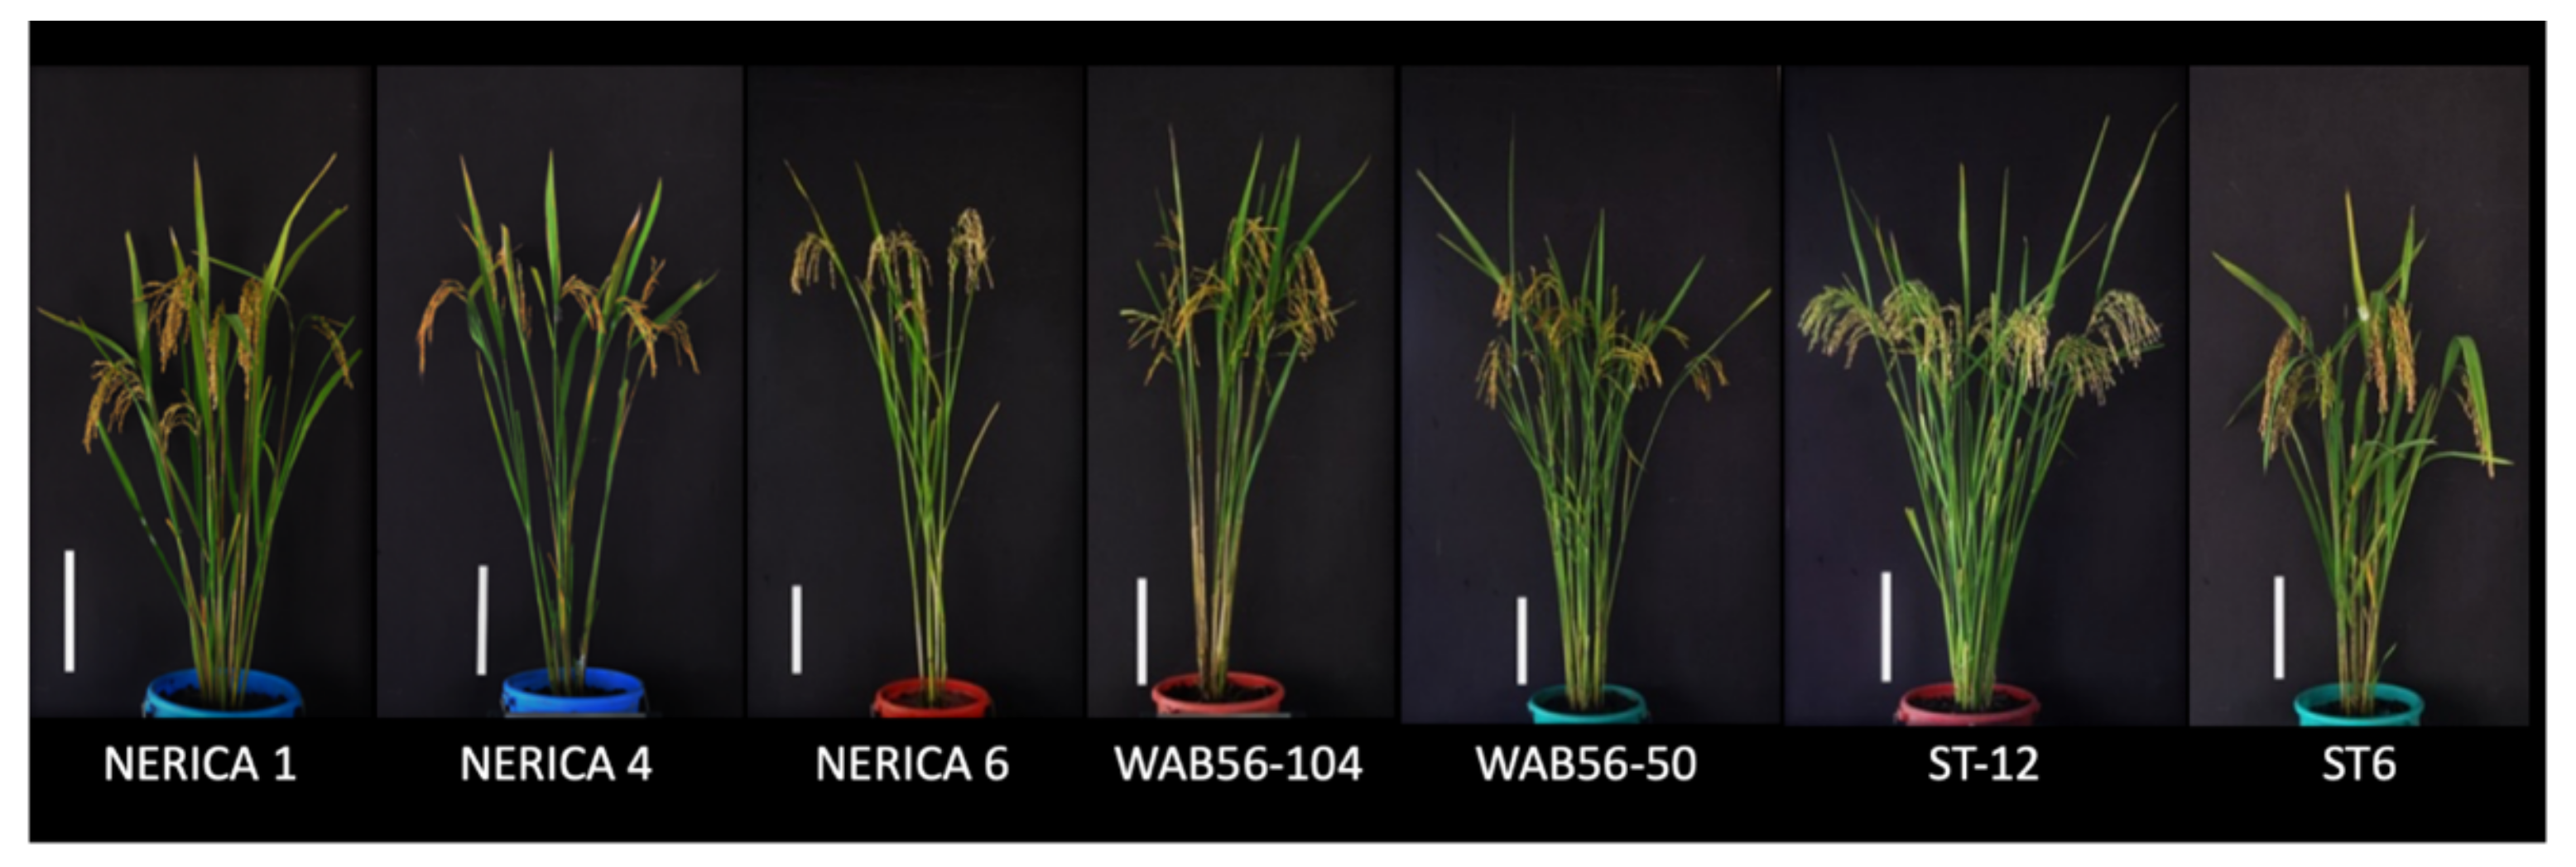
2.6. Agronomic Performance of WISH Introgression Lines

In the current study, seven other major agronomic traits were evaluated for two seasons: days to heading (DTH), plant height (PH), tiller number per plant (TNPP), PL, SBPP, percent fertility (PF), and thousand-grain weight (TGW).
The WISH lines with Gn1a-ST12 in the genetic background of NERICA1 and WAB56-104 showed a significant improvement in SBPP by 32.2–105% during DS and 72.7–117.2% during WS (Supplementary Table S1), while the WISH lines carrying the Gn1a-ST6 allele in the genetic backgrounds of NERICA4, WAB56-104, and WAB56-50 showed a significant improvement in SBPP by 32.5–101.2% during DS and 27.85–54.4% during WS (Supplementary Table S2).
The performance of other agronomic traits observed in this study was comparatively similar to that of the respective recurrent parents. However, some lines evaluated were significantly different. The significant difference observed across these phenotypes varies among the sister lines and across seasons. For example, in the genetic background of NERICA1, the WISH line 1:4-9-3-4-2 (NERICA1 + Gn1a-ST12-2) was significantly shorter as compared to its RP, but only during WS. The WISH 23:1-12-6-3-2-5 (WAB56-50 + WFP-ST12-2) was observed to be heavier, as compared to the RP, but only during WS (Supplementary Table S3). The same was observed in WISH lines with stacked yield QTLs. The WISH line 23:1-12-10-20-3-10 (WAB56-50 + Gn1a-ST12 + WFP-ST12-2) was observed to have significantly higher PF, but only during DS (Supplementary Table S5).

3. Discussion

Marker-assisted breeding has served as a hallmark of an efficient way to improve several traits across different crops. To improve the existing rice cultivars in Africa, the WISH project made use of an MABB scheme to transfer and stack the yield QTLs Gn1a and WFP. In this study, NERICA lines and their WAB progenitors were used as the recipient parents of yield QTLs Gn1a and WFP. The NERICA plant materials have big and heavy panicles but with a fewer number of tillers [34]. These lines were also reported to have tolerance in some biotic and abiotic stresses. On the other hand, the WAB progenitors were reported to have desirable qualities such as drought tolerance, weed competitiveness, and disease tolerance [34].
The effects of the introgression of Gn1a alleles in this study coincide with the findings of Sakamoto et al. (2008) [35]. Their findings showed that a near-isogenic line (NIL) carrying Gn1a had the same number of PBPP but developed a higher number of SBPP on both primary branches and at the panicle base. The developed WISH lines in this study with Gn1a-ST12 and Gn1a-ST6 introgression showed a significant increase in SBPP by as much as 13–117% in the genetic backgrounds of NERICA1, NERICA4, NERICA6, and WAB56-104. The improvement in SBPP in the WISH lines significantly increased the NSPP by as much as 4.9–72.3% in the same genetic backgrounds. In a previous study of Ashikari et al. (2005) [13], the major QTLs Gn1a + Gn1b from Habataki were able to increase grain productivity by as much as ~45% in the Koshihikari background. In 2017, Feng et al. [18] showed that introgression of Gn1a allele from the donor parent GKBR improved the yield per plant of a japonica rice cultivar Kongyu 131 by 8.3% and 11.9% in two locations in Heilongjian, China. The effects of the Gn1a allele on NERICA and WAB56-104 introgression lines that we developed are the same as the results of other Gn1a introgression studies. In a previous study of Kim et al. (2018) [16], introgression of Gn1a alleles from Habataki, ST12, and ST6 were found to be ineffective in some indica rice cultivars as they have the same type of Gn1a allele with the donor parents. The same may hold true in the WISH lines in the genetic background of WAB56-50 × ST12.
The introgression of the WFP allele showed a significant improvement in PBPP in the genetic backgrounds of NERICA1, WAB56-104, and WAB56-50 by 33.77–118%. This significant increase in PBPP resulted in an increase in NSPP by 33.77–82.25%. However, the lines carrying the WFP-ST12 and WFP-ST6 alleles showed a significant reduction in TNPP (Supplementary Tables S3 and S4). The results obtained in this study coincide with the findings of previous studies on WFP. In the study of Jiao et al. (2010) [36], OsSPL14 from the rice line Shaoniejing, a japonica cultivar, significantly increased the PBPP and NSPP of Taichung 1, an indica rice variety. However, TNPP was greatly reduced. Miura et al. (2010) [15], on the other hand, used the OsSPL14 allele of the rice line ST12 and Aikawa. Their result showed that lines carrying the WFP-ST12 allele significantly improved PBPP and NSPP without a decrease in TNPP. However, the lines carrying the WFP-Aikawa allele showed significant improvement in PBPP and NSPP, but with significant reduction in TNPP [15]. In the recent study by Kim et al. (2018) [16], WFP-ST12 and WFP-Aikawa were introgressed to an indica rice cultivar. Their result showed that WFP-ST12 significantly improved PBPP and NSPP without reducing the TNPP. In the study of Yamada et al. (2020) [17], introgression of the WFP-ST12 allele in the genetic background of IRBB60 significantly improved the PBPP. The developed WISH lines in our study deviate from the findings of Miura et al. (2010) [15] and Kim et al. (2018) [16], wherein TNPP in WISH lines with WFP-ST12 and WFP-ST6 were significantly reduced. The reduction in TNPP was previously associated with DEP1 by Lu et al. (2013) [37]. It was characterized that trade-off pleiotropy between PBPP and TNPP happens between IPA1/WFP/OsSPL14 and DEP1. The IPA1 functions as a positive regulator to DEP1, increasing PH and PL. In addition, IPA1/OsSPL14 can also interact and directly bind to several genes that regulate plant architecture such as OsTB1, PIN1b, SLR, LOG, and LAX [37,38].
Gene stacking has been applied mostly for biotic and abiotic stresses. However, only a few breeding programs apply gene stacking for yield traits. In this study, stacking of the yield QTLs from the donor parents ST12 and ST6 showed a significant improvement in PBPP, SBPP, and NSPP. However, the improvement observed in PBPP, SBPP, and NSPP was on par with those in lines with single QTL introgression. This result coincides with the findings of Kim et al. (2018) [16], wherein the yield productivity of stacked lines was not significantly different from that of the lines carrying a single gene introgression. In addition, the WISH lines with stacked QTLs had a significantly lower number of TNPP (Supplementary Tables S5 and S6). The drastic reduction in the TNPP could be attributed to the WFP allele.
The background genome recovery in this study was determined by genotyping-by-sequencing. As compared to SSR markers, GBS has a greater number of markers per sample and a greater number of alleles per marker [39]. In addition, GBS offers a cheaper cost per data point compared to other traditional DNA markers [40]. The number of SNPs obtained for RPGR analysis showed variation per cross combination. For example, in the cross combination of NERICA1 × ST12, a total of 1418 SNPs were obtained. However, in the cross combination of WAB56-50 × ST6, only a total of 828 SNPs were obtained. This could be due to the genetic similarity between WAB56-50 and ST6. These two lines share a tropical japonica genetic background. In terms of RPGR analysis, variation between and within the genetic backgrounds were observed. Theoretically, the RPGR of BC3 generation should be at 93.75%. The best performing lines in our study showed an RPGR that is within and higher than the theoretical RPGR. However, we observed some lines that had an RPGR lower than the theoretical. For example, NERICA4 × ST6 lines were observed to have the lowest maximum RPGR at 87.7%. The low RPGR observed in these lines could have been avoided if the analysis was carried out as early as BC1 generation [19,41]. Nowadays, background selection at an early generation through GBS is cost-efficient for MAB programs.
The results of our study showed phenotypic variation on other agronomic traits. For example, some lines carrying the Gn1a, WFP, and combination of both alleles showed a significant improvement in SBPP, PF, and TGW (Supplementary Tables S1–S6). In addition, lines carrying Gn1a, WFP, and combination of both alleles showed a significant increase in PH and decrease in PL and TNPP. These phenomena could be due to non-targeted introgression or interaction of QTLs with other regulatory genes. In addition, the phenotypic variations that were observed in the aforementioned traits varied significantly across seasons. These variations could be attributed to the genetic background of the materials used in the study. The environmental changes, especially day length and temperature, during the wet and dry season may have also contributed to these seasonal variations. A careful evaluation of the succeeding trials is necessary to confirm these phenotypic and seasonal variations.
For farmers to adopt these new lines, agronomic traits must be comparable with the recurrent parents. The selected WISH lines developed in this study are by far comparable with their respective recurrent parents. Even though the WFP lines have fewer TNPP, the general agronomic morphology still coincides with the concept of new plant type [42] (low tillering capacity; 200–250 grains per panicle 110–130 days growth duration). In addition, although yield per plant was not evaluated in this study, it would be necessary to determine the performance of these lines in the actual farmer’s field. Additionally, further improvement in field agricultural practices is necessary to fully draw the genetic potential of the WISH lines.
The utilization of yield and yield-related QTLs has been a challenge for most breeding programs due to its complexity brought by genotypic and environmental effects. In this study, we demonstrated the success of utilizing MABB to introgress and stack the Gn1a and WFP alleles. In addition, the current study used GBS technology to conduct background genome analysis of the developed lines. To the best of our knowledge, this is one of the first attempts to investigate the effects of Gn1a and WFP in systematically produced introgression lines. However, the evaluation of WISH lines in various environments, especially in SSA, is needed to assess its stability.

4. Materials and Methods

4.1. Plant Materials

The New Rice for Africa (NERICA) cultivars (NERICA1, NERICA4, and NERICA6) and progenitor lines (WAB56-50 and WAB56-104) were used as the recurrent parents in this study (Figure 9). The donor rice lines ST12, a high-yielding rice line in the background of indica [15], and ST6, a high-yielding rice in the background of japonica [43], were used as the donor of Gn1a and WFP. The donor germplasms were obtained from the stocked rice collections of the Togo field at Nagoya University, Japan.

4.2. Development of WISH Lines by MAS

The initial breeding lines were generated at Nagoya University, Japan in 2012. In 2013, the backcross population at BC1F1 generation were exported to IRRI for further backcrossing and generation advancement. The lines were backcrossed for three consecutive seasons (DS 2014, WS 2014, and DS 2015), generating BC3F1 lines. MABB was carried out at BC2F1 and BC3F1 to assure that the donor alleles of Gn1a and WFP were present in each generation using the DNA markers RM3360 for Gn1a, and RM3452 and RM5493 for WFP [31]. All BC3F2 lines were screened to obtain lines that were homozygous for the donor alleles in the target loci. Selected lines were advanced to BC3F4 and BC3F5. At BC3F4 and BC3F5, lines were evaluated phenotypically and genotyped by GBS (Figure 10). All lines developed in this research are part of the WISH project. These lines are referred to as WISH lines.

4.3. Foreground Selection for Gn1a and WFP Alleles

The RM markers used to identify lines carrying Gn1a and WFP alleles are summarized in Table 2. Genomic DNA from each sample was extracted using the TPS method [44]. PCR analysis was performed using VeritiTM 384-well thermal cycler (Thermo Fisher Scientific, Waltham, MA, United States) with an initial denaturation of 95 °C for 5 min; 35 cycles at 95 °C for 30 s; annealing at 55 °C for 30 s; and extension at 72 °C for 30 s with a final extension at 72 °C for 7 min. The PCR product was separated on 3% agarose gel at 200 v for 40 min. Gel results were visualized by using a UVIdoc-HD2/20M (Cleaver Scientific Ltd., Warwickshire, United Kingdom) Gel Documentation System.

4.4. Genotyping-by-Sequencing (GBS)

To determine the recurrent genome recovery, the population was subjected to GBS, as described by Poland et al. [33]. In summary, genomic DNA (200 ng) of individual lines were double-digested with KpnI–MspI (New England Biolabs Inc., Ipswich, MA, USA) and ligated with unique barcoded adapters. Individual barcoded samples were pooled into a single tube. The sequencing of the library was carried using Illumina HiSeq X Ten (Illumina, Inc., San Diego, CA, USA).
TASSEL-GBS 5.0 [45] was used for informatics to process the GBS data. Reads were aligned to the IRGSP V1.0 O. sativa Nipponbare reference genome using BWA [46,47]. The parameters for the SNP caller plugin were minor allele frequency (MAF) of 0.02 and minimum locus coverage (mnLCov) of 0.1. The reads that were obtained after the initial processing were further filtered using the VCF tools [48] and awk scripts written by the authors. In summary, filtering was based on polymorphism between parental alleles, a minimum depth of 6, and a maximum missing value of 30%.

4.5. Recurrent Parent Genome Recovery (RPGR) Analysis

The RPGR of the lines was computed using Graphical Genotyper (GGT 2.0) software, and graphical genotypes were created using Microsoft Excel [49,50]. Only polymorphic markers between the donor and recurrent parents were included in the analysis. The homozygous recurrent parent allele, donor parent allele, and heterozygous allele were denoted as A, B, and H, respectively.

4.6. Field Trials and Agronomic Evaluation

Field experiments were conducted at the hybridization block (HB) (14°10′18.4″ N 121°15′33.3″ E) of IRRI. The WISH lines were planted with twelve plants per line and 20 cm × 20 cm plot spacing. The field management was based on the standard practice at the research institute. To summarize, fertilizer was applied thrice; basal dressing at final harrowing; first topdressing 21–25 days after seeding; second topdressing 30–35 days after seeding. Pests and diseases were controlled using chemicals to avoid yield loss in plants.
At maturity, five plants that were homozygous at the target loci were selected in each line and evaluated for their agronomic traits. The HD was determined from seeding day until 50% of plants per line were flowering. PH was measured from the base of the main stem (above ground) to the tip of the primary panicle. TNPP was recorded as productive tillers in a single plant. PL was measured from the base of the peduncle to the tip of the primary panicle. The PBPP is the total number of branches directly from the peduncle. The SBPP is the number of branches from the PBPP. The NSPP in this study was measured as the total number of spikelets present in each panicle. The PF was measured as the total number of filled grains/total number of grains per panicle × 100. The TGW was measured as the total weight of 1000 grains.

4.7. Data Analysis

The recorded agronomic data were analyzed using Statistical Tool for Agricultural Research software (STAR) v2.01 [51]. To determine the significant differences between recurrent parent and WISH lines, one-way analysis of variance (ANOVA) and Tukey’s test at 95% confidence level (p < 0.05) were used.

Supplementary Materials

The following are available online at https://0-www-mdpi-com.brum.beds.ac.uk/article/10.3390/plants10050844/s1, Table S1: Mean ± SD values of the agronomic traits of WISH lines with Gn1a-ST12 introgression title, Table S2: Mean ± SD values of the agronomic traits of WISH lines with Gn1a-ST6 introgression, Table S3: Mean ± SD values of the agronomic traits of WISH lines with WFP-ST12 introgression, Table S4: Mean ± SD values of the agronomic traits of WISH lines with WFP-ST6 introgression, Table S5: Mean ± SD values of the agronomic traits of WISH lines with Gn1a+WFP-ST12 introgression, Table S6: Mean ± SD values of the agronomic traits of WISH lines with Gn1a+WFP-ST6 introgression.

Author Contributions

Conceptualization, M.A., K.D., and R.B.A.-S.; formal analysis, V.P.R.; investigation, R.B.A.-S., V.P.R., R.S.L., J.S., and H.S.; data curation, V.P.R., R.B.A.-S., and R.S.L.; writing—original draft preparation, V.P.R.; writing—review and editing, V.P.R., R.B.A.-S., J.S., M.S.M., M.C.C.M., S.N., M.K., D.M., and K.D.; supervision, V.P.R., R.B.A.-S., and K.K.J.; funding acquisition, M.A. and K.D. All authors have read and agreed to the published version of the manuscript.

Funding

V.P.R. is grateful to MEXT, Japan, for the scholarship. This research was funded by Japan International Cooperation Agency (JICA) as part of the Wonder Rice Initiative for Food Security and Health (WISH) Project, the Canon Foundation, the SATREPS project entitled ‘Improvement in Productivity and Yield Stability of Rice under Kenya’s Biotic and Abiotic Stress Conditions through Tailor-made Breeding and Development of Cultivation Methods’, the RIKEN Cluster for Science, Technology and Innovation Hub (RCSTI), and JSPS KAKENHI Grant Number JP18H02187.

Acknowledgments

The authors would like to thank Angelito A. Aragon and Maricar Maullion for providing technical support in the maintenance of experimental materials. V.P.R. would like to thank DOST-ASTHRDP for the support during his MSc study.

Conflicts of Interest

The authors declare no conflict of interest.

References

  1. Maclean, J.L.; Dawe, D.; Hardy, B.; Hettel, G.P. Rice Almanac: Source Book for One of the Most Important Economic Activities on Earth, 3rd ed.; IRRI: Manila, Philippines, 2013; pp. 216–217. ISBN 0851996361. [Google Scholar]
  2. Zeigler, R.S.; Barclay, A. The relevance of rice. Rice 2008, 1, 3–10. [Google Scholar] [CrossRef] [Green Version]
  3. Xing, Y.; Zhang, Q. Genetic and molecular bases of rice yield. Annu. Rev. Plant. Biol. 2010, 61, 421–442. [Google Scholar] [CrossRef] [PubMed]
  4. Miura, K.; Ashikari, M.; Matsuoka, M. The role of QTLs in the breeding of high-yielding rice. Trends Plant. Sci. 2011, 16, 319–326. [Google Scholar] [CrossRef] [PubMed]
  5. Matsumoto, T.; Wu, J.; Kanamori, H.; Katayose, Y.; Fujisawa, M.; Namiki, N.; Mizuno, H.; Yamamoto, K.; Antonio, B.A.; Baba, T.; et al. The map-based sequence of the rice genome. Nature 2005, 436, 793–800. [Google Scholar] [CrossRef]
  6. Song, S.; Tian, D.; Zhang, Z.; Hu, S.; Yu, J. Rice genomics: Over the past two decades and into the future. Genom. Proteom. Bioinform. 2018, 16, 397–404. [Google Scholar] [CrossRef]
  7. Yano, M.; Katayose, Y.; Ashikari, M.; Yamanouchi, U.; Monna, L.; Fuse, T.; Baba, T.; Yamamoto, K.; Umehara, Y.; Nagamura, Y.; et al. Hd1 a major photoperiod sensitivity quantitative trait locus in rice, is closely related to the arabidopsis flowering time gene CONSTANS. Plant Cell 2000, 12, 2473–2483. [Google Scholar] [CrossRef] [Green Version]
  8. Xue, W.; Xing, Y.; Weng, X.; Zhao, Y.; Tang, W.; Wang, L.; Zhou, H.; Yu, S.; Xu, C.; Li, X.; et al. Natural variation in Ghd7 is an important regulator of heading date and yield potential in rice. Nat. Genet. 2008, 40, 761–767. [Google Scholar] [CrossRef]
  9. Doi, K.; Izawa, T.; Fuse, T.; Yamanouchi, U.; Kubo, T.; Shimatani, Z.; Yano, M.; Yoshimura, A. Ehd1, a B-type response regulator in rice, confers short-day promotion of flowering and controls FT-like gene expression independently of Hd1. Genes Dev. 2004, 18, 926–936. [Google Scholar] [CrossRef] [Green Version]
  10. Fan, C.; Xing, Y.; Mao, H.; Lu, T.; Han, B.; Xu, C.; Li, X.; Zhang, Q. GS3, a major QTL for grain length and weight and minor QTL for grain width and thickness in rice, encodes a putative transmembrane protein. Theor. Appl. Genet. 2006, 112, 1164–1171. [Google Scholar] [CrossRef]
  11. Song, X.J.; Huang, W.; Shi, M.; Zhu, M.Z.; Lin, H.X. A QTL for rice grain width and weight encodes a previously unknown RING-type E3 ubiquitin ligase. Nat. Genet. 2007, 39, 623–630. [Google Scholar] [CrossRef]
  12. Weng, J.; Gu, S.; Wan, X.; Gao, H.; Guo, T.; Su, N.; Lei, C.; Zhang, X.; Cheng, Z.; Guo, X.; et al. Isolation and initial characterization of GW5, a major QTL associated with rice grain width and weight. Cell Res. 2008, 18, 1199–1209. [Google Scholar] [CrossRef]
  13. Ashikari, M.; Sakakibara, H.; Lin, S.; Yamamoto, T.; Takashi, T.; Nishimura, A.; Angeles, E.R.; Qian, Q.; Kitano, H.; Matsuoka, M. Cytokinin oxidase regulates rice grain production. Science 2005, 309, 741–745. [Google Scholar] [CrossRef] [PubMed]
  14. Huang, X.; Qian, Q.; Liu, Z.; Sun, H.; He, S.; Luo, D.; Xia, G.; Chu, C.; Li, J.; Fu, X. Natural variation at the DEP1 locus enhances grain yield in rice. Nat. Genet. 2009, 41, 494–497. [Google Scholar] [CrossRef] [PubMed]
  15. Miura, K.; Ikeda, M.; Matsubara, A.; Song, X.J.; Ito, M.; Asano, K.; Matsuoka, M.; Kitano, H.; Ashikari, M. OsSPL14 promotes panicle branching and higher grain productivity in rice. Nat. Genet. 2010, 42, 545–549. [Google Scholar] [CrossRef] [PubMed]
  16. Kim, S.-R.; Ramos, J.M.; Hizon, R.J.M.; Ashikari, M.; Virk, P.S.; Torres, E.A.; Nissila, E.; Jena, K.K. Introgression of a functional epigenetic OsSPL14/WFP allele into elite indica rice genomes greatly improved panicle traits and grain yield. Sci. Rep. 2018, 8, 3833. [Google Scholar] [CrossRef] [PubMed]
  17. Yamada, S.; Kurokawa, Y.; Nagai, K.; Angeles-Shim, R.B.; Yasui, H.; Furuya, N.; Yoshimura, A.; Doi, K.; Ashikari, M.; Sunohara, H. Evaluation of backcrossed pyramiding lines of the yield-related gene and the bacterial leaf Blight resistant genes. J. Intl. Cooper Agric. Dev. 2020, 18, 18–28. [Google Scholar]
  18. Feng, X.; Wang, C.; Nan, J.; Zhang, X.; Wang, R.; Jiang, G.; Yuan, Q.; Lin, S. Updating the elite rice variety Kongyu 131 by improving the Gn1a locus. Rice 2017, 10, 35. [Google Scholar] [CrossRef] [PubMed] [Green Version]
  19. Hasan, M.M.; Rafii, M.Y.; Ismail, M.R.; Mahmood, M.; Rahim, H.A.; Alam, M.A.; Ashkani, S.; Malek, M.A.; Latif, M.A. Marker-assisted backcrossing: A useful method for rice improvement. Biotechnol. Biotechnol. Equip. 2015, 29, 237–254. [Google Scholar] [CrossRef] [PubMed] [Green Version]
  20. Jena, K.K.; Mackill, D.J. Molecular markers and their use in marker-assisted selection in rice. Crop. Sci. 2008, 48, 1266–1276. [Google Scholar] [CrossRef]
  21. Chen, S.; Lin, X.H.; Xu, C.G.; Zhang, Q. Improvement of bacterial blight resistance of ‘Minghui 63’, an elite restorer line of hybrid rice, by molecular marker-assisted selection. Crop. Sci. 2000, 40, 239–244. [Google Scholar] [CrossRef]
  22. Angeles-Shim, R.B.; Reyes, V.P.; del Valle, M.M.; Lapis, R.S.; Shim, J.; Sunohara, H.; Jena, K.K.; Ashikari, M.; Doi, K. Marker-assisted introgression of quantitative resistance gene Pi21 confers broad spectrum resistance to rice blast. Rice Sci. 2020, 27, 113–123. [Google Scholar] [CrossRef]
  23. Septiningsih, E.M.; Pamplona, A.M.; Sanchez, D.L.; Neeraja, C.N.; Vergara, G.V.; Heuer, S.; Ismail, A.M.; Mackill, D.J. Development of submergence-tolerant rice cultivars: The Sub1 locus and beyond. Ann. Bot. 2009, 103, 151–160. [Google Scholar] [CrossRef] [PubMed] [Green Version]
  24. McCouch, S.R.; Zhao, K.; Wright, M.; Tung, C.-W.; Ebana, K.; Thomson, M.; Reynolds, A.; Wang, D.; DeClerck, G.; Ali, M.L.; et al. Development of genome-wide SNP assays for rice. Breed. Sci. 2010, 60, 524–535. [Google Scholar] [CrossRef] [Green Version]
  25. Thomson, M.J.; Zhao, K.; Wright, M.; McNally, K.L.; Rey, J.; Tung, C.-W.; Reynolds, A.; Scheffler, B.; Eizenga, G.; McClung, A.; et al. High-throughput single nucleotide polymorphism genotyping for breeding applications in rice using the BeadXpress platform. Mol. Breed. 2012, 29, 875–886. [Google Scholar] [CrossRef]
  26. Elshire, R.J.; Glaubitz, J.C.; Sun, Q.; Poland, J.A.; Kawamoto, K.; Buckler, E.S.; Mitchell, S.E. A robust, simple Genotyping-by-Sequencing (GBS) approach for high diversity species. PLoS ONE 2011, 6, e19379. [Google Scholar] [CrossRef] [Green Version]
  27. Arbelaez, J.D.; Moreno, L.T.; Singh, N.; Tung, C.-W.; Maron, L.G.; Ospina, Y.; Martinez, C.P.; Grenier, C.; Lorieux, M.; McCouch, S. Development and GBS-genotyping of introgression lines (ILs) using two wild species of rice, O. meridionalis and O. rufipogon, in a common recurrent parent, O. sativa cv. curinga. Mol. Breed. 2015, 35, 81. [Google Scholar] [CrossRef] [Green Version]
  28. Begum, H.; Spindel, J.E.; Lalusin, A.; Borromeo, T.; Gregorio, G.; Hernandez, J.; Virk, P.; Collard, B.; McCouch, S.R. Genome-wide association mapping for yield and other agronomic traits in an elite breeding population of tropical rice (Oryza sativa). PLoS ONE 2015, 10, e0119873. [Google Scholar] [CrossRef] [Green Version]
  29. Liao, C.Y.; Wu, P.; Hu, B.; Yi, K.K. Effects of genetic background and environment on QTLs and epistasis for rice (Oryza sativa L.) panicle number. Theor. Appl. Genet. 2001, 103, 104–111. [Google Scholar] [CrossRef]
  30. Pabuayon, I.C.M.; Trinidad, J.L.; Angeles-Shim, R.B.; Kohli, A. Systems biology of crop improvement: Drought tolerance as a model to integrate molecular biology, physiology, and breeding. In Advancement in Crop Improvement Techniques; Woodhead Publishing: Southston, UK, 2020; pp. 209–231. [Google Scholar]
  31. Ikeda, M.; Hirose, Y.; Takashi, T.; Shibata, Y.; Yamamura, T.; Komura, T.; Doi, K.; Ashikari, M.; Matsuoka, M.; Kitano, H. Analysis of rice panicle traits and detection of QTLs using an image analyzing method. Breed. Sci. 2010, 60, 55–64. [Google Scholar] [CrossRef] [Green Version]
  32. McCouch, S.R. Development and mapping of 2240 new ssr markers for rice (Oryza sativa L.). DNA Res. 2002, 9, 199–207. [Google Scholar] [CrossRef]
  33. Poland, J.A.; Brown, P.J.; Sorrells, M.E.; Jannink, J.L. Development of high-density genetic maps for barley and wheat using a novel two-enzyme genotyping-by-sequencing approach. PLoS ONE 2012, 7, e32253. [Google Scholar] [CrossRef] [Green Version]
  34. Jones, M.P.; Dingkuhn, M.; Aluko, G.K.; Semon, M. Interspecific Oryza sativa L. X O. glaberrima Steud. progenies in upland rice improvement. Euphytica 1997, 94, 237–246. [Google Scholar] [CrossRef]
  35. Sakamoto, T.; Matsuoka, M. Identifying and exploiting grain yield genes in rice. Curr. Opin. Plant. Biol. 2008, 11, 209–214. [Google Scholar] [CrossRef]
  36. Jiao, Y.; Wang, Y.; Xue, D.; Wang, J.; Yan, M.; Liu, G.; Dong, G.; Zeng, D.; Lu, Z.; Zhu, X.; et al. Regulation of OsSPL14 by OsmiR156 defines ideal plant architecture in rice. Nat. Genet. 2010, 42, 541–544. [Google Scholar] [CrossRef]
  37. Lu, Z.; Yu, H.; Xiong, G.; Wang, J.; Jiao, Y.; Liu, G.; Jing, Y.; Meng, X.; Hu, X.; Qian, Q.; et al. Genome-wide binding analysis of the transcription activator ideal plant architecture1 reveals a complex network regulating rice plant architecture. Plant. Cell 2013, 25, 3743–3759. [Google Scholar] [CrossRef] [Green Version]
  38. Xu, H.; Zhao, M.; Zhang, Q.; Xu, Z.; Xu, Q. The DENSE AND ERECT PANICLE 1 (DEP1) gene offering the potential in the breeding of high-yielding rice. Breed. Sci. 2016, 66, 659–667. [Google Scholar] [CrossRef] [Green Version]
  39. Chu, J.; Zhao, Y.; Beier, S.; Schulthess, A.W.; Stein, N.; Philipp, N.; Röder, M.S.; Reif, J.C. Suitability of single-nucleotide polymorphism arrays versus genotyping-by-sequencing for genebank genomics in wheat. Front. Plant. Sci. 2020, 11, 42. [Google Scholar] [CrossRef]
  40. Kurokawa, Y.; Noda, T.; Yamagata, Y.; Angeles-Shim, R.; Sunohara, H.; Uehara, K.; Furuta, T.; Nagai, K.; Jena, K.K.; Yasui, H.; et al. Construction of a versatile SNP array for pyramiding useful genes of rice. Plant. Sci. 2016, 242, 131–139. [Google Scholar] [CrossRef] [Green Version]
  41. Chukwu, S.C.; Rafii, M.Y.; Ramlee, S.I.; Ismail, S.I.; Oladosu, Y.; Muhammad, I.; Musa, I.; Ahmed, M.; Jatto, M.I.; Yusuf, B.R. Recovery of recurrent parent genome in a marker-assisted backcrossing against rice blast and blight infections using functional markers and SSRs. Plants 2020, 9, 1411. [Google Scholar] [CrossRef]
  42. Khush, G.S. Breaking the yield frontier of rice. GeoJournal 1995, 35, 329–332. [Google Scholar] [CrossRef]
  43. Kim, S.R.; Ramos, J.; Ashikari, M.; Virk, P.S.; Torres, E.A.; Nissila, E.; Hechanova, S.L.; Mauleon, R.; Jena, K.K. Development and validation of allele-specific snp/indel markers for eight yield-enhancing genes using whole-genome sequencing strategy to increase yield potential of rice, Oryza Sativa L. Rice 2016, 9, 1–17. [Google Scholar] [CrossRef] [PubMed] [Green Version]
  44. Miura, K.; Agetsuma, M.; Kitano, H.; Yoshimura, A.; Matsuoka, M.; Jacobsen, S.E.; Ashikari, M. A metastable DWARF1 epigenetic mutant affecting plant stature in rice. Proc. Natl. Acad. Sci. USA 2009, 106, 11218–11223. [Google Scholar] [CrossRef] [PubMed] [Green Version]
  45. Bradbury, P.J.; Zhang, Z.; Kroon, D.E.; Casstevens, T.M.; Ramdoss, Y.; Buckler, E.S. TASSEL: Software for association mapping of complex traits in diverse samples. Bioinformatics 2007, 23, 2633–2635. [Google Scholar] [CrossRef] [PubMed]
  46. Kawahara, Y.; de la Bastide, M.; Hamilton, J.P.; Kanamori, H.; McCombie, W.R.; Ouyang, S.; Schwartz, D.C.; Tanaka, T.; Wu, J.; Zhou, S.; et al. Improvement of the Oryza sativa nipponbare reference genome using next generation sequence and optical map data. Rice 2013, 6, 4. [Google Scholar] [CrossRef] [Green Version]
  47. Li, H.; Durbin, R. Fast and accurate short read alignment with burrows-wheeler transform. Bioinformatics 2009, 25, 1754–1760. [Google Scholar] [CrossRef] [Green Version]
  48. Danecek, P.; Auton, A.; Abecasis, G.; Albers, C.A.; Banks, E.; DePristo, M.A.; Handsaker, R.E.; Lunter, G.; Marth, G.T.; Sherry, T.; et al. The variant call format and VCFtools. Bioinformatics 2011, 27, 2156–2158. [Google Scholar] [CrossRef]
  49. Van Berloo, R. GGT 2.0: Versatile software for visualization and analysis of genetic data. J. Hered. 2008, 99, 232–236. [Google Scholar] [CrossRef] [Green Version]
  50. Microsoft Corporation. Microsoft Excel. 2018. Available online: https://office.microsoft.com/excel (accessed on 21 January 2021).
  51. IRRI. Statistical Tool for Agricultural Research Software (STAR); International Rice Research Institute: Los Banos, Philippins, 2013. [Google Scholar]
Figure 1. Marker-assisted selection of progeny (BC3F4) using RM markers tightly linked to Gn1a and flanking the WFP. (A) Progeny were screened using RM3360 for the Gn1a allele; (B) progeny were screened using RM5493; (C) progeny were screened using RM3452 for the WFP allele. A, B, and H refer to the recipient (P1), donor (P2), and heterozygous genotypes, respectively.
Plants 10 00844 g001
Figure 2. Marker genotypes of the representative lines. Genotypes of GBS markers are represented with horizontal color lines. Chromosomes and marker positions are drawn to scale of physical lengths, and positions of Gn1a and WFP are shown in short bold black lines. (A) Selected lines with Gn1a-ST12, (B) selected lines with Gn1a-ST6, (C) selected lines with WFP-ST12, (D) selected lines with WFP-ST6, (E) selected lines with Gn1a-ST12 + WFP-ST12, (F) selected line with Gn1a-ST6 + WFP-ST6.
Plants 10 00844 g002
Figure 3. Number of spikelets per panicle (mean ± SD) of Gn1a-ST12 introgression lines in the genetic backgrounds of NERICA1 (A), WAB56-50 (B), NERICA6 (C), and WAB56-104 (D). Solid and white bars show the results in 2017DS and 2017WS, respectively. Different letters above the bar graphs indicate significant difference at p < 0.05.
Plants 10 00844 g003
Figure 4. Number of spikelets per panicle (mean ± SD) of Gn1a-ST6 introgression lines in the genetic backgrounds of NERICA4 (A), WAB56-50 (B), and WAB56-104 (C). Solid and white bars show the results in 2017DS and 2017WS, respectively. Different letters above the bar graphs indicate significant difference at p < 0.05.
Plants 10 00844 g004
Figure 5. Number of primary branches per panicle (AC) and numbers of spikelets per panicle (DF) (mean ± SD) of WFP-ST12 introgression lines in the genetic backgrounds of NERICA1 (A and D), WAB56-50 (B and E), and WAB56-104 (C and F). Solid and white bars show the results in 2017DS and 2017WS, respectively. Different letters above the bar graphs indicate significant difference at p < 0.05.
Plants 10 00844 g005
Figure 6. Number of primary branches per panicle (A) and numbers of spikelets per panicle (B) (mean ± SD) of WFP-ST6 introgression lines in the genetic background of WAB56-50. Solid and white bars show the results in 2017DS and 2017WS, respectively. Different letters above the bar graphs indicate significant difference at p < 0.05.
Plants 10 00844 g006
Figure 7. Number of primary panicle branches (AC) and number of spikelets per panicle (DF) (mean ± SD) of stacked introgression lines of Gn1a-ST12 and WFP-ST12 in the genetic backgrounds of NERICA1 (A and D), WAB56-50 (B and E), and WAB56-104 (C and F). Solid and white bars show the results in 2017DS and 2017WS, respectively. Different letters above the bar graphs indicate significant difference at p < 0.05.
Plants 10 00844 g007
Figure 8. Number of primary panicle branches (A) and number of spikelets per panicle (B) (mean ± SD) of stacked introgression lines of Gn1a-ST6 and WFP-ST6 in the genetic background of WAB56-50. Solid and white bars show the results in 2017DS and 2017WS, respectively. Different letters above the bar graphs indicate significant difference at p < 0.05.
Plants 10 00844 g008
Figure 9. Gross morphology of NERICA and WAB rice cultivars, and the Gn1a and WFP rice line donors ST12 and ST6. Scale bar = 20 cm.
Plants 10 00844 g009
Figure 10. Marker-assisted backcross breeding scheme of Gn1a and WFP introgression in NERICA and WAB rice cultivars.
Plants 10 00844 g010
Table 1. Total number of SNPs and recurrent parent genome recovery range of WISH lines.
Genetic BackgroundTotal Number of SNPsRecurrent Parent Genome Recovery Range of BC3F4 Population (%)
NERICA1 × ST12141885.4–98
NERICA4 × ST6117584.5–87.7
NERICA6 × ST12165894.8
WAB56-104 × ST6161477.7–96.9
WAB56-104 × ST12106480.6–93.1
WAB56-50 × ST12187388.3–96.7
WAB56-50 × ST682881.2–95.3
Table 2. List of microsatellite markers used to monitor the introgression of Gn1a and WFP in recipient lines.
MarkerForward Primer SequenceReverse Primer SequenceTarget Gene
RM3360ACTTACACAAGGCCGGGAAAGGTGGTAGTGGTAACTCTACTCCGATGGGn1a
RM3452TGGACTTGGTCTCTCCAAACTCCCAGTATGTGTTGGTGGGTCAAGCWFP
RM5493GCGGTAACAAACCAACCAACCAAAGCAGGACACAGTCACACAGGWFP
Publisher’s Note: MDPI stays neutral with regard to jurisdictional claims in published maps and institutional affiliations.

