Article

Assessing the Impact of Geographical Distribution and Genetic Diversity on Metabolic Profiles of a Medicinal Plant, Embelia ribes Burm. f.

Department of Botany, Savitribai Phule Pune University, Pune 411007, India
*
Author to whom correspondence should be addressed.
Submission received: 15 September 2022 / Revised: 8 October 2022 / Accepted: 20 October 2022 / Published: 27 October 2022

Abstract

:
The extensive use of Embelia ribes Burm. f. (Embelia) in tribal medicine proclaimed global attention as a promising candidate in complementary and alternative medicine. The knowledge of chemical blends is a prerequisite for the selection of raw materials for herbal medicine formulations; however, the influence of geographical distance and genetic diversity on the metabolome of Embelia fruits is unknown. Therefore, we collected Embelia fruits from four locations across the Western Ghats of India and analyzed the metabolic profile and genotypic diversity of Embelia fruits by liquid chromatography-tandem mass spectrometry (LC-MS/MS) and inter simple sequence repeats (ISSR), respectively. LC-MS/MS analysis yielded 583 compounds; however, the trimmed data resulted in 149 compounds. Further, MS/MS analysis identified 36 compounds, among which we reported 30 compounds for the first time from Embelia. These compounds belong to 11 compound classes that suggest location-specific chemical blends of Embelia fruits. Multivariate analysis showed 94% compound diversity across the accessions. ISSR analysis suggests 95% polymorphism across the accessions. A significant positive correlation (80%) between metabolomics and genotypic data matrices validates the genotype’s influence in tuning Embelia’s metabolic profiles. We conclude that the chemical profiles of Embelia are location-specific, which can be explored for the selection of herbal trade sustainably.

Graphical Abstract

1. Introduction

Embelia ribes Burm. f. (Embelia) [1] is a liana that belongs to the family Primulaceae. Since ancient times, the use of Embelia fruits has been widespread in the form of the drug Vidanga. Embelia’s distribution in India ranges from the outer Himalayas to the Western Ghats, at an elevation of up to 1500 m [2] in fragmented populations. The sparse distribution of Embelia in the evergreen to moist deciduous forests of Maharashtra, Karnataka, and Kerala in the Western Ghats and Tamil Nadu in the Eastern Ghats, is evident. The different plant parts of Embelia are used in herbal formulations, as it is rich in various medicinally important molecules, namely embelin and its derivatives, embeliol, 5-O-Methylembelin, and vilangin that have high commercial value. Hence, the pharmacology of Embelia has attracted global attention as a promising candidate in various traditional, complementary, and alternative systems of medicine. In traditional and tribal medicine, the fruits, stems, roots, and leaves of Embelia are used as anthelmintic, antipyretic, and antimicrobial agents. In addition, they are also used to treat diarrhea, kidney stones, snake bites, and bronchitis. However, the fruits of Embelia are more common in traditional medicine and herbal formulations than their leaves and roots. Interestingly, the use of the same plant parts varies from region to region. For example, fruit decoction of Embelia is given for intestinal worms in Kerala [3], antimicrobial medication in Karnataka [4], diarrhea in Arunachal Pradesh, and influenza and snakebite in the Khandesh region of Maharashtra [5]. However, as the climatic condition of the Khandesh region is not suitable for Embelia growth, its use in this region questions the authentication of the used fruits.
The geographical origin and climatic conditions are the notable factors that affect the metabolome of a plant. Plants are adapted to the different geographical, climatic, and edaphic conditions by genotypic and phenotypic alterations. The genotypic alteration also influences the production and accumulation of secondary metabolites in plants [6,7]. Though the specialized metabolite profile is unique to individuals within a species or a close taxonomic group, it may alter if its biosynthetic pathways are influenced by environmental conditions such as climate, soil, pathogens infection, and pest infestation. Therefore, regional variation in the use of the same plant parts can be due to the presence of different blends or proportions of active compounds in them, which in turn links the geography and climate of the habitat of Embelia. In 2011, Saurabh demonstrated that geographical topography and climatic conditions profoundly affect the levels of polyphenols in the bark of Bridelia retusa [8]; similarly, the effect of geographical and climatic conditions on the camptothecin content in Nothapodytes nimmoniana is also demonstrated [9]. Recently, a comparative study of the concentrations of embelin, Embelia’s principle component in its fruit from different geographical regions, underlined that the geographic location of a plant could govern the change in the concentration of its principal component [10]. Previously, a comparative analysis of fatty acid composition in the seeds of E. schimperi [11] and fatty acids and esters from E. basal have been attempted [12]; however, the non-targeted metabolomics of Embelia fruits from different geographical regions are yet to be revealed.
Metabolomics has been used for the identification of marker compounds to detect physiological changes, genotype differences, geographic origin, and quality control [13,14]. In a study with the fruit of Butia sp., rutin, epicatechin, isorhamnetin, and stilbene were identified as the significant markers in discriminating the geographic origins and species [15]. Moreover, with the globalization of traditional medicine systems such as Ayurvedic medicine and traditional Chinese medicine, many Asian medicinal plant species are being introduced to cultivation outside of their geographical origins, particularly in the EU and US [16]. As these ecosystems are significantly different from their native origin, these species suffer from measurable differences in chemical composition. In general, studies focus on a single compound or a class of compounds to evaluate the effect of climatic or geographical conditions [17]; however, a plant’s whole metabolome is rarely considered for intensive analysis in response to changes in its geographical conditions. To improve global health through traditional and complementary medicine, the World Health Organization (WHO) emphasizes the rational use of raw materials based on evidence and strategic research in traditional and complementary medicine. Embelia, a tremendously important medicinal plant of traditional and complementary medicine, is widely exploited. Therefore, determining the metabolic profile of Embelia is a prerequisite for developing new drugs. However, the metabolome of Embelia and the impact of different geographical regions on it is not known. Determining Embelia’s metabolic profile from different locations will provide its complete metabolic blend and reveal new compounds with potential medicinal importance. Moreover, it will allow the sustainable use of Embelia fruits. Therefore, in the current study, we analyzed the non-targeted metabolomic profiles of the Embelia fruits collected from different regions of the Western Ghats of India using liquid chromatography coupled with tandem mass spectroscopy (LC-MS/MS) to identify potential compounds for drug development, and attempt to reveal the relationship between the metabolomic and genotypic diversity.

2. Results

2.1. Molecular Identification of Fruit Samples Collected from Different Geographical Regions

Fruit samples collected across all the accessions (Figure 1A) were evaluated for their size and texture. Interestingly, fruits from Kodkani, Karnataka, and Wayanad, Kerala, are significantly larger and smaller than those from other accessions, respectively (Figure 1B). The fruit size of the Kodkani accession is significantly more than the other accessions (one way ANOVA, F4,18 = 12.91; p = 0.0002). Moreover, the fruits from Kodkani were spherical, whereas fruits from other locations were obovate. On the other hand, Wayanad fruits are the least wrinkled among other accessions (Figure 1B inset). Dissimilarities in Embelia fruit morphology necessitate the molecular identification of the collected samples. Chloroplast maturase K gene (matK) is one of the most variable coding genes of angiosperms and is used for the identification of plant species. Molecular identification by matK amplification is often used for the accurate genetic identification of an organism. Therefore, all the samples were evaluated by comparing the sequence homology of the matK gene with the reported sequence of E. ribes in the NCBI database (Table S1). The maximum percent identity and query cover threshold was more than 98% and 85%, respectively. Further, a phylogenetic tree was constructed with the matK sequences from all the Embelia accessions, E. tsjeriam-cottam (Roem. & Schult.) A. DC. and Maesa indica (Roxb.) A. DC. sequences (Figure 1C); E. tsjeriam-cottam and M. indica were used as outgroup. Embelia accessions collected across the Western Ghats did not show any genetic distances, whereas the outgroups showed a significant genetic distance from the Embelia accessions (Figure 1C). Our results confirmed the identity of the collected fruits as E. ribes.

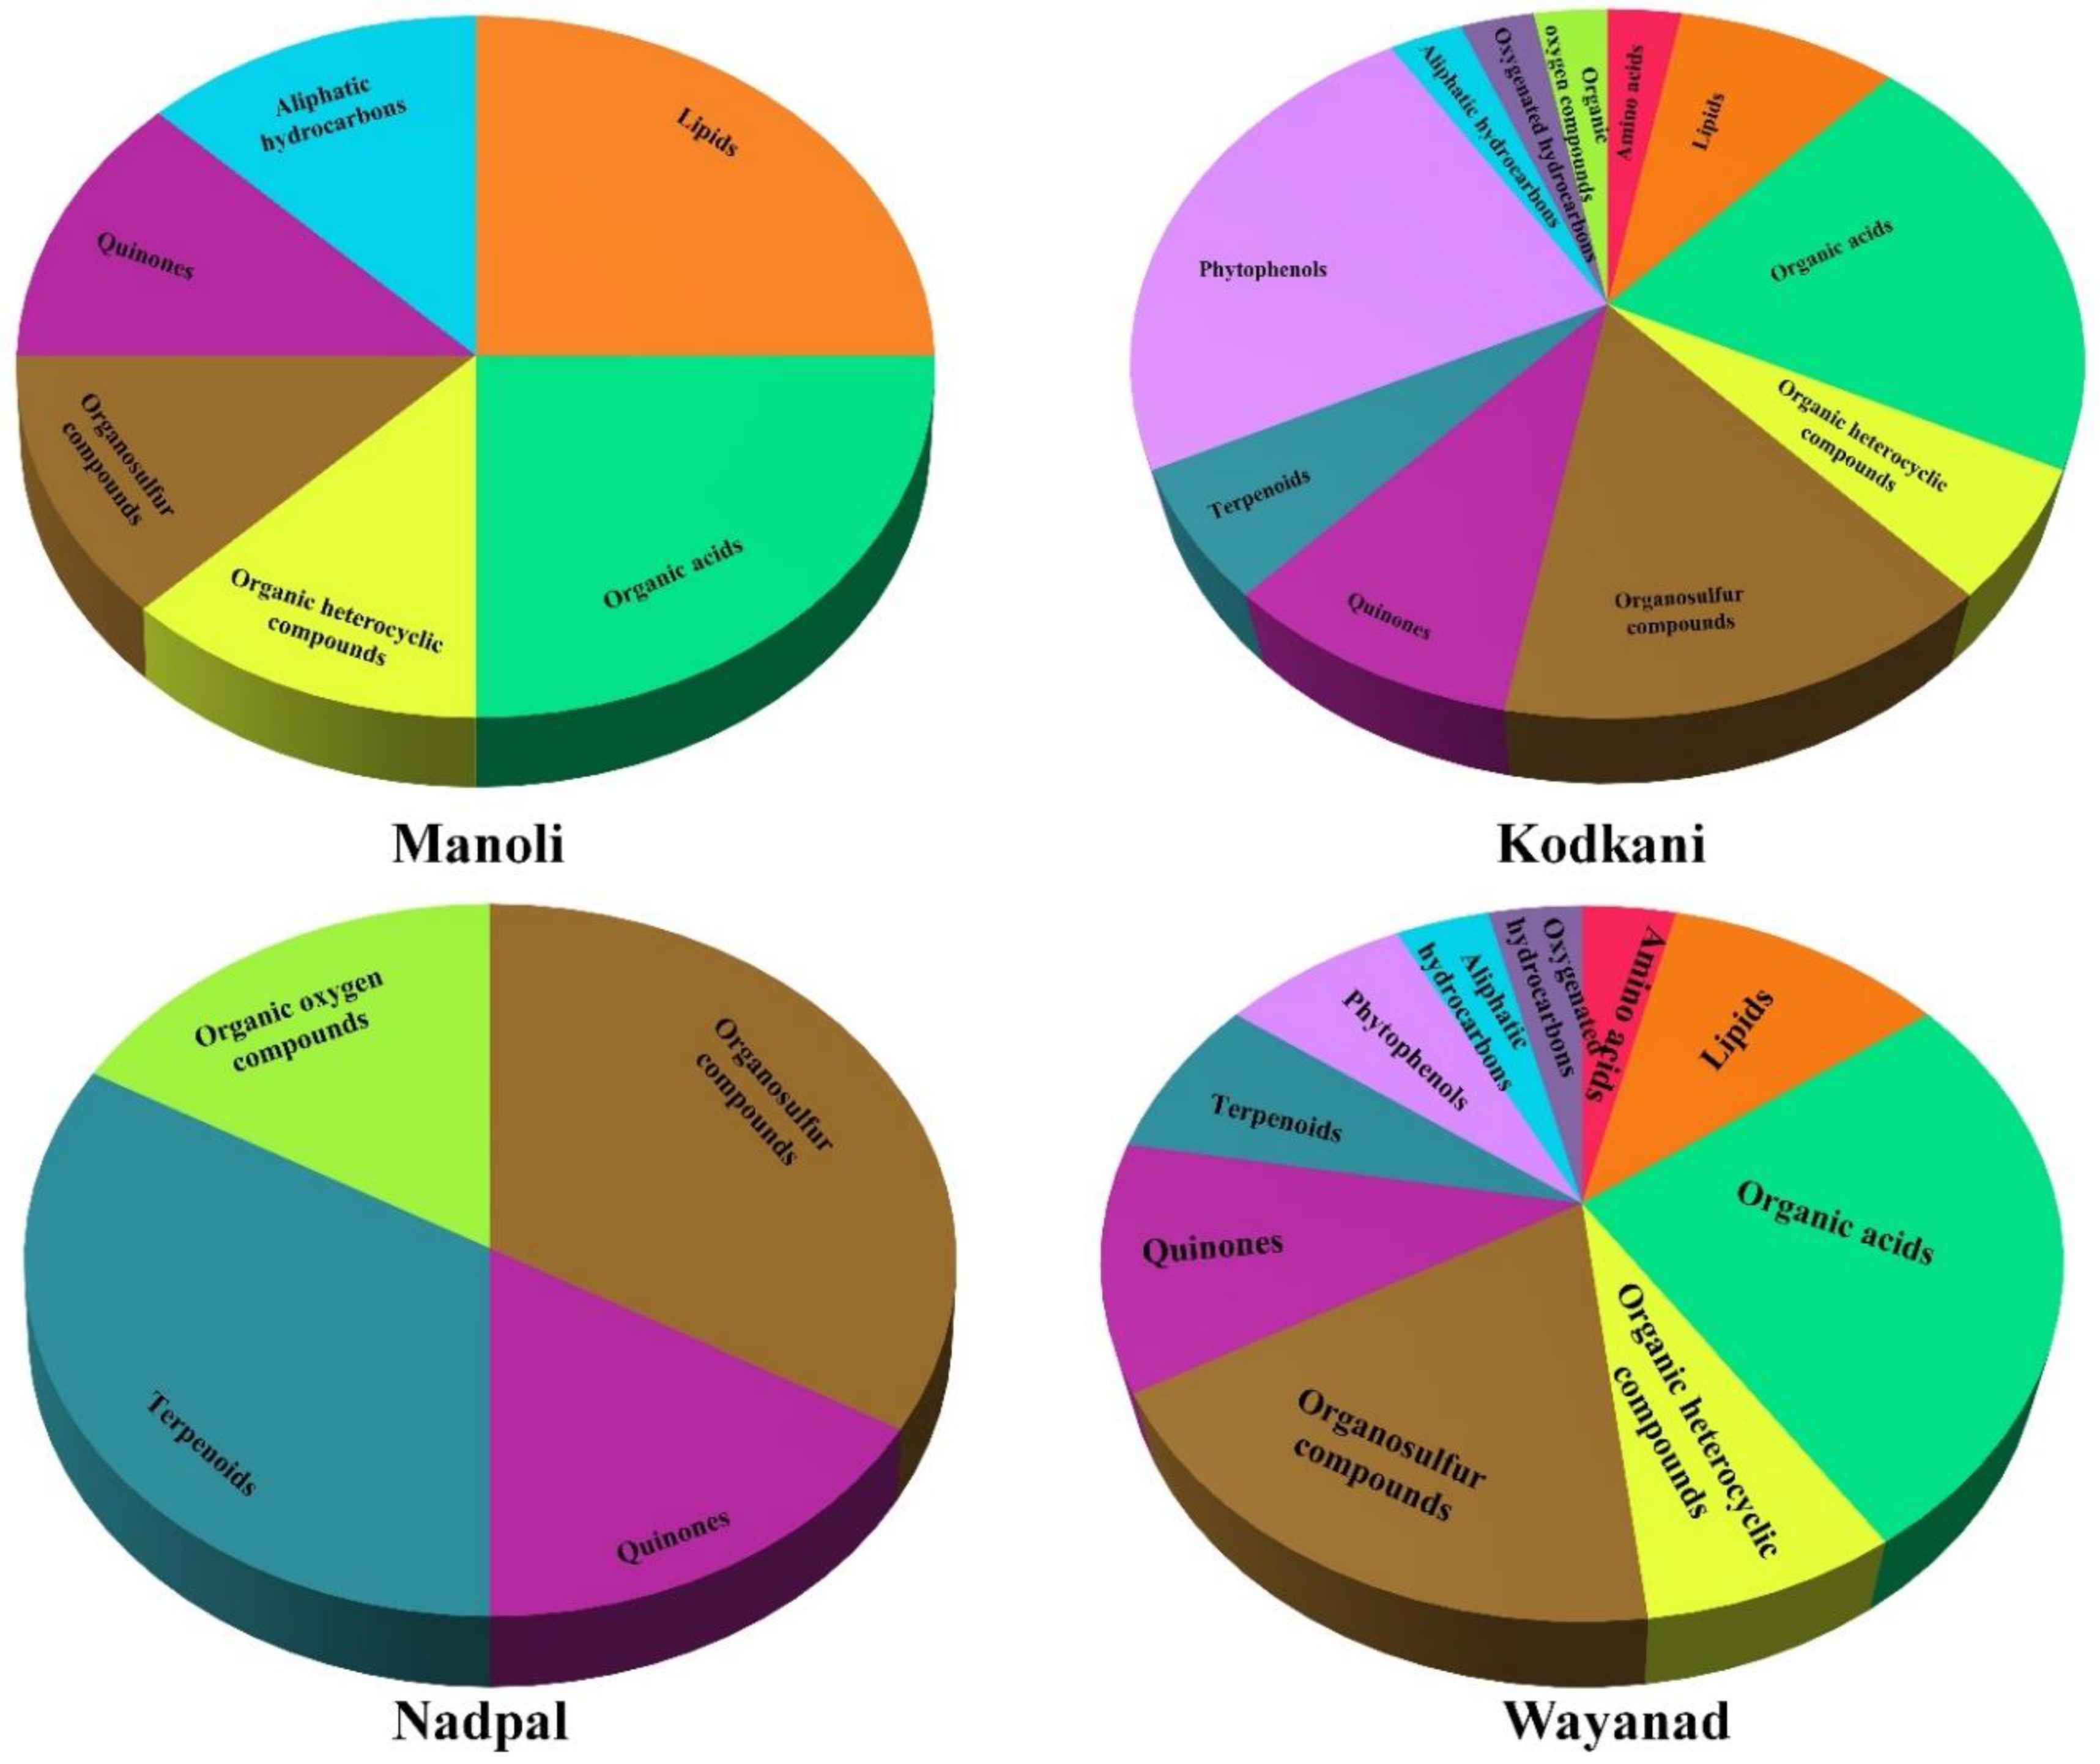
2.2. Metabolic Profiles of Embelia Fruits Vary across the Accessions

The ethonopharmacological uses of Embelia fruits are different across geographical regions. The use of Embelia fruits for different ailments suggests that fruits from different locations may have a different blend of compounds that are useful for specific diseases. Therefore, we analyzed the metabolic profiles of Embelia fruits from different accessions. A total of 583 compounds are obtained from negative and positive modes from all the accessions (Data S1). The maximum number of compounds were present in the Kodkani accession (380 compounds); the Manoli accession is comprised of 352 compounds; Wayanad and Nadpal accessions are comprised of 346 and 341 compounds, respectively (Data S1).
The compounds present in all five replicates of any of the accessions are tentatively identified based on the formula. This trimmed data resulted in 149 compounds (Table S2), and the identity of 36 compounds was determined in MS/MS mode (Table 1, Figures S1 and S2). The identity of embelin, a prime compound of Embelia, from fruits samples was confirmed by HPLC (Figure S3). All further analysis was done with the 36 identified compounds. Similar to the raw data, Kodkani accession possesses the maximum number of compounds (34), followed by Wayanad (27), Manoli (8), and Nadpal (6). Interestingly, out of 36 identified compounds, 30 are reported for the first time from Embelia.
A heatmap was created with the identified compounds to visualize the compound diversity (Figure 2). Principal coordinate (PCoA) and cluster analysis determined the relationship between the accessions. PCoA ordination captured maximum variation in coordinates 1 and 2, where Kodkani and Wayanad accession form a group, but Manoli and Nadpal accession is placed separately (Figure 3A). Like the PCoA, the cluster analysis also placed Kodkani and Wayanad accessions in the same clade (Figure 3B); Manoli accession is close to this cluster but in a separate clade. The three accessions are grouped as one large cluster that is further connected to a separated clade of Nadpal accession. The high bootstrap value (99) of the cluster of Kodkani and Wayanad accessions signifies their metabolic similarity compared to the other accessions.
We look further to find the compound similarities across the accessions by creating the Venn diagram (Figure 3C, Table 1). We found that only two compounds, embelin and n-propyl sec-butyl disulfide, are present in all the accessions. The number of unique compounds present in Manoli (hexenyl-(3z)-hexenoate (3z-)) and Wayanad (bolegrivialol) accessions is one; however, Kodkani accession possesses six unique compounds (Figure 3C, Table 1) that belong to the phytophenols, namely 3,4,5-Trihydroxyflavanone, Dihydro 3-coumaric acid, quercetin, isoquercitrin, naringenin, and piceatannol (Table 1). On the contrary, Nadpal accession did not show the occurrence of any unique compounds. Moreover, through the pairwise analysis of similarity percentage (SIMPER test; Bray-Curtis dissimilarity index) in the compounds at a 50% cut-off, we identified 15 compounds responsible for the grouping accessions (Table S3).

2.3. Identified Compounds Represent Major Chemical Groups and Potential Medicinal Properties

Compounds identified by MS/MS analysis were classified according to their chemical classes, which include quinones, phytophenols, terpenoids, organosulfur compounds, organic acids, aliphatic hydrocarbons, lipids, oxygenated hydrocarbons, organic oxygen compounds, organic heterocyclic compounds, and amino acids (Figure 4). Interestingly, Kodkani accession possesses all the 11 groups of compounds that suggest it as the most diverse accession among all. Compounds present in Manoli, Nadpal, and Wayanad accessions represent six, four, and 10 compound groups, respectively. Quinones and organosulfur compounds are present across all the accessions; however, different accessions show a different blend of compounds (Figure 4). Reports suggest that most identified compounds are active against different ailments mainly cancer, cardiac disorder, and oxidative stress (Table S4). There are a few new compounds, namely 1-pentanesulfenothoic acid, 2-formylglutarate, ethyl 1-methylpropyl disulfide, galactonic acid, 3-isopropylmalic acid, and 3-furoic acid whose functions are not known yet (Table S4).

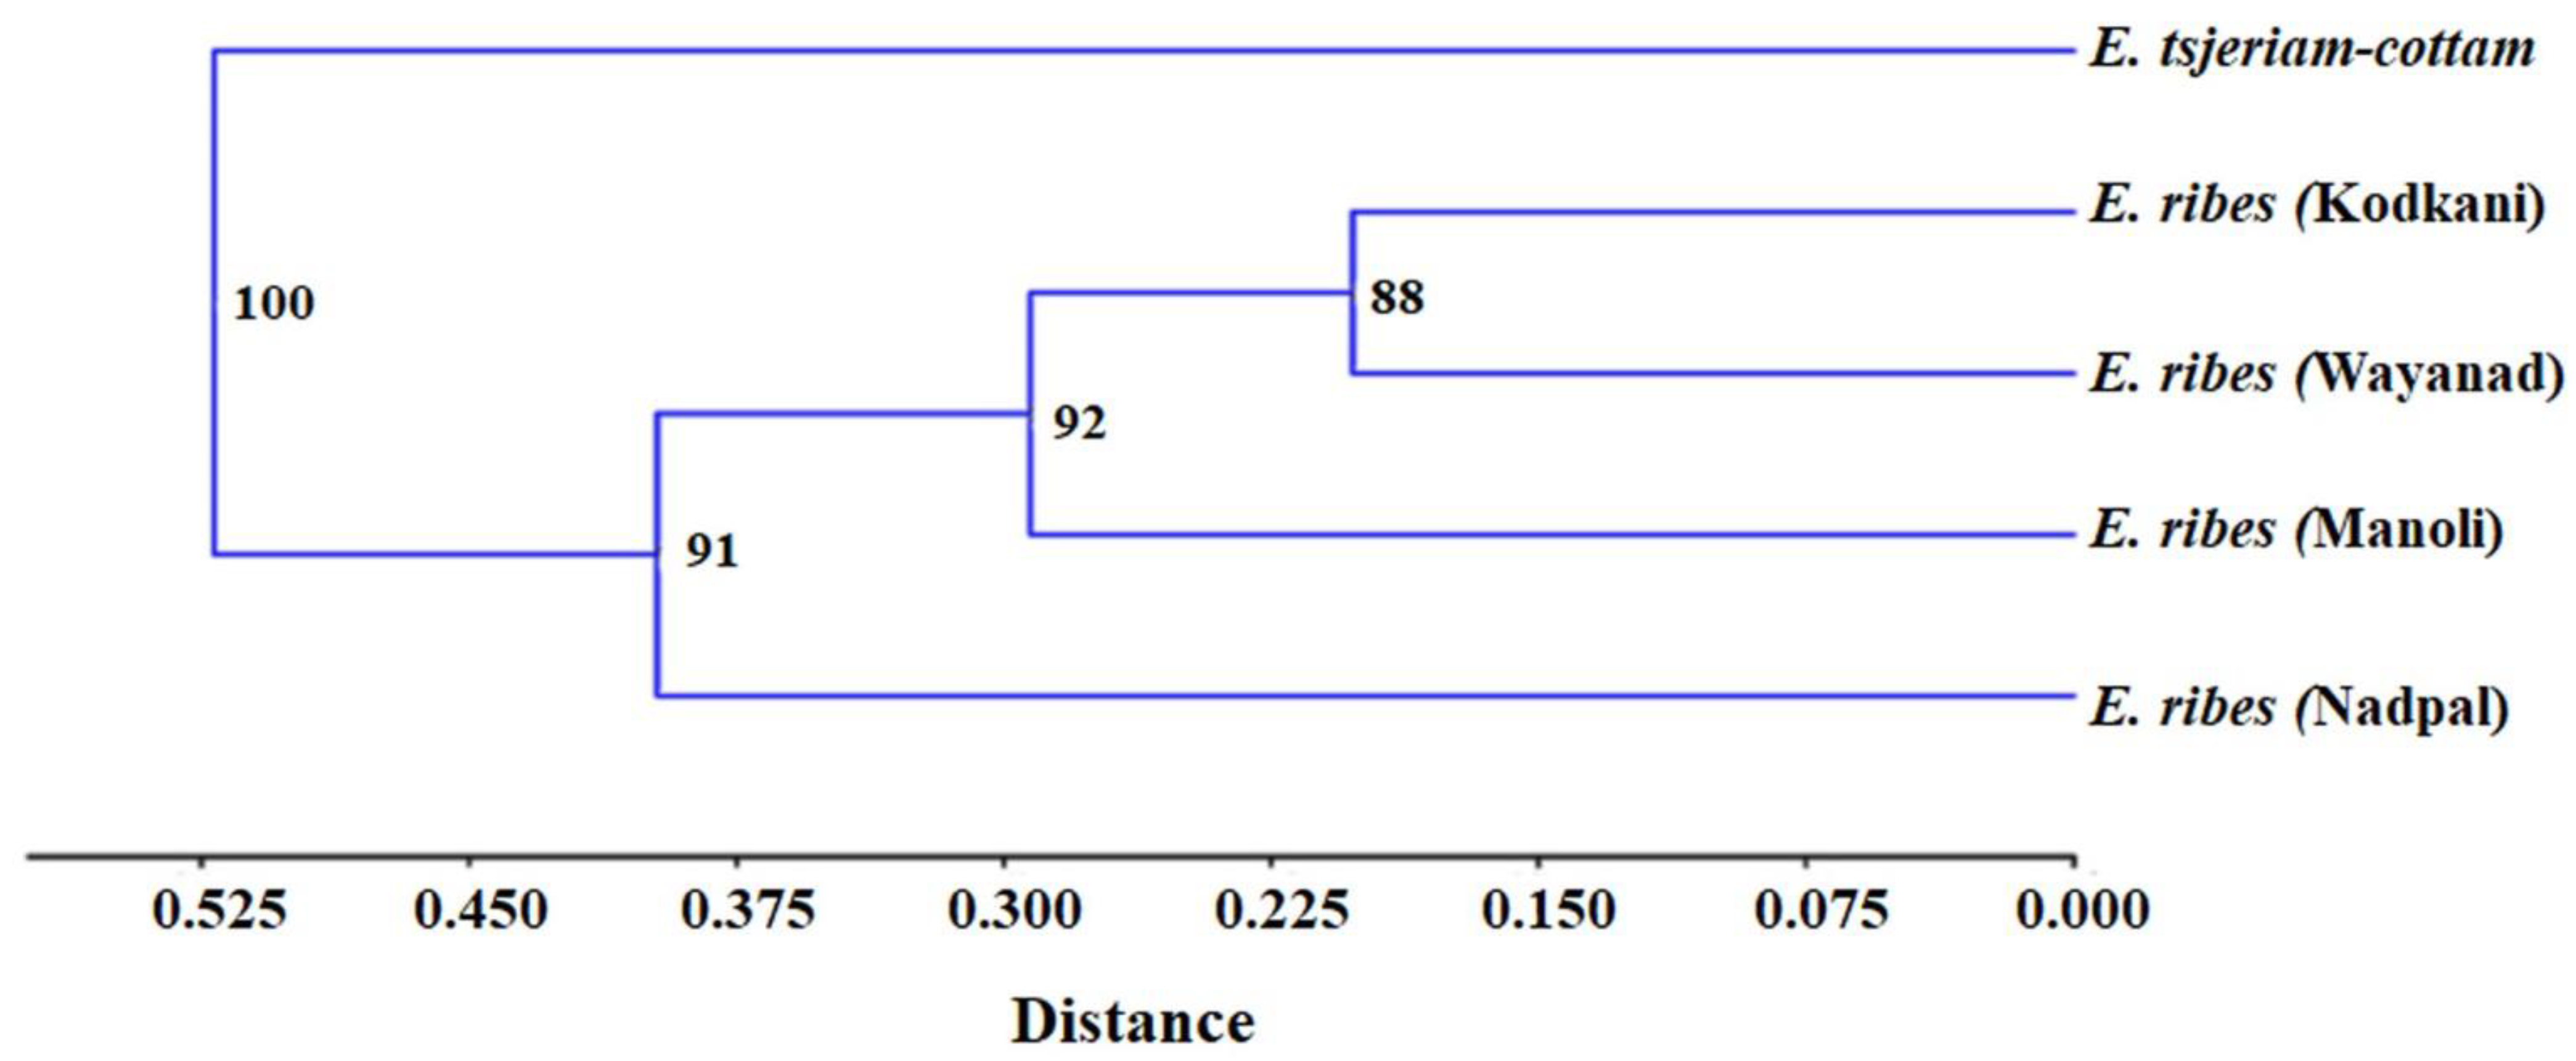
2.4. Accessions of Embelia Are Genetically Diverse

Differences in fruit phenotype hinted towards the genetic diversity of Embelia across the accessions. Moreover, genetic variability is one of the prime factors that tunes plants’ metabolic profiles. Therefore, to check if the genotypic diversity orchestrates the metabolic variations across the Embelia accessions, we examined the genotypic diversity of Embelia accessions with inter simple sequence repeat (ISSR) markers. As demonstrated in a previous study, we used nine ISSR markers (Table S5) that are polymorphic for Embelia plants [18]. All the markers yielded robust and reproducible polymorphic amplification patterns. Ninety-four bands were generated, with an average of 10.4 products per primer. Among these, 90 bands (95.74%) were polymorphic and four (4.25%) were monomorphic (Table S6). The number of polymorphic bands ranged from six (in the case of primer 816) to 13 (in the case of primer 857) (Table S6). While the primers 809, 857, and 881, had a high percentage of polymorphic bands (PPB), primer 816 showed the lowest PPB (6.38%) (Table S6). A hierarchical cluster was generated with the binary matrix using an unweighted neighbor-joining method with Jaccard’s coefficient of dissimilarity that clustered the accessions into two main clades, and the clades having Embelia accessions are further formed into three clades (Figure 5). The presence of Wayanad and Kodkani accessions in the same clade suggests that they share the maximum similarity. Interestingly, Manoli accession shares similarities with Wayanad, Kodkani, and Nadpal accessions. E. tsjeriam-cottam was used as an outgroup that showed significant differences with Embelia accessions and clustered separately. In the Embelia cluster, the high percentage of polymorphism suggests high genetic variability among the accessions under study.

2.5. Metabolic Diversity in Embelia Fruits Correlates with Genotypic Diversity

As the cluster analysis with metabolite and ISSR matrix showed similar grouping of the accessions, we hypothesized that metabolomic variation in different Embelia accession is due to their genotypic diversity. Therefore, we performed Mantel’s test with both matrices. Mantel’s test showed significant positive correlation (R = 0.799; p = 0.043) between genotypic and metabolic data matrix. Therefore, we conclude that their genotype governs the metabolic diversity in Embelia fruits along the Western Ghats accessions.

3. Discussion

The different parts of Embelia plants, especially the fruits, are predominantly used in folklore medicine. However, a detailed study of the active principles and their benefits and risks need to be evaluated to integrate traditional medicine practices into healthcare systems. However, limited information on the chemical profiles of Embelia fruits made it challenging to predict the compound or blend of compounds presumably responsible for a specific ailment’s remedy. The geographical region-specific use of Embelia fruits against various ailments stemmed us to study their metabolic profiles across different geographical regions. Our study is the first attempt at the non-targeted metabolic profiling of Embelia fruits that reveals Embelia’s chemical diversity associated with their geographical location, genotypic diversity, and ethnopharmacology. Moreover, new compounds can be explored further for their functionality against ailments.
Our study highlighted that the metabolic blend of Embelia fruit varies across geographical regions. The climatic and edaphic differences restricted to a particular geographical area could govern the chemistry of a plant [8]. Chemical diversity in the plants also validates the region-specific use of the Embelia fruits against various ailments. Unfortunately, the metabolic profile of Embelia fruit is mainly unknown, as most of the studies focused on the major chemical groups, namely, quinones, flavonoids, essential oils, etc. [10,19,20]. We demonstrate a spectrum of varied compounds across the different accessions from the Western Ghats of India. On a geographical scale, two Karnataka accessions, Nadpal and Kodkani, are situated in proximity with an aerial distance of 132.35 km. Therefore, these accessions share fewer climatic and topographical variations. However, the multivariate analysis of the chemical compositions did not group Kodkani and Nadpal; surprisingly, Kodkani is grouped with Wayanad accession, which is 361.38 km (aerial distance) away from the Kodkani accession. Interestingly, the Manoli accession is 361.38 km and 632.65 km away from Kodkani and Wayanad accession, respectively, and showed similar percent similarity in the compound profile with both locations. These observations question the contribution of geographical parameters to the chemical diversity among different locations. Plant populations may respond genetically to differential selection pressures brought by environmental factors, such as climatic heterogeneity and geographic isolation [21], and plants’ genetic diversity could be the major player in their observed metabolic diversity. An analysis of genetic diversity with ISSR markers revealed high genetic variation across the accessions. Embelia requires particular geographical conditions to grow and distribute in patches; therefore, high genetic variability among the Embelia accessions contradicts the fact that geographically restricted species tend to have less genetic variation than the standard widespread species [22]. On the other hand, reports also suggest that species distributed in patches showed more significant differentiation than the more continuously distributed species [23]. Moreover, species with small populations and less genetic variability are vulnerable to extinction [24]. Therefore, presumably, being a sparsely distributed and threatened species, Embelia showed high genetic variation among the accessions, making it less prone to extinction. A significant correlation between the matrices of ISSR and metabolic data confirms that metabolic diversity in Embelia fruit is attributed to its genetic variability.
In traditional and folklore medicine, Embelia fruits are mainly used as antihelmintic, antidyspepsia, appetizer, mild-laxative, carminative, alexiteric, and antipyretic. However, to treat a particular disorder successfully, the presence of a specific compound or a blend of compounds is necessary. Chemical variation in the plant sample can influence the effectiveness of the formulated drugs against a particular disease. Therefore, the selecting of raw materials based on their chemical composition is a prerequisite. Variations in the traditional use maybe rely on this hypothesis. Therefore, we categorized the identified compounds from Embelia fruits according to their functionality. The compounds having antipyretic, antihelmintic, and antioxidant activity, is fairly equally distributed throughout all the accessions (Table S4); this supports the use of Embelia fruits as antipyretic and antihelmintic across all regions. In folklore medicine, Embelia fruits are used for the treatment of cancer, mainly in Karnataka [25]. Interestingly, Embelia fruits from Kodkani, one of the Karnataka accessions, are dominated by compounds with anticancerous properties. Previous reports have designated embelin and its derivatives from Embelia as anticancerous compounds; however, we identified other compounds with similar properties but different mechanisms of action. Moreover, piceatannol, a unique compound present in Kodkani accession, is a hypoglycemic agent [26,27]; this correlates with the use of Embelia fruits against polyuria, which may cause by the hyperglycemic condition. Compounds that control cardiac rhythm and have anticoagulant properties from the Karnataka accessions also justified the local use of Embelia fruits against cardiac ailments. There is a growing importance of phytochemicals as male contraceptives because the anti-fertility effects of phytochemicals are reversible. For instance, sterility induced by embelin in male albino rats was reversed within 15–30 days [28]. Therefore, the chemical constituents showed that anti-fertility properties are clinically crucial for developing male contraceptives [29]. Polyphenols from Mucuna urens. can inhibit the endogenous gonadotrophic activity in male albino rats [30]; therefore, the presence of different phytophenols can be examined as a potential target to develop male contraceptives. The current study is the first non-targeted metabolomics study of Embelia fruits that highlighted the region-specific compounds blend governed by intraspecific genetic variations. We found a few compounds, namely 1-pentanesulfenothoic acid, 2-formylglutarate, ethyl 1-methylpropyl disulfide, galactonic acid, 3-isopropylmalic acid, and 3-furoic acid, whose functions are unknown. Testing these compounds against mammalian cell lines may reveal their new potential use. Moreover, the generated metabolomic profiles can be utilized as a metabolic fingerprint of the accessions during the formulation of new herbal drugs. The identification of favorable chemotypes will support quality control and the sustainable use of the plant materials.

4. Materials and Methods

4.1. Plant Material

Embelia fruits were used for metabolic and genetic diversity analysis. Fruits collected by the local villagers from the forest around Manoli, Kolhapur, were procured from local roadside sellers; fruits were also collected from the forests of Nadpal, Karnataka (Nadpal accession), Kodkani, Karnataka (Kodkani accession), and Wayanad, Kerala (Wayanad accession). The leaf tissues of E. tsjeriam-cottam and Maesa indica were collected from the Savitribai Phule Pune University (SPPU) medicinal garden and used for genetic diversity analysis as an outgroup. Specimen samples from each location and genotype are deposited at the Department of Botany, SPPU.

4.2. Metabolite Extraction and LC-MS/MS Acquisition

Dried Embelia fruits were pulverized and ~40 mg of tissue was extracted in 400 µL 70% methanol (v/v) spiked with the internal standard formononetin (2 µg ml−1) by vortexing overnight. The extracts were centrifuged for 20 min at 13,000 rpm at 4 °C and the supernatant was collected. Further, the supernatant was filtered through microfilters (20 µm) and subjected to LC-QTOF-MS/MS (Agilent Technologies, Stuttgart, Germany) for analysis.
A Zorbax C18 (1.7 μm, 2.1 mm × 100 mm) column was used to separate metabolites. The mobile phases used were 0.1% formic acid (solvent A) and acetonitrile containing 0.1% formic acid (solvent B). Separation was achieved at a flow rate of 0.3 mL min−1 and a column temperature of 25 °C. The solvent gradient profile followed an initial isocratic separation with 95% A (1 min) followed by the gradient of solvent A 5%, B 95% until 12.00 min, solvent A 95%, and B 5%, until 12.5 min, that extended up to 16th minute. The mass spectrometer was used in centroid mode for both negative and positive ionization with a pump limit of 1 min, draw speed of 200 µL min−1, and eject speed of 400 µL min−1. Samples were analyzed with an injection volume of 10 µL where the pressure limit in the column was maintained at 0 to 800 bar, retention time (RT) exclusion tolerance was maintained at (±) 0.2 min, and ion source (dual ESI) with a limit of two precursors per minute.

4.3. LC-MS/MS Data Analysis

The personal compound database and library (PCDL) Mass Hunter Qualitative Analysis BO.07.00 tool (Agilent technologies) was used to analyze the compound spectra. The PCDL library was made by accessing mainly the METLIN database, all possible libraries for the medicinally important and general plant metabolites and phytochemicals associated with medicinally essential plants. MS/MS acquisition was performed with five replicate fruits to examine the biological variations within the accession and reproducibility. To eliminate the background contaminant compounds from the analysis, only the compounds with an abundance greater than 10,000 counts and a score of more than 70 are considered. These trimmed compounds were screened against PCDL library and resulted in 3574 compounds. Compounds were identified using the ‘find by formula’ function in the software package with a mass threshold of 7 ppm and a peak distance threshold of 10 ppm in MS mode. The resulting 583 compounds were further trimmed based on their presence in all five replicates of any accessions resulting in 149 compounds across the accessions. These compounds were analyzed in MS/MS mode for the presence of the daughter ions to confirm their identity. Finally, 36 compounds were identified in MS/MS mode (Table 1, Figures S1 and S2).

4.4. Genomic DNA Isolation, and Polymerase Chain Reaction (PCR)

DNA was isolated using a CTAB-STE method by Doyle and Doyle with modifications [31,32]. Isolated DNA was dissolved in TE buffer and quantified in Nanodrop (ND-1000 Spectrophotometer). 100 ng of isolated DNA was amplified using the matK gene-specific primer pairs (forward 5′ TCCGCTACTGGGTAAAAGATG 3′, reverse 5′ ATATCGCCCCAAATCGGTCA 3′) and nine inter simple sequence repeat (ISSR) primers (Table S5) in a thermocycler (Biorad) with one cycle of initial denaturation (95 °C for 2 min), 40 cycles (matk) or 34 cycles (ISSR) of denaturation (95 °C for 15 s), annealing (60 °C for matK or 50–60 °C for ISSR) (Table S5) for 1 min, extension (72 °C for 30 s), and one cycle of final elongation (72 °C for 7 min). The amplified DNA was separated on a 1.5% agarose gel and documented on a gel documentation system (Biorad).

4.5. Sequencing and Data Analysis

Amplified products by matK primers were outsourced for Sanger sequencing (Bioserve). Obtained sequences were analyzed using the CROMAS (version 2.6.6) software and aligned using multiple sequence comparison by log expectation (MUSCLE www.ebi.ec.uk (accessed on August 2021). Homology searches were performed within the Genbank non-reductant database using the BLAST algorithm (http://www.ncbi.nim.nih.gov./BLAST/ (accessed on 31 August 2021). All the matK sequences generated have been deposited in the NCBI GenBank database (Accession numbers: Bank It2604113: Seq1-OP081086, Seq2-OP081087, Seq 3-OP081088, Seq4-OP081089, Seq5-OP081090, and Seq6-OP081091). Evolutionary analyses were conducted in the MEGA X (version 10.0.5) to generate an optimal tree with a sum of branch length 6.743 and a bootstrap of 1000 replicates. The evolutionary distances were computed using the maximum composite likelihood method with Tamura 3 parameter model and are in the units of the number of base substitutions per site. All ambiguous positions were removed for each sequence pair using the pairwise deletion option. There was a total of 831 positions in the final dataset. The tree was drawn to scale, with branch lengths in the same units as the evolutionary distances.

4.6. Analysis of Genetic Diversity and Construction of Phylogenetic Tree

Amplicons obtained from each ISSR primer are scored for their presence (1) and absence (0) across the accessions to analyze the genetic diversity. The percentage of polymorphism and polymorphic bands were calculated across the accessions and the used primers, respectively [18]. The binary data matrix was converted into a genetic similarity matrix, and a neighbor-joining tree was obtained with maximum likelihood using the Jaccard coefficient with DARwin 6 (6.0.21) genetic analysis tool. The length of the obtained tree branches was verified with the unweighted neighbor-joining method.

4.7. Statistical Analysis

Data were analyzed by one-way ANOVA followed by Tukey’s post hoc test, and the significance was determined at p ≤ 0.05. Multivariate analysis (PCoA, clustering, SIMPER) of metabolomics data was done in PAST 3 [33]. DARwin 6 genetic analysis tool [34] and MEGA X were used for genetic diversity analysis.

Supplementary Materials

The following supporting information can be downloaded at: https://0-www-mdpi-com.brum.beds.ac.uk/article/10.3390/plants11212861/s1. Data S1: compounds obtained from negative and positive modes from all the accessions in LC-MS/MS; Table S1: NCBI blast results for matK sequences; Table S2: compounds identified tentatively in both positive and negative mode of LC-MS; Table S3: contribution of differentially regulated compounds in groupings of the accessions; Table S4: reported functions of the identified compounds from Embelia accessions; Table S5: list of ISSR primers with their nucleotide sequences and annealing temperatures used for amplification; Table S6: analysis of genetic diversity in Embelia accession by ISSR primers. Figure S1: representative LC-MS chromatograms (BPC) from fruits samples from all accessions; Figure S2: MS and MS-MS spectra for 36 identified compounds from different accessions of Embelia fruits; Figure S3: confirmation of Embelin from fruit samples.

Author Contributions

Conceptualization, S.M.; methodology, S.R., V.P., M.S. and S.M.; software, S.R.; validation, S.R., V.P. and S.M.; formal analysis, S.R. and V.P.; investigation, S.M.; resources, S.M. and M.S.; data curation, S.R., S.M. and V.P.; writing—original draft preparation, S.R. and V.P.; writing—review and editing, S.M.; visualization, S.M.; supervision, S.M.; project administration, S.M.; funding acquisition, S.M. All authors have read and agreed to the published version of the manuscript.

Funding

This research was funded by UGC-DSA-I and Council of Scientific and Industrial Research (CSIR), India.

Data Availability Statement

All the matK sequences generated have been deposited in the NCBI GenBank database (Accession numbers: Bank It2604113: Seq1-OP081086, Seq2-OP081087, Seq 3-OP081088, Seq4-OP081089, Seq5-OP081090, and Seq6-OP081091).

Acknowledgments

The authors thank N.B. Gaikwad, Shivaji University, Kolhapur, Maharashtra for help in obtaining Embelia fruits, the Biodiversity board of Karnataka (Permission letter no. APCCF-RU-A1-RAC-CR-37/2014-2015) and Kerala (permission letter no. KHDFQ-816/2020-CWW/WL10) for the permission of sample collection, V.T. Barvkar, Savitribai Phule Pune University for assistance with LCMS data acquisition, and P. Thakur, Agilent Technologies for helping in the LC-MS data analysis, and UGC DSA-I for funding. SR thanks the Council of Scientific and Industrial Research (CSIR), India, for the junior and senior research fellowship.

Conflicts of Interest

The authors declare no conflict of interest. The funders had no role in the design of the study; in the collection, analyses, or interpretation of data; in the writing of the manuscript; or in the decision to publish the results.

References

  1. Burman, N.L. Nicolai Laurentii Burmanni Flora Indica; Haek: Amsterdam, The Netherlands, 1768. [Google Scholar]
  2. Lal, B.; Mishra, N. Importance of Embelia ribes: An update. Int. J. Pharm. Sci. Res. 2013, 4, 3823. [Google Scholar]
  3. Udayan, P.; Harinarayanan, M.; Tushar, K.; Balachandran, I. Some Common Plants Used by Kurichiar Tribes of Tirunelli Forest, Wayanad District, Kerala in Medicine and Other Traditional Uses. Ind. J. Tradit. Knowl. 2008, 7, 250–255. [Google Scholar]
  4. Thyloor, R. Phytochemical analysis of Embelia ribes seeds for antimicrobial activities. J. Med. Plants 2018, 6, 41–43. [Google Scholar]
  5. Chopda, M.; Mahajan, R. Wound healing plants of Jalgaon district of Maharashtra state, India. Ethnobot. Leafl. 2009, 2009, 1. [Google Scholar]
  6. Albert, A.; Sareedenchai, V.; Heller, W.; Seidlitz, H.K.; Zidorn, C. Temperature is the key to altitudinal variation of phenolics in Arnica montana L. cv. ARBO. Oecologia 2009, 160, 1–8. [Google Scholar] [CrossRef] [PubMed]
  7. Karimi, A.; Krahmer, A.; Herwig, N.; Hadian, J.; Schulz, H.; Meiners, T. Metabolomics approaches for analyzing effects of geographic and environmental factors on the variation of root essential oils of Ferula assa-foetida L. J. Agric. Food Chem. 2020, 68, 9940–9952. [Google Scholar] [CrossRef]
  8. Saurabh, K.B. Total phenolic content and antioxidant activity of extracts of Bridelia retusa Spreng Bark: Impact of dielectric constant and geographical location. J. Med. Plants Res. 2011, 5, 817–822. [Google Scholar]
  9. Namdeo, A.G.; Sharma, A.; Fulzele, D.P.; Mahadik, K.R. Influence of geographical and climatic conditions on camptothecin content of Nothapodytes nimmoniana. Rec. Nat. Prod. 2010, 4, 64. [Google Scholar]
  10. Kamble, V.; Attar, U.; Umdale, S.; Nimbalkar, M.; Ghane, S.; Gaikwad, N. Phytochemical analysis, antioxidant activities and optimized extraction of embelin from different genotypes of Embelia ribes Burm f.: A woody medicinal climber from Western Ghats of India. Physiol. Mol. Biol. Plants 2020, 26, 1855–1865. [Google Scholar] [CrossRef]
  11. Atlabachew, M.; Mehari, B.; Combrinck, S.; McCrindle, R. Single-step isolation of embelin using high-performance countercurrent chromatography and determination of the fatty acid composition of seeds of Embelia schimperi. Biomed. Chromatogr. 2017, 31, e4018. [Google Scholar] [CrossRef]
  12. Kamble, G.S.; Torane, R.C.; Ghayal, N.A.; Tambe, A.S.; Deshpande, N.R.; Salvekar, J.P. GC-MS study of fatty acids and esters from Embelia basal. J. Pharm. Res. 2010, 3, 2608–2609. [Google Scholar]
  13. Puiggròs, F.; Solà, R.; Bladé, C.; Salvadó, M.-J.; Arola, L. Nutritional biomarkers and foodomic methodologies for qualitative and quantitative analysis of bioactive ingredients in dietary intervention studies. J. Chromatogr. A 2011, 1218, 7399–7414. [Google Scholar] [CrossRef] [PubMed]
  14. Ibáñez, C.; Valdés, A.; García-Cañas, V.; Simó, C.; Celebier, M.; Rocamora-Reverte, L.; Gómez-Martínez, Á.; Herrero, M.; Castro-Puyana, M.; Segura-Carretero, A. Global Foodomics strategy to investigate the health benefits of dietary constituents. J. Chromatogr. A 2012, 1248, 139–153. [Google Scholar] [CrossRef]
  15. Hoffmann, J.F.; Carvalho, I.R.; Barbieri, R.L.; Rombaldi, C.V.; Chaves, F.C. Butia spp. (Arecaceae) LC-MS-based metabolomics for species and geographical origin discrimination. J. Agric. Food Chem. 2017, 65, 523–532. [Google Scholar] [CrossRef] [PubMed]
  16. Brinckmann, J.A. Geographical indications for medicinal plants: Globalization, climate change, quality and market implications for geo-authentic botanicals. World J. Tradit. Chin. Med. 2015, 1, 16. [Google Scholar] [CrossRef]
  17. Sampaio, B.L.; Edrada-Ebel, R.; Da Costa, F.B. Effect of the environment on the secondary metabolic profile of Tithonia diversifolia: A model for environmental metabolomics of plants. Sci. Rep. 2016, 6, 1–11. [Google Scholar]
  18. Chrungoo, N.; Rout, G.; Balasubramani, S.; Rajasekharan, P.; Haridasan, K.; Rao, B.; Manjunath, R.; Nagduwar, G.; Venkatasubramanian, P.; Nongbet, A. Establishing taxonomic identity and selecting genetically diverse populations for conservation of threatened plants using molecular markers. Curr. Sci. 2018, 114, 539–553. [Google Scholar] [CrossRef]
  19. Dwivedi, S.; Ghatuary, S.K.; Prasad, S.; Jain, P.K.; Parkhe, G. Phytochemical Screening and In Vivo Anti-inflammatory Activity of Hydroalcoholic Extract of Embelia Ribes Burm. F. J. Drug Deliv. Ther. 2019, 9, 386–389. [Google Scholar]
  20. Saraf, A.; Srinivas, K.S.; Chaturvedi, A. Phytochemical and Elemental Profile of Embelia ribes Burn. F. Res. J. Pharm. Biol. Chem. Sci. 2016, 7, 471–476. [Google Scholar]
  21. Jelinski, D.E. On genes and geography: A landscape perspective on genetic variation in natural plant populations. Landsc. Urban Plan. 1997, 39, 11–23. [Google Scholar] [CrossRef]
  22. Gitzendanner, M.A.; Soltis, P.S. Patterns of genetic variation in rare and widespread plant congeners. Am. J. Bot. 2000, 87, 783–792. [Google Scholar] [CrossRef] [PubMed]
  23. Levy, E.; Byrne, M.; Coates, D.; Macdonald, B.; McArthur, S.; Van Leeuwen, S. Contrasting influences of geographic range and distribution of populations on patterns of genetic diversity in two sympatric Pilbara acacias. PLoS ONE 2016, 11, e0163995. [Google Scholar] [CrossRef] [Green Version]
  24. Szczecińska, M.; Sramko, G.; Wołosz, K.; Sawicki, J. Genetic diversity and population structure of the rare and endangered plant species Pulsatilla patens (L.) Mill in East Central Europe. PLoS ONE 2016, 11, e0151730. [Google Scholar] [CrossRef] [PubMed] [Green Version]
  25. Sasi, R.; Rajendran, A. Diversity of wild fruits in Nilgiri Hills of the Southern Western Ghats-ethnobotanical aspects. Int. J. Appl. Biol. Pharm. Technol 2012, 3, 82–87. [Google Scholar]
  26. Oritani, Y.; Okitsu, T.; Nishimura, E.; Sai, M.; Ito, T.; Takeuchi, S. Enhanced glucose tolerance by intravascularly administered piceatannol in freely moving healthy rats. Biochem. Biophys. Res. Commun. 2016, 470, 753–758. [Google Scholar] [CrossRef] [PubMed]
  27. Zhang, A.J.; Rimando, A.M.; Mizuno, C.S.; Mathews, S.T. α-Glucosidase inhibitory effect of resveratrol and piceatannol. J. Nutr. Biochem. 2017, 47, 86–93. [Google Scholar] [CrossRef] [PubMed]
  28. Gupta, S.; Sanyal, S.; Kanwar, U. Antispermatogenic effect of embelin, a plant benzoquinone, on male albino rats in vivo and in vitro. Contraception 1989, 39, 307–320. [Google Scholar] [CrossRef]
  29. Ogbuewu, I.P.; Unamba-Oparah, I.C.; Odoemenam, V.U.; Etuk, I.F.; Okoli, I.C. The potentiality of medicinal plants as the source of new contraceptive principles in males. North Am. J. Med. Sci. 2011, 3, 255. [Google Scholar] [CrossRef]
  30. Etta, H.E.; Bassey, U.P.; Eneobong, E.E.; Okon, O.B. Anti-spermatogenic effects of ethanol extract of Mucuna urens. J. Reprod. Contracept. 2009, 20, 161–168. [Google Scholar] [CrossRef]
  31. Doyle, J.J.; Doyle, J.L. Isolation of plant DNA from fresh tissue. Focus 1990, 12, 13–15. [Google Scholar]
  32. Khan, S.; Qureshi, M.I.; Alam, T.; Abdin, M. Protocol for isolation of genomic DNA from dry and fresh roots of medicinal plants suitable for RAPD and restriction digestion. Afr. J. Biotechnol. 2007, 6, 175. [Google Scholar]
  33. Hammer, Ø.; Harper, D.A.; Ryan, P.D. PAST: Paleontological statistics software package for education and data analysis. Palaeontol. Electron. 2001, 4, 9. [Google Scholar]
  34. Perrier, X.; Jacquemoud-Collet, J.-P. DARwin software. 2006. 2015. Available online: https://darwin.cirad.fr/ (accessed on 30 November 2021).
Figure 1. Sampling locations of Embelia ribes (Embelia) fruit samples and their morphological and molecular identification. (A) The highlighted portion of the magnified map of India depicting the four locations, namely: (1) Manoli (Maharashtra), (2) Kodkani (Karnataka), (3) Nadpal (Karnataka), (4) Wayanad (Kerala), across the range of Western Ghats. (B) Fruit samples corresponding to each of the four accessions show variation in their pigmentation and size (inset). The fruit diameter from the Kodkani accession is significantly more than that of other accessions (F4,18 = 12.91; p = 0.0002). Values are the mean (±SE) of five replicate fruits. Significant difference was determined by one way ANOVA and Tukey’s post hoc test at p ≤ 0.05. (C) Phylogenetic tree was constructed using the maturase kinase (matk) nucleotide sequences from different accessions of Embelia fruits with 1000 bootstrap values, and maximum composite likelihood method. It confirms the identity of the collected samples as E. ribes (Embelia). Sequences obtained from E. tsjeriam-cottam and Maesa indica leaves were used as an outgroup. Figures at the nodes indicate bootstrap values determined after bootstrapping the clusters 1000 times. The scale at the bottom of the tree quantifies the average distance between clusters.
Plants 11 02861 g001
Figure 2. The distribution of identified metabolites across the accessions. The accessions showed a variation in the distribution of metabolites across the accessions. The color scheme at the top left corner codes for the Z-scores (−4 to +4) calculated over binary co-ordinates of the samples. The dendrogram at the top of the heatmap indicates the average linkage clustering computed between the samples based on the Manhattan distance.
Plants 11 02861 g002
Figure 3. The multivariate analysis of metabolomics data. (A) The plot of principle coordinate analysis (PCoA) with identified metabolites across the accessions using the Jaccard coefficient and transformation exponent value 2. The percentage of the variation is captured in Coordinates 1 and 2. The values in parentheses show the percentages of the variation. The x- and y-axes are indicated by the eigenvalue scale. (B) A phylogenetic tree with the single linkage algorithm and Jaccard similarity index at the 1000 bootstrapping threshold. The tree shows the clusters among the accessions based on the similarities in the metabolites in each of the five samples of a given accession. Bootstrap values of the respective clusters are depicted at each tree node. (C) The Venn diagram depicted the number of compounds shared and uniquely present along with all the combinations. Kodkani and Wayanad accessions show the maximum number of shared compounds, whereas Manoli and Nadpal accessions show the least number of shared compounds. Similarly, Kodkani accession showed a maximum (six) number of uniquely present compounds. However, Nadpal accession does not have any unique one.
Plants 11 02861 g003
Figure 4. Distribution of chemical classes across the accessions. Identified compounds were grouped according to their compound classes. A total of 11 classes of compounds were found. Kodkani accession showed all 11 groups, followed by ten groups in Wayand, six in Manoli, and four in Nadpal.
Plants 11 02861 g004
Figure 5. Genotypic diversity among Embelia ribes accessions from different geographical regions. After scoring the amplified products on Embelia and E. tsjeriam-cottam by nine IISR primers, obtained binary data was used to generate a phylogenetic tree. E. tsjeriam-cottam was used as an outgroup. Wayanad and Kodkani accession share the same clade, whereas the Manoli accession connects the Nadpal accession with Wayanad and Kodkani accessions. The outgroup is forming a separate clade. The scale at the bottom of the phylogenetic tree quantifies the Jaccard distance between the genotypes. Numbers at each tree node indicate the bootstrap value of the respective cluster computed at the 1000 bootstrapping threshold.
Plants 11 02861 g005
Table 1. Compounds identified from different Embelia accessions by LC-MS/MS. Total of 36 compounds were identified based on the fragment ion spectra in both negative and positive ionization modes. 1–33 in negative ionization mode and 34–36 in positive ionization mode (M—Manoli, K—Kodkani, N—Nadpal, W—Wayanad).
Sr. No.Molecular FormulaAbundance (%)AdductsMassm/zRTScoreCompound NameMKN W
1C6 H4O2167.0353 (100), 108.0219 (84.96), 153.0198 (16.49), 123.0113 (0.46)(M+HCOO-), (M+CH3COO-)108.0211167.05569.14198.871,2-Benzoquinone-+-+
2C5H12S2195.0514 (100), 129.0197 (57.31), 177.0409 (6.16), 159.0312 (7.27)(M-H-), (M+CH3COO-)136.0387135.03072.92281.861-pentanesulfenothoic acid-+-+
3C6H8O5111.0092 (100), 125.0248 (11.05), 143.0351 (7.81), 169.0146 (23.32)(M-H-), (M+CH3COO-), (M+HCOO-)160.0372205.03616.44397.152-Formylglutarate-+-+
4C15H12O5271.061 (100), 151.0035 (32.56), 119.051 (13.26), 107.0127 (2.66), 177.0177 (4.73)(M-H-), (M+CH3COO-), (M+HCOO-)272.0685271.062610.8993.683,4,5-Trihydroxyflavanone-+--
5C4H8O4136.8745 (100), 134.8767 (72.48), 119.3337 (30.23), 138.8695 (33.82), 112.4422 (23.18)(M-H-), (M+CH3COO-), (M+HCOO-)120.0423179.05663.75694.873,4-Dihydroxybutyric acid-+-+
6C9H11NO3163.0407 (100), 180.068 (82.43),135.0464 (91.86), 119.0486 (34.69), 121.0316 (3.34)(M-H-), (M+CH3COO-)181.0739180.06724.6884.773-Amino-3-(4-hydroxyphenyl) propanoate-+-+
7C5H4O3111.0091 (100), 112.9853 (59.93), 105.6042 (10.74), 137.3377 (5.76), 168.1806 (11.1)(M-H-), (M+CH3COO-)112.016111.00933.25685.763-Furoic acid-+-+
8C7H12O5119.0352 (100), 163.0618 (18.61), 101.0256 (5.33), 221.0677 (16.91)(M-H-), (M+CH3COO-)176.0685221.06756.78193.913-Isopropylmalic acid++-+
9C6H6O6111.0089 (100), 101.049 (0.93), 117.0174 (4.29), 129.0177 (1.58), 155.0332 (5.15), 173.0828 (2.73), 175.0604 (12.66), 191.02185(0.34)(M-H-),174.0164173.00976.36397.02Aconitic acid-+-+
10C7H6O2121.0298 (100), 120.0214 (20.48), 119.9136 (0.35), 109.8534 (0.28)(M-H-), (M+CH3COO-)122.0368121.03569.14196.01Benzoic acid-+-+
11C28H40O4439.2885 (100), 279.2339 (8.98), 101.0243 (2.78), 170.8337 (1.48), 131.0358 (0.79), 161.0442 (0.84)(M-H-), (M+CH3COO-)440.2954439.285415.5286.76Bolegrevilol---+
12C6H8O7111.0093 (100), 129.0197 (5.64), 131.9995 (0.18), 154.9984 (0.71), 173.0095 (1.3)(M-H-), (M+CH3COO-)192.027191.02014.25995.64Citric acid++-+
13C9H8O3119.0509 (100), 163.0407 (8.71), 117.9266 (0.38), 121.0308 (2.97)(M-H-), (M+CH3COO-)164.0484163.04128.8893.57Coumaric acid-+--
14C10H18O4201.1134 (100), 183.1021 (59.57), 139.7911 (65.43), 140.1177 (13.75), 141.11 (5.96), 157.0852 (5.47)(M-H-)202.1205201.11439.98295.36Decanedioic acid++-+
15C13H24O2213.1868 (100), 195.1759 (2.92), 193. 1605 (0.16), 211.3199 (0.06), 257.1764 (0.46), 196.179 (0.83)(M-H-), (M+CH3COO-)212.1776271.191815.26885.1Delta-tridecalactone++-+
16C6H10S2111.0093 (100), 191.0208 (10.89), 173.9144 (0.08), 154.9984 (0.71), 147.0297 (0.9), 130.9991 (0.88)(M-H-)146.0224191.01994.2681.97Di-2-propenyl disulfide-+++
17C8H14O2S2111.0095 (100), 125.0248 (12.2), 169.0149 (30.75), 101.0249 (0.1), 143.0356 (6.94), 154.9997 (2.13), 205.0366 (2.19), 173.0102 (1.98)(M-H-), (M+CH3COO-)206.0435205.03656.36580.91DL-alpha-Lipoic acid-+-+
18C17H26O4293.1776 (100), 265.1822 (10.08), 152.0117(23.46), 195.1762 (0.05), 223.1980 (0.02), 265.1817 (0.98), 275.1672 (0.04), 179.0336 (0.02), 151.0399 (0.73), 163.0405 (0.03), 165.0197 (0.58), 193.1603 (0.01)(M-H-)294.1831293.177114.4294.7Embelin++++
19C6H14S2195.0514 (100), 129.0197 (63.16), 101.0232 (1.78), 100.0129 (1.67)(M-H-), (M+CH3COO-)150.0537195.05142.9183.13Ethyl-1-methylpropyl disulfide-+-+
20C6H12O7195.0541 (100), 129.0197 (63.16), 111.0089 (1.93), 101.0232 (1.78), 141.0172 (1.17), 100.0129 (1.67), 151.06 (2.87), 159.02 (4.72), 177.04 (7.5)(M+CH3COO-)196.0583195.05142.9296.12Galactonic acid-+-+
21C16H30O4285.2076 (100), 195.1734 (0.69), 160.314 (0.24), 151.98(0.44)(M-H-), (M+CH3COO-)286.2144285.208311.5794.66Hexadecanedioic acid-+-+
22C21H20O12463.0907 (100), 301.0354 (9.29), 316.0235 (4.15), 300.2459 (7.06), 271.0264 (1.1), 178.9978 (0.59), 287.0243 (0.21)(M-H-)464.0948523.10858.7976.8Isoquercitrin-+--
23C4H6O5115.0039 (100), 133.0137 (25.99), 134.0181(0.08), 103.0701 (2.41), 105.3022 (3.11)(M-H-)134.0215133.01483.1698.24Malic acid-+-+
24C15H12O5271.062 (100), 151.0037 (37.98), 119.0509 (10.92), 177.0197 (5.23), 107.0142 (4.58)(M-H-)272.0697271.062310.9091.8Naringenin-+--
25C7H14S2119.0352 (100), 163.0618 (18.61), 221.0677 (16.91), 101.0256 (5.33)(M-H-), (M+CH3COO-)162.0537221.06756.7885.79N-propyl sec-butyl disulfide+++ +
26C4H4O5111.0092 (100), 103.1223 (0.39), 106.2887 (0.38), 129.01 (7.82), 191.0208 (10.89)(M-H-), (M+CH3COO-)132.0059191.02014.2698.76Oxaloacetate-+-+
27C14H12O4261.0395 (100), 103.0404 (17.34), 111.0115 (25.8), 135.0417 (13.41), 137.0252 (59.38), 148.0374 (31.73), 167.0366 (27.76), 231.0277 (50.05)(M+CH3COO-)244.0736303.08858.3794.96Piceatannol-+--
28C15H22O2293. 1772 (100), 152.01 (1.17), 124.0171 (1.09), 265.1818 (0.98), 166.0278 (0.29), 275.1665 (0.04), 195.1756 (0.01)(M+CH3COO-), (M+HCOO-)234.1626293.177614.5195.39Procurcumenol-+++
29C15H10O7301.0363 (100), 107.0142 (1.63), 151.0034 (19.11), 121.0294(2.17), 178.9991(14.1)(M-H-)302.0427301.036710.1588.89Quercetin-+--
30C19H30O4321.2089 (100), 124.0169 (0.71), 152.0117 (1.01), 293.2134 (0.66), 166.0257 (0.18), 317.8458 (0.09)(M-H-)322.2144321.209313.1692.93Rapanone-+-+
31C14H28255.2335 (100), 210.9515 (6.19), 134.0953 (3.02), 119.037 (4.12), 112.98 (2.76)(M+CH3COO-)196.2191255.23380.57296.94Tetradecene++-+
32C11H22O229.1825 (100), 112.9864 (0.85), 151.9661 (0.95), 183.1758 (43.74)(M+CH3COO-), (M+HCOO-)170.1675229.181711.3193.1Undecan-2-one-+-+
33C8H8O4167.0354 (100),108.0222 (95.03), 168.8361 (83.37), 152.0119 (14.39), 128.0691 (3.21), 125.0234 (1.95)(M-H-)168.0429167.03569.1483.19Vanillic acid-+-+
34C18H28N2O4127.1205 (100), 129.1004 (58.35), 145.1369 (55.08), 319.1974 (15.5), 273.1822 (30.12), 147.1169 (30.35), 175.1199 (44.14), 301.1838 (12.14), 109.1038 (27.28)(M+H+)336.2049337.21353.1675.88Acebutolol-++-
35C21H30O2127.1204 (100), 129.1005 (55.48), 145.1367 (55), 175.1199 (46.27), 147.1168 (28.57), 109.1039 (27.64), 157.1043 (14.87), 111.084 (3.29), 193.1358 (9.45), 163.1531 (4.65), 139.0882 (11.36), 273.1821 (28.48), 301.1835 (12.39), 291.1975 (7.41), 319.1984 (15.9)(M+Na+)314.2246337.21344.1776.21Cannabidiol-++-
36C12H20O2109.1032 (100), 219.1348 (16.32), 204.1907 (16.05), 202.1745 (25.12), 187.1584 (22.13), 169.1432 (52.16), 151.1255 (9.44), 145.1362 (3.92), 111.1186 (6.99), 106.1057 (0.58), 127.1189 (29.49)(M+Na+)196.1463219.13532.8373.22Hexenyl-(3z)-hexenoate (3z-)+---
Publisher’s Note: MDPI stays neutral with regard to jurisdictional claims in published maps and institutional affiliations.

