Article

Genome Survey Sequencing and Genetic Background Characterization of Ilex chinensis Sims (Aquifoliaceae) Based on Next-Generation Sequencing

1
Jiangsu Academy of Forestry, 109 Danyang Road, Dongshanqiao, Nanjing 211153, China
2
Co-Innovation Center for Sustainable Forestry in Southern China, Key Laboratory of State Forestry and Grassland Administration on Subtropical Forest Biodiversity Conservation, College of Biology and the Environment, Nanjing Forestry University, Nanjing 210037, China
*
Authors to whom correspondence should be addressed.
Submission received: 24 October 2022 / Revised: 24 November 2022 / Accepted: 26 November 2022 / Published: 1 December 2022

Abstract

:
Ilex chinensis Sims. is an evergreen arbor species with high ornamental and medicinal value that is widely distributed in China. However, there is a lack of molecular and genomic data for this plant, which severely restricts the development of its relevant research. To obtain the whole reference genome, we first conducted a genome survey of I. chinensis by next-generation sequencing (NGS) to perform de novo whole-genome sequencing. As a result, our estimates using k-mer and flow cytometric analysis suggested the genome size of I. chinensis to be around 618–655 Mb, with the GC content, heterozygous rate, and repeat sequence rate of 37.52%, 1.1%, and 38%, respectively. A total of 334,649 microsatellite motifs were detected from the I. chinensis genome data, which will provide basic molecular markers for germplasm characterization, genetic diversity, and QTL mapping studies for I. chinensis. In summary, the I. chinensis genome is complex with high heterozygosity and few repeated sequences. Overall, this is the first report on the genome features of I. chinensis, and the information may lay a strong groundwork for future whole-genome sequencing and molecular breeding studies of this species.

1. Introduction

Ilex chinensis Sims. is an evergreen arbor species belonging to the genus Ilex in the family Aquifoliaceae. It is widely distributed in the south of Qinling Mountains and Huai River of China, as one of the native dominant species in evergreen broadleaved forests [1,2]. Compared with other hollies, I. chinensis not only has strong ornamental value, but also is a commonly used traditional Chinese medicine herb, the dried leaves of which are known in China as ‘Si ji qing’, used to treat acute laryngopharyngitis, bronchitis, dysentery, burns, and as an external treatment for skin ulcer in China [3]. For its excellent performance and great breeding value, it has been identified as a precious tree in China.
The current research on I. chinensis mainly focuses on the chemical composition and pharmacological effects, while the genetic information of I. chinensis has remained largely unknown [4,5,6], although some studies have performed transcriptome analysis [7], genetic diversity analysis based on SSR markers [2], and complete chloroplast genome sequencing [8]. Thus far, most genomic research on the Ilex genus is focused on very few commercially important species, including I. latifolia [9], I. asprella [10], and I. polyneura [11], whereas few studies have been reported for I. chinensis. The lack of a reference genome for I. chinensis leads to limited enhancement in molecular biology and breeding programs.
The genome contains all the information controlling biological characters and ultimately determining the transmission of genetic material [12,13,14]. Genome sequencing has been an important step to decipher the genetic structure and accelerate genetic improvements in traits of interest in eukaryotes [15,16]. Exploring the genes related to the effective components and excellent agronomic characters of plants, and analyzing the metabolic pathways and regulatory mechanisms from the genome-wide level, can lay the foundation for the improvement of medicinal plant varieties and the protection of genetic resources [14,17]. Owing to recent advances in DNA sequencing techniques, draft genomes have been assembled for many plant species as resources for genomic and genetic research efforts [18,19,20]. However, the genomes of some plant species, particularly tree species and medicinal plants, are highly heterozygous, and have a complex genetic background [12,21,22]. Therefore, it is imperative to obtain basic knowledge on the genome structure of the target material before large-scale sequencing of this species [12,18].
Genome surveys, which use next-generation sequencing (NGS), have been proven to be important strategies for exploring genomic information for plants, especially for non-model plants, by yielding a large amount of genomic data in a rapid, cost-effective manner [15,23]. Genomic data from genome surveys not only can provide useful information on genome structure, such as an estimation of genome size, heterozygosity levels, and repeat contents, but also establish a genomic sequence resource from which molecular markers can be developed [24,25,26]. In this study, the NGS method was used to conduct de novo whole-genome sequencing of I. chinensis. In combination with flow cytometry, the genome size and characteristics of I. chinensis were obtained, which may provide a basis for future whole-genome sequencing, and will be conducive to key genetic analysis for effective component synthesis as well as the breeding of this species.

2. Results

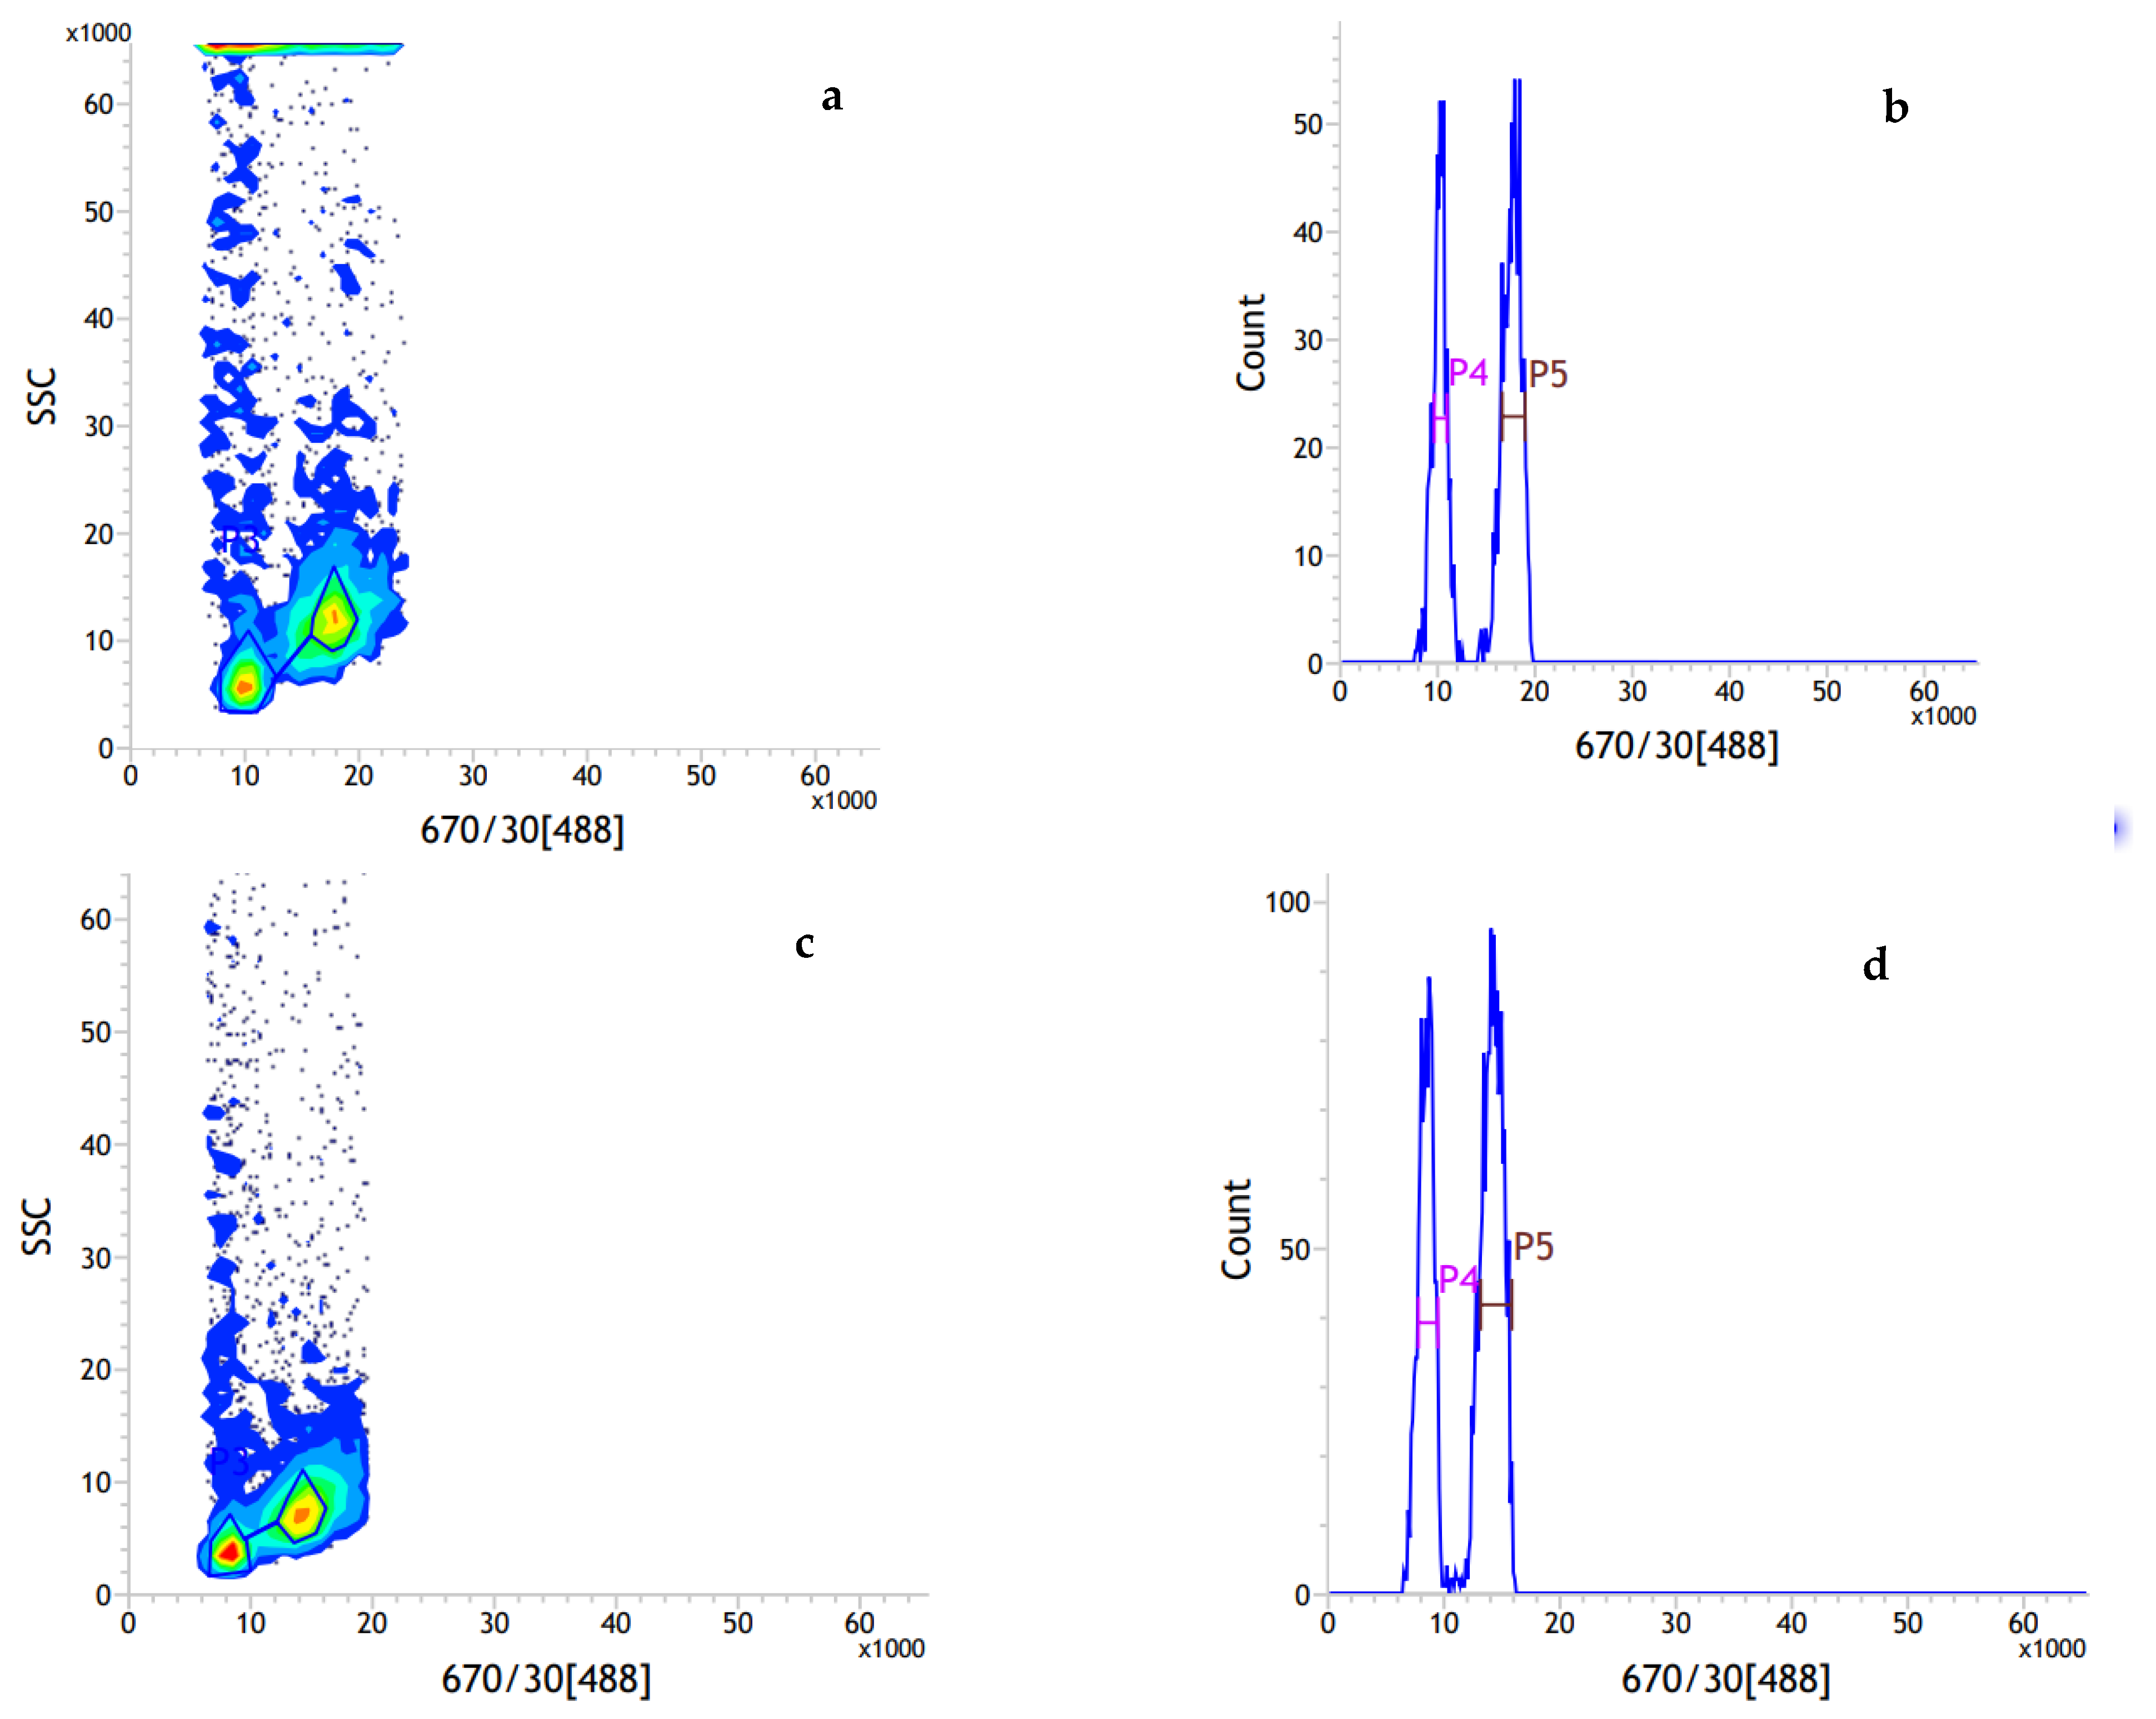
2.1. Genome Size Estimation by Flow Cytometry

The flow cytometric analysis yielded a high-resolution histogram (Figure 1). The mean CVs were 4.05% and 4.42% for I. chinensis and the internal standard rice, respectively (Table 1). The average genome size for I. chinensis male and female samples was estimated to be approximately 660 ± 10 Mb. The genome size of male samples was estimated to be larger than that of the female samples, with 665 ± 12 and 656 ± 6 Mb, respectively. A t-test suggested that there was no significant difference between male and female samples in genome size (p > 0.05), which indicated that the differences in genome size between sex in I. chinensis might be small enough to be undetectable using flow cytometry, or might be due to the accuracy of the current method.

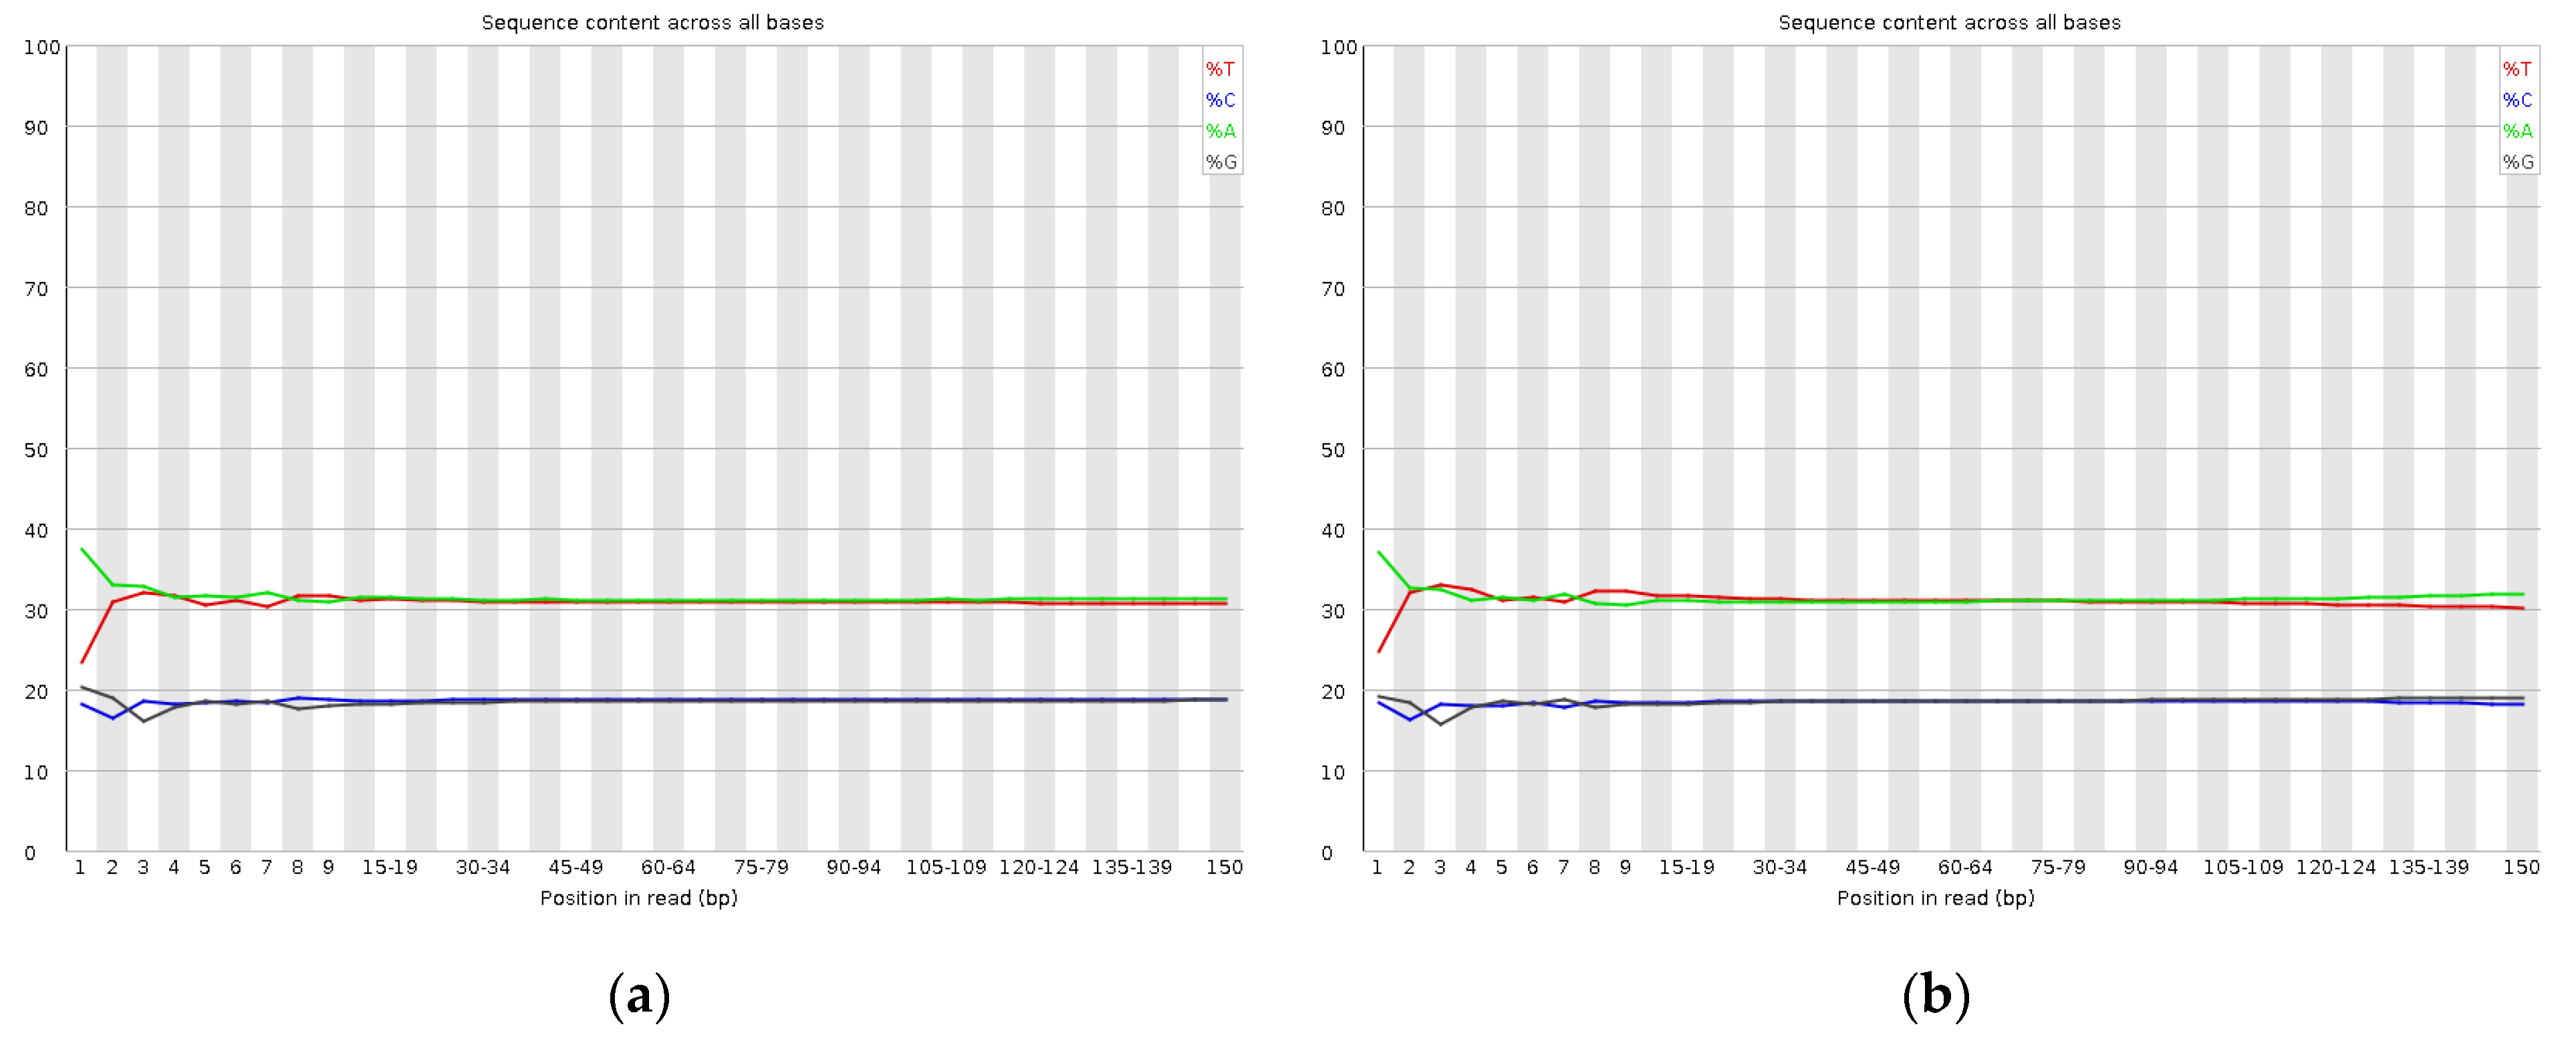
2.2. Sequencing and Quality Evaluation of Ilex chinensis

The libraries of paired-end sequencing with 350 bp short inserts of I. chinensis were constructed. A total of 44.813 Gb of raw data, which was an approximately 67.90-fold coverage of the estimated genome size, were generated by the DNBSEQ-T7 sequencing platform. After filtering and correction, a total of 44.645 Gb of I. chinensis clean bases were obtained with the Q20 and Q30 values of 95.275% and 87.84%, respectively (Table 2), which indicated that the high-throughput sequencing of I. chinensis was highly accurate. In total, 91.31% of the reads were used for assembly. Figure 2 showed the proportion of single bases, which was used to detect whether AT and GC separation was present. It could be seen that the content of A and G and C and T were close. The results demonstrated that the sequencing quality was good.

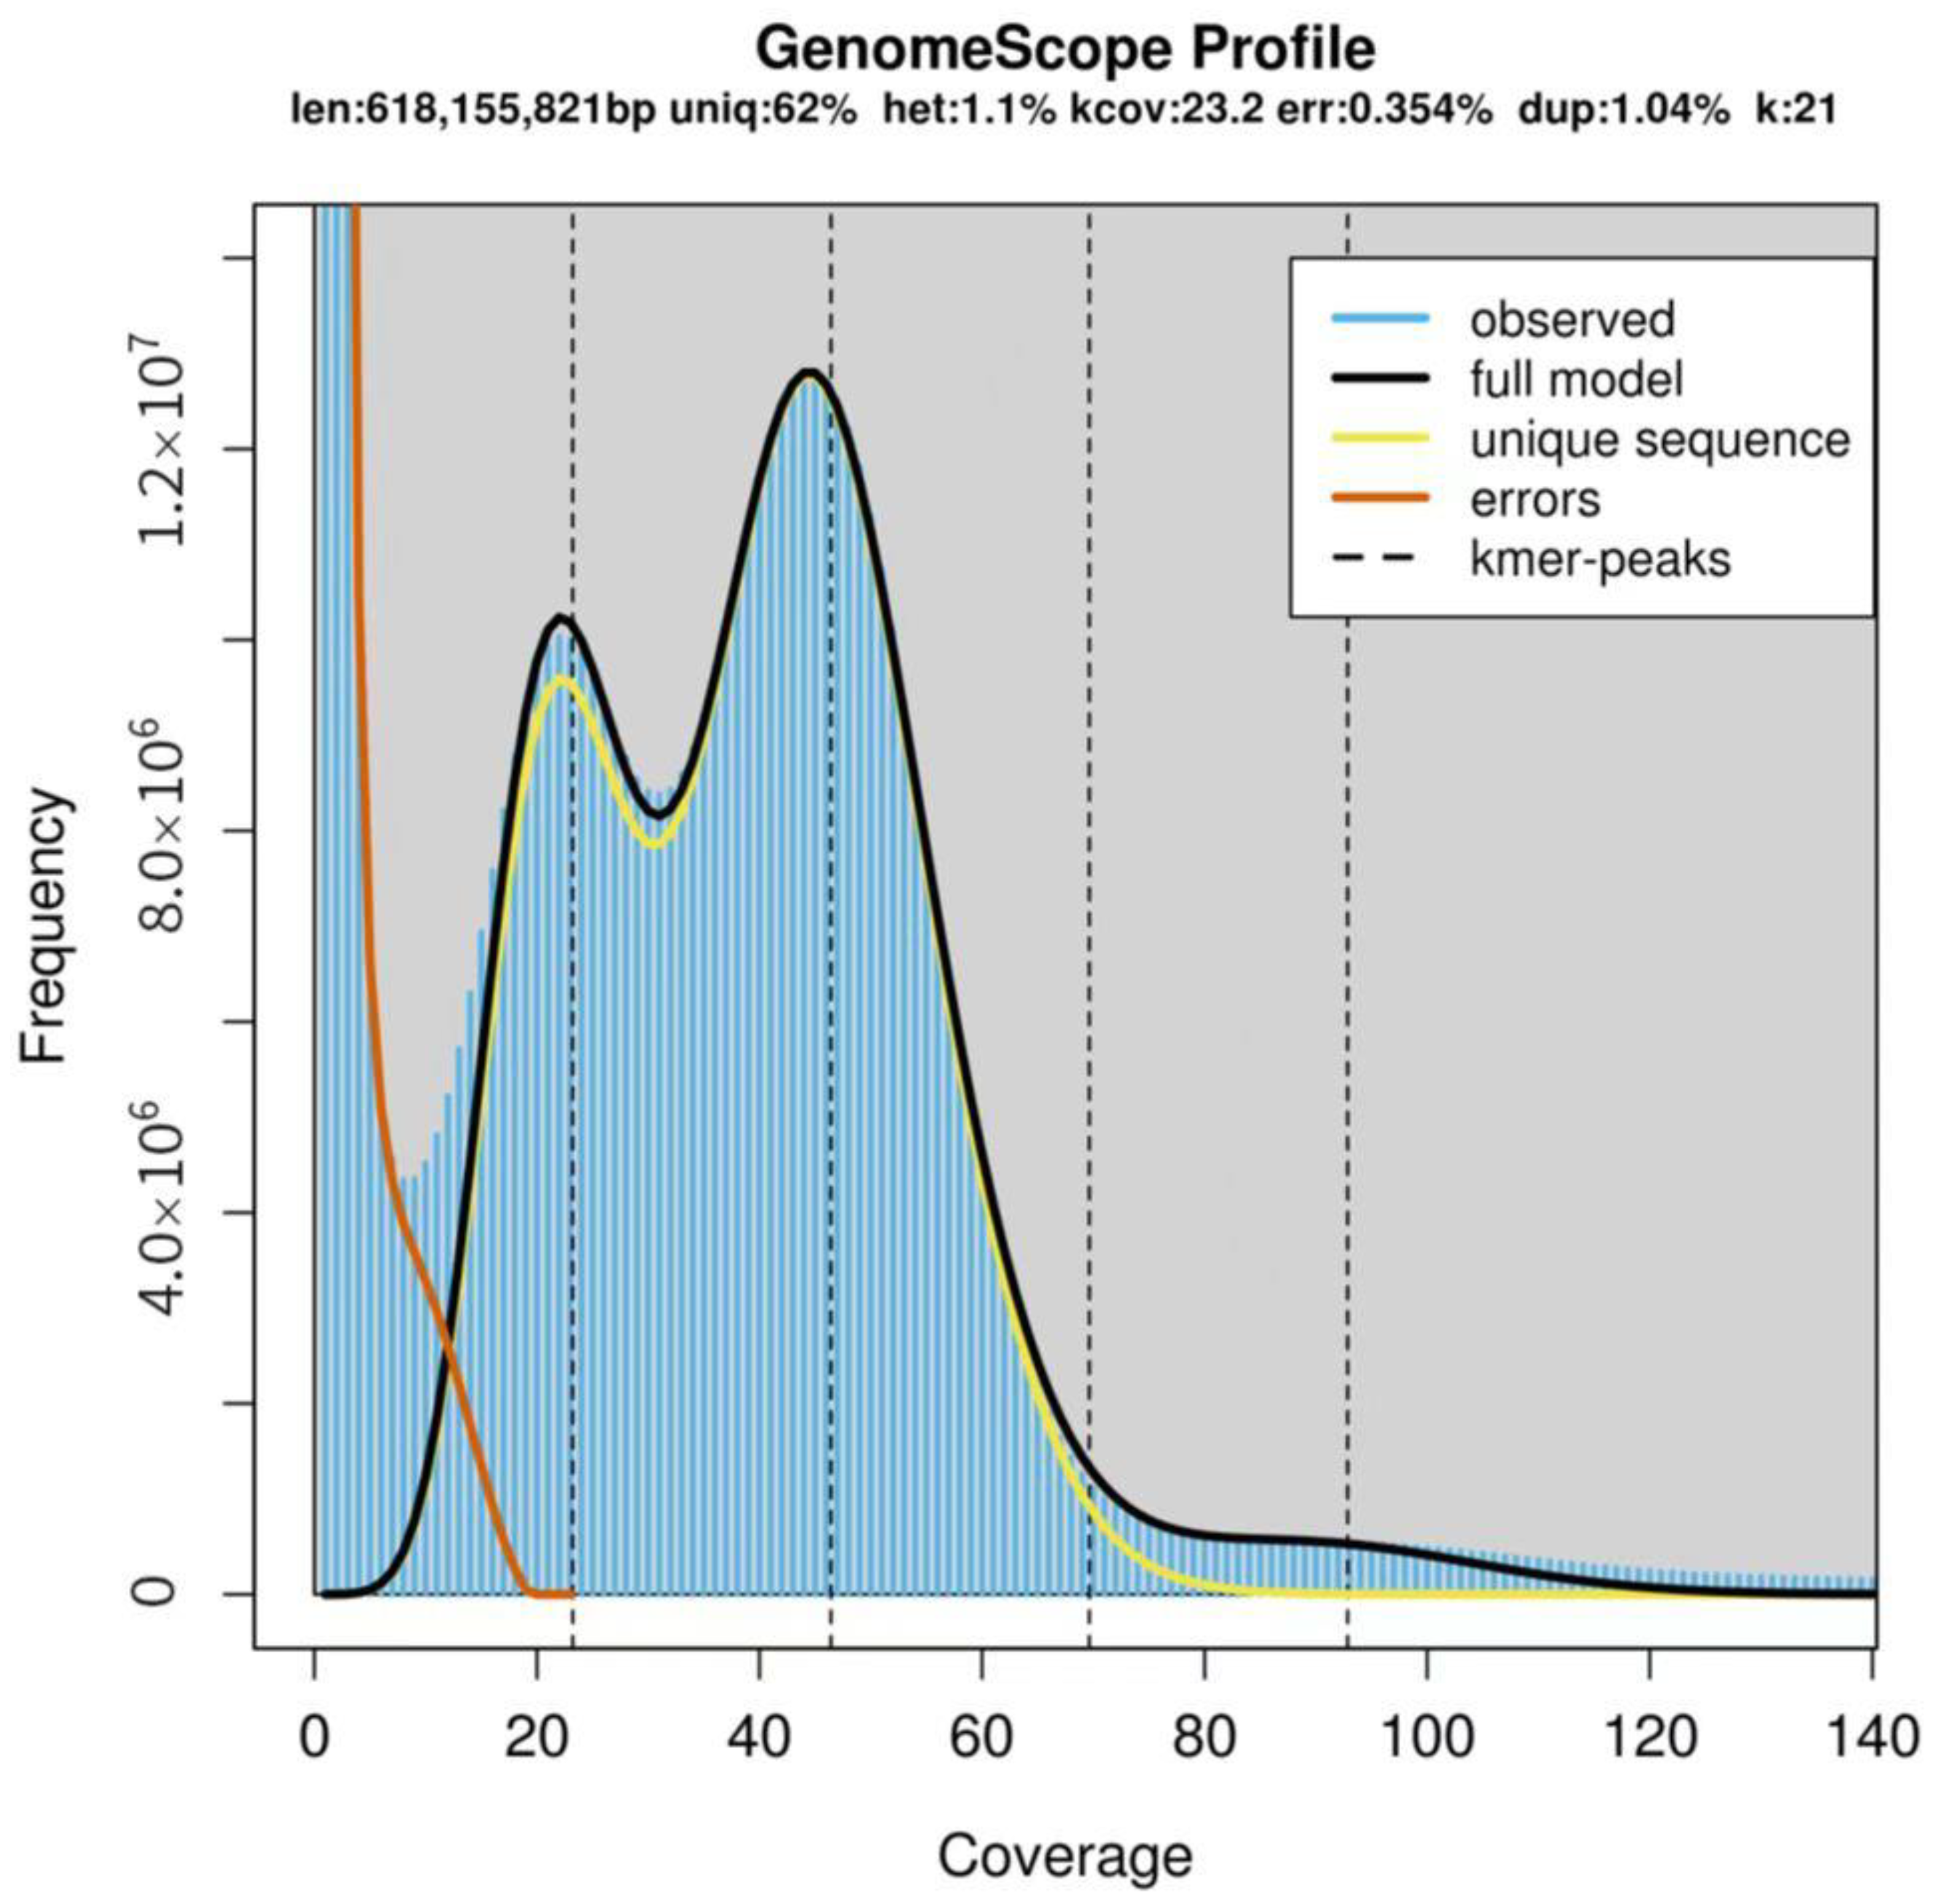
2.3. Genome Size Estimation by K-Mer Analysis

All the clean data were used for k-mer analysis using a K-value of 21, and the obtained results were presented in a frequency distribution graph (Figure 3). The main peak of depth was at 46×, and the estimated genome size of I. chinensis was 618 Mb. In addition, the percentage of the number of k-mers after 1.8-fold of the main peak in the total number of k-mers were used to estimate the repeat rate. The heterozygosity rate appeared at a position of half the height of the main peak (23×). The genome heterozygosity rate and sequence repeat rate were calculated to be approximately 1.1% and 38%, respectively. Therefore, the genome of this species belongs to a complex genome with high heterozygosity.

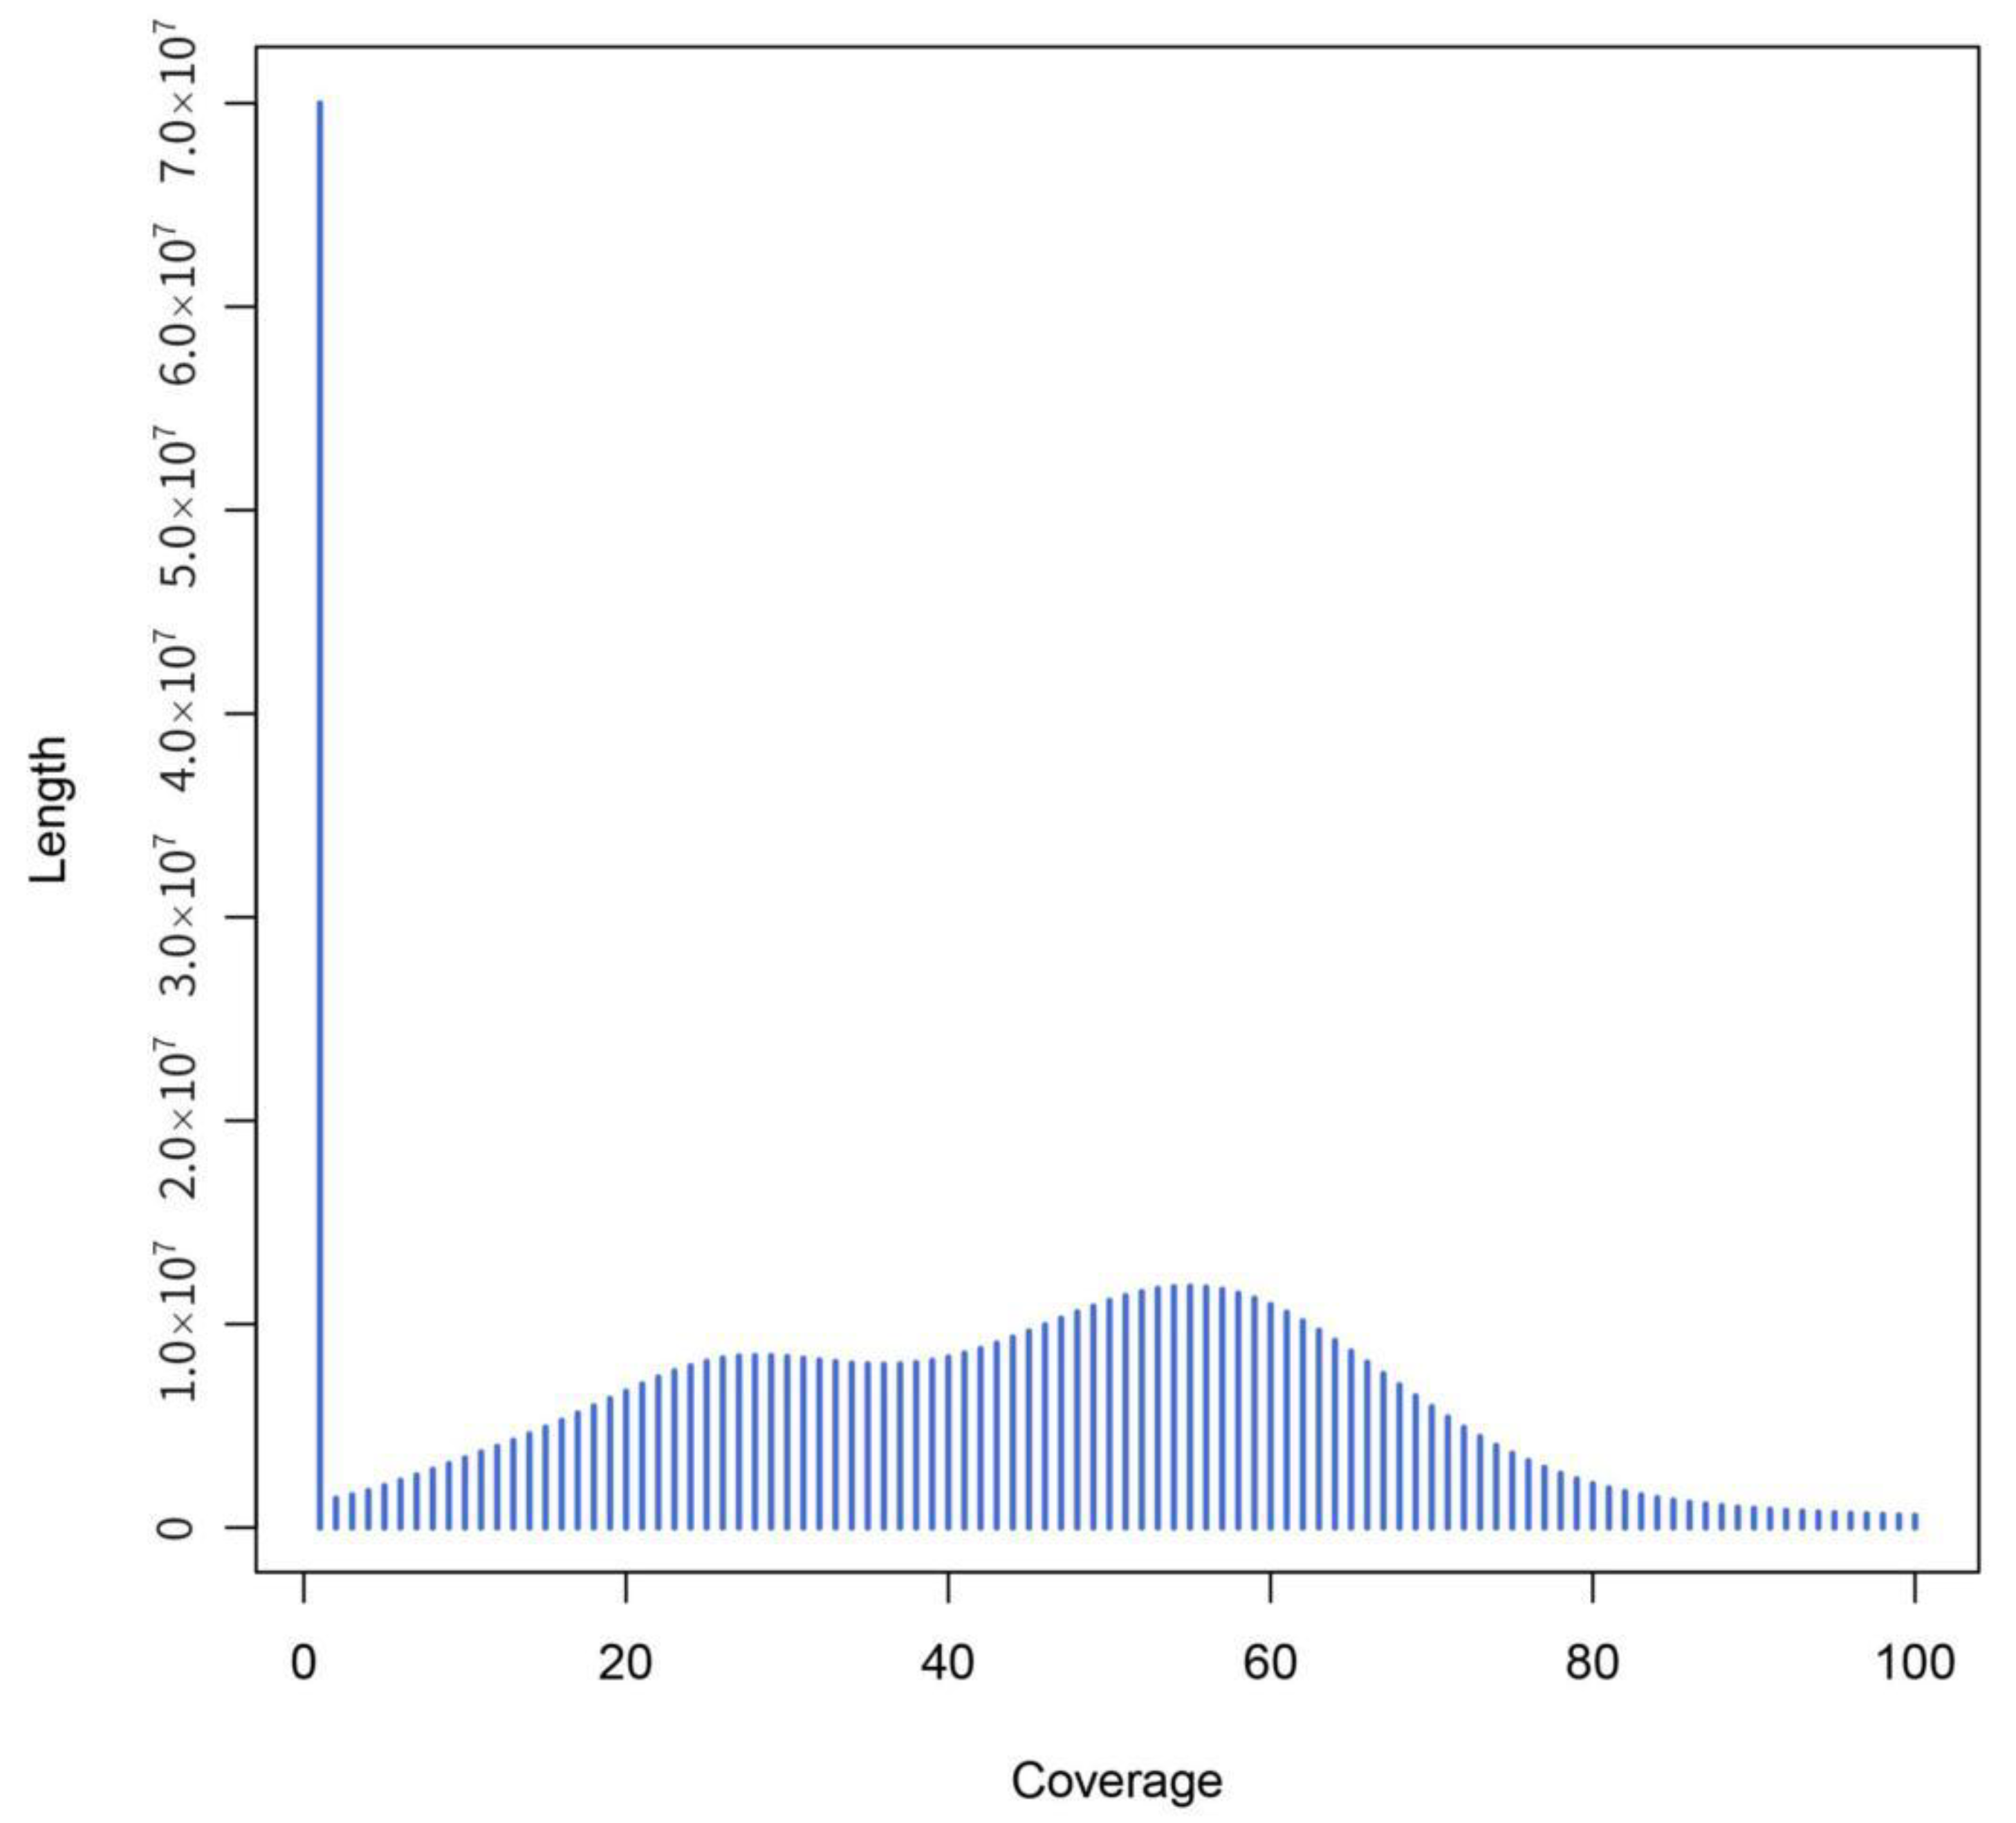
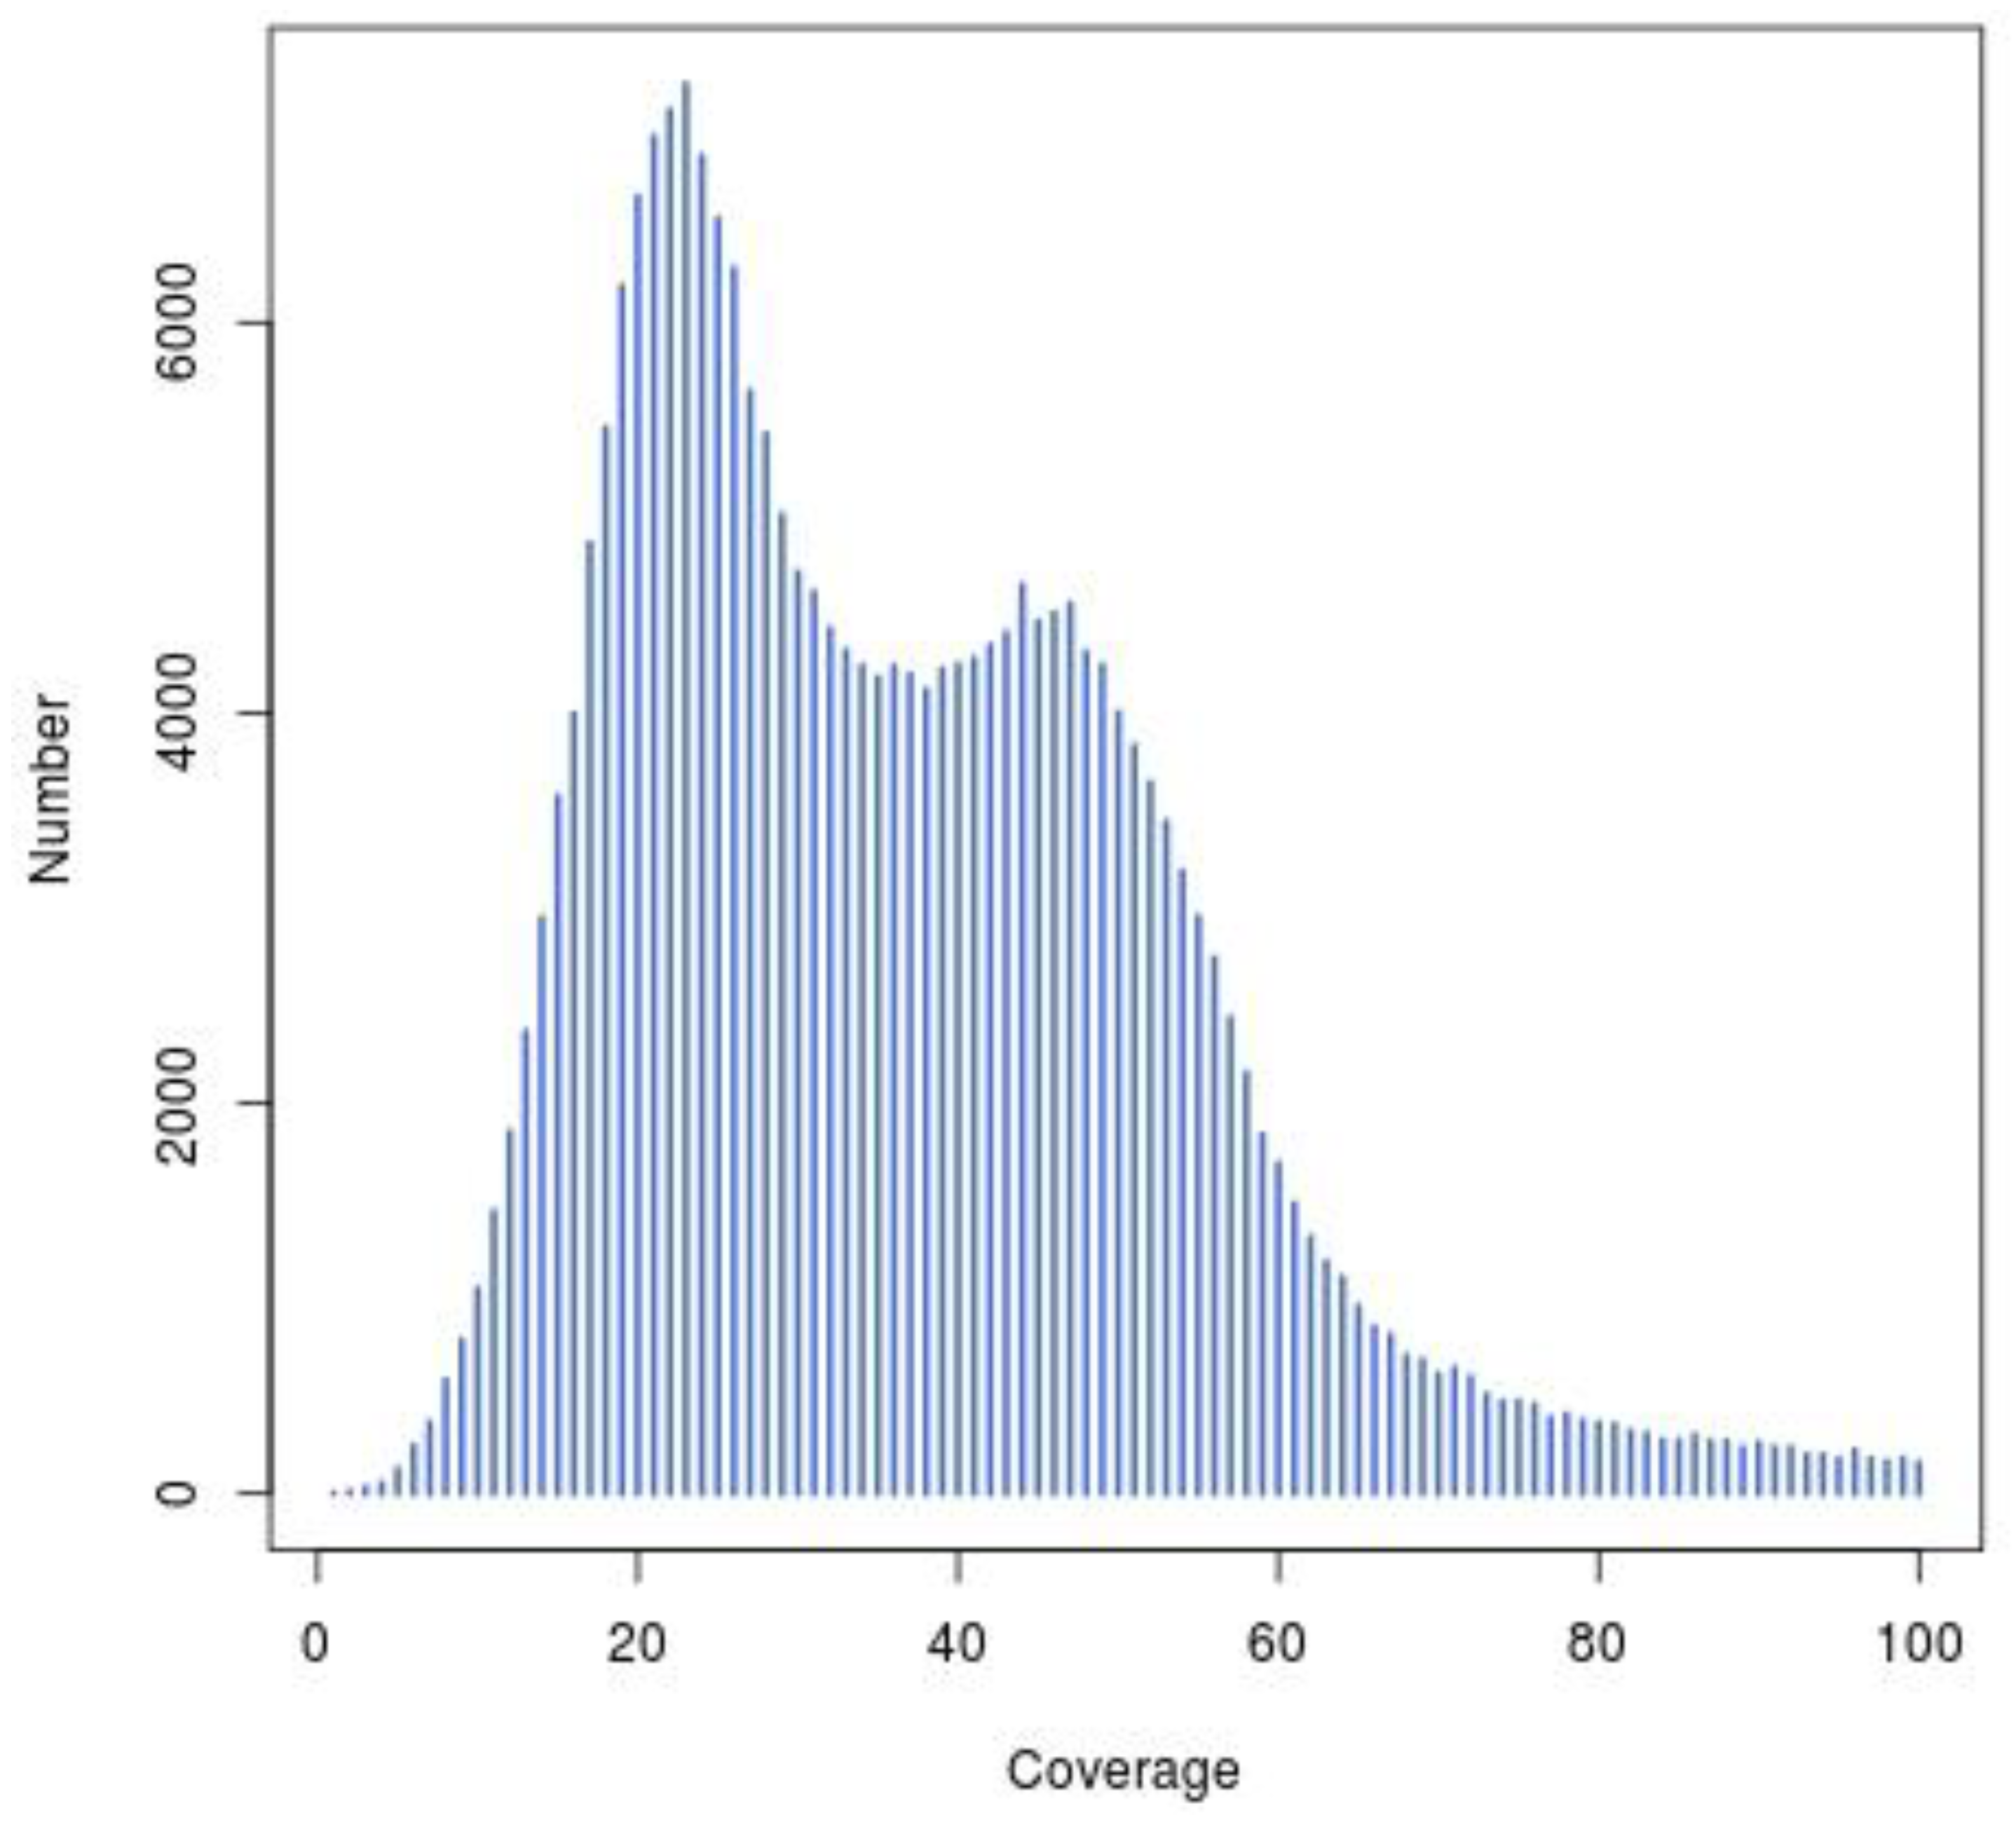
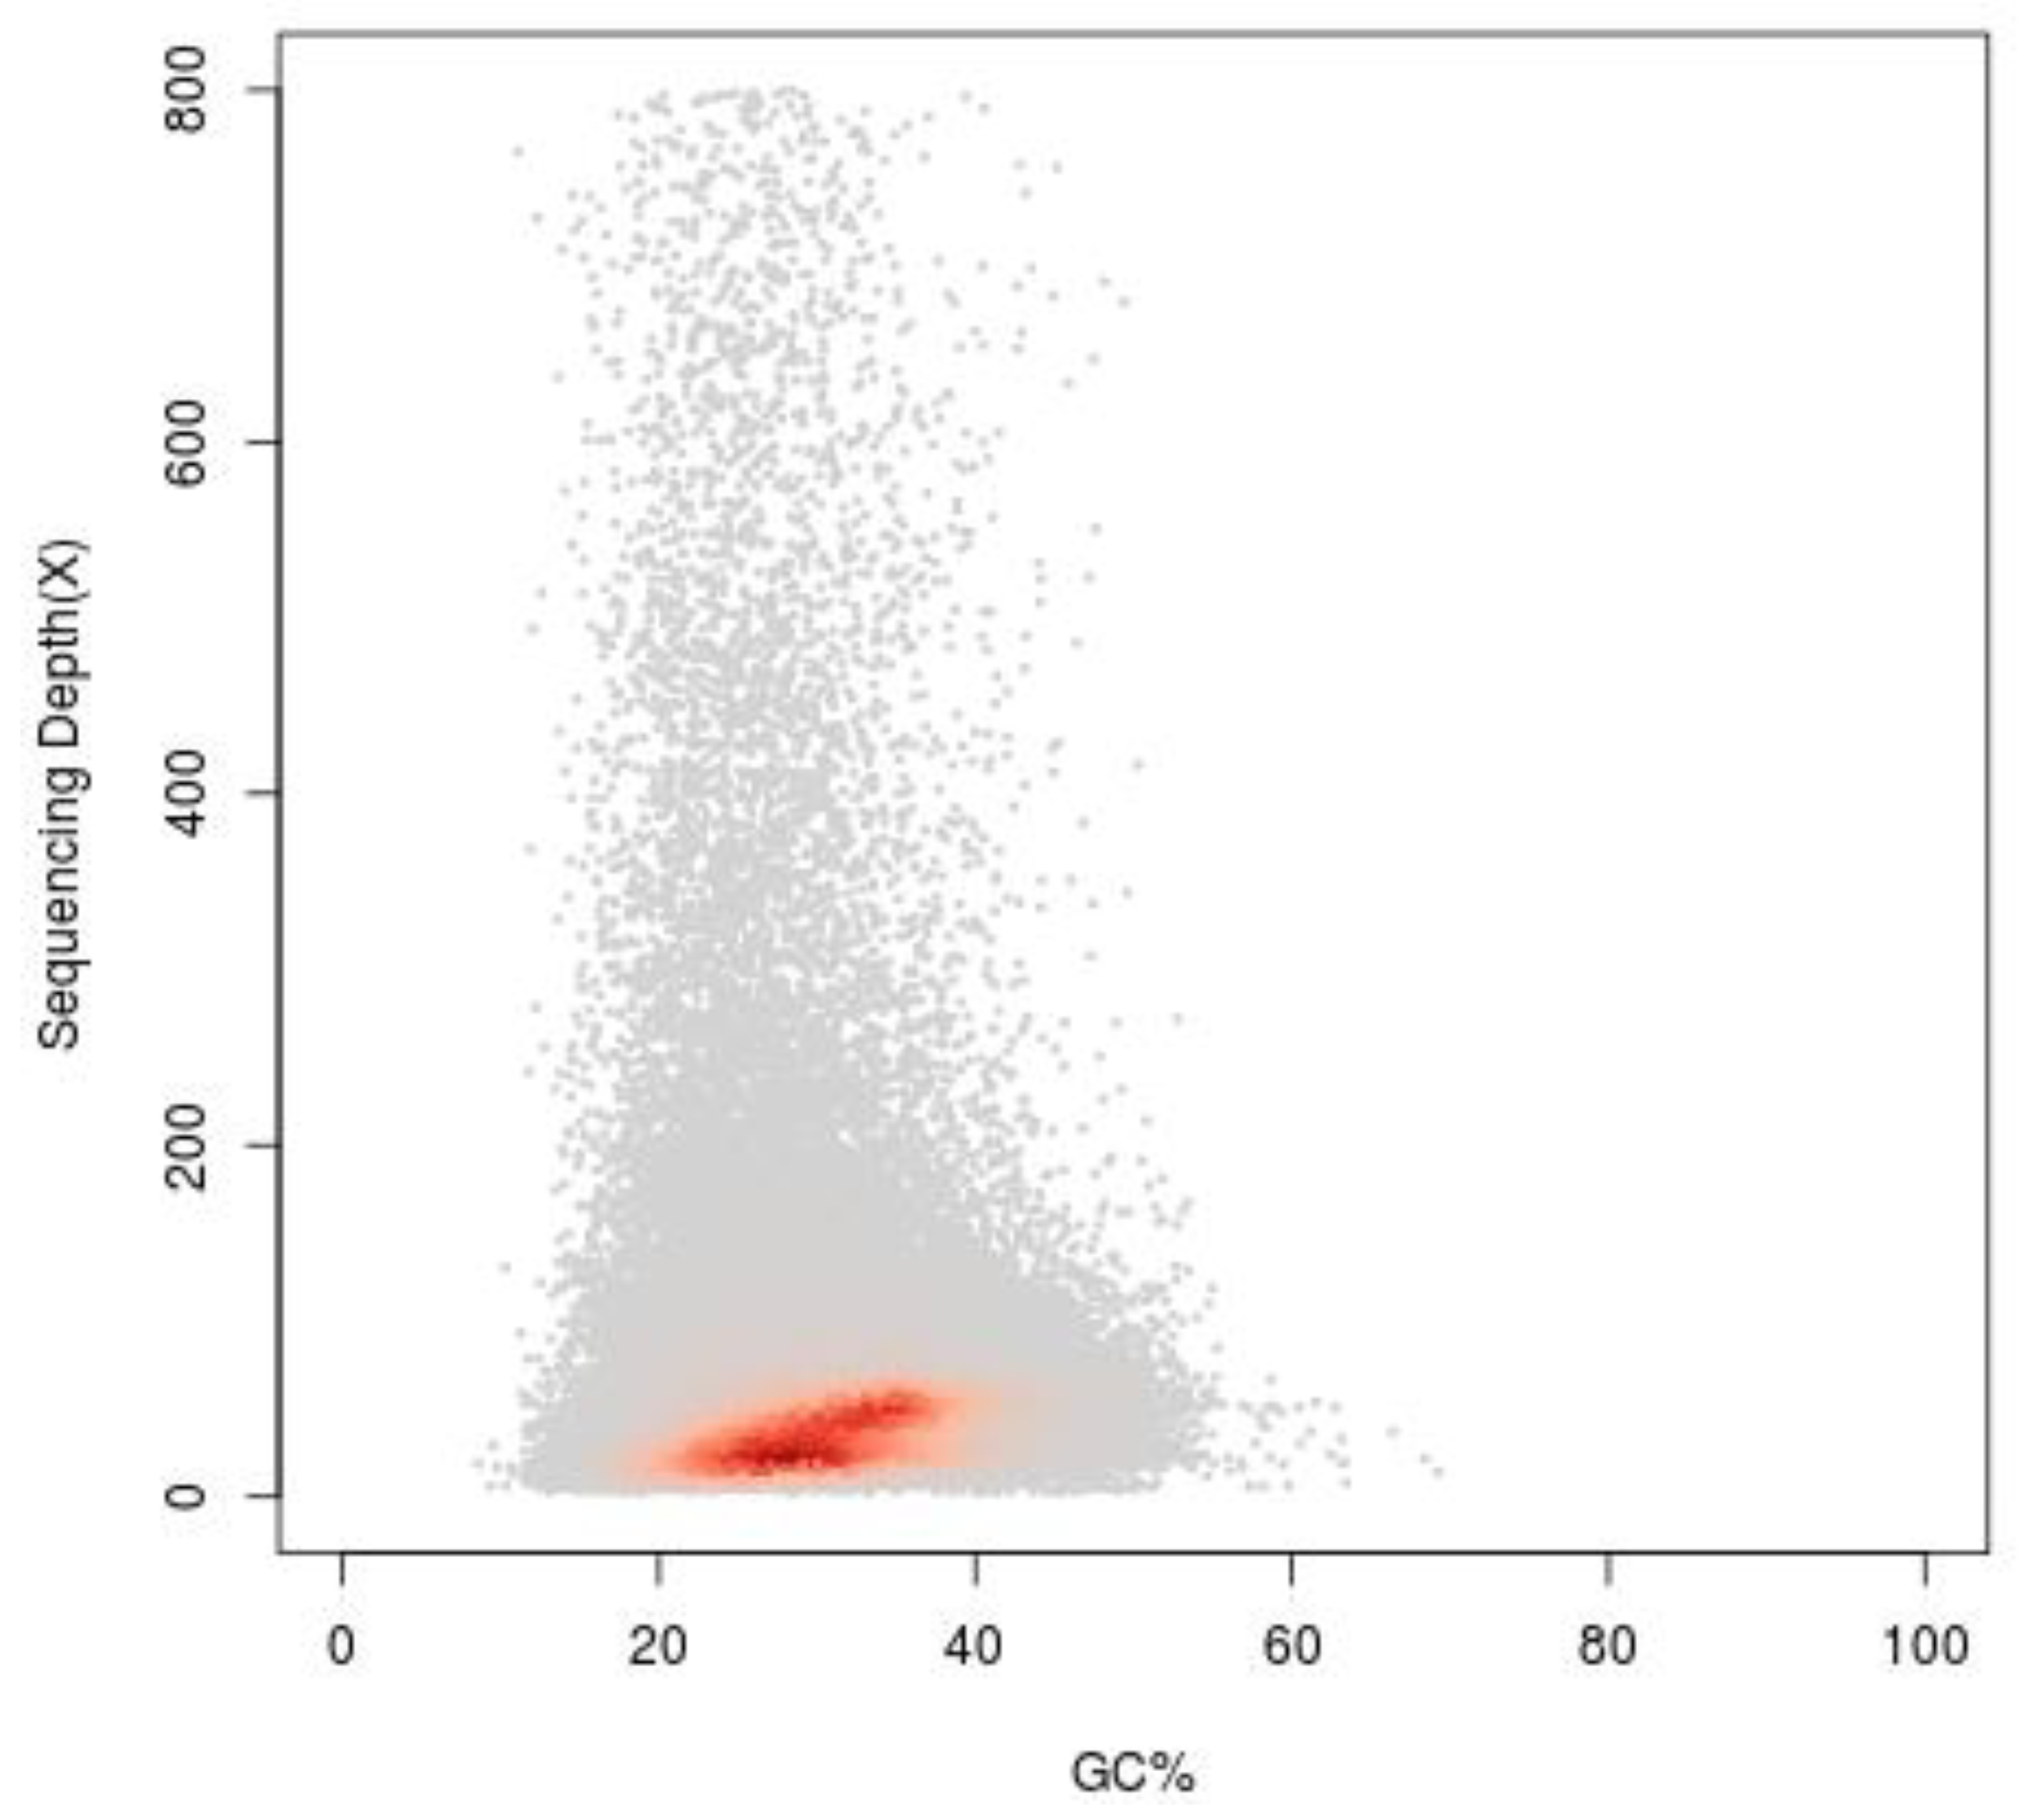
2.4. Genome Assembly and Guanine plus Cytosine (GC) Content Analysis

The total number of raw contigs was 9,683,026, with an N50 of 173 bp. Scaffolds larger than 500 bp were selected to avoid low-quality sequences; consequently, the genome assembly consisted of 250,019 scaffolds, with a total length of 685,140,399 bp, and the scaffolds’ N50 length was 5738 bp (Table 3). The results from Figure 4 and Figure 5 showed significant peaks. It could be determined that the peak value at approximately 50× is a homozygous peak. The peak that was located around half of the x-coordinates in front of the homozygous peak was the heterozygous peak. Therefore, the genome of I. chinensis is highly heterozygous and complex.
GC content is one of the causes of the bias in sequencing results. According to the GC depth distribution map (Figure 6), it can be judged whether there is obvious GC bias in the sequencing results, and also determined whether there is bacterial contamination. Then, scaffolds larger than 500 bp were used to build a scatterplot. In Figure 6, the scatterplot showed that the confidence area (shown in red) was around 20–40%, where the average GC content of the I. chinensis was 37.52% after calculation. In addition, the GC depth map was divided into two layers (Figure 6), which was mainly due to the high heterozygosity [27].

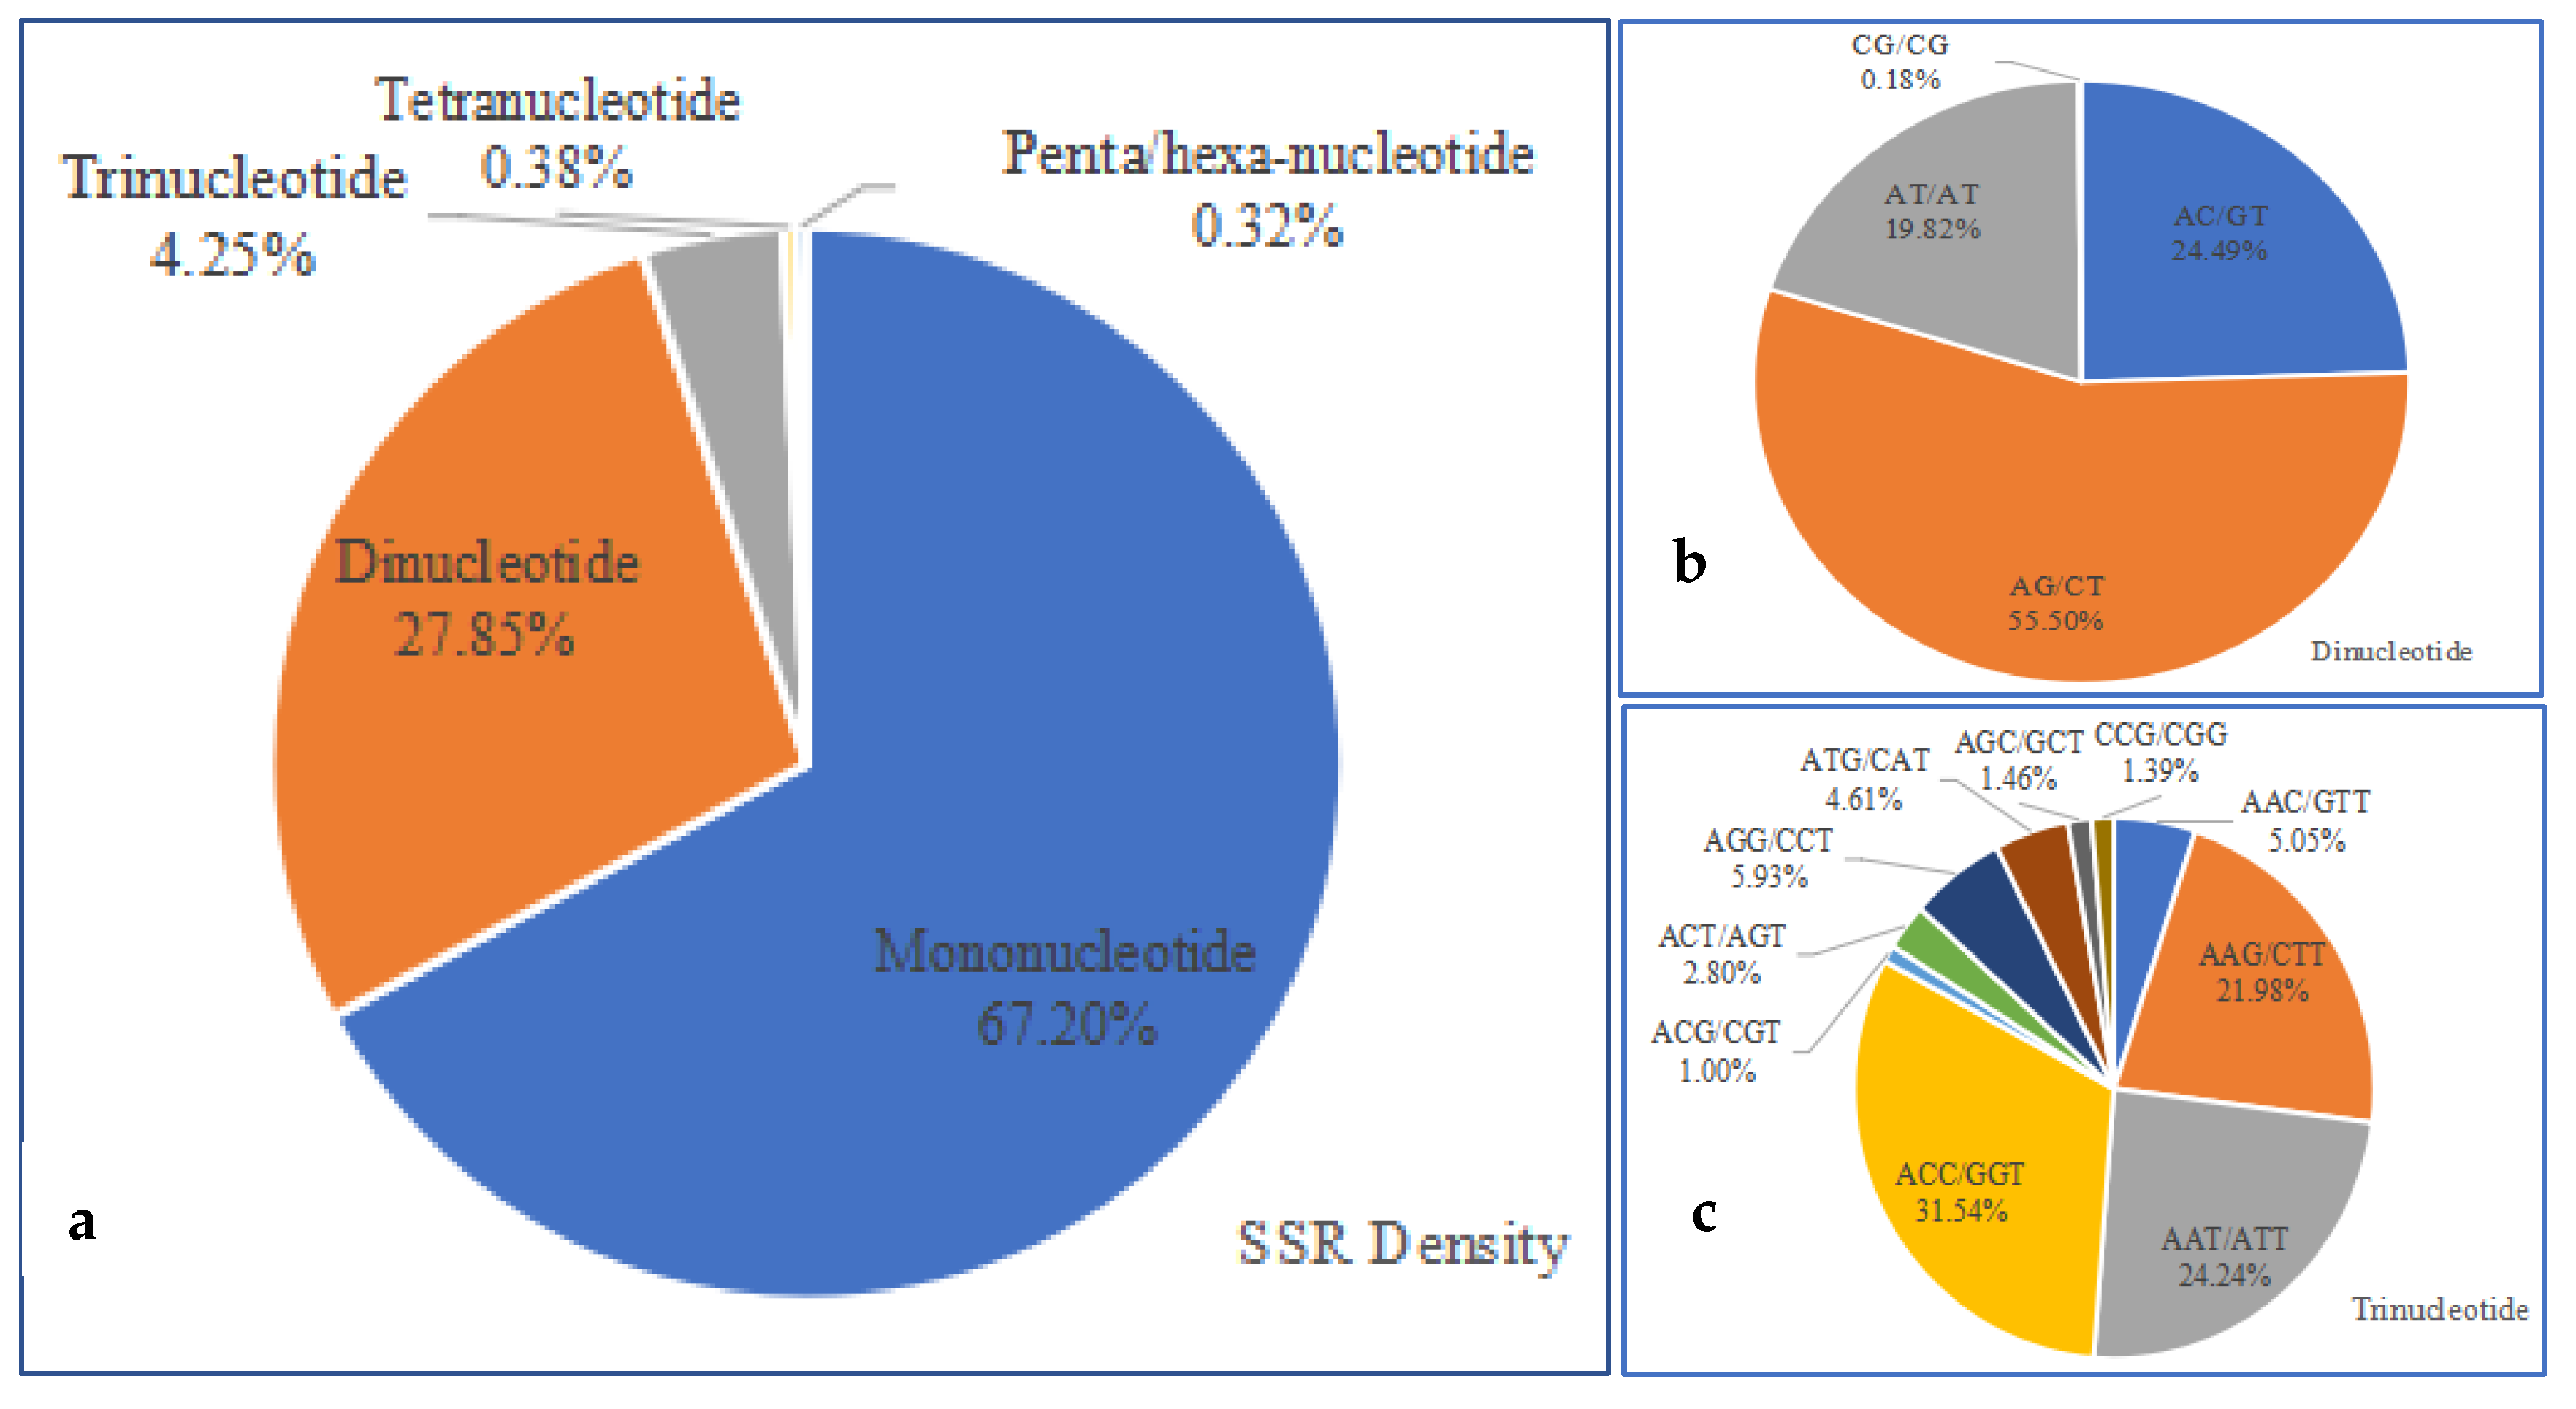
2.5. Identification and Characteristics of Microsatellite Motifs

A total of 334,649 microsatellite motifs were detected. Among these microsatellite motifs, the mononucleotide motifs were the most abundant, accounting for 67.20% (224,888) of the total microsatellite motifs, followed by di- (93,211, 27.85%), tri- (14,215, 4.25%), tetra- (1261, 0.38%), penta- (435, 0.13%), and hexanucleotide (639, 0.19%) motifs (Figure 7a). There was a large proportion of both mononucleotide and dinucleotide motifs, which amounted to 95.05%, while the rest amounted to less than 5%. In the dinucleotide motifs, AG/CT accounted for 55.50%, the AC/GT accounted for 24.49%, AT/AT accounted for 19.82%, and CG/CG only accounted for 0.18% (Figure 7b). As for the predominant trinucleotide motifs, the ACC/GGT, AAT/ATT, and the AAG/CTT accounted for 31.54%, 24.24%, and 21.98%, respectively (Figure 7c).

3. Discussion

3.1. Genome Size of Ilex chinensis

Genome size is one of the important attributes of the genome of an organism, and before commencing genome sequencing, accurate estimations of nuclear genome sizes are prerequisites [28,29,30]. There are several methods to predict the genome size, such as feulgen spectrophotometry, pulsed-field gel electrophoresis (PFGE), and flow cytometry [19]. Though flow cytometry has become a well-recognized technique for predicting genome size before plant genome sequencing due to its low material requirements, short analysis time, and high accuracy, there is still some technical error that will hinder exact quantification [21,31]. With the rapid development of NGS technology, k-mer analysis, which is based on whole-genome sequencing reads, has become an effective and economical method to obtain genome sizes of non-model or emerging species [32], which has been proven successful for many plant species, such as Metroxylon sagu Rottboll [19], Rhododendron micranthum [14], Pistacia vera [15], and Akebia trifoliata [33]. Therefore, using both methods to measure genome size can improve the reliability of the results. In this study, the genome size of I. chinensis determined by flow cytometry was approximately 660 Mb, and our k-mer analysis using genome survey data suggested a genome size of around 618 Mb, which was close to the results derived from flow cytometry. Together, these data provide robust evidence that the genome size of I. chinensis is 618–660 Mb, a value that was slightly smaller than those of other members of the Ilex genus family reported previously [9,10,11]. I. chinensis, with its small genome size, can often be given priority in performing whole-genome sequencing projects for economic reasons [34].

3.2. The Genome Characteristics of Ilex chinensis

GC content was one of three factors found to contribute to sequencing bias on the Illumina sequencing platform. GC content exceeding the normal range (>65% or <25%) will result in reduced coverage in sequencing regions, which can seriously affect genome assembly [35]. In this study, the GC content of I. chinensis was medium, which fell within the general range of 30 to 47% for most plants [19,36], and would not influence the quality of the genome sequence during the sequencing process [18,27].
Heterozygosity and repeat rates of genome are critical factors used to determine the quality of genome assembly, and identifying the heterozygosity and repeatability of the sequencing data is conducive to design appropriate assembly strategy [21,25]. The genome of I. chinensis was considered a simple repetitive genome [37], which may be due to the small genome size of this species [38]. Repeated sequences are one of the major factors that control the recombination and regulation of structural genes [36], and further investigation is required to understand the functions of repeated sequences in I. chinensis [14]. The heterozygosity of sequence data is helpful to find a suitable genomic splicing method, which can be divided into high heterozygosity (≥0.8%) and low heterozygosity (0.5%–0.8%) [37]. Possibly due to the dioecious mating system in the Ilex genus [39], the heterozygosity of I. chinensis, similar to that of I. polyneura (1.18%) within the same family (Aquifoliaceae) [11], was high, and this indicated the high complexity in the genome. The characteristics of the I. chinensis genome might impact the accuracy of genome size estimation and the quality of genome assembly. Previous studies have suggested that if the genomic heterozygosity exceeds 1%, the genome is considered to be rather difficult to assemble [12,33]. Therefore, the genome of I. chinensis was relatively difficult to assemble by traditional approaches, and the N50 lengths of scaffolds were relatively short (Table 3). However, with the invention of the third-generation sequencing, highly heterozygous genomes have been successfully assembled [40,41].
Considering the complex characteristics of the I. chinensis genome and its high heterozygosity, we should adopt the strategy of combining the second-generation and third-generation sequencing, and use the Hi-C technique and BioNano Genomics for supplement to sequence and assemble in the following whole-genome sequencing studies [12,18,42].

3.3. Characteristics of Microsatellites in Ilex chinensis

The identification and characterization of repetitive DNA is a fundamental step towards the genetic and biological characterization of plants [25]. A large number of genome-wide SSR loci have provided a foundation for the further construction of high-density genetic maps and the study of the regulatory mechanisms of medicinal ingredients derived from I. chinensis [14,43,44]. For most plants, the di- and trinucleotide repeat motif types mostly contribute to the major proportion of SSRs, and a notably small proportion was contributed by tetra-, penta-, and hexanucleotide repeat motif types [15,33,45,46]. In this study, the mononucleotide repeat was the most abundant type, which was similar to many species, such as Sillago sihama [47], Betula platyphylla [46], and R. micranthum [14].
Additionally, the results showed that AG/CT (55.50%) and ACC/GGT (31.54%) were frequent among the di- and trinucleotide repeat SSRs in I. chinensis, which differed from those in such species as Erianthus arundinaceus (AG/CT, 54.16% and AAT/ATT, 20.23%) [48], M. sagu Rottboll (AT/TA, 29.07% and CCG/CGG, 18.1%) [19], R. micranthum (GA/TC, 38.63% and CAC/GTG, 12.03%) [14], and Acer truncatum Bunge (AT/AT, 71.31% and AAT/ATT, 54.72%) [49]. These differences in distribution frequency of SSR motif types suggest that the duplicated regions in each species may be subject to different selection pressures. The reason for the high polymorphism at these loci needs further investigation.

4. Materials and Methods

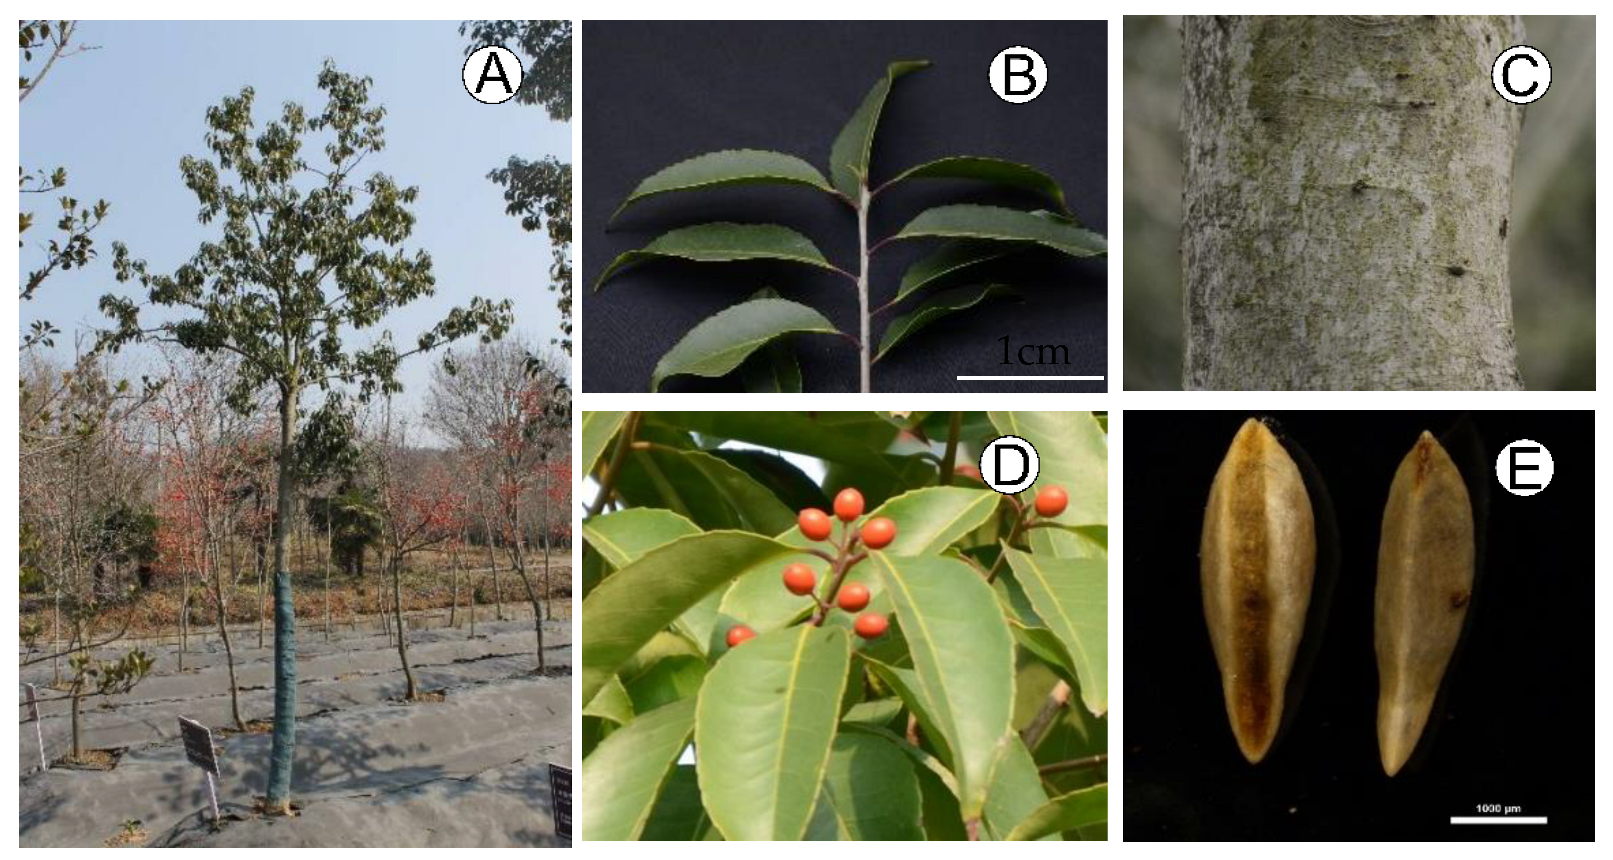
4.1. Plant Materials

Ilex chinensis (approximately 20 years old) were collected from the national holly germplasm bank of China and planted in the testing grounds of Jiangsu Academy of Forestry (Nanjing, Jiangsu, China). For each sex of I. chinensis, young leaf tissue from five individuals was selected in the field for the flow cytometry analysis. Fresh leaves from a single female individual of I. chinensis tree (Figure 8) were selected for genome survey sequencing. Total genomic DNA was isolated using a DNA extraction kit (CWBIO, Shanghai, China). DNA integrity was monitored on 1% agarose gel electrophoresis, and the purity was detected via a NanoDrop 2000 (Thermo Fisher, Wilmington, DE, USA). DNA concentration was measured using a Qubit fluorometer (Thermo Fisher, Waltham, MA, USA).

4.2. Genome Size Estimation by Flow Cytometry

For each sex of I. chinensis, young leaf tissue was collected for flow cytometry analysis. Samples were prepared by slightly modified procedures as described by Kandaiah et al. [50]. Approximately 50 mg of fresh I. chinensis leaf tissue with a similar amount of internal standard Oryza sativa subsp. japonica cv. Nipponbare (1C = 389 Mb, GC = 43.6 %) [51] were co-chopped in 1 mL pre-cooled Tris dissociation solution with a new razor blade. The mixture was filtered through a 40 µm nylon mesh. The filtrate was centrifuged at 1000 rpm/min for 5 min at 4 °C, and the pellet was stained with 500 μL propidium iodide (PI, 50 µg/mL) stain solution (containing 50 µg/mL RNase A). The resuspension was incubated in the dark at 4 °C for 5 min, and then filtered and loaded onto the BD InfluxTM cell sorter (BD, Piscataway, NJ, USA) for detection. The flow cytometer was equipped with an argon ion laser operating at 488 nm. The PI fluorescence was collected by 670 nm FL2 filter. In each sample, at least 5000 nuclei were evaluated. FACS software 1.0.0.650 was used for capturing fluorescent signals and data analysis with the coefficient variation values (CV) of both peaks controlled in 5% [52]. The holoploid genome size of each sample was calculated according to the following formula: Sample genome size = [(sample G0/G1 peak mean)/(standard G0/G1 peak mean)] × standard genome size [52]. Variance analysis was carried out using Excel 2013 and SPSS 13.0 with convective detection parameters. A t-test was performed to determine whether differences were present in genome size between male and female samples, and p < 0.05 was considered statistically significant.

4.3. Genome Sequencing

The genomic paired-end libraries with 350 bp insertions were constructed on an DNBSEQ-T7 sequencing platform using I. chinensis following the guidance of the standard procedure (MGI Tech Co., Ltd., Shenzhen, China) at the Compass Agritechnology Co., Ltd. (Beijing, China). In order to ensure the quality of the analysis, we filtered the paired reads that would interfere with subsequent information, the paired reads with adapter contamination, the paired reads with uncertain nucleotides (N) that constitute more than 10% of either read, and the paired reads when low quality nucleotides (base quality less than 5) constitute more than 50% of either read. Clean reads were obtained after filtering and correction of the sequence data.

4.4. Estimation of Genome Size, Heterozygosity, and Repeat Rate

K-mer analysis was conducted using Jellyfish [53], and the k-mer histogram generated for K-values of 21 was submitted to the GenomeScope to estimate the genome size, heterozygosity, and repeat rate of the clean reads before genome assembly [54,55]. GenomeScope parameters were as follows: read length 150 bp and max k-mer coverage 1000.

4.5. Genome Assembly and Guanine plus Cytosine (GC) Content Analysis

The software SOAPdenovo2 was used for the assembly of the refined MGI PE reads, and k-mer size = 21 was chosen for assembly with default parameters in SOAPdenovo2 to construct the de Bruijn graph. To simplify the de Bruijn graph, the sequences at every bifurcation locus were truncated to obtain the initial contigs. The reads obtained from sequencing all the libraries were aligned to the initially obtained contigs. The connectivity relationship between the reads and the information of the inserted fragment size were used to further assemble the contig into a scaffold and obtain the primary genomic sequence containing Ns. Following this, the filtered reads were aligned to this assembled sequence using SOAP to obtain the base depth. The resultant scaffolds of more than 500 bases in length were chosen. A window size of 10 kb was used for non-repetitive advancement in the sequence and calculation of the mean depth and GC content of every window to generate a GC depth plot.

4.6. Identification and Verification of Microsatellite Motifs

Microsatellite identification software (MISA) was used to identify all microsatellite repeat units, conduct an analysis of SSR molecular markers in the DNA sequence, and calculate the location, length, quantity, start sites, and end site of the SSR molecular markers in the scaffold. The minimum numbers of SSRs for mono-, di-, tri-, tetra-, penta-, and hexanucleotides adopted for identification were 10, 6, 5, 5, 5, and 5, respectively.

5. Conclusions

In this study, we obtained first insight into the genome features of I. chinensis, and this information will help to design whole-genome sequencing strategies. The genomic characteristics of I. chinensis include a genome size of about 618–660 Mb, a heterozygosis rate of 1.1%, a repeat rate of 38%, and a GC content of 37.52%. A total of 334,649 microsatellite motifs were detected from the I. chinensis genome data. These results and the study dataset may provide a solid foundation for whole-genome sequencing, molecular-marker-assisted breeding, as well as functional genome research on I. chinensis in the future.

Author Contributions

Conceptualization, P.Z., Q.Z. and M.Z.; formal analysis, Q.Z.; investigation, J.L. and P.Z.; data curation, J.H.; writing—original draft preparation, P.Z.; writing—review and editing, Q.Z. and M.Z.; visualization, F.L. and J.H.; funding acquisition, M.Z., Q.Z. and P.Z. All authors have read and agreed to the published version of the manuscript.

Funding

This research was funded by the Jiangsu Academy of Forestry Youth Foundation [JAF-2022-03], Jiangsu Agriculture Science and Technology Innovation Fund [CX(21)3013], the Jiangsu Provincial Innovation and Extension Project of Forestry Science and Technology [LYKJ[2020]02] and [LYKJ[2021]07], the Jiangsu Provincial Innovation and Extension Project of Agriculture Science and Technology [2021-SJ-008] and Independent Research Projects of Jiangsu Academy of Forestry [ZZKY202105].

Informed Consent Statement

Not applicable.

Data Availability Statement

The data presented in this study are available on request from the corresponding author.

Conflicts of Interest

The authors declare no conflict of interest.

References

  1. Hu, S.Y. The genus Ilex in China. J. Arnold Arbor. 1949, 30, 233–344. [Google Scholar] [CrossRef]
  2. Chen, W.W.; Xiao, Z.Z.; Tong, X.; Liu, Y.P.; Li, Y.Y. Development and characterization of 25 microsatellite primers for Ilex chinensis (Aquifoliaceae). Appl. Plant Sci. 2015, 3, 1500057. [Google Scholar] [CrossRef] [PubMed]
  3. Chinese Pharmacopoeia Commission. Pharmacopoeia of the People’s Republic of China; China Medical Science Press: Beijing, China, 2015; Volume 1, p. 100. [Google Scholar]
  4. Shao, S.Y.; Li, R.F.; Sun, H.; Li, S. New triterpenoid saponins from the leaves of Ilex chinensis and their hepatoprotective activity. Chin. J. Nat. Med. 2021, 19, 376–384. [Google Scholar] [CrossRef]
  5. Li, R.F.; Xia, W.Q.; Liu, J.B.; Cui, B.S.; Hou, Q.; Sun, H.; Li, S. New triterpenoid saponins from the leaves of Ilex chinensis. Fitoterapia 2018, 131, 134–140. [Google Scholar] [CrossRef]
  6. Xia, W.Q.; Li, R.F.; Liu, J.B.; Cui, B.S.; Hou, Q.; Sun, H.; Li, S. Triterpenoids from the leaves of Ilex chinensis. Phytochemistry 2018, 148, 113–121. [Google Scholar] [CrossRef]
  7. Zhang, Q.; Zhou, P.; Liu, C.L.; Yu, Y.F.; Zhang, M.; Yang, J.D. Comparison of transcriptomic activity of Ilex integra and I. purpurea roots with Nacl treatments. J. Nanjing For. Univ. 2022, 46, 99–108. [Google Scholar]
  8. Zhou, Y.W.; Li, N.W.; Chen, H.; Chong, X.R.; Li, Y.L.; Lu, X.P.; Zhou, T.; Zhang, F. The complete chloroplast genome sequence of Ilex chinensis Sims. (Aquifoliaceae), a folk herbal medicine plant in China. Mitochondrial DNA 2021, 6, 1241–1242. [Google Scholar] [CrossRef]
  9. Xu, K.W.; Wei, X.F.; Lin, C.X.; Zhang, M.; Zhang, Q.; Zhou, P.; Fang, Y.M.; Xue, J.Y.; Duan, Y.F. The chromosome-level holly (Ilex latifolia) genome reveals key enzymes in triterpenoid saponin biosynthesis and fruit color change. Front. Plant. Sci. 2022, 13, 982323. [Google Scholar] [CrossRef]
  10. Kong, B.L.H.; Nong, W.; Wong, K.H.; Law, S.T.S.; So, W.L.; Chan, J.J.S.; Zhang, J.; Lau, T.W.D.; Hui, J.H.L.; Shaw, P.C. Chromosomal level genome of Ilex asprella and insight into antiviral triterpenoid pathway. Genomics 2022, 114, 110366. [Google Scholar] [CrossRef]
  11. Yao, X.; Lu, Z.Q.; Song, Y.; Hu, X.D.; Corlett, R.T. A chromosome-scale genome assembly for the holly (Ilex polyneura) provides insights into genomic adaptations to elevation in Southwest China. Hortic. Res. 2022, 9, uhab049. [Google Scholar] [CrossRef]
  12. Liang, X.Y.; Bai, T.D.; Wang, J.Z.; Jiang, W.X. Genome survey and development of 13 SSR markers in Eucalyptus cloeziana by NGS. J. Genet. 2022, 101, 39. [Google Scholar] [CrossRef] [PubMed]
  13. Morozova, O.; Marra, M.A. Applications of next-generation sequencing technologies in functional genomics. Genomics 2008, 92, 255–264. [Google Scholar] [CrossRef] [PubMed] [Green Version]
  14. Zhou, X.J.; Liu, M.X.; Lu, X.Y.; Sun, S.S.; Cheng, Y.W.; Ya, H.Y. Genome survey sequencing and identification of genomic SSR markers for Rhododendron micranthum. Biosci. Rep. 2020, 40, BSR20200988. [Google Scholar] [CrossRef] [PubMed]
  15. Ziya Motalebipour, E.; Kafkas, S.; Khodaeiaminjan, M.; Çoban, N.; Gözel, H. Genome survey of pistachio (Pistacia vera L.) by next generation sequencing: Development of novel SSR markers and genetic diversity in Pistacia species. BMC Genom. 2016, 17, 998. [Google Scholar] [CrossRef] [Green Version]
  16. Yu, Y.; Zhang, X.J.; Yuan, J.B.; Li, F.H.; Chen, X.H.; Zhao, Y.Z.; Huang, L.; Zheng, H.K.; Xiang, J.H. Genome survey and high-density genetic map construction provide genomic and genetic resources for the Pacific White Shrimp Litopenaeus vannamei. Sci. Rep. 2015, 5, 15612. [Google Scholar] [CrossRef] [Green Version]
  17. De la Rosa, L.; Zambrana, E.; Ramirez-Parra, E. Molecular bases for drought tolerance in common vetch: Designing new molecular breeding tools. BMC Plant Biol. 2020, 20, 71. [Google Scholar] [CrossRef]
  18. Li, J.M.; Li, S.Q.; Kong, L.J.; Wang, L.H.; Wei, A.Z.; Liu, Y.L. Genome survey of Zanthoxylum bungeanum and development of genomic-SSR markers in congeneric species. Biosci. Rep. 2020, 40, BSR20201101. [Google Scholar] [CrossRef]
  19. Lim, L.W.K.; Chung, H.H.; Hussain, H.; Gan, H.M. Genome survey of sago palm (Metroxylon sagu Rottboll). Plant Gene 2021, 28, 100341. [Google Scholar] [CrossRef]
  20. Fawad, A.; Nadeem, M.A.; Habyarimana, E.; Altaf, M.T.; Barut, M.; Kurt, C.; Chaudhary, H.J.; Khalil, I.H.; Yildiz, M.; Comertpay, G.; et al. Identification of genetic basis associated with agronomic traits in a global safflower panel using genome-wide association study. Turk. J. Agric. For. 2021, 45, 834–849. [Google Scholar]
  21. Lu, M.; An, H.M.; Li, L.L. Genome survey sequencing for the characterization of the genetic background of Rosa roxburghii Tratt and leaf ascorbate metabolism genes. PLoS ONE 2016, 11, e0147530. [Google Scholar] [CrossRef]
  22. Ozdemir, B.; Okay, F.Y.; Sarikamis, G.; Ozmen, C.Y.; Kibar, U.; Ergul, A. Crosstalk between flowering and cold tolerance genes in almonds (Amygdalus spp.). Turk. J. Agric. For. 2021, 45, 484–494. [Google Scholar] [CrossRef]
  23. Unamba, C.I.N.; Nag, A.; Sharma, R.K. Next generation sequencing technologies: The doorway to the unexplored genomics of non-model plants. Front. Plant Sci. 2015, 6, 1074. [Google Scholar] [CrossRef] [PubMed]
  24. Ekblom, R.; Galindo, J. Applications of next generation sequencing in molecular ecology of non-model organisms. Heredity 2011, 107, 1–15. [Google Scholar] [CrossRef] [PubMed] [Green Version]
  25. Yang, S.Q.; Chen, J.B.; Zhang, J.; Liu, J.F.; Yu, J.J.; Cai, D.B.; Yao, L.G.; Duan, P.F. First genome survey and repeatome analysis of Chrysopogon zizanioides based on next-generation sequencing. Biologia 2020, 75, 1273–1282. [Google Scholar] [CrossRef]
  26. Ma, L.; Wang, X.; Yan, M.; Liu, F.; Zhang, S.X.; Wang, X.M. Genome survey sequencing of common vetch (Vicia sativa L.) and genetic diversity analysis of Chinese germplasm with genomic SSR markers. Mol. Biol. Rep. 2022, 49, 313–320. [Google Scholar] [CrossRef] [PubMed]
  27. Bi, Q.X.; Zhao, Y.; Cui, Y.F.; Wang, L.B. Genome survey sequencing and genetic background characterization of yellow horn based on next-generation sequencing. Mol. Biol. Rep. 2019, 46, 4303–4312. [Google Scholar] [CrossRef] [PubMed]
  28. Greilhuber, J.; Leitch, I.J. Genome size and the phenotype. In Plant Genome Diversity; Springer: Vienna, Austria, 2013; Volume 2, pp. 323–344. [Google Scholar]
  29. Leitch, I.J.; Leitch, A.R. Genome size diversity and evolution in land plants. In Plant Genome Diversity; Springer: Vienna, Austria, 2013; pp. 307–322. [Google Scholar]
  30. Pati, K.; Zhang, F.; Batley, J. First report of genome size and ploidy of the underutilized leguminous tuber crop Yam Bean (Pachyrhizus erosus and P. tuberosus) by flow cytometry. Plant Genet. Resour. 2019, 17, 456–459. [Google Scholar] [CrossRef]
  31. Gschwend, A.R.; Wai, C.M.; Zee, F.; Arumuganathan, A.K.; Ming, R. Genome size variation among sex types in dioecious and trioecious Caricaceae species. Euphytica 2013, 189, 461–469. [Google Scholar] [CrossRef]
  32. Liu, B.H.; Shi, Y.J.; Yuan, J.Y.; Hu, X.S.; Zhang, H.; Li, N.; Li, Z.Y.; Chen, Y.X.; Mu, D.S.; Fan, W. Estimation of genomic characteristics by analyzing k-mer frequency in de novo genome projects. arXiv 2012, arXiv:1308.2012v2. [Google Scholar] [CrossRef]
  33. Zhang, Z.; Zhang, J.W.; Yang, Q.; Li, B.; Zhou, W.; Wang, Z.Z. Genome survey sequencing and genetic diversity of cultivated Akebia trifoliata assessed via phenotypes and SSR markers. Mol. Biol. Rep. 2021, 48, 241–250. [Google Scholar] [CrossRef]
  34. Claros, M.G.; Bautista, R.; Guerrero-Fernández, D.; Benzerki, H.; Seoane, P.; Fernández-Pozo, N. Why assembling plant genome sequences is so challenging. Biology 2012, 1, 439–459. [Google Scholar] [CrossRef] [PubMed] [Green Version]
  35. Panhwar, S.K.; Liu, Q.; Khan, F.; Siddiqui, P.J. Maximum sustainable yield estimates of Ladypees, Sillago sihama (Forsskål), fishery in Pakistan using the ASPIC and CEDA packages. J. Ocean Univ. China 2012, 11, 93–98. [Google Scholar] [CrossRef]
  36. Li, G.Q.; Song, L.X.; Jin, C.Q.; Li, M.; Gong, S.P.; Wang, Y.F. Genome survey and SSR analysis of Apocynum venetum. Biosci. Rep. 2019, 39, BSR20190146. [Google Scholar] [CrossRef] [PubMed] [Green Version]
  37. Wu, Y.F.; Xiao, F.M.; Xu, H.N.; Zhang, T.; Jiang, X.M. Genome survey in Cinnamomum camphora (L.) Presl. J. Plant Genet. Resour. 2014, 15, 150–153. [Google Scholar]
  38. Wang, C.; Yan, H.; Li, J.; Zhou, S.; Liu, T.; Zhang, X.; Huang, L. Genome survey sequencing of purple elephant grass (Pennisetum purpureum Schum ‘Zise’) and identification of its SSR markers. Mol. Breed. 2018, 38, 94. [Google Scholar] [CrossRef]
  39. Yao, X.; Song, Y.; Yang, J.B.; Tan, Y.H.; Corlett, R.T. Phylogeny and biogeography of the hollies (Ilex L., Aquifoliaceae). J. Syst. Evol. 2021, 59, 73–82. [Google Scholar] [CrossRef] [Green Version]
  40. Ming, R.; VanBuren, R.; Wai, C.M.; Tang, H.; Schatz, M.C.; Bowers, J.E.; Lyons, E.; Wang, M.-L.; Chen, J.; Biggers, E.; et al. The pineapple genome and the evolution of CAM photosynthesis. Nat. Genet. 2015, 47, 1435. [Google Scholar] [CrossRef] [Green Version]
  41. Hall, M.R.; Kocot, K.M.; Baughman, K.W.; Fernandez-Valverde, S.L.; Gauthier, M.E.A.; Hatleberg, W.L.; Krishnan, A.; McDougall, C.; Motti, C.A.; Shoguchi, E.; et al. The crown-of-thorns starfish genome as a guide for biocontrol of this coral reef pest. Nature 2017, 544, 231–234. [Google Scholar] [CrossRef] [Green Version]
  42. Roach, M.J.; Schmidt, S.A.; Borneman, A.R. Purge Haplotigs: Allelic contig reassignment for third-gen diploid genome assemblies. BMC Bioinform. 2018, 19, 460. [Google Scholar] [CrossRef]
  43. Feng, Y.Y.; Guo, L.L.; Jin, H.; Lin, C.C.; Zhou, C.H.; Fang, X.S.; Wang, J.H.; Song, Z.Q. Quantitative trait loci analysis of phenolic acids contents in Salvia miltiorrhiza based on genomic simple sequence repeat markers. BMC Bioinform. 2019, 133, 365–372. [Google Scholar] [CrossRef]
  44. Wu, Z.G.; Jiang, W.; Mantri, N.; Bao, X.Q.; Chen, S.L.; Tao, Z.M. Transciptome analysis reveals flavonoid biosynthesis regulation and simple sequence repeats in yam (Dioscorea alata L.) tubers. BMC Genom. 2015, 16, 346. [Google Scholar] [CrossRef] [PubMed] [Green Version]
  45. Barbosa, S.N.; Almeida, C. Genome survey and development of 15 microsatellite molecular markers in Syagrus coronata (Martius) Beccari (Arecaceae) by next-generation sequencing. Braz. J. Bot. 2019, 42, 195–200. [Google Scholar] [CrossRef]
  46. Wang, S.; Chen, S.; Liu, C.; Liu, Y.; Zhao, X.; Yang, C.; Qu, G.Z. Genome survey sequencing of Betula platyphylla. Forests 2019, 10, 826. [Google Scholar] [CrossRef]
  47. Qiu, B.X.; Fang, S.B.; Ikhwanuddin, M.; Wong, L.L.; Ma, H.Y. Genome survey and development of polymorphic microsatellite loci for Sillago sihama based on Illumina sequencing technology. Mol. Biol. Rep. 2020, 47, 3011–3017. [Google Scholar] [CrossRef] [PubMed]
  48. Zeng, Q.Y.; Huang, Z.H.; Wang, Q.W.; Wu, J.Y.; Feng, X.M.; Qi, Y.W. Genome survey sequence and the development of simple sequence repeat (SSR) markers in Erianthus arundinaceus. Sugar Tech. 2021, 23, 77–85. [Google Scholar] [CrossRef]
  49. Wang, R.K.; Fan, J.S.; Chang, P.; Zhu, L.; Zhao, M.R.; Li, L.L. Genome survey sequencing of Acer truncatum Bunge to identify genomic information, simple sequence repeat (SSR) markers and complete chloroplast genome. Forests 2019, 10, 87. [Google Scholar] [CrossRef] [Green Version]
  50. Kandaiah, V.; Singaram, N.; Kandasamy, K.I. Optimized flow cytometric protocol and genome size estimation of Sabah snake grass (Clinacanthus nutans). J. Med. Plants Res. 2021, 15, 531–539. [Google Scholar]
  51. International Rice Genome Sequencing Project. The map-based sequence of the rice genome. Nature 2005, 436, 793–800. [Google Scholar] [CrossRef] [Green Version]
  52. Doležel, J.; Bartoš, J.A.N. Plant DNA flow cytometry and estimation of nuclear genome size. Ann. Bot. 2005, 95, 99–110. [Google Scholar] [CrossRef] [Green Version]
  53. Marçais, G.; Kingsford, C. A fast, lock-free approach for efficient parallel counting of occurrences of k-mers. Bioinformatics 2011, 27, 764–770. [Google Scholar] [CrossRef] [Green Version]
  54. Vurture, G.W.; Sedlazeck, F.J.; Nattestad, M.; Underwood, C.J.; Fang, H.; Gurtowski, J.; Schatz, M.C. GenomeScope: Fast reference-free genome profiling from short reads. Bioinformatics 2017, 33, 2202–2204. [Google Scholar] [CrossRef] [PubMed] [Green Version]
  55. Jo, E.; Cho, Y.H.; Lee, S.J.; Choi, E.; Kim, J.; Kim, J.H.; Chi, Y.M.; Park, H. Genome survey and microsatellite motif identification of Pogonophryne albipinna. Biosci. Rep. 2021, 41, BSR20210824. [Google Scholar] [CrossRef] [PubMed]
Figure 1. The result of FCM analysis for I. chinensis samples simultaneously processed with rice: (a,b) the representative female sample; (c,d) the representative male sample. Scatterplot with side scatter (SSC) versus PI fluorescence with manually drawn polygon gate (a,c), histogram of relative fluorescence intensity derived from nuclei isolated from rice and I. chinensis processed simultaneously (b,d). Peak 4 represents G0/G1 nuclei of rice, peak 5 represents G0/G1 nuclei of I. chinensis sample.
Plants 11 03322 g001
Figure 2. Distribution figure of AT and GC content: (a) read 1 AT and GC content distribution; (b) read 2 AT and GC content distribution. Different colors represent different base types.
Plants 11 03322 g002
Figure 3. K-mer (k = 21) distribution as calculated by GenomeScope. The x-axis is depth and the y-axis is the proportion that represents the frequency at that depth divided by the total frequency of all depths. Blue bars represent the observed k-mer distribution; the black line represents the modeled distribution without the k-mer errors (red line) and up to a maximum k-mer coverage specified in the model (yellow line). Abbreviations: len, estimated genome length; uniq, unique portion of the genome (nonrepetitive elements); het, genome heterozygosity; err, the sequencing error rate.
Plants 11 03322 g003
Figure 4. Distribution of scaffold coverage depth and length. The x-axis represents the coverage and the y-axis is the sequence length.
Plants 11 03322 g004
Figure 5. Distribution of scaffold coverage depth and number. The x-axis represents the coverage and the y-axis is the sequence number.
Plants 11 03322 g005
Figure 6. Guanine plus cytosine (GC) content and depth correlation analysis. The x-axis represents the GC content and the y-axis is the sequence depth.
Plants 11 03322 g006
Figure 7. Characteristics of microsatellite motifs: (a) frequency of different microsatellite motifs; (b) frequency of different dinucleotide motifs; (c) frequency of different trinucleotide motifs.
Plants 11 03322 g007
Figure 8. The morphological characteristics of I. chinensis: (A) the plant; (B) the leaves; (C) the tree bark; (D) the branch with fruits; (E) the pyrene.
Plants 11 03322 g008
Table 1. Statistics of all samples using flow cytometry.
Genome Size (Mb)
Mean ± SD
CV (%)
of Samples
CV (%)
of Standard
Female656 ± 64.004.19
Male665 ± 124.094.64
Average660 ± 104.054.42
Abbreviations: CV, the coefficient variation value of peak.
Table 2. Sequencing data statistics and quality assessment of I. chinensis.
Number of Raw ReadsRaw Base
(Gbp)
Number of Clean ReadsError Rate (%)Q20 (%)Q30 (%)GC Content (%)Average
Quality
298,755,43044.813297,637,2620.35495.27587.8437.5234.75
Abbreviations: Q20, percentage of bases with quality value ≥ 20; Q30, percentage of bases with quality value ≥ 30.
Table 3. Statistics of assembled genome sequences of I. chinensis.
Total Length (bp)Total NumberMax Length (bp)Min Length (bp)N20 Length (bp)N50 Length (bp)N80 Length (bp)
Scaffold685,140,399250,019112,65250015,13757381663
Publisher’s Note: MDPI stays neutral with regard to jurisdictional claims in published maps and institutional affiliations.

