Article

Evaluation of In Vitro Solar Protection Factor (SPF), Antioxidant Activity, and Cell Viability of Mixed Vegetable Extracts from Dirmophandra mollis Benth, Ginkgo biloba L., Ruta graveolens L., and Vitis vinífera L.

by
Letícia Caramori Cefali
1,2,
Janaina Artem Ataide
1,3,
Ana Rita Fernandes
1,
Elena Sanchez-Lopez
1,4,5,
Ilza Maria de Oliveira Sousa
6,
Mariana Cecchetto Figueiredo
6,
Ana Lucia Tasca Gois Ruiz
3,
Mary Ann Foglio
3,
Priscila Gava Mazzola
3,*,† and
Eliana Barbosa Souto
1,7,*,†
1
Department of Pharmaceutical Technology, Faculty of Pharmacy, University of Coimbra (UC), 3000-548 Coimbra, Portugal
2
Institute of Biology, University of Campinas (UNICAMP). R. Monteiro Lobato, 255, Campinas, Sao Paulo 13083-862, Brazil
3
Faculty of Pharmaceutical Sciences, University of Campinas (UNICAMP), Rua Cândido Portinari, 200, Campinas, Sao Paulo 13083-871, Brazil
4
Department of Pharmacy, Pharmaceutical Technology and Physical Chemistry, Faculty of Pharmacy and Institute of Nanoscience and Nanotechnology (IN2UB), University of Barcelona, 08028 Barcelona, Spain
5
Networking Research Centre of Neurodegenerative Disease (CIBERNED), Instituto de Salud Juan Carlos III, 28049 Madrid, Spain
6
School of Medical Sciences, University of Campinas (UNICAMP). R. Sergio Buarque de Holanda, 250, Campinas, Sao Paulo 13083-859, Brazil
7
CEB—Centre of Biological Engineering, University of Minho, Campus de Gualtar, 4710-057 Braga, Portugal
*
Authors to whom correspondence should be addressed.
Authors with equal contribution.
Submission received: 13 August 2019 / Revised: 24 October 2019 / Accepted: 25 October 2019 / Published: 26 October 2019

Abstract

:
The aim of this study was to validate a HPLC method for the assay of flavonoids in extracts obtained from natural sources, i.e., from Dirmophandra mollis Benth, Ginkgo biloba L., Ruta graveolens L., and Vitis vinífera L. The potential sun protecting effect, antioxidant activity, and cell viability of the extracts were also determined. Individual extracts (obtained from each individual species) and a mixed extract (containing the four extracts) were analyzed by the validated HPLC method for the identification of flavonoids and quantification of rutin and quercetin. An in vitro cell viability study was carried out using the neutral red method. The in vitro sun protection factor was determined by spectral transmittance and in vitro antioxidant efficacy was evaluated against DPPH, ABTS, and AAPH radicals. The HPLC method used for the identification and quantification of flavonoids in extracts exhibited linearity, precision, accuracy, and robustness. Detection and quantification limits were, respectively, 2.881 ± 0.9 μg·mL−1 and 0.864 ± 0.9 μg·mL−1 for quercetin, and 30.09 ± 1 μg·mL−1 and 9.027 ± 1.1 μg·mL−1 for rutin. All extracts did not affect cell viability at the evaluated concentration range and exhibited a sun protection effect and antioxidant activity. Among the evaluated extracts, Ginkgo biloba L. and the mixed extract depicted the most expressive antioxidant activity. The mixed extract exhibited sunscreen protection against ultraviolet A (UVA) and ultraviolet B (UVB) and a critical wavelength of 372.7 ± 0.1. Our results translate the enhanced flavonoids’ composition of the mixed extract, which may be a potential alternative over sunscreens and antioxidants in pharmaceutic/cosmetic formulations.

1. Introduction

Because of its many benefits, sun is essential to life, but sun radiation, especially ultraviolet A (UVA) and ultraviolet B (UVB), can stimulate free radical production, damaging mitochondrial enzymes and plasmatic membranes and causing reduction of antioxidant substances in the skin [1,2,3,4]. Moreover, UVA and UVB radiations can directly promote DNA damage, which is associated with skin aging acceleration and skin cancer, in addition to skin sunburns [5,6].
World Health Organization epidemiological studies show that ultraviolet (UV) radiation exposition, especially during childhood and adolescence, is the main etiological agent of skin cancer [7]. In Brazil, skin cancer is the most prevalent in the Brazilian population, which can be avoided by protection against sunlight, such as sunscreen use, stimulated by health education of the population [8].
Sunscreens are topical products initially developed to prevent sunburns, but have further evolved to protect against other harmful effects of ultraviolet radiation, such as skin cancer, aging, wrinkle formation, undesired pigmentation, and collagen loss [9,10]. Ideal UV filters should be non-toxic, not cause allergic reactions, and not be systemically absorbed [11]. Unfortunately, some concerns still remain about the safety of UV filters, as adverse effects, including contact sensitivity, vitamin D deficiency, allergic reactions, and photogenotoxicity, have been reported [12,13]. Moreover, there are also concerns regarding the accumulation of UV filters in the environment and potential risks of this accumulation [14]. Therefore, research on the use of natural ingredients aiming at reduction of skin irritation and other harmful effects associated with sunscreens is steadily increasing [15].
Among many plant compounds, flavonoids are the most studied in use as sun filters by presenting cyclic and aromatic rings in their structure absorbing in the ultraviolet region, especially at wavelength ranges of 240–285 nm and 300–550 nm [16]. Flavonoids are the third largest class of natural products and exhibit many important effects on plants, mainly regarding protection against pathogens and UVB radiation [17]. Rutin and quercetin are amongst the most common flavonoids and both have been evaluated for many different biological effects [18,19,20,21].
Continuing efforts in finding new sunscreens from natural products [22,23,24,25], the present study aimed at evaluating extracts of Dimorphandra mollis Benth, Ginkgo biloba L., Ruta graveolens L., and Vitis vinifera L., alone and as a mixture, as sunscreen filters using in vitro models.

2. Materials and Methods

2.1. Material

Benitaka grape (Vitis vinifera L. fruits) was purchased in single batch in a local supermarket. Dimorphandra mollis Beth fava beans were harvested in Private Biological Reserve (22°18′S/47°11′W), in Mogi Guaçu (São Paulo, Brazil), in May 2015. Ruta graveolens leaves were harvested in the Chemical, Biological and Agricultural Pluridisciplinary Research Center—CPQBA (22°48′S/47°0′W) at the University of Campinas (UNICAMP) (Campinas, São Paulo, Brazil) in April 2015. Ginkgo biloba L. dry extract was purchased at Galena (Campinas, São Paulo, Brazil). Ethyl alcohol, acetic acid, hydrochloric acid, boric acid, oxalic acid, acetone, ether, metallic magnesium, metallic zinc, ferric chloride, and aluminum chloride were provided by Synth (São Paulo, Brazil), and 1,1-diphenyl-2-picrylhydrazyl (DPPH), 2-2′-azino-bis(3-ethylbenzothiazoline-6-sulphonic acid (ABTS), 2,2′-azobis (2-amidinopropane) dihydrochloride (AAPH), and fluorescein by Sigma-Aldrich (São Paulo, Brazil). Quercetin (93.3% purity) and rutin (97.3% purity) standard by Acros (Sao Paulo, Brazil). RPMI-1640 and fetal bovine serum were provided by Gibco (Sao Paulo, Brazil) and Tris [hydroxymethyl] aminomethane and neutral red dye was provided by Sigma-Aldrich (São Paulo, Brazil).

2.2. Flavonoid Extraction

Fresh Dimorphandra mollis Benth fava beans and Ruta graveolens L leaves were dried in a stove (Lemaq, Mod LM-EST, Diadema, Brazil) at 40 ± 3 °C for 72 h, and then ground in hammer mill [26]. Fresh Benitaka grapes were analytically weighed, washed with neutral detergent and water, peeled, and grouped peels were dried at 40 ± 2 °C in a stove (Lemaq, Mod LM-EST, Diadema, Brazil) for 72 h. After weight, dry peels were ground in a blender (Black&Decker, Campinas, Brazil). For each species, extracts were obtained using ethanol at 1:3 (w:v) (Synth) in a liquid extractor by mechanic stirring at 27 ± 3 °C for 90 min. Thereafter, all extracts were subjected to vacuum filtration, solvent elimination (Marconi, MA120, Piracicaba, Brazil) at 40 ± 2 °C, and freeze-dried (Thermo Scientific, Power Dry PL3000, São Paulo, Brazil) [27]. All dry extracts, including commercial Ginkgo biloba leaf extract, were subjected to physical–chemical analysis such as pH, density, granulometry measurement, dry loss, total ash, and insoluble ash [28].

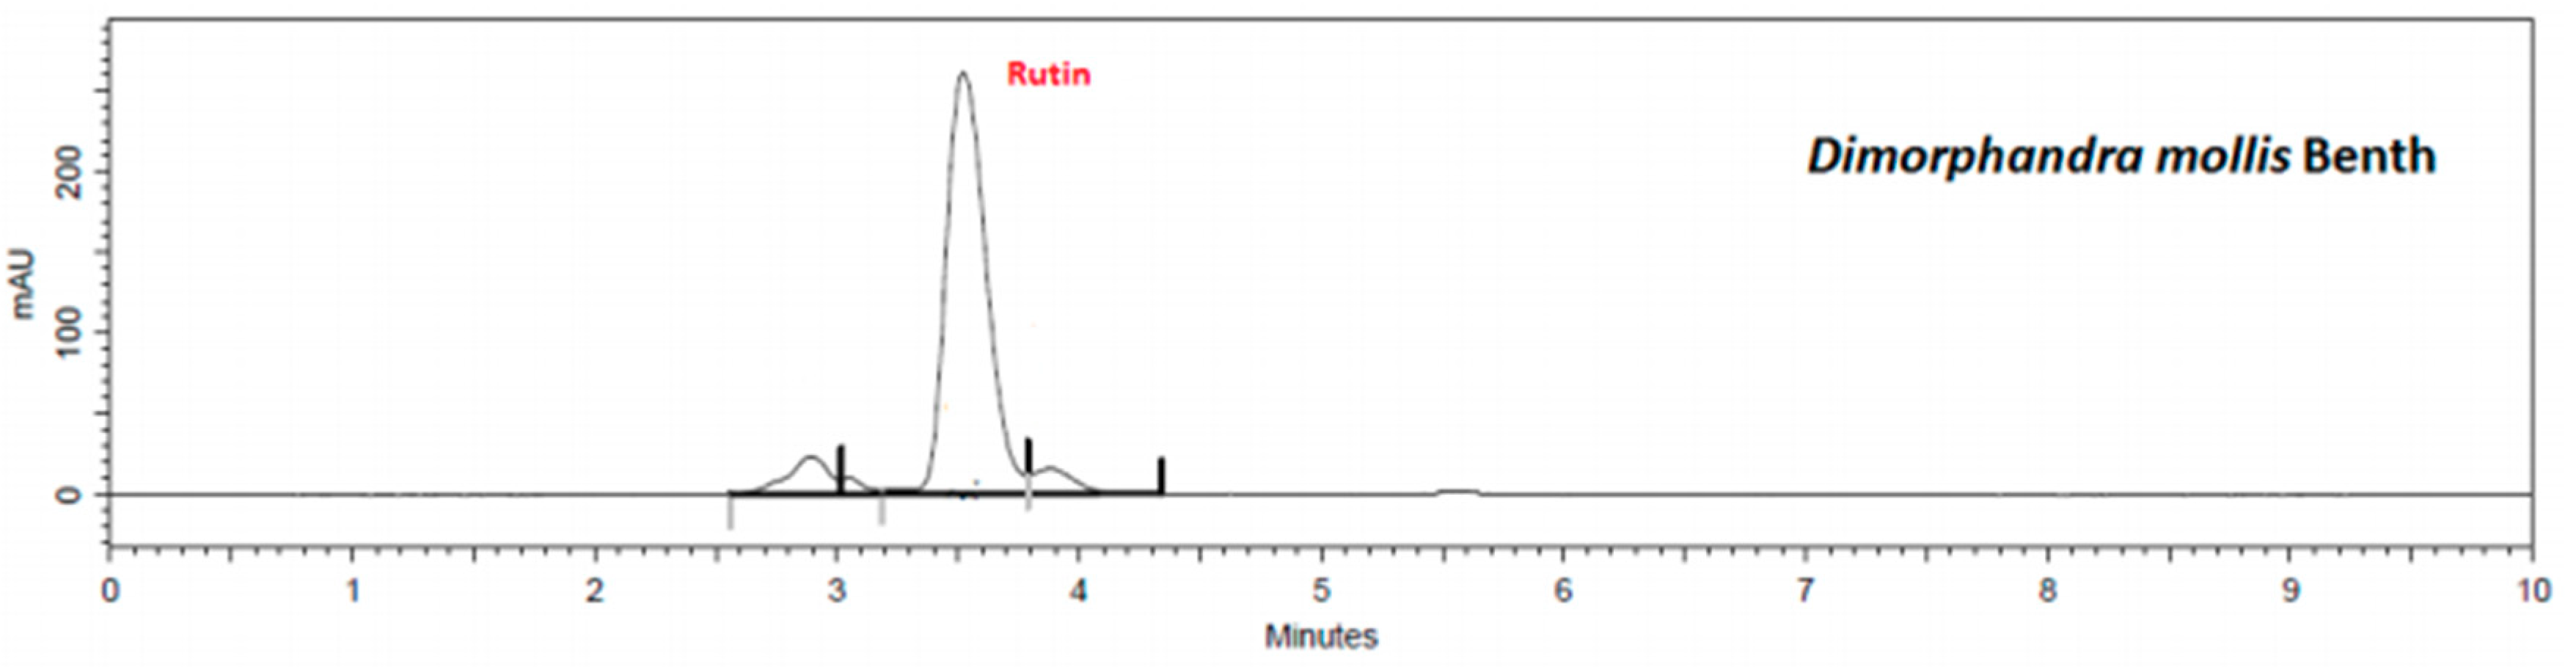
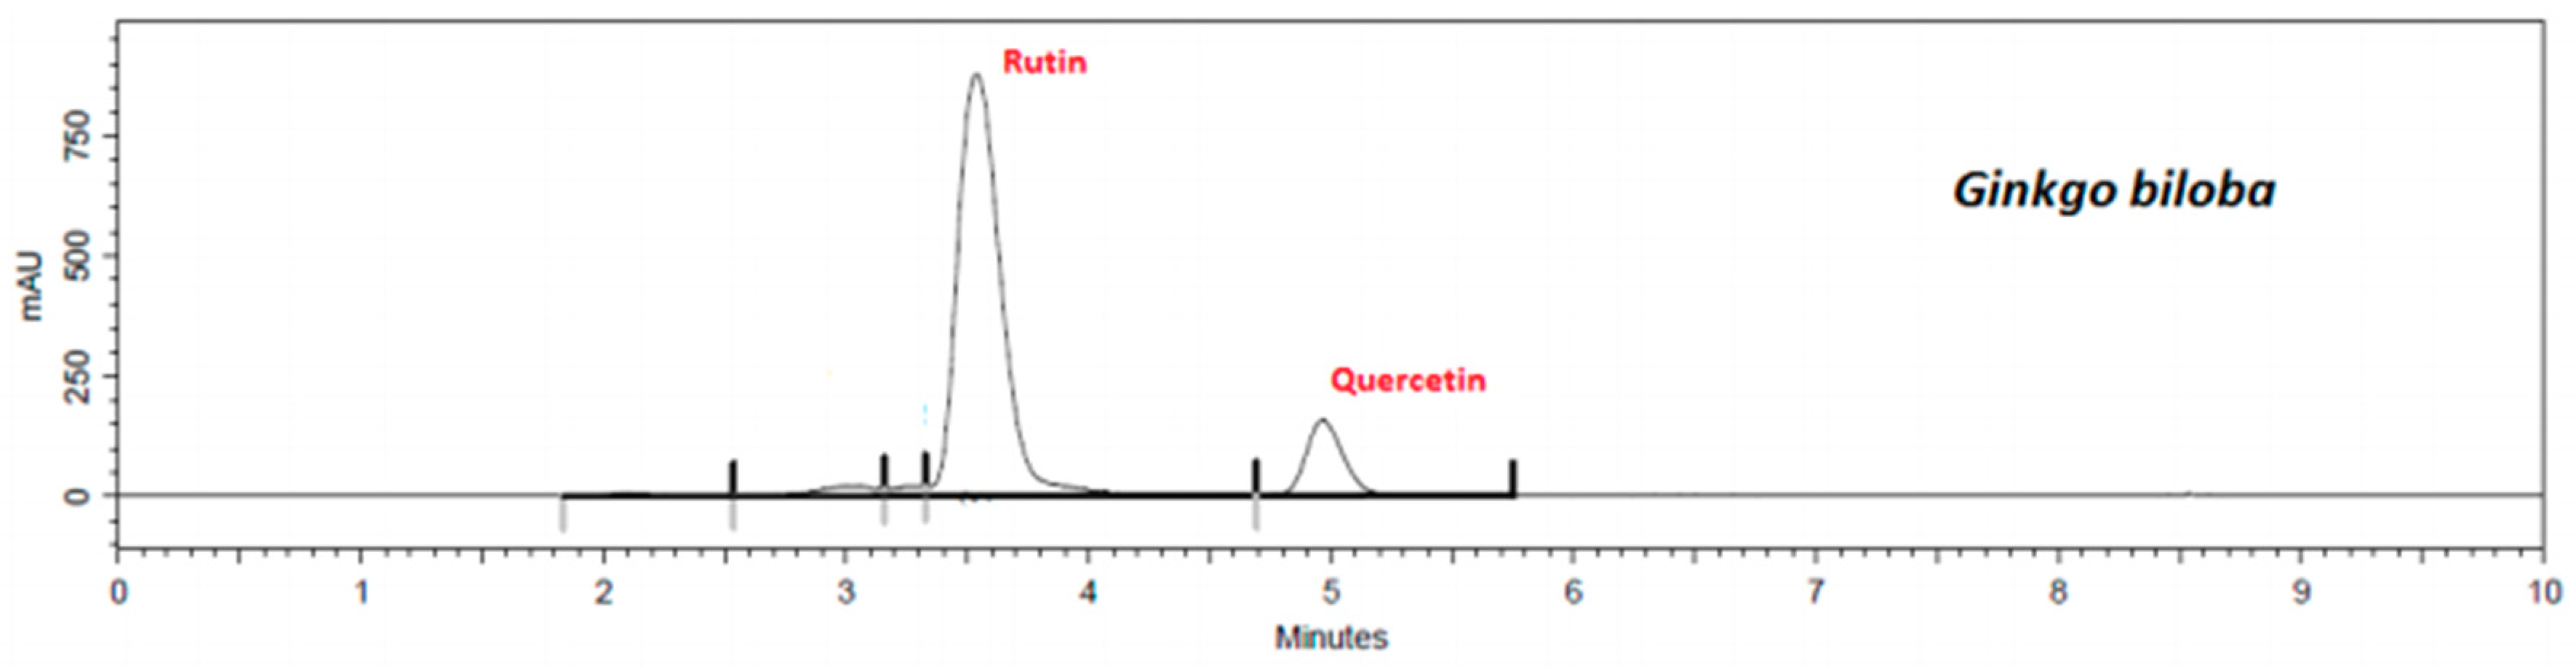
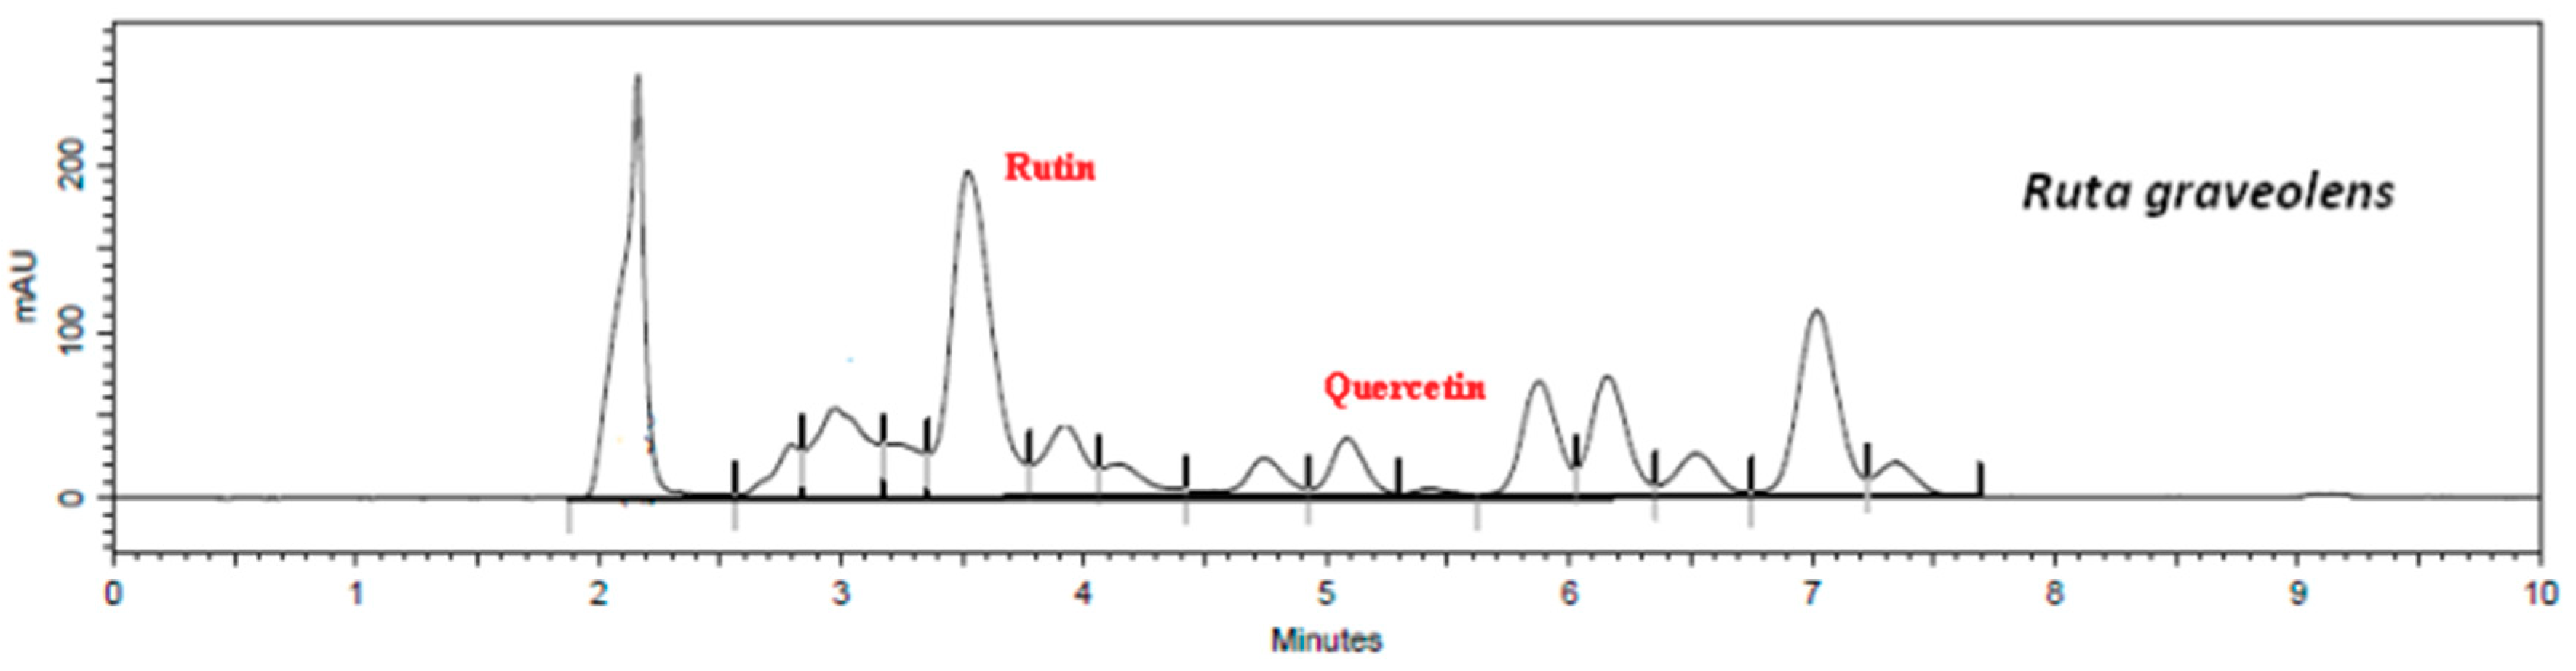
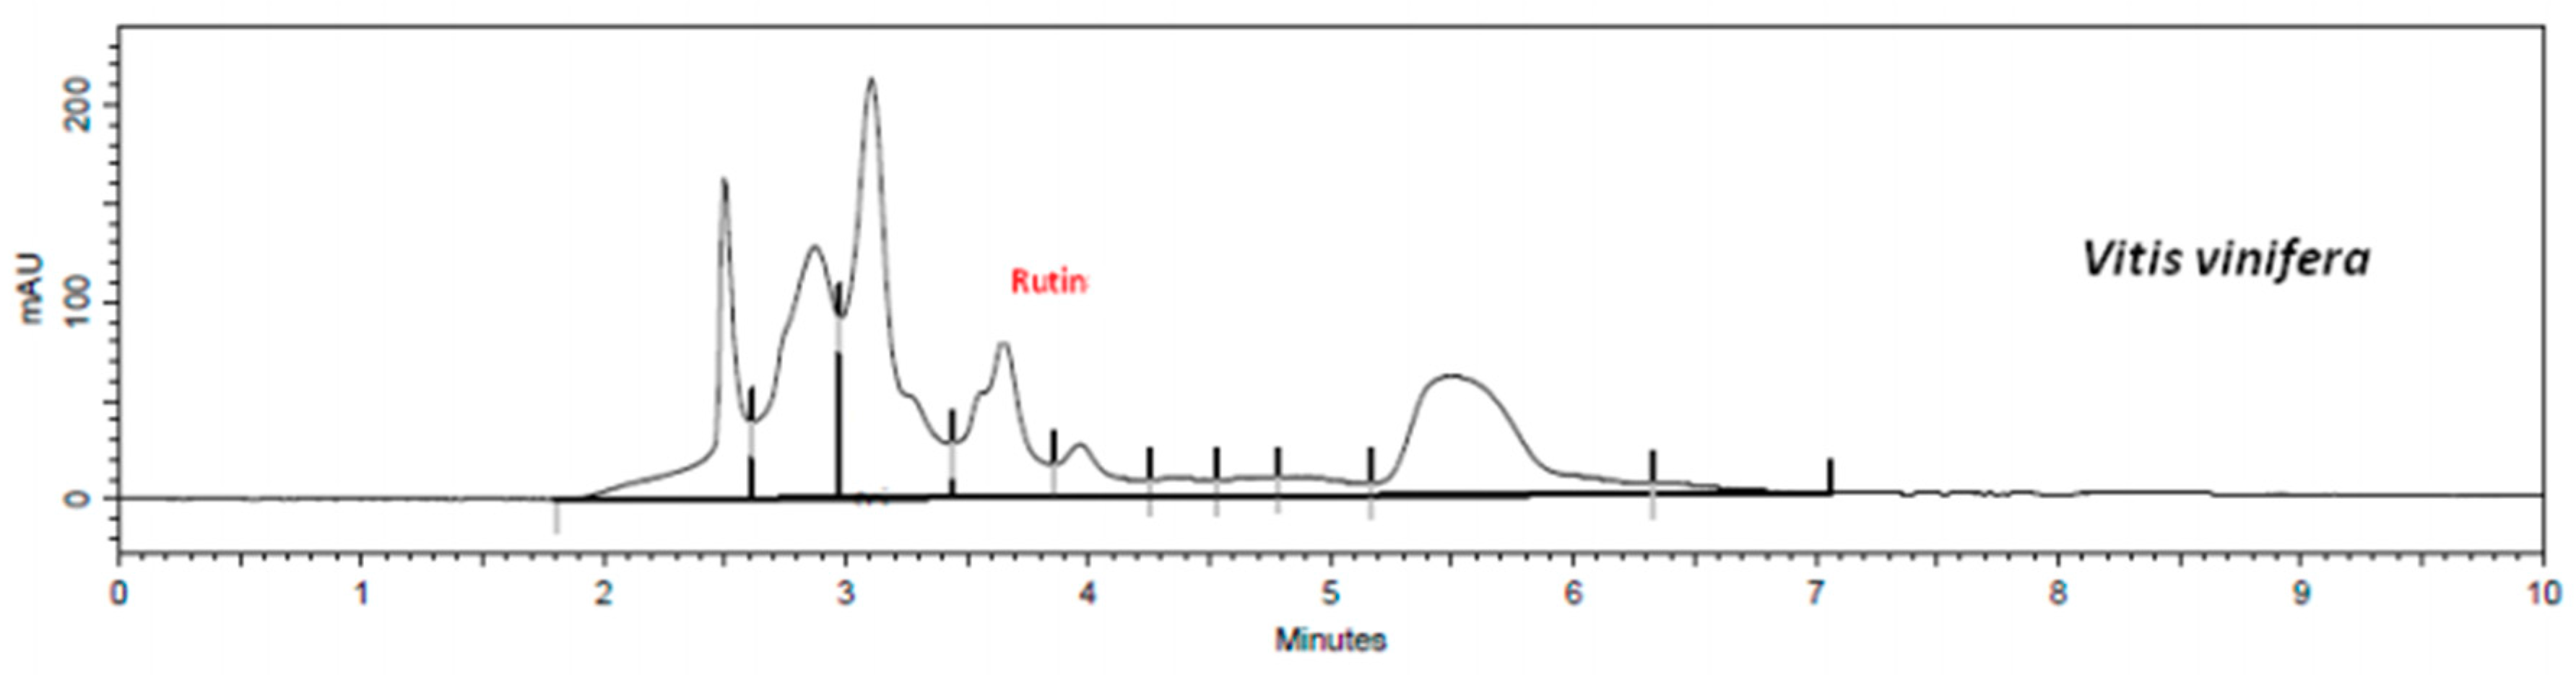
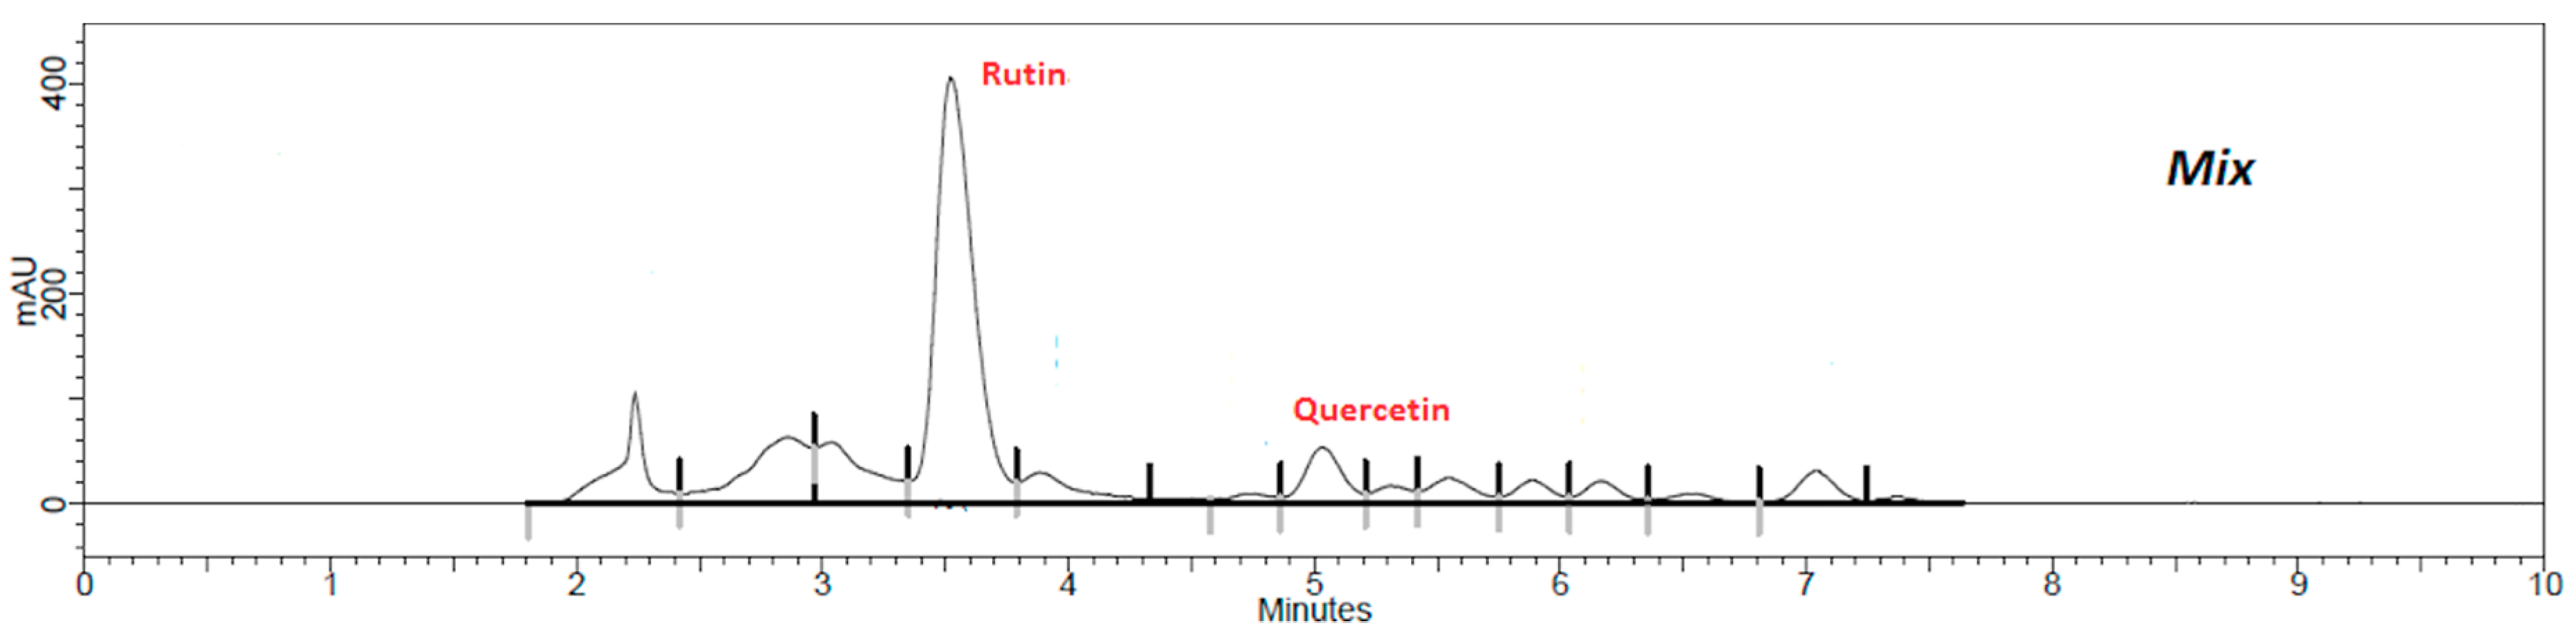
2.3. Flavonoid Identification and Quantification

All extracts were subjected to identification reactions [28], such as Shinoda, Taubock, Pew, Ferric chloride, and aluminum chloride for flavonoid identification.

2.4. Flavonoid Analysis by HPLC

2.4.1. Sample Preparation

Dry extracts were resuspended in HPLC grade methanol (Merck) to achieve the final concentrations of 5 μg·mL−1 to Dimorphandra mollis Benth, 5 μg·mL−1 to Ginkgo biloba L., 50 μg·mL−1 to Ruta graveolens L., and 1000 μg·mL−1 to Vitis vinífera L. A mixed sample in 1:1:1:1 volume proportion was prepared containing the four extracts. Then, all samples were separately filtered in 0.45 µm membrane (Merck). Quercetin (50 μg·mL−1) and rutin (500 μg·mL−1) standard were analyzed by HPLC in comparison to extracts results.

2.4.2. HPLC Conditions

Aliquots of 5 µL of each sample were injected in a HPLC–DAD instrument (Agilent, Technologies 1250 infinity), using monomeric chromatographic column C18 (Phenomenex), flow rate of 0.3 mL·min−1 for 10 min. The mobile phase used was methanol grade HPLC acidified with 0.1% (v/v) formic acid (Synth), at 27 ± 1 °C, and flavonoids quercetin and rutin were identified at 257 nm [29].

2.4.3. Validation of Analytical Method by HPLC

The analytical method was validated according to parameters required by Brazilian Resolution nº 899 [30] for phytotherapeutic agents [31]. Analytical curves were obtained using concentrations of 50.0, 25.0, 12.5, 6.25, and 3.125 μg·mL−1 for quercetin and 500.0, 250.0, 125.0, 62.5, and 31.25 μg·mL−1 for rutin, both registered at 257 nm.
The precision assay was performed using intra-day and inter-day repeatability [30,31]. Six samples (analytical standard) with a concentration of 50 μg·mL−1 to quercetin and 500 μg·mL−1 to rutin were analyzed on the same day and on two consecutive days. Areas of the standards’ peaks were obtained and variation coefficient percentage was calculated. The mixed sample was also subjected to precision assay for reliability of results.
The accuracy test was performed through the recovery assay, which consisted of adding a known concentration of flavonoid standards to extracts. Then, different volumes (0.75, 1.25, and 1.75 mL) of quercetin (50 μg·mL−1) and rutin (500 μg·mL−1) were transferred to 5 ml volumetric flasks containing 0.625 mL of Dimorphandra mollis Benth (1 mg·mL−1), Ginkgo biloba L. (1 mg·mL−1), Ruta graveolens L. (5 mg·mL−1), Vitis vinífera L. (100 mg·mL−1), and the mixed extract, separately. Volumes were completed with methanol HPLC grade, resulting in different concentrations of quercetin and rutin (Cf). The recovery percentages of flavonoid standards (R%) were determinate [30,31].
For robustness determination, six concentrations of mixed sample were analyzed and the analyzer was varied for data comparison [30].
Detection and quantification limits (DL and QL, respectively) were evaluated to determine and quantify the lowest acceptable concentration of quercetin and rutin in extracts [30]. Therefore, rutin and quercetin solution (analytical standards) were prepared containing low concentration, and DL and QL were calculated using Equations (1) and (2).
DL = SD × 3/SC
QL = SD × 10/SC
where SD is standard deviation of intercept with the Y axis of at least three analytical curves constructed, and SC is the slope of analytical curve.
To determine the method selectivity, chromatograms of extracts were compared with analytical standards chromatograms to determine impurities in the extracts [30].

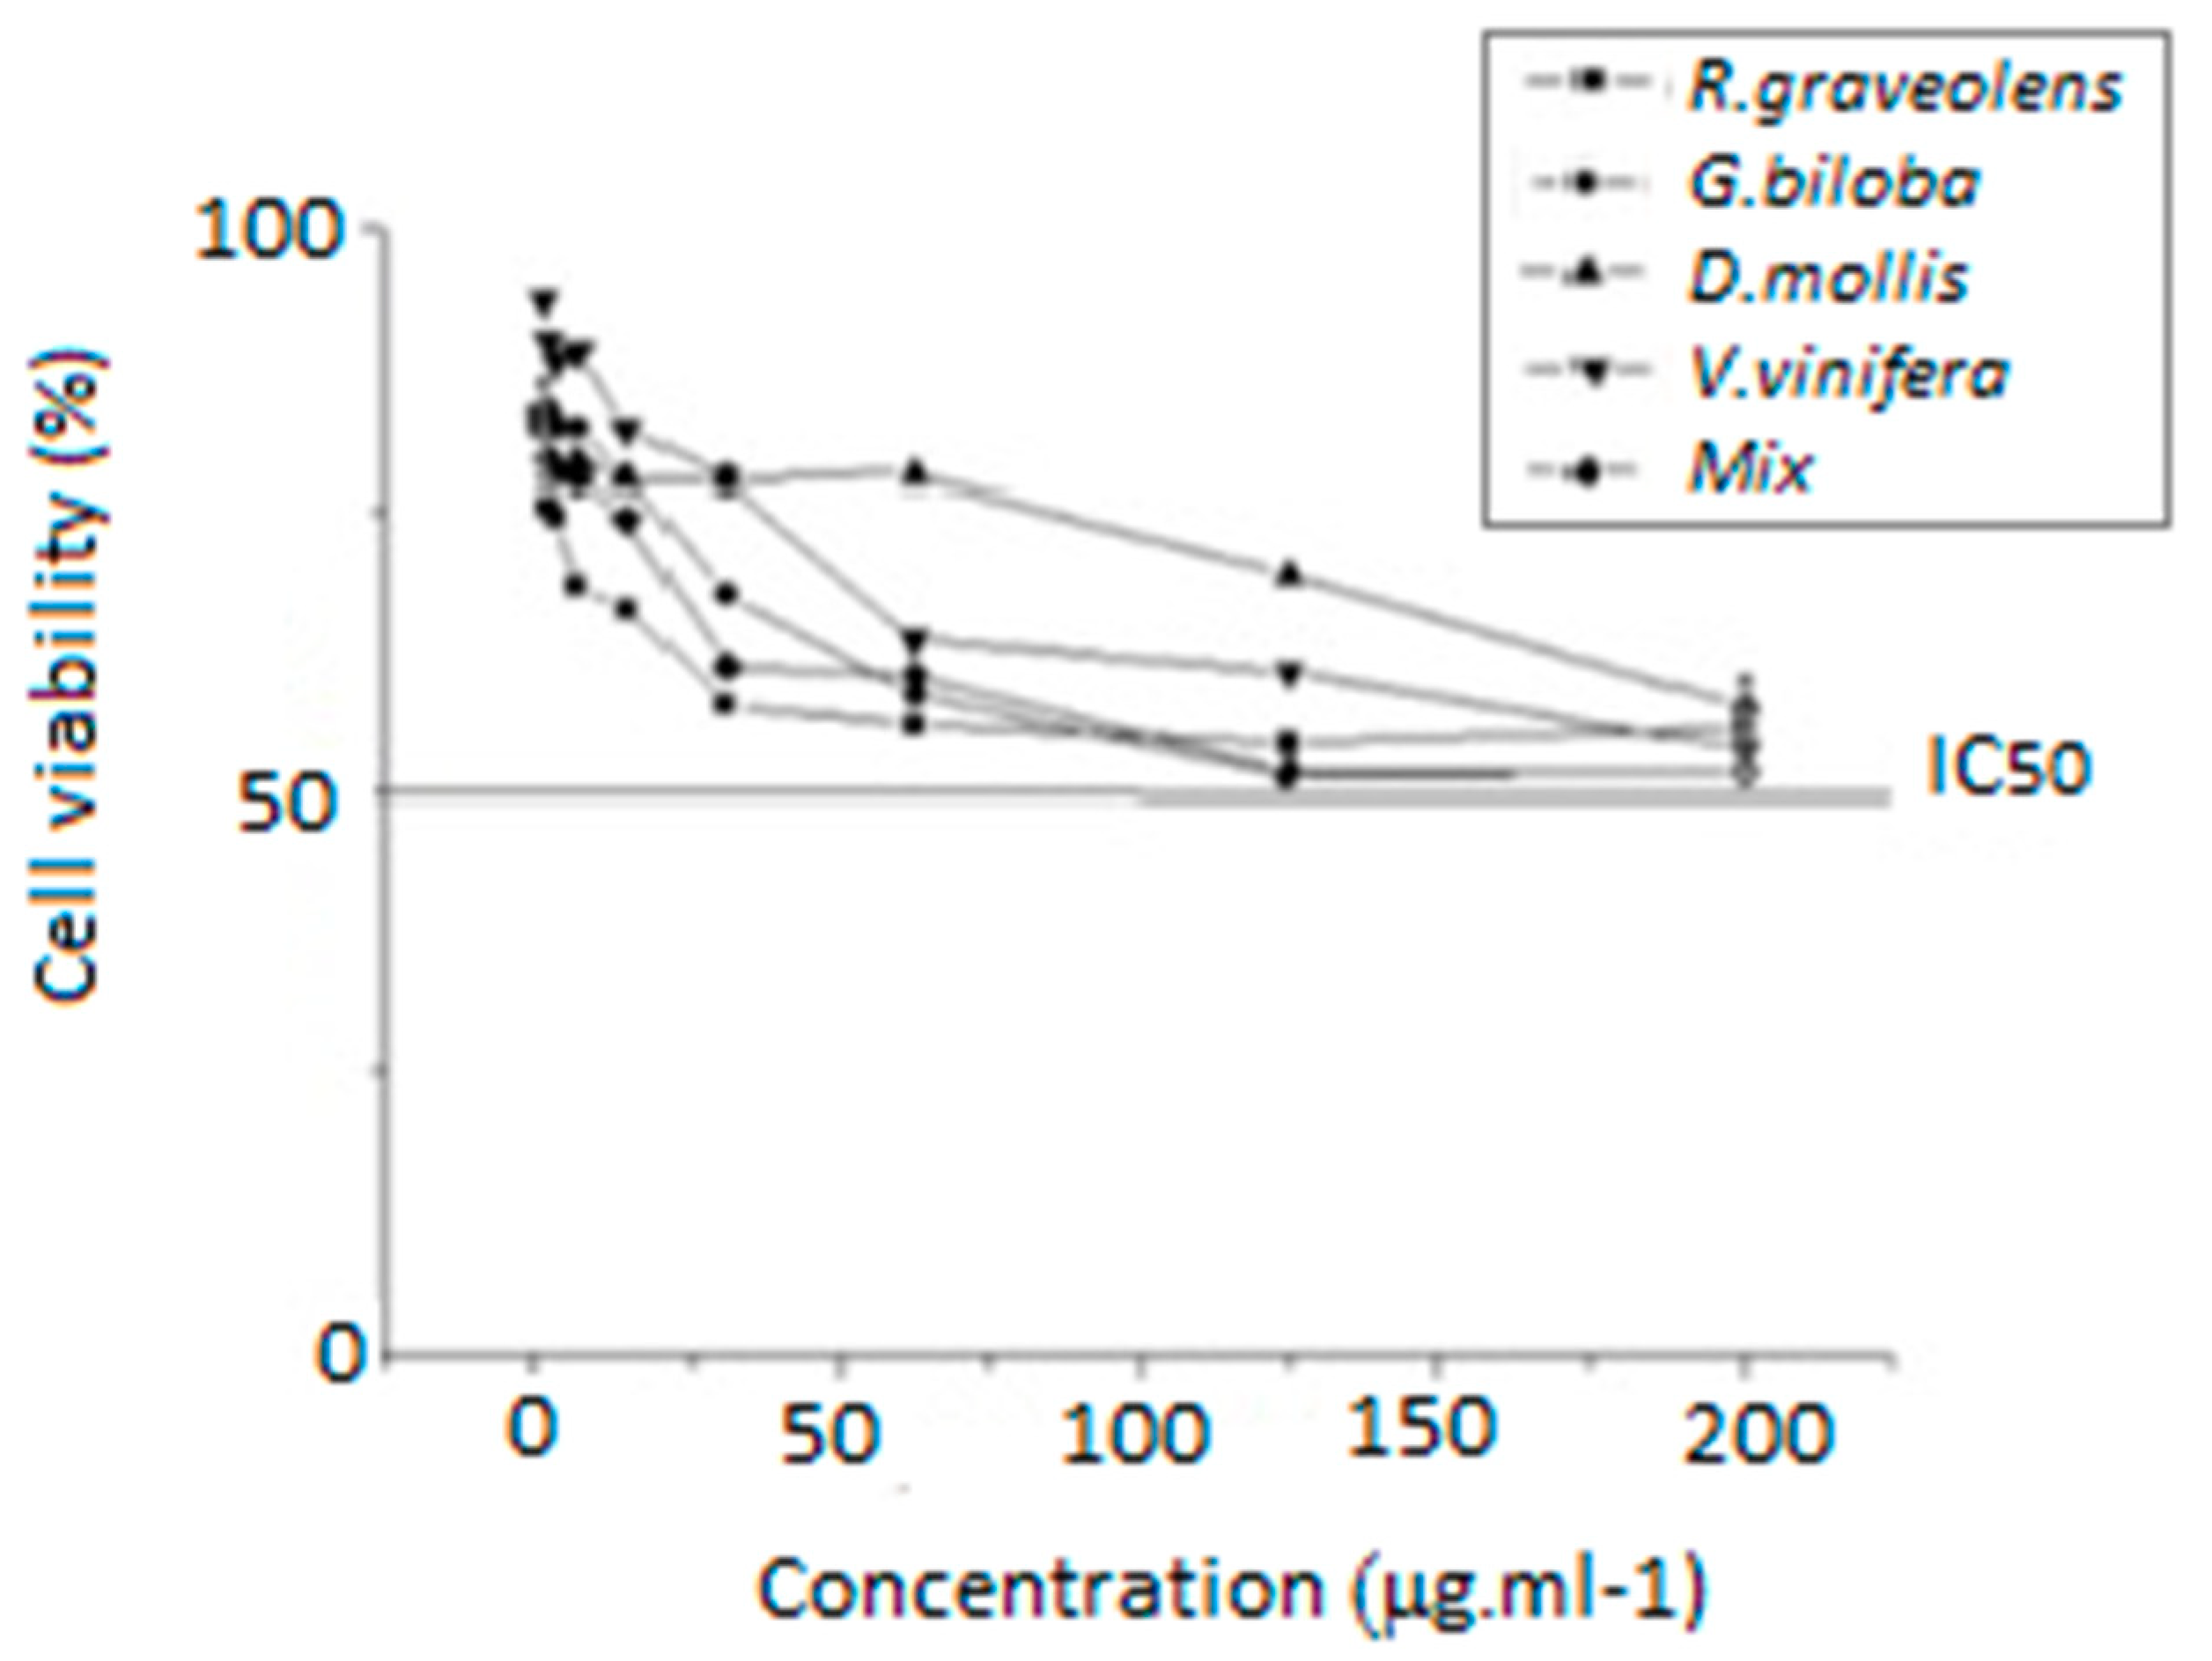
2.5. In Vitro Viability Cell Analysis by Neutral Red Uptake (NRU)

2.5.1. Cell Culture Conditions

The immortalized human keratinocyte (HaCaT) cell line was kindly provided by Prof. Ricardo Della Coletta (University of Campinas) and was maintained in RPMI 1640 (Gibco, USA) supplemented with 5% (v/v) fetal bovine serum (FBS, Gibco) and 1% (v/v) penicillin/streptomycin (Nutricell, 1000 U·mL−1:1000 g·mL−1) in a humidified atmosphere with 5% CO2 at 37 °C. For the experiments, HaCaT cells were used between passages 5 to 12.

2.5.2. Samples and Solutions

The four individual extracts (D. mollis fava beans, G. biloba dry extract, R. graveolens leaves, and V. vinifera fruit peels) and the mixed extract (5 mg) were initially diluted in DMSO (50 µL), followed by the addition of 950 µL of RPMI 1640/FBS 5% (working solution). Final concentrations (200.0, 125.0, 62.5, 31.25, 15.62, 7.5, and 2.5 μg·mL−1) were obtained by serial dilution in RPMI 1640/FBS 5%. Neutral red stoke solution was prepared at 33 μg·mL−1 in deionized water. Neutral red work solution was prepared by mixing 1 mL of stoke solution with 79 mL of RPMI-1640 supplemented with 0.5% (v/v) of fetal bovine serum and 1% (v/v) penicillin/streptomycin, followed by 30 min at 37 °C in a water bath and centrifugation (Fanem, São Paulo, Brazil) for 10 min at 1000 rpm.

2.5.3. Cell Viability Assay

The in vitro cell viability assay was performed as described by Stokes et al. [32] and OECD [33]. The HaCaT (4 × 10⁴ cells·mL−1), in 96-well plates (100 µL cells·well−1), were exposed to the samples’ final concentrations, in triplicate, for 48 h. The final DMSO concentration (≤0.25%) did not affect cell viability. Doxorubicin chloride (0.5 μg·mL−1) was used as positive control. After 48 h of exposure, medium was removed and replaced by neutral red work solution (200 μL·well−1). Cells were incubated for 3 h, followed by supernatant removal and the addition of ethanol/acetic acid solution (1.0%; v/v) (100 μL·well−1). Absorbance values were read at 540 nm using a spectrophotometer (Versamax, Molecular Devices, São Paulo, Brazil). Concentration–response curves for each sample were plotted using GraphPad Prism (version 5.02) software for Windows (GraphPad Software, San Diego, CA, USA).

2.6. In Vitro Sun Protection Factor Evaluation

The in vitro sun protection factor was determined by the ultraviolet-visible spectrophotometry method described by Mansur et al. [34]. Spectrophotometric readings were obtained for each extract (100 μg·mL−1) at 290–320 nm and SPF values were determined using Equation (3):
SPF = CF × Σ290320 × EE(λ) × I(λ) × Abs(λ)
where SPF stands for solar protection factor; CF for correction factor; EE(λ) is the erythemogenic effect of wavelength radiation (λ) nm, which was previously calculated by Sayre et al. [35]; I(λ) is the intensity of solar radiation in the wavelength (λ) nm; and Abs(λ) is the spectrophotometry reading of the absorbance of sunscreen solution in the wavelength (λ) nm.
In vitro SPF, critical wavelength (λc), and UVA/UVB rate were assessed by spectral transmittance (Labsphere® UV-2000S Ultraviolet Transmittance Analyzer, Sao Paulo, Brazil) at 250–450 nm, and the instrument bandpass was approximately 1 nm [36].

2.7. In Vitro Antioxidant Activity Analysis

For in vitro antioxidant activity, free radicals 1,1-diphenyl-2-picrylhydrazyl (DPPH) and 2,2’-azino-bis(3-ethylbenzilthiazoline-6-sulfonic acid) (ABTS) were used. For the DPPH and ABTS methods, different extract concentrations (75, 125, 200, 400, 500, 750, and 1000 μg·mL−1) were used, mixed with an appropriate radical amount and kept in the dark during reaction time [37]. Both assays were performed using quercetin in different concentrations (0.25, 0.5, 1.0, 1.75, 2.5, and 5.0 μg·mL−1) as standard, and all assays were performed in triplicate.
Antioxidant evaluation by Oxygen Radical Absorbance Capacity (ORAC) was also determined using fluorescein as the fluorescent molecule and 2,2′-azo-bis(2-amidino propane) dihydrocloreto (AAPH) radical as the oxidant agent. Plates were read in a microplate fluorometer reader (Fluorolog-3 FL3-122, Horiba Jobin Yvon, EUA), and TroloxTM (Sigma-Aldrich—93.0% of purity) was used as standard antioxidant [38,39]. IC50 values were calculated using linear regression by Origin software.

2.8. Statistical Analysis

All assays were performed in triplicate. Statistical analysis was performed using an ANOVA test (p < 0.05) for independent variables, Origin version 8 and Graph Pad Prism (version 5.02) software for Windows (GraphPad Software, San Diego, CA, USA).

3. Results and Discussion

After collecting plant material, plants were dried, milled, and presented physical chemical parameters according to Table 1. All samples presented acceptable plant material parameters [28], ensuring quality.
Dry extracts obtained from plants were subjected to identification reaction assays following the guidelines of the Brazilian Pharmacopoeia [28]. All extracts showed rose color in Shinoda and Pew reactions and yellow fluorescence in Taubock reaction. They also exhibited fluorescence under UV light and brown color when subjected to aluminum and ferric chloride, respectively, highlighting the presence of flavonoids in the extracts [40].
The HPLC method was validated for the quantification of flavonoids, for which the parameters of specificity/selectivity, linearity, precision, sensitivity (detection limit and quantification limit), accuracy, and robustness were determined.
The linearity assay was determined for rutin (y = 19862x + 26548; R2 = 0.9997; Figure S1) and quercetin (y = 35758x − 58195; R2 = 0.9996; Figure S2) analytical curves. For the precision test, the area of the peaks obtained by HPLC of quercetin and rutin standards and these flavonoids in the mixed sample are displayed in Table 2 (intra-day and inter-day assay). Variation coefficients less than 5.0% were obtained, showing the precision of the method [30].
During precision assay, robustness of the method was determined by changing the analyzer. Since a variation coefficient less than 5% was obtained, the quantification method was considered robust.
A recovery assay was performed to determine the accuracy of the method [30]. The percentage of quercetin and rutin recovered (R%) was calculated and results demonstrate the accuracy of the method, as the mean recovery rate was close to 100.0% and variation coefficient less than 5.0% (Table 3). Detection and quantification limits (DL and QL) were calculated from Equations (2) and (3), achieving the following values: DL = 0.86 ± 0.91 μg·mL−1 (quercetin) and 9.02 ± 1.12 μg·mL−1 (rutin); QL = 2.88 ± 0.92 μg·mL−1 (quercetin) and 30.09 ± 1.01 μg·mL−1 (rutin). To determined selectivity of the method, the extracts’ chromatograms were compared to standard chromatograms [30,41]. The extracts and mixed sample did not exhibit impurities or other compounds capable to interfere in identification of quercetin and rutin peaks.
Using the validated method, quercetin and rutin content in each extract was determined. Flavonoid retention times of samples were similar to standards, i.e., 3.6 min to rutin (Figure S3) and 5.1 min to quercetin (Figure S4). The presence of flavonoids in the extracts and in the mixed sample are shown in Figure 1, Figure 2, Figure 3, Figure 4 and Figure 5.
The results show that G. biloba L. extract presented higher quercetin (47.21 ± 1.1 μg·mL−1) and rutin (406.84 ± 0.8 μg·mL−1) concentrations than D. mollis Benth (quercetin = 2.88 ± 0.9 μg·mL−1; rutin = 108.17 ± 1.2 μg·mL−1), R. graveolens L. (quercetin = 11.27 ± 0.7 μg·mL−1; rutin = 94.68 ± 1.1 μg·mL−1), and V. vinifera L. (quercetin = 2.88 ± 0.9 μg·mL−1; rutin = 30.09 ± 1.0 μg·mL−1). These results are in line with reports from the literature [42,43]. Besides, the mixed sample showed a high concentration of rutin (314.95 ± 0.9 μg·mL−1) against the concentration of quercetin of 7.42 ± 0.9 μg·mL−1.
According to Stokes et al. [32], the evaluation of neutral red uptake is directly proportional to living cell number [33]. In our study, in all tested concentration, the extracts and the mixed sample reduced HaCat cell viability to less than 50% (Figure 6). Thus, the concentration required to reduce by 50% the cell viability (IC50) was higher than 200 μg·mL−1. We did not test higher concentrations of the selected extracts to avoid the production of artefacts in culture medium, as already described for many phenolic compounds [27].
Spectrophotometry in the ultraviolet region is an adjuvant and preliminary in vitro method to evaluate sun protection factor of compounds, especially from vegetal sources [34,44,45]. Thus, the four extracts (100 μg·mL−1) and mixed sample were subjected to spectrophotometric analysis. D. mollis Benth presented an SPF value of 5.04 ± 0.2, G. biloba L. of 8.31 ± 0.5, R. graveolens L. of 7.08 ± 0.4, V. vinifera L. of 3.71 ± 0.5, and the mixed sample (1:1:1:1) of 7.72 ± 0.4.
As determined by cell viability assay, both SPF assays were performed in concentration up to 200 μg·mL−1 that was determined as the highest non-cytotoxic concentration tested in our work. These preliminary results show that G. biloba and R. graveolens extracts were the most promising extracts, besides the mixed sample. To confirm the SPF results, all samples were then evaluated using spectral transmittance [46,47]. All individual extracts, the mixed sample, and the positive control (Tinosorb STM) presented absorption in UVA and UVB regions (Table 4) in different ways. While D. mollis and G. biloba extracts absorbed in the 320–400 nm range, corresponding to UVA radiation, R. graveolens and V. vinifera extracts absorbed around 310 nm, corresponding to UVB radiation. Moreover, the mixed sample and Tinosorb STM absorbed in a higher range, configuring protection in UVA and UVB regions [6]. G. biloba L. extract, followed by the mixed sample, presented the highest SPF values (Table 4), attributed to the higher flavonoid concentration. Moreover, D. mollis Benth and V. vinifera L. extracts that showed the lowest quercetin concentration presented low values, corroborating literature data [48].
In addition, according to the literature [16,49,50], the SPF values found in the extracts studied in our work were lower than chemical sun filters, such as Tinosorb STM.
The colorimetric evaluation shows that all individual extracts have flavonoids and they can therefore be considered a promising plant sources to be used as sunscreen.
Antioxidant activity of phenolic compounds such as flavonoids is widely known, and thus, flavonoids are widely studied as ingredients in cosmetic formulations against early skin aging by scavenging reactive oxygen species produced by sun radiation [4,22,51].
All of the four extracts, together with the mixed sample, were subjected to in vitro antioxidant assays. From the DPPH and ABTS experiments, the results were expressed as the sample concentration required for 50% reduction of the radical concentration, while on ORAC protocol, the ability of scavenger peroxyl radicals was expressed as the equivalent concentration of Trolox [39]. Then, IC50 values were calculated, and once again, the best results were seen for G. biloba L. extract and the mixed sample (Table 5), and this can be attributed to the higher flavonoid concentration in these samples.
Based on these results, the extracts and the mixed sample presented antioxidant activity against DPPH, ABTS, and AAPH radicals, which is indicative of premature aging protection. Then, considering the samples’ potential as sunscreens, all extracts and mixed samples can be incorporated into a cosmetic formulation, aiming to develop a new sunscreen containing chemical sun filter from plant material.

4. Conclusions

This work is the first study about the sun protection action of Dimorphandra mollis Benth and Ruta graveolens L. All flavonoid-enriched extracts were not cytotoxic, and presented antioxidant activity and sun protection factor, as shown by in vitro methods. The mixed sample composed by the four studied plants presented promising results. The quantification method exhibited linearity, precision, accuracy, robustness, and did not exhibit impurities or other compounds capable of interfering in the identification peak of flavonoids. The mixed sample may be an alternative to treat deleterious effects from exposure to ultraviolet radiation and a promise as a potential sunscreen.

Supplementary Materials

The following are available online at https://0-www-mdpi-com.brum.beds.ac.uk/2223-7747/8/11/453/s1: Figure S1. Rutin analytical curve; Figure S2. Quercetin analytical curve; Figure S3. Chromatogram of rutin analytical standard; Figure S4. Chromatogram of quercetin analytical standard.

Author Contributions

L.C.C., J.A.A., A.R.F., I.M.O.S., M.C.F., and A.L.T.G.R. contributed to the conceptualization, methodology, validation, formal analysis, and investigation. L.C.C. and J.A.A. contributed to the writing—original draft preparation. E.S.L., M.A.F., P.G.M., and E.B.S. contributed to the supervision, writing—review and editing, project administration, resources, and funding acquisition. All authors made a substantial contribution to the work.

Funding

This research was funded by FAPESP (grant numbers 2015/25533-7 and 2017/14757-7), CAPES and CNPq. The authors also received support from the Portuguese Science and Technology Foundation (FCT/MCT) and from European Funds (PRODER/COMPETE) under the project reference M-ERA-NET/0004/2015-PAIRED, co-financed by FEDER, under the Partnership Agreement PT2020, and PhD scholarship (SFRH/BD/130555/2017).

Conflicts of Interest

The authors declare no conflicts of interest.

References

  1. Lindqvist, P.G.; Epstein, E.; Nielsen, K.; Landin-Olsson, M.; Ingvar, C.; Olsson, H. Avoidance of sun exposure as a risk factor for major causes of death: A competing risk analysis of the Melanoma in Southern Sweden cohort. J. Intern. Med. 2016, 280, 375–387. [Google Scholar] [CrossRef] [PubMed]
  2. Peres, D.A.; De Oliveira, C.A.; Da Costa, M.S.; Tokunaga, V.K.; Mota, J.P.; Rosado, C.; Consiglieri, V.O.; Kaneko, T.M.; Velasco, M.V.R.; Baby, A.R. Rutin increases critical wavelength of systems containing a single UV filter and with good skin compatibility. Ski. Res. Technol. 2016, 22, 325–333. [Google Scholar] [CrossRef] [PubMed]
  3. Rojas, J.; Londoño, C.; Ciro, Y. The health benefits of natural skin UVA photoprotective compounds found in botanical sources. Int. J. Pharm. Pharm. Sci. 2016, 8, 13–23. [Google Scholar]
  4. Giacomoni, P.U. Understanding reactive oxygen species. Cosmet. Toilet. 2008, 122, 5. [Google Scholar]
  5. Balogh, T.S.; Velasco, M.V.R.; Pedriali, C.A.; Kaneko, T.M.; Baby, A.R. Ultraviolet radiation protection: Current available resources in photoprotection. An. Bras. Dermatol. 2011, 86, 732–742. [Google Scholar] [CrossRef] [PubMed]
  6. Palm, M.D.; O’Donoghue, M.N. Update on photoprotection. Dermatol. Ther. 2007, 20, 360–376. [Google Scholar] [CrossRef]
  7. WHO. Fact. Sheet No. 261: Protecting Children from Ultraviolet Radiation; World Health Organization: Geneva, Switzerland, 2001. [Google Scholar]
  8. INCA. Estimativa 2016: Incidência de Câncer no Brasil; Instituo Nacional do Câncer: Rio de Janeiro, Brazil, 2016. [Google Scholar]
  9. Romanhole, R.C.; Ataide, J.A.; Cefali, L.C.; Moriel, P.; Mazzola, P.G. Photostability study of commercial sunscreens submitted to artificial UV irradiation and/or fluorescent radiation. J. Photochem. Photobiol. B Biol. 2016, 162, 45–49. [Google Scholar] [CrossRef]
  10. Sambandan, D.R.; Ratner, D. Sunscreens: An. Overview and Update. J. Am. Acad. Dermatol. 2011, 64, 748–758. [Google Scholar] [CrossRef]
  11. Skotarczak, K.; Osmola-Mankowska, A.; Lodyga, M.; Polanska, A.; Mazur, M.; Adamski, Z. Photoprotection: Facts and controversies. Eur. Rev. Med. Pharmacol. Sci. 2015, 19, 98–112. [Google Scholar]
  12. Wong, T.; Orton, D. Sunscreen allergy and its investigation. Clin. Dermatol. 2011, 29, 306–310. [Google Scholar] [CrossRef]
  13. Amar, S.K.; Goyal, S.; Dubey, D.; Srivastav, A.K.; Chopra, D.; Singh, J.; Shankar, J.; Chaturvedi, R.K.; Ray, R.S. Benzophenone 1 induced photogenotoxicity and apoptosis via release of cytochrome c and Smac/DIABLO at environmental UV radiation. Toxicol. Lett. 2015, 239, 182–193. [Google Scholar] [CrossRef] [PubMed]
  14. Ramos, S.; Homem, V.; Alves, A.; Santos, L. A review of organic UV-filters in wastewater treatment plants. Environ. Int. 2016, 86, 24–44. [Google Scholar] [CrossRef] [PubMed]
  15. Cefali, L.C.; Ataide, J.A.; Moriel, P.; Foglio, M.A.; Mazzola, P.G. Plant.-based active photoprotectants for sunscreens. Int. J. Cosmet. Sci. 2016, 38, 346–353. [Google Scholar] [CrossRef] [PubMed]
  16. Korać, R.R.; Khambholja, K.M. Potential of herbs in skin protection from ultraviolet radiation. Pharmacogn. Rev. 2011, 5, 164–173. [Google Scholar] [CrossRef] [PubMed]
  17. Tohge, T.; de Souza, L.; Fernie, A.R. Current understanding of the pathways of flavonoid biosynthesis in model and crop plants. J. Exp. Bot. 2017, 68, 4013–4028. [Google Scholar] [CrossRef]
  18. Abbas, S.; Saleem, H.; Gill, M.S.A.; Bajwa, A.M.; Sarwar, A.; Omer, M.O. Physiochemical, phytochemical, and nutritional values determination of Suaeda fruiticosa (Chenopodiaceae). Acad. J. Med. Plants 2016, 4, 001–009. [Google Scholar]
  19. Durazzo, A.; Lucarini, M.; Souto, E.B.; Cicala, C.; Caiazzo, E.; Izzo, A.A.; Novellino, E.; Santini, A. Polyphenols: A concise overview on the chemistry, occurrence, and human health. Phytother. Res. 2019, 33, 2221–2243. [Google Scholar] [CrossRef] [Green Version]
  20. Pimentel-Moral, S.; Teixeira, M.C.; Fernandes, A.R.; Arráez-Román, D.; Martínez-Férez, A.; Segura-Carretero, A.; Souto, E.B. Lipid nanocarriers for the loading of polyphenols-A comprehensive review. Adv. Colloid Interface Sci. 2018, 260, 85–94. [Google Scholar] [CrossRef]
  21. Salehi, B.; Venditti, A.; Sharifi-Rad, M.; Kręgiel, D.; Sharifi-Rad, J.; Durazzo, A.; Lucarini, M.; Santini, A.; Souto, E.B.; Novellino, E.; et al. The Therapeutic Potential of Apigenin. Int. J. Mol. Sci. 2019, 20, 1305. [Google Scholar] [CrossRef]
  22. Cefali, L.C.; Ataide, J.A.; Fernandes, A.R.; Sousa, I.M.O.; Goncalves, F.; Eberlin, S.; Davila, J.L.; Jozala, A.F.; Chaud, M.V.; Sanchez-Lopez, E.; et al. Flavonoid-Enriched Plant-Extract-Loaded Emulsion: A Novel Phytocosmetic Sunscreen Formulation with Antioxidant Properties. Antioxidants 2019, 8, 443. [Google Scholar] [CrossRef]
  23. Cefali, L.C.; Ataide, J.A.; Eberlin, S.; da Silva Gonçalves, F.C.; Fernandes, A.R.; Marto, J.; Ribeiro, H.M.; Foglio, M.A.; Mazzola, P.G.; Souto, E.B. In vitro SPF and Photostability Assays of Emulsion Containing Nanoparticles with Vegetable Extracts Rich in Flavonoids. Aaps Pharmscitech 2018, 20, 9. [Google Scholar] [CrossRef] [PubMed]
  24. Xia, Q.; Saupe, A.; Müller, R.H.; Souto, E.B. Nanostructured lipid carriers as novel carrier for sunscreen formulations. Int. J. Cosmet. Sci. 2007, 29, 473–482. [Google Scholar] [CrossRef] [PubMed]
  25. Souto, E.B.; Anselmi, C.; Centini, M.; Müller, R.H. Preparation and characterization of n-dodecyl-ferulate-loaded solid lipid nanoparticles (SLN). Int. J. Pharm. 2005, 295, 261–268. [Google Scholar] [CrossRef] [PubMed]
  26. Hubinger, S.Z.; Cefali, L.C.; Vellosa, J.C.; Salgado, H.R.N.; Isaac, V.L.B.; Moreira, R.R.D. Dimorphandra mollis: An. alternative as a source of flavonoids with antioxidant action. Lat. Am. J. Pharm. 2010, 29, 271–274. [Google Scholar]
  27. Halliwell, B. The antioxidant paradox. Lancet 2000, 355, 1179–1180. [Google Scholar] [CrossRef]
  28. Anvisa. Farmacopeia Brasileira; Agência Nacional de Vigilância Sanitária: Brasília, Brazil, 2010. [Google Scholar]
  29. Seal, T. Quantitative HPLC analysis of phenolic acids, flavonoids and ascorbic acid in four different solvent extracts of two wild edible leaves, Sonchus arvensis and Oenanthe linearis of North-Eastern region in India. J. Appl. Pharm. Sci. 2016, 6, 157–166. [Google Scholar] [CrossRef] [Green Version]
  30. Agência Nacional de Vigilância Sanitária. Guia Para Validação de Métodos Analíticos e Bioanalíticos Conforme o Anexo Desta Resolução; Anvisa: Brasília, Brazil, 2003. [Google Scholar]
  31. ANVISA. Consolidado de normas da COFID. In Versão IV; COFID, GGMED, ANVISA, Eds.; Agência Nacional de Vigilância Sanitária: Brasília, Brazil, 2014. [Google Scholar]
  32. Stokes, W.S.; Casati, S.; Strickland, J.; Paris, M. Neutral red uptake cytotoxicity tests for estimating starting doses for acute oral toxicity tests. Curr. Protoc. Toxicol. 2008, 36, 20–24. [Google Scholar]
  33. OECD. . Guidance document on using cytotoxicity tests to estimate starting doses for acute oral systemic toxicity tests. In OECD Series on Testing and Assessment; OECD: Paris, France, 2010. [Google Scholar]
  34. Mansur, J.d.S.; Breder, M.N.R.; Mansur, M.C.d.A. Determinação do fator de proteção solar por espectrofotometria. An. Bras. Dermatol. 1986, 61, 121–124. [Google Scholar]
  35. Sayre, R.M.; Agin, P.P.; LeVee, G.J.; Marlowe, E. A comparison of in vivo and in vitro testing of sunscreening formulas. Photochem. Photobiol. 1979, 29, 559–566. [Google Scholar] [CrossRef]
  36. Velasco, M.V.; Balogh, T.S.; Pedriali, C.A.; Sarruf, F.D.; Pinto, C.A.S.O.; Kaneko, T.M.; Baby, A.R. Associação da rutina com p-metoxicinamato de octila e benzofenona-3, Avaliação in vitro da eficácia fotoprotetora por espectrofotometria de refletância. Lat. Am. J. Pharm. 2008, 27, 23–27. [Google Scholar]
  37. Rufino, M.D.S.M.; Alves, R.E.; de Brito, E.S.; de Morais, S.M.; Sampaio, C.D.G.; Pérez-Jimenez, J.; Saura-Calixto, F.D. Metodologia Científica: Determinação da Atividade Antioxidante Total em Frutas Pela Captura Do Radical Livre DPPH; Embrapa Agroindústria Tropical: Fortaleza, Brazil, 2007; p. 4. [Google Scholar]
  38. Huang, D.; Ou, B.; Prior, R.L. The Chemistry behind Antioxidant Capacity Assays. J. Agric. Food Chem. 2005, 53, 1841–1856. [Google Scholar] [CrossRef] [PubMed]
  39. Ou, B.; Hampsch-Woodill, M.; Prior, R.L. Development and Validation of an Improved Oxygen Radical Absorbance Capacity Assay Using Fluorescein as the Fluorescent Probe. J. Agric. Food Chem. 2001, 49, 4619–4626. [Google Scholar] [CrossRef] [PubMed]
  40. Souza, T.M.; Rangel, V.L.B.I.; Pietro, R.C.L.R.; Santos, L.E.; Moreira, R.R.D. Phytochemical screening of Achillea millefolium harvested at Araraquara – SP. Rev. Bras. Pl. Med. 2006, 8, 151–154. [Google Scholar]
  41. Cazedey, E.C.L.; Salgado, H.R.N. Development and validation of UV spectrophotometric method for orbifloxacin assay and dissolution studies. Braz. J. Pharm. Sci. 2014, 50, 457–465. [Google Scholar] [CrossRef] [Green Version]
  42. Belo, S.E.D.; Gaspar, L.R.; Campos, P.M.B.G.M. Photoprotective Effects of Topical Formulations Containing a Combination of Ginkgo biloba and Green Tea Extracts. Phytother. Res. 2011, 25, 1854–1860. [Google Scholar] [CrossRef]
  43. Pastrana-Bonilla, E.; Akoh, C.C.; Sellappan, S.; Krewer, G. Phenolic Content and Antioxidant Capacity of Muscadine Grapes. J. Agric. Food Chem. 2003, 51, 5497–5503. [Google Scholar] [CrossRef]
  44. Gegotek, A.; Jastrzab, A.; Jarocka-Karpowicz, I.; Muszynska, M.; Skrzydlewska, E. The Effect of Sea Buckthorn (Hippophae rhamnoides L.) Seed Oil on UV-Induced Changes in Lipid Metabolism of Human Skin Cells. Antioxidants 2018, 7, 110. [Google Scholar] [CrossRef]
  45. Violante, I.M.P.; Souza, I.M.; Venturini, C.L.; Ramalho, A.D.F.S.; Santos, R.A.N.; Ferrari, M. Estudo preliminar da atividade fotoprotetora in vitro de extratos vegetais do cerrado de Mato Grosso. Rev. Bras. Farm. 2008, 89, 175–179. [Google Scholar]
  46. Springsteen, A.; Yurek, R.; Frazier, M.; Carr, K.F. In vitro measurement of sun protection factor of sunscreens by diffuse transmittance1This paper is dedicated to the memory of our colleague and friend, Mona Yurek (1959–1998), who was involved in the quantitation and methodology of the sample preparation along with most of our in vitro sunscreen measurements.1. Anal. Chim. Acta 1999, 380, 155–164. [Google Scholar]
  47. Velasco, M.V.R.; Balogh, T.S.; Pedriali, C.A.; Sarruf, F.D.; Pinto, C.A.S.D.; Kaneko, T.; Baby, A.R. Novas metodologias analíticas para avaliação da eficácia fotoprotetora (in vitro)–revisão. Rev. Ciências Farm. Básica E Appl. 2011, 32, 27–34. [Google Scholar]
  48. Choquenet, B.; Couteau, C.; Paparis, E.; Coiffard, L.J. Quercetin and rutin as potential sunscreen agents: Determination of efficacy by an in vitro method. J. Nat. Prod. 2008, 71, 1117–1118. [Google Scholar] [CrossRef] [PubMed]
  49. Chiari, B.G.; Trovatti, E.; Pecoraro, É.; Corrêa, M.A.; Cicarelli, R.M.B.; Ribeiro, S.J.L.; Isaac, V.L.B. Synergistic effect of green coffee oil and synthetic sunscreen for health care application. Ind. Crops Prod. 2014, 52, 389–393. [Google Scholar] [CrossRef]
  50. Ebrahimzadeh, A.; Gharaei, A.; Khadije, S. Allelic Diversity of Polymorphic AMA-1 (Apical Membrane Antigen 1) Vaccine Candidate Antigen of Plasmodium falciparum in Two Population of Imported and Indigenous Cases in South.-East. of Iran. using Nested-PCR. J. Trop. Dis. Public Health 2014, 2, 5. [Google Scholar]
  51. Wen, L.; Zhao, Y.; Jiang, Y.; Yu, L.; Zeng, X.; Yang, J.; Tian, M.; Liu, H.; Yang, B. Identification of a flavonoid C-glycoside as potent antioxidant. Free Radic. Biol. Med. 2017, 110, 92–101. [Google Scholar] [CrossRef] [PubMed]
Figure 1. Chromatogram of D. mollis Benth extract by HPLC assay.
Plants 08 00453 g001
Figure 2. Chromatogram of G. biloba extract by HPLC assay.
Plants 08 00453 g002
Figure 3. Chromatogram of R. graveolens by HPLC assay.
Plants 08 00453 g003
Figure 4. Chromatogram of V. vinifera exract by HPLC assay.
Plants 08 00453 g004
Figure 5. Chromatogram of the mixed sample (1:1:1:1) by HPLC assay.
Plants 08 00453 g005
Figure 6. Cell viability curves of samples (Dimorphandra mollis Benth, Ginkgo biloba L., Ruta graveolens L., Vitis vinífera L. and mixed (1:1:1:1)) in different concentrations (200.0, 125.0, 62.5, 31.25, 15.62, 7.5, and 2.5 μg·mL−1) after 48 h of HaCat cell line exposition by the NRU method.
Plants 08 00453 g006
Table 1. Physical–chemical parameters of D. mollis Benth (dry favas), G. biloba L. (dry extract), R. graveolens L. (dry leaves), and V. vinífera L. (dry peels). Values are presented as an average of three measurements and standard deviation (±SD).
SpeciesGranulometry (mm)Density (g·mL−1)pHDry Loss (%)Total Ash (%)Total Insoluble Ash (%)
D. mollis Benth1.40 ± 1.10.27 ± 0.35.01 ± 0.82.51 ± 1.26.98 ± 1.31.55 ± 1.1
G. biloba L.0.35 ± 1.00.58 ± 0.24.86 ± 1.14.60 ± 1.45.78 ± 1.31.76 ± 1.1
R. graveolens L. 0.60 ± 1.20.91 ± 0.25.90 ± 1.14.44 ± 1.16.76 ± 1.21.54 ± 0.9
V. vinifera L. 0.60 ± 0.90.45 ± 0.23.96 ± 1.14.83 ± 1.16.92 ± 1.41.35 ± 1.0
Table 2. Intra-day and inter-day precision values for analytical flavonoids standard (quercetin and rutin) and in mixed samples [mix (quercetin) and mix (rutin)]. Values are presented as an average of three measurements and standard deviation (±SD).
SamplePeak Area Total Variation Coefficient (%)
Inter-dayIntra-day
Quercetin468.63 ± 0.1469.81 ± 0.10.28 ± 0.0
Rutin269.65 ± 0.1270.30 ± 0.10.89 ± 0.1
Mix (quercetin)600,236.80 ± 0.1602,254.30 ± 0.01.78 ± 0.0
Mix (rutin)4,491,918.70 ± 0.04,573,531.81 ± 0.11.62 ± 0.1
Table 3. Recovery assay values referents to quercetin and rutin concentration in extracts. Values are presented as an average of three measurements and standard deviation (± SD).
ExtractsSamplesStandard vol.(Cr) (mL)Final Coef. of Quercetin (Cf)Final Coef. of Rutin (Cf)% quer. rec. (Rq%)% rutin rec. (Rr%)Var. Coef. Rq.%Var. Coef. Rr.%
D. mollis BenthR10.755.44 ± 0.285.39 ± 0.1102.05 ± 0.1110.22 ± 0.10.30 ± 0.23.64 ± 0.2
R21.259.91 ± 0.1140.88 ± 0.1102.58 ± 0.1104.73 ± 0,1
R31.7514.88 ± 0.1192.83 ± 0.1102.61 ± 0.1102.78 ± 0.2
G. biloba L.R10.7510.72 ± 0.2139.22 ± 0.2102.82 ± 0.1106.53 ± 0.11.79 ± 0.11.13 ± 0.2
R21.2515.43 ± 0.2204.00 ± 0.1103.10 ± 0.2109.10 ± 0.1
R31.7518.55 ± 0.1257.10 ± 0.1104.98 ± 0.2110.34 ± 0.1
R. graveolens L.R10.756.01 ± 0.191.01 ± 0.1102.44 ± 0.1103.29 ± 0.12.79 ± 0.11.02 ± 0.2
R21.2510.45 ± 0.1146.39 ± 0.1103.00 ± 0.2108.22 ± 0.2
R31.7513.97 ± 0.1196.82 ± 0.2104.48 ± 0.1108.65 ± 0.1
V. vinifera L.R10.756.21 ± 0.281.69 ± 0.2101.46 ± 0.2106.02 ± 0.22.14 ± 0.20.41 ± 0.2
R21.2510.47 ± 0.2139.92 ± 0.1102.19 ± 0.2102.20 ± 0.2
R31.7516.21 ± 0.2177.16 ± 0.1101.45 ± 0.2102.16 ± 0.2
MixedR10.757.89 ± 0.1102.03 ± 0.1100.52 ± 0.1112.33 ± 0.13.55 ± 0.10.65 ± 0.1
R21.2511.59 ± 0.1169.60 ± 0.2101.82 ± 0.1105.23 ± 0.1
R31.7516.99 ± 0.1220.31 ± 0.1101.43 ± 0.1106.25 ± 0.2
Table 4. In vitro sun protection factor values of extracts by spectral transmittance.
Extracts (200 μg·mL−1)Critical Wavelength (nm)UVA *UVB *SPFUVA/UVB Rate
D. mollis Benth398.0 ± 0.1× 4.96 ± 0.20.9 ± 0.0
G. biloba L.388.1 ± 0.0× 7.06 ± 0.20.9 ± 0.0
R. graveolens L.309.0 ± 0.2 ×5.34 ± 0.10.9 ± 0.0
V. vinífera L.318.0 ± 0.1 ×3.17 ± 0.20.9 ± 0.0
Mixed sample372.7 ± 0.1××6.92 ± 0.10.8 ± 0.0
Tinosorb STM369.1 ± 0.1××21.01 ± 0.20.7 ± 0.0
* UVA range equal to 320–400 nm and UVB equal to 280–315 nm.
Table 5. In vitro antioxidant evaluation against DPPH, ABTS, and AAPH free radicals of some potential sunscreen natural products. Values are presented as an average of three measurements and standard deviation (±SD).
ExtractsIC50—DPPH (μg·mL−1)IC50—ABTS (μg·mL−1)IC50—AAPH (μg·mL−1)
D. mollis Benth174.51 ± 1.1 596.73 ± 1.6 15.43 ± 1.2
G. biloba L.8.12 ± 0.8 109.09 ± 1.0 25.55 ± 0.4
R. graveolens L.281.02 ± 1.0 587.98 ± 0.8 17.87 ± 0.3
V. vinífera L. 296.90 ± 1.2643.13 ± 0.9 16.08 ± 1.3
Mixed sample28.73 ± 0.7 325.08 ± 0.8 23.79 ± 0.1
Quercetin1.75 ± 0.42.00 ± 1.20.97 ± 0.9

