Identification, Evolution, and Expression Profiling of Histone Lysine Methylation Moderators in Brassica rapa


1
State Key Laboratory of Crop Genetics & Germplasm Enhancement, Key Laboratory of Biology and Genetic Improvement of Horticultural Crops (East China), Ministry of Agriculture and Rural Affairs of the China, Engineering Research Center of Germplasm Enhancement and Utilization of Horticultural Crops, Ministry of Education of the China, Nanjing 210095, China
2
Ottawa Research and Development Center, Agriculture and Agri-Food Canada, 960 Carling Avenue, Ottawa, ON K1A 0C6, Canada
3
Department of Biology, University of Ottawa, 30 Marie Curie, Ottawa, ON K1N 6N5, Canada
*
Author to whom correspondence should be addressed.
Plants 2019, 8(12), 526; https://0-doi-org.brum.beds.ac.uk/10.3390/plants8120526
Submission received: 2 October 2019
/
Revised: 13 November 2019
/
Accepted: 18 November 2019
/
Published: 20 November 2019
(This article belongs to the Special Issue DNA Methylation in Plants)
Abstract
:Histone modifications, such as methylation and demethylation, are vital for regulating chromatin structure, thus affecting its expression patterns. The objective of this study is to understand the phylogenetic relationships, genomic organization, diversification of motif modules, gene duplications, co-regulatory network analysis, and expression dynamics of histone lysine methyltransferases and histone demethylase in Brassica rapa. We identified 60 SET (HKMTases), 53 JmjC, and 4 LSD (HDMases) genes in B. rapa. The domain composition analysis subcategorized them into seven and nine subgroups, respectively. Duplication analysis for paralogous pairs of SET and JmjC (eight and nine pairs, respectively) exhibited variation. Interestingly, three pairs of SET exhibited Ka/Ks > 1.00 values, signifying positive selection, whereas the remaining underwent purifying selection with values less than 1.00. Furthermore, RT-PCR validation analysis and RNA-sequence data acquired on six different tissues (i.e., leaf, stem, callus, silique, flower, and root) revealed dynamic expression patterns. This comprehensive study on the abundance, classification, co-regulatory network analysis, gene duplication, and responses to heat and cold stress of SET and JmjC provides insights into the structure and diversification of these family members in B. rapa. This study will be helpful to reveal functions of these putative SET and JmjC genes in B. rapa.
1. Introduction
The role of histone methylation in transcription regulation was first reported in the 1960s [1]. It was not until 15 years later that a catalytic SET domain (Su(var)3–9, enhancer of zeste and trithorax) the first histone methyltransferase (SUV39H1), was identified [2]. This discovery led to a number of SET-domain homologous searches [3]. The subsequent discoveries of the key regulatory domain of demethylase enzymes [4], JmjC (Jumonji C), substantially expanded the repository of histone demethylases. Histone methylation and demethylation play fundamental roles in various biological processes, specifically in regulating transcription, genome integrity, and epigenetic inheritance [5,6]. Histone modification is a complex process occurring on various residues (lysine and arginine) and at different sites with the addition of a varying number of methyl groups. Mass spectroscopy and liquid chromatography were used to identify the histone modification profile in Arabidopsis thaliana, which revealed both conserved and non-conserved modifications compared to animals [7,8]. Active or repressive transcription is conferred liable on the positions and methylation states, unlike other histone modifications, in which active or repressed chromatin states are specified [9]. More often, methylation is considered as active transcription (such as in H3K4, H3K36, and H3K79), although some methylation processes are assumed to be connected with silenced chromatin states like H3K9, H3K27, and H4K20 [9]. Thus, post-transcriptional histone modifications play a pivotal role in activating and silencing genes of various important biological processes in eukaryotes [10].
Histone lysine methyltransferase (HKMTases) contains the SET domain while histone demethylase (HDMases) is comprised of two major domains namely JmjC and LSD (lysine-specific demethylase domains) [11]. There are seven classes in A. thaliana based on amino acid sequence features and domain compositions of SET [12,13]. These SET domain protein members play a pivotal role in chromatin regulation, structure, and function [14,15]. In Arabidopsis SU(VAR)3-9 members have H3K9 methyltransferase activity that plays a vital role in heterochromatin formation and gene silencing [16,17,18]. While SET proteins catalyze H3K27 trimethylation and are largely known in the repressive control of gene expression [19]. Similarly, JmjC proteins also play crucial roles in regulating epigenetic processes during growth and development [20] and many members of JmjC have been characterized in different species. The LSD domain, on the other hand, has small members, present only in four genes in A. thaliana.
Some of the recent studies highlighted the response of methylation in response to cold and heat stress. In Arabidopsis on the cold-responsive genes such as COR15A, and AtGolS3, decreased gradually in both a histone occupancy-dependent and independent manner during cold stress treatment [21]. In maize, histone acetylation in cold-responsive genes including ZmDREB1 and ZmCOR413 increased [22]. Similarly, in rice the OsDREB1b genes was induced by cold stress [23]. The global methylation in response to heat varies between species. The exposure of Arabidopsis to heat stress results in an increased global methylation and higher homologous recombination frequency [24]. In Arabidopsis, the upregulation of DRM2, nuclear RNA polymerase D 1(NRPD1) and NRPE1 in response to heat stress may contribute to increased genome methylation [25]. An increase in global methylation is also observed in Cork oak (Quercus suber L.) grown in higher temperatures [26]. In Brassica napus, the DNA methylation levels increase more in the heat-sensitive genotype compared to heat-tolerant genotype under heat treatment [27]. Thus, epigenetic changes induced by cold stress and heat are likely to contribute to the cold stress tolerance through changes in the expression profiling of genes.
The research detailed above emphasizes the need to further explore the importance of histone methylation and its complex nature. In addition, the evolutionary implications and functional dissection of these family members in B. rapa will enhance understanding of their functions and regulatory mechanisms. Most angiosperms have undergone polyploidization during their long evolutionary history [28]. In parallel with the polyploidization, as a result of whole genome duplication (WGD) events in the angiosperm genome, the two large gene families (HKMTases and HDMases) experienced development and functional diversity. Moreover, maintenance of genes at high numbers as a network or as a dose-sensitive response proves the gene dosage hypothesis [29]. Chinese cabbage (B. rapa) is an excellent model plant for genome evolution study due to the availability of its sequenced and assembled genome [30]. B. rapa also underwent two duplication (WGD α and β) and one whole-genome triplication events (WGT γ) in the Brassicaceae lineage [31]. The WGT led to widespread fractionation in the B. rapa genome, thus providing an opportunity to understand the molecular evolution of SET and JmjC genes in B. rapa. Its extensive data is also closely related to A. thaliana, estimating that about 93% of the predicted gene families of B. rapa appeared in A. thaliana and making it a vital model for evolutionary and genomic studies [32].
To date, 198, 136, 124, and 71 genes coding for histone methylation proteins have been identified using bioinformatics surveys in apple, sweet orange, tomato, and strawberry, respectively [33,34,35,36]. Previously, 67 and 49 genes from B. rapa were identified as SET candidates [37,38], however, important features such as the role of abiotic stress, and tissue expression patterns and correlation analysis along with the evolutionary analysis of paralogous pairs were not explored. In this work, the genes of HKMTases and HDMases from various clades are denoted as BraSET, BraJmjC, and BraLSD. A systematic and comprehensive description of the histone lysine modifiers in B. rapa was carried out through a comparative genome analysis to investigate copy variation, gene retention, syntenic region, collinear correlation, and expansion patterns following the WGT event. Furthermore, phylogenetic relationships, promoter sequence analysis, divergent tissue-specific expression patterns across six various tissues, co-regulatory network analysis, and the response of these genes to heat and cold stress will allow further understanding of functional analysis of SET and JmjC genes in B. rapa.
2. Results
2.1. Identification of (SET, JmjC, LSD) and Their Classification Patterns in Brassica rapa
In this study, we identified 60 BraSET, 53 BraJmjC, and 4 BraLSD genes in B. rapa. To validate our results for domain confirmation, these proteins were submitted to the SMART and NCBI servers. These proteins were designated based on their respective family information and following the nomenclature of A. thaliana according to sequence similarities, i.e., BraSET1–BraSET60, BraJmjC1–BraJmjC53, and BraLSD1–BraLSD4 (Table S1). In addition, the protein length of BraJmjC and BraLSD vary widely, ranging from 171 to 2591 and 731 to 1579 (aa), compared to BraSET, which vary from 152 to 2396 (aa) (Table S1). The molecular weight of the resulting proteins ranged from 17.76 to 273.33 kDa, 20.29 to 293.09, and 76.43 to 174.28, respectively, and the corresponding pIs were 4.78 to 9.72, 4.83 to 8.82, and 5.15 to 6.71. These results varied among family members. These proteins may function in different microenvironments. The grand average of hydropathicity (GRAVY) for these proteins was observed to be negative, i.e., they exhibited hydrophilic behaviour. Subcellular localization is important for understanding plant functions, and our findings depicted that large proportion of the proteins were located in the plasma membrane, cytoplasm, nucleus, vacuoles, and mitochondria.
2.2. Expansion and Structural Features of SET and JmjC
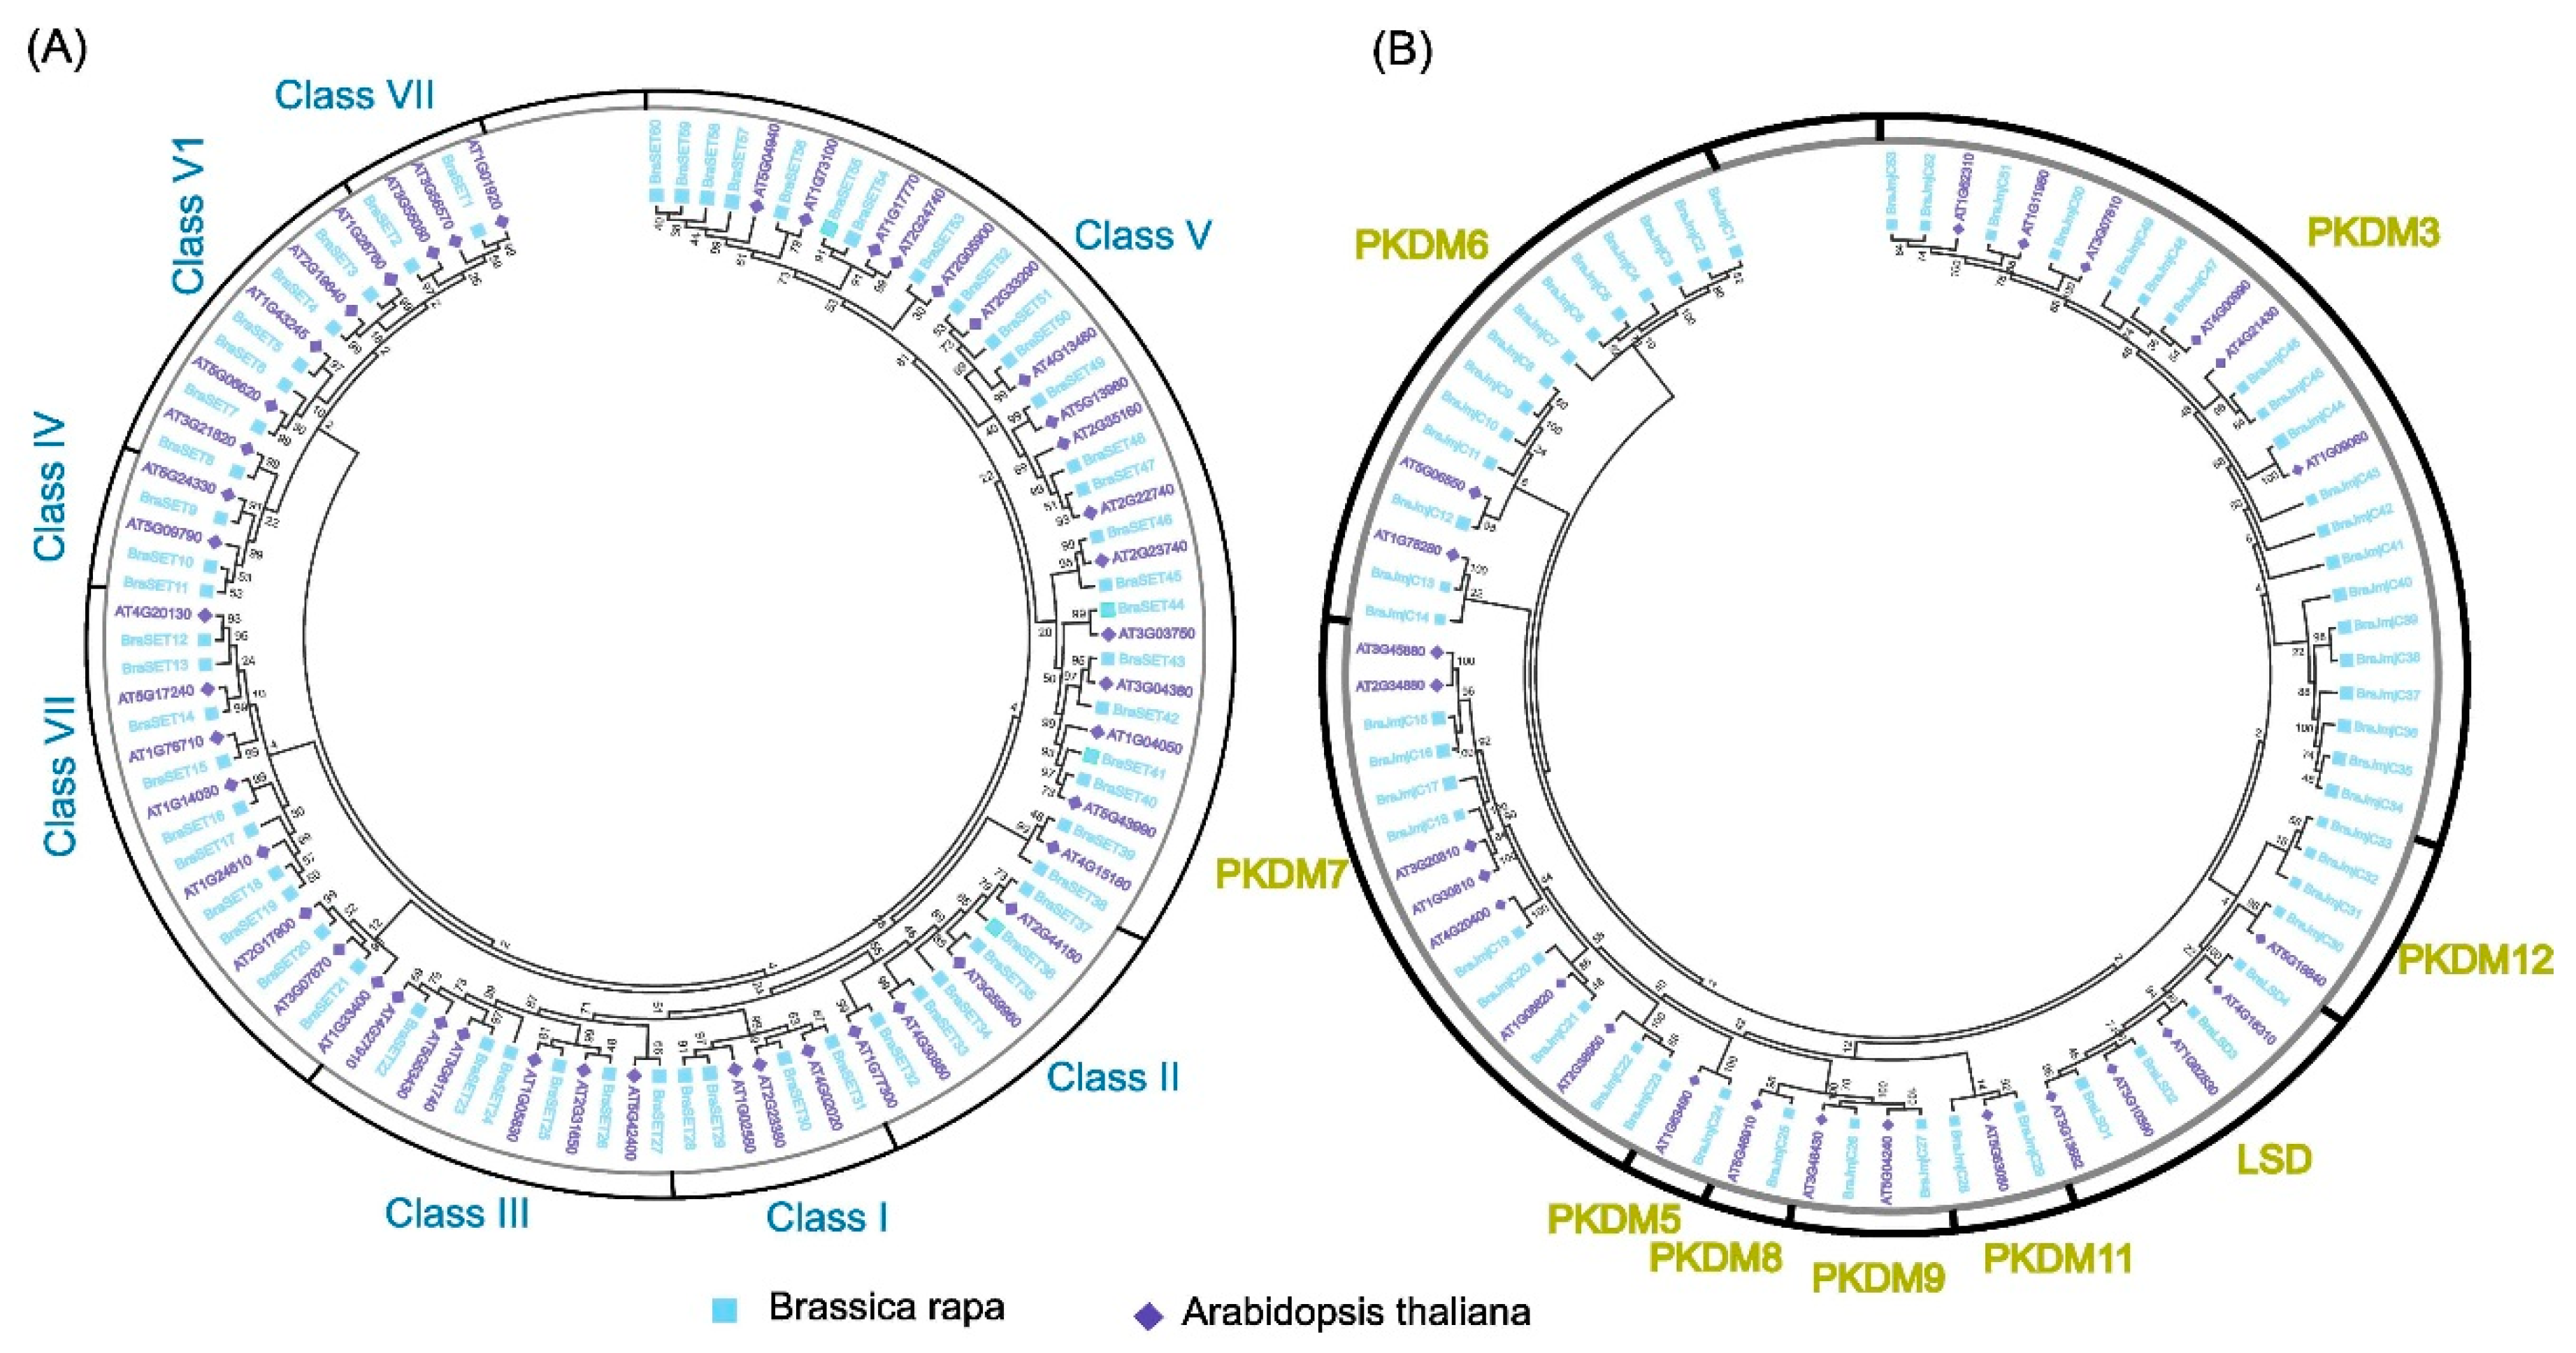
A phylogenetic tree was constructed to compare and validate the evolutionary relationships of SET and JmjC proteins among B. rapa and A. thaliana. The maximum likelihood approach was used for both with 1000 bootstrap replications (Figure 1a). We assigned the SET proteins into seven subclasses, which was consistent with a previously reported study on A. thaliana [13]. Class V was the most dominant among all of the subclasses with 23 genes, while the other subclasses had relatively lower numbers of SET (Figure 1a). According to a previous characterization [39], LSD genes contain two domains, SWIRM and amino oxidase domains. Thus, the proteins containing both of these domains were categorized as putative LSD (JmjC), according to previously reported study [36]. Moreover, JmjCs were further subcategorized into different subgroups; LSD, PKDM06, PKDM07, PKDM08, PKDM09, PKDM11, PKDM12, and PKDM3, and PKDM5 based on phylogenic relationship and domain composition (Figure 1b). The result of our phylogenetic tree analysis was consistent with previous reports [40,41]. The highest number of genes (20) was observed in the subgroup PKDM3 of B. rapa, while the other groups contained lower numbers of JmjC (Figure 1b). Intriguingly, LSD contained four genes each in B. rapa and A. thaliana, suggesting that these genes may not have contributed to the duplication events during the process of evolution in the angiosperms. The execution of MEME program identified ten conserved motifs, named motifs 1–10 for both SET and JmjC (Figures S1a and S2a). The gene structure organization showed uniformity and consistency for both SET and JmjC (Figures S1b and S2b). We acquired the LOGO of these motifs for both SET and JmjC. Most of the subclasses of SET and JmjC had similarities in their motif arrangements. Both or one of motifs 1 and 2 were common among all the members, indicating they are a highly conserved domain. The consensus sequence showed greater extent of variability between SET and JmjC (Figures S3 and S4). In SET, motifs 3 and 5 revealed greater consensus sequence numbers (120), whereas remaining motifs varied in their consensus sequence number. We also observed divergence among subgroups for both SET and JmjC, which may be due to difference in tree topologies, leading to slight variations.
2.3. Gene Retention and Collinearity Analysis of SET and JmjC
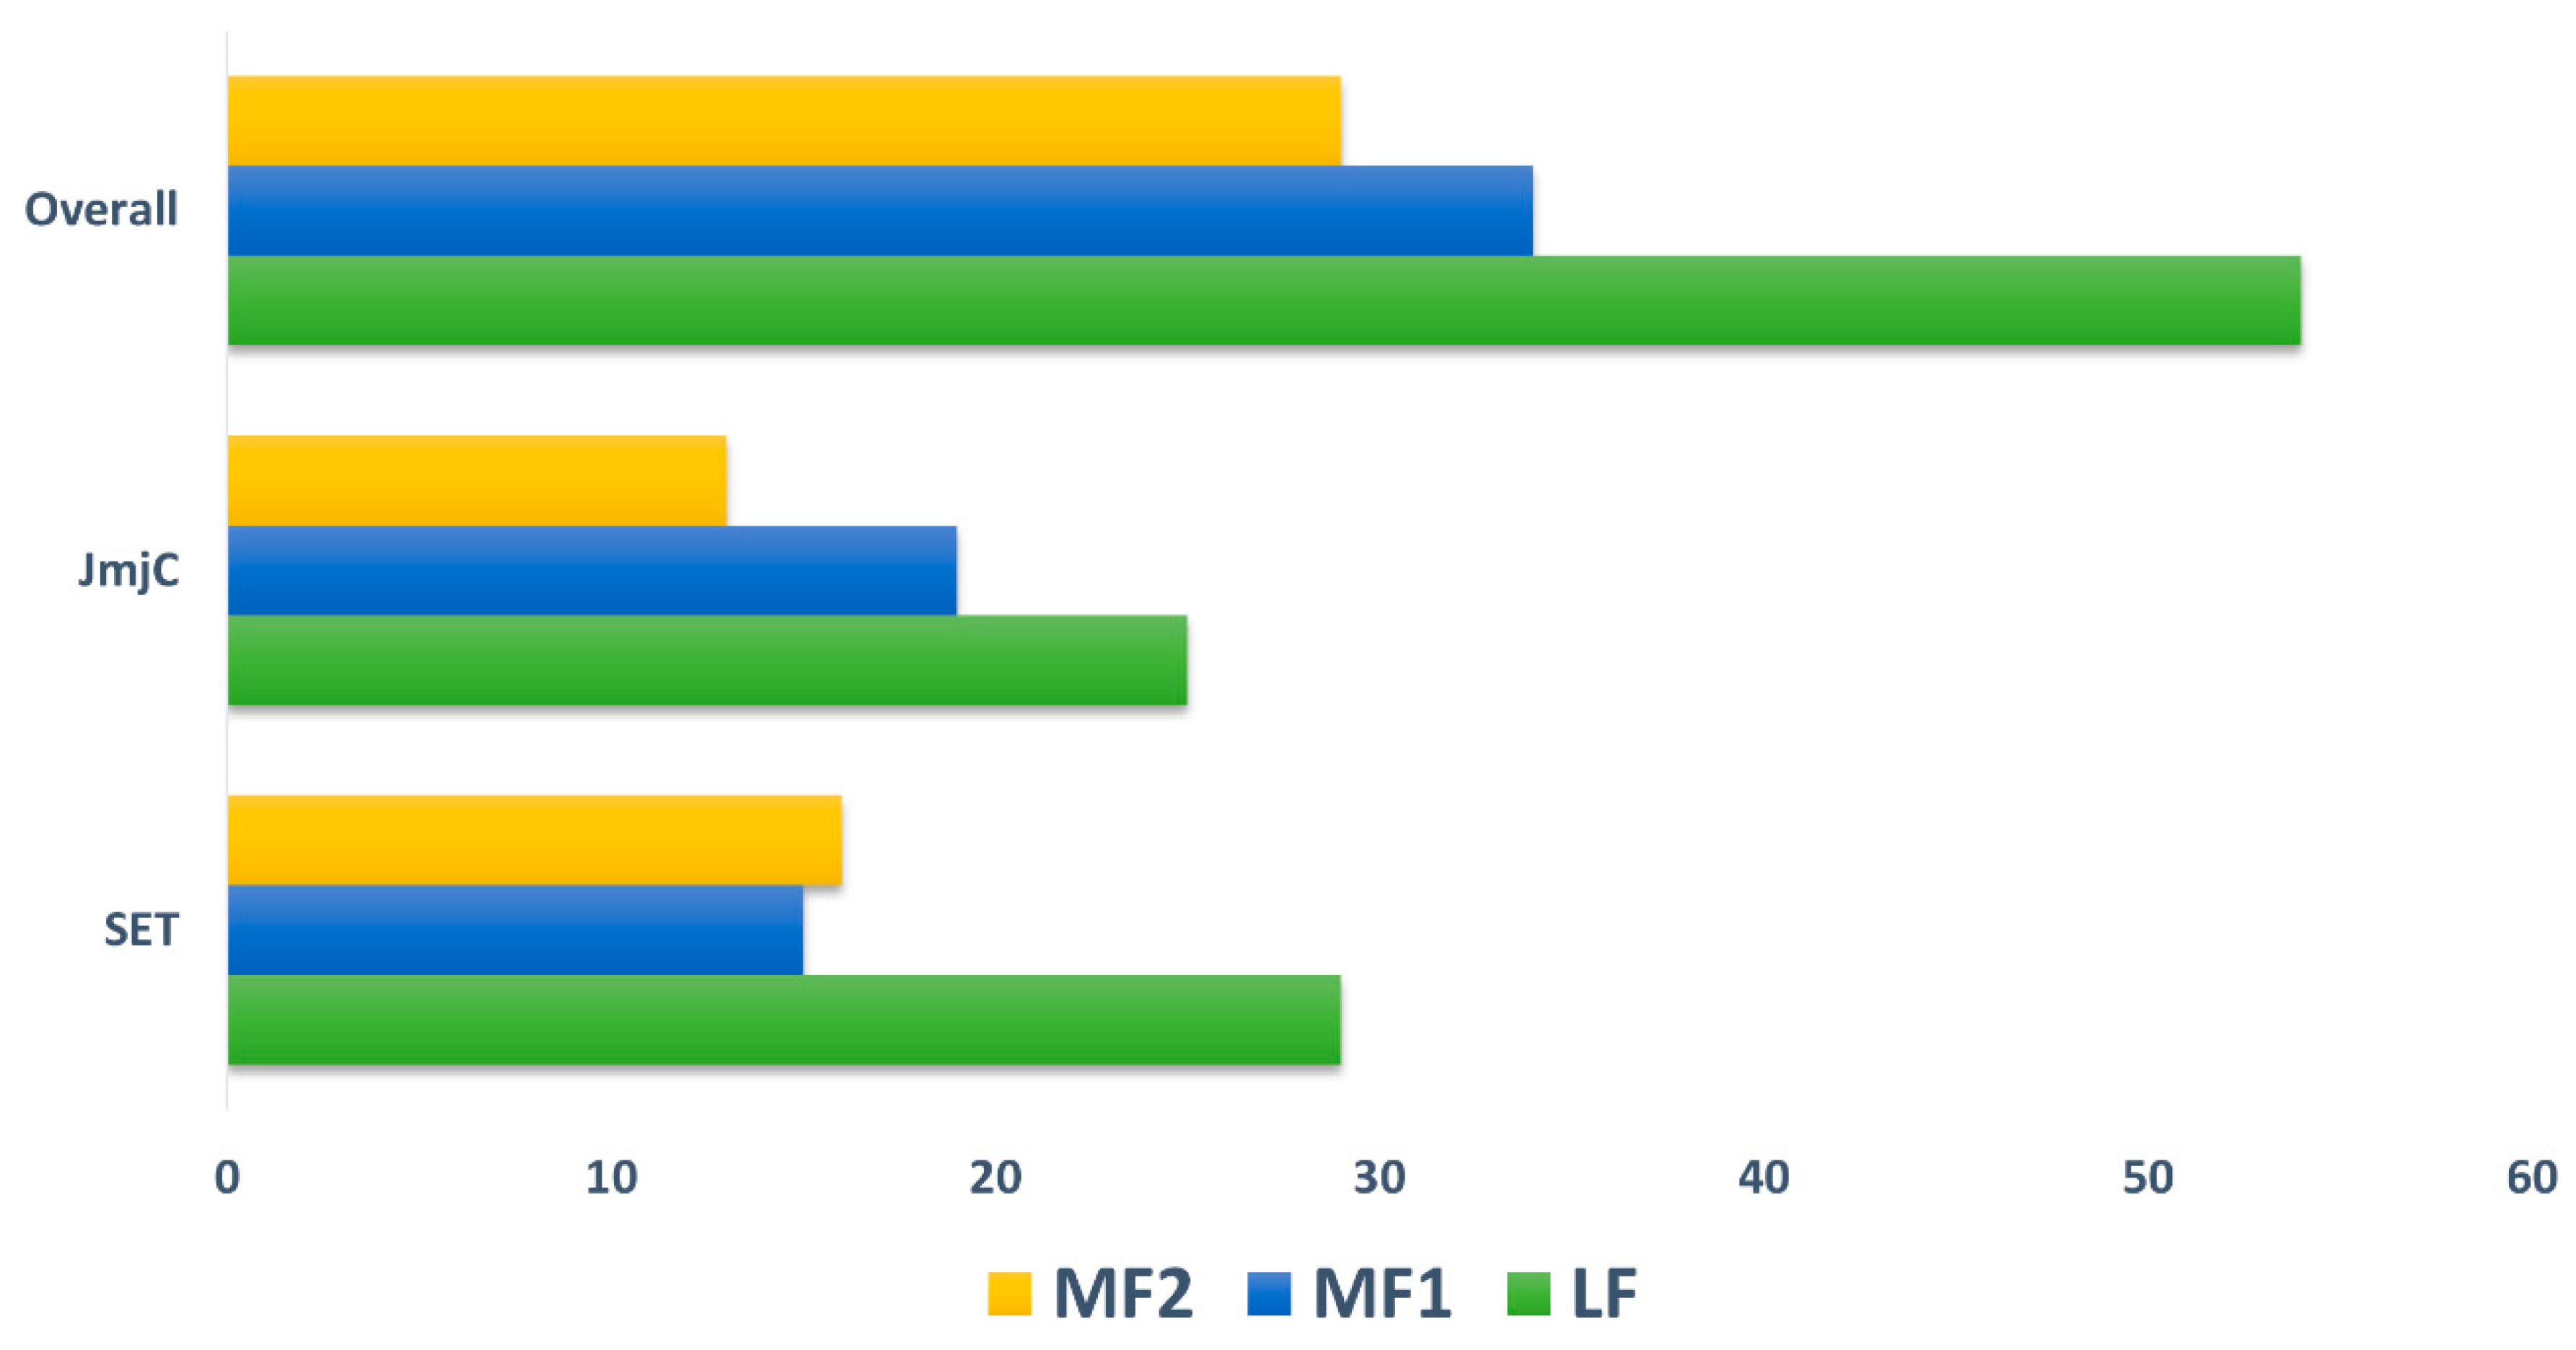
The B. rapa genome is classified into three subgenomes including least fractionated (LF), medium fractionated (MF1), and most fractionated (MF2) and shares a diploid ancestor with A. thaliana [31]. The gene retention and copy number of variations for both SET and JmjC were investigated and calculated in both B. rapa and A. thaliana during a Brassica-specific WGT event. We similarly analyzed the syntenic relationship between paralogous and orthologous gene pairs by utilizing the BRAD database (Table S2). The retention of both SET and JmjC depicted that many of the proteins are either in a single or double copy among three subgenomes. Moreover, one pair with four copies was found for SET and three pairs with three copies were identified for JmjC, whereas the rest did not show any copy variation (Table S2). Our results also indicated that the gene retention and both gene families presented almost identical results, 60/61 SET, and 57/58 JmjC. As discussed earlier, the B. rapa genome contains three subgenomes according to their fractionation degree for SET, the LF subgenome included most of the genes (48.33%), followed by MF2 (26.67%) and MF1 (25%). We noted slight variation for JmjC as the LF share was only 43.86%, followed by MF1 (33.33%) and MF2 (22.81%). Overall, the results confirmed that large proportion of the genes (46.15%) were sited in the LF subgenome of B. rapa (Figure 2). Our results validate the hypothesis of dosage prediction as high number of gene copies were retained, indicating that high degree of gene retention occurred following a WGD event.
2.4. Chromosomal Localization and Syntenic Gene Duplication Analysis
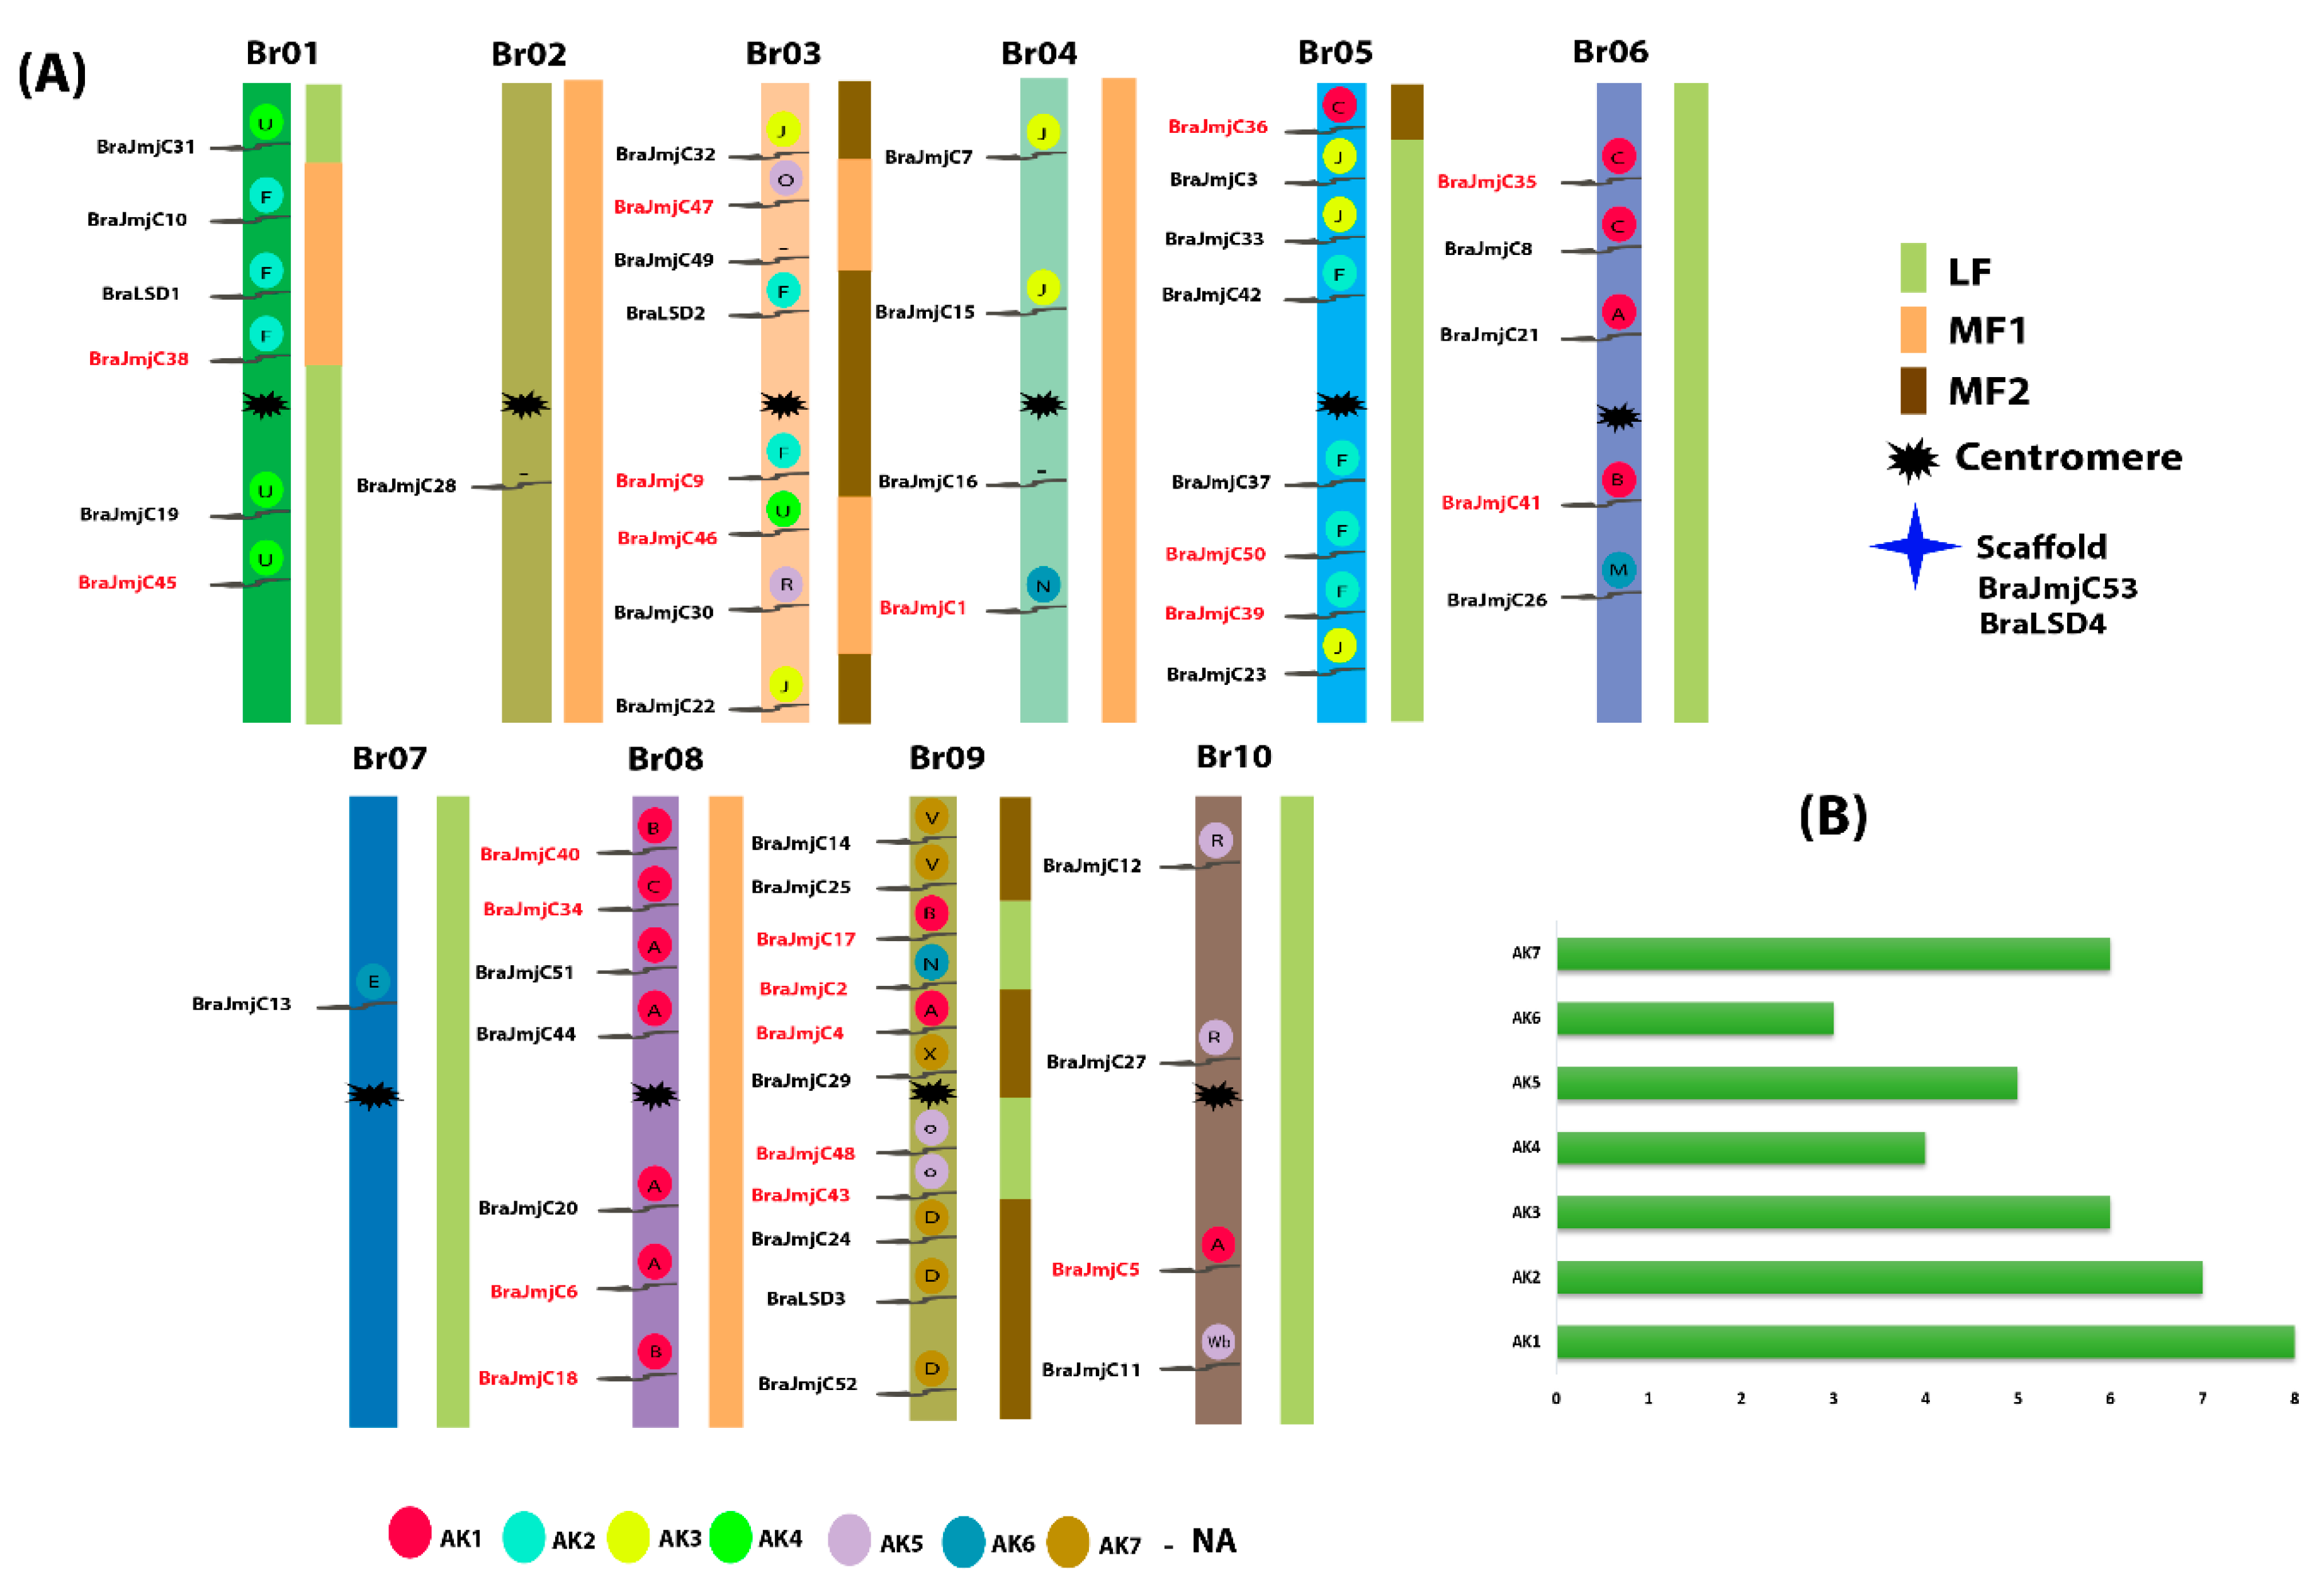
To explore the evolutionary mechanism of both SET and JmjC, the chromosomal location and gene duplication events were further analyzed. For chromosomal localization, all SET and JmjC displayed an obvious uneven dispersal on the 10 different positions of B. rapa chromosomes (Bra01–Br10) (Figure S5a and b and Figure 3a). A large number of SET were recorded on chromosome Br09 (up to 16) while the lowest number was found on chromosomes Br01 with two genes. For JmjC the maximum number of chromosomes was also observed on Bra09 (up to 11) and the minimum number was noted on Bra02 and Bra07 with a single each gene. Four genes were unmapped and were distributed on a scaffold—two of each gene form SET (BraSET41 and BraSET42) and JmjC (BraJmjC53 and BraLSD4). In addition, we reconstructed the 24 conserved ancestral genomic blocks (GBs) mainly based on a previously reported study [42]. In a proposed ancestral karyotype (AK), their position determined the color-coding of these blocks [43,44], with slight modification. Most of the SET were clustered in the regions of AK1 and AK3 (18.92% each), whereas for JmjC, most (20.51%) were clustered in the region of AK1 as shown in Figure 3b.
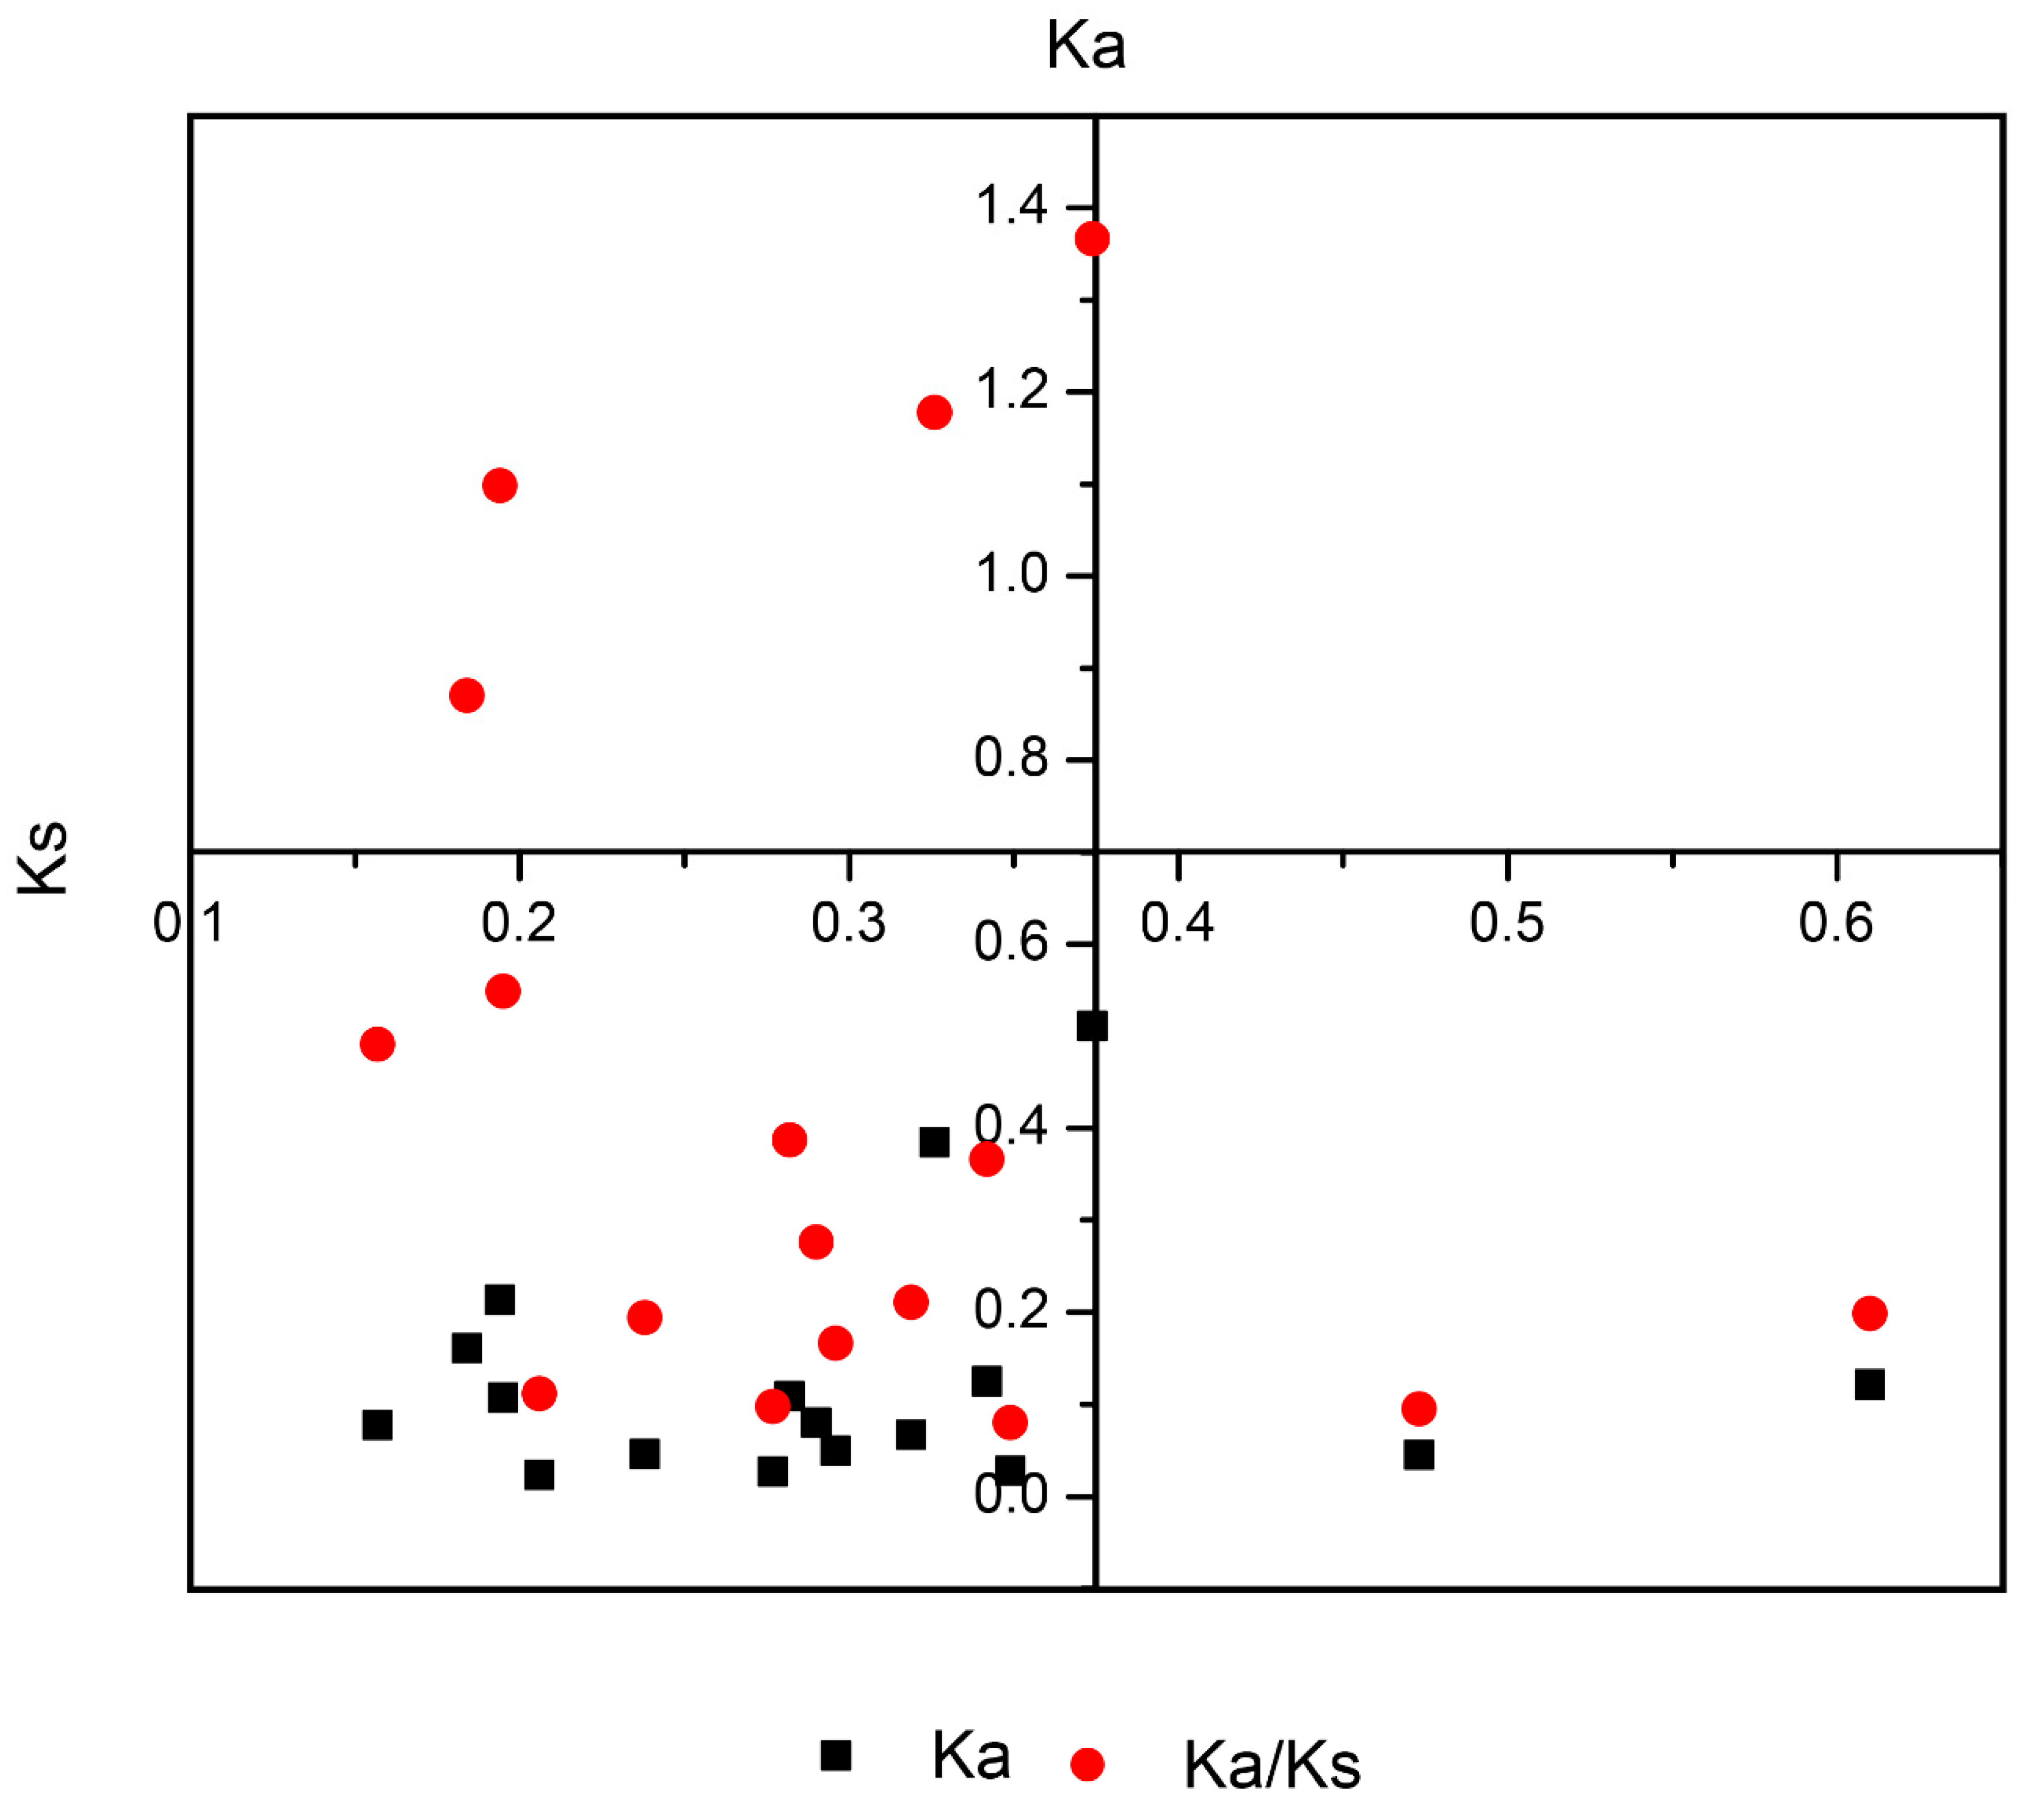
For a gene family’s evolution, gene duplication is the driving force for gene activation [45]. Using MCScanX software, we detected duplication types (tandem and segmental). In B. rapa, the expansion of SET and JmjC was mainly driven by WGD events or segmental duplication. In SET genes, the Ks values ranged from 0.16 to 0.61 with an average divergence time of 11.13 MYA (million years ago). For JmjC, the Ks values ranged from 0.18 to 0.35 with an average divergence of 9.04 MYA (Figure 4 and Table S3). Taken together, these values suggest that it mainly initiated with the divergence of B. rapa from A. thaliana (9.6–16.1 MYA) [46].
2.5. Expression Patterns of SET and JmjC in Various Tissues
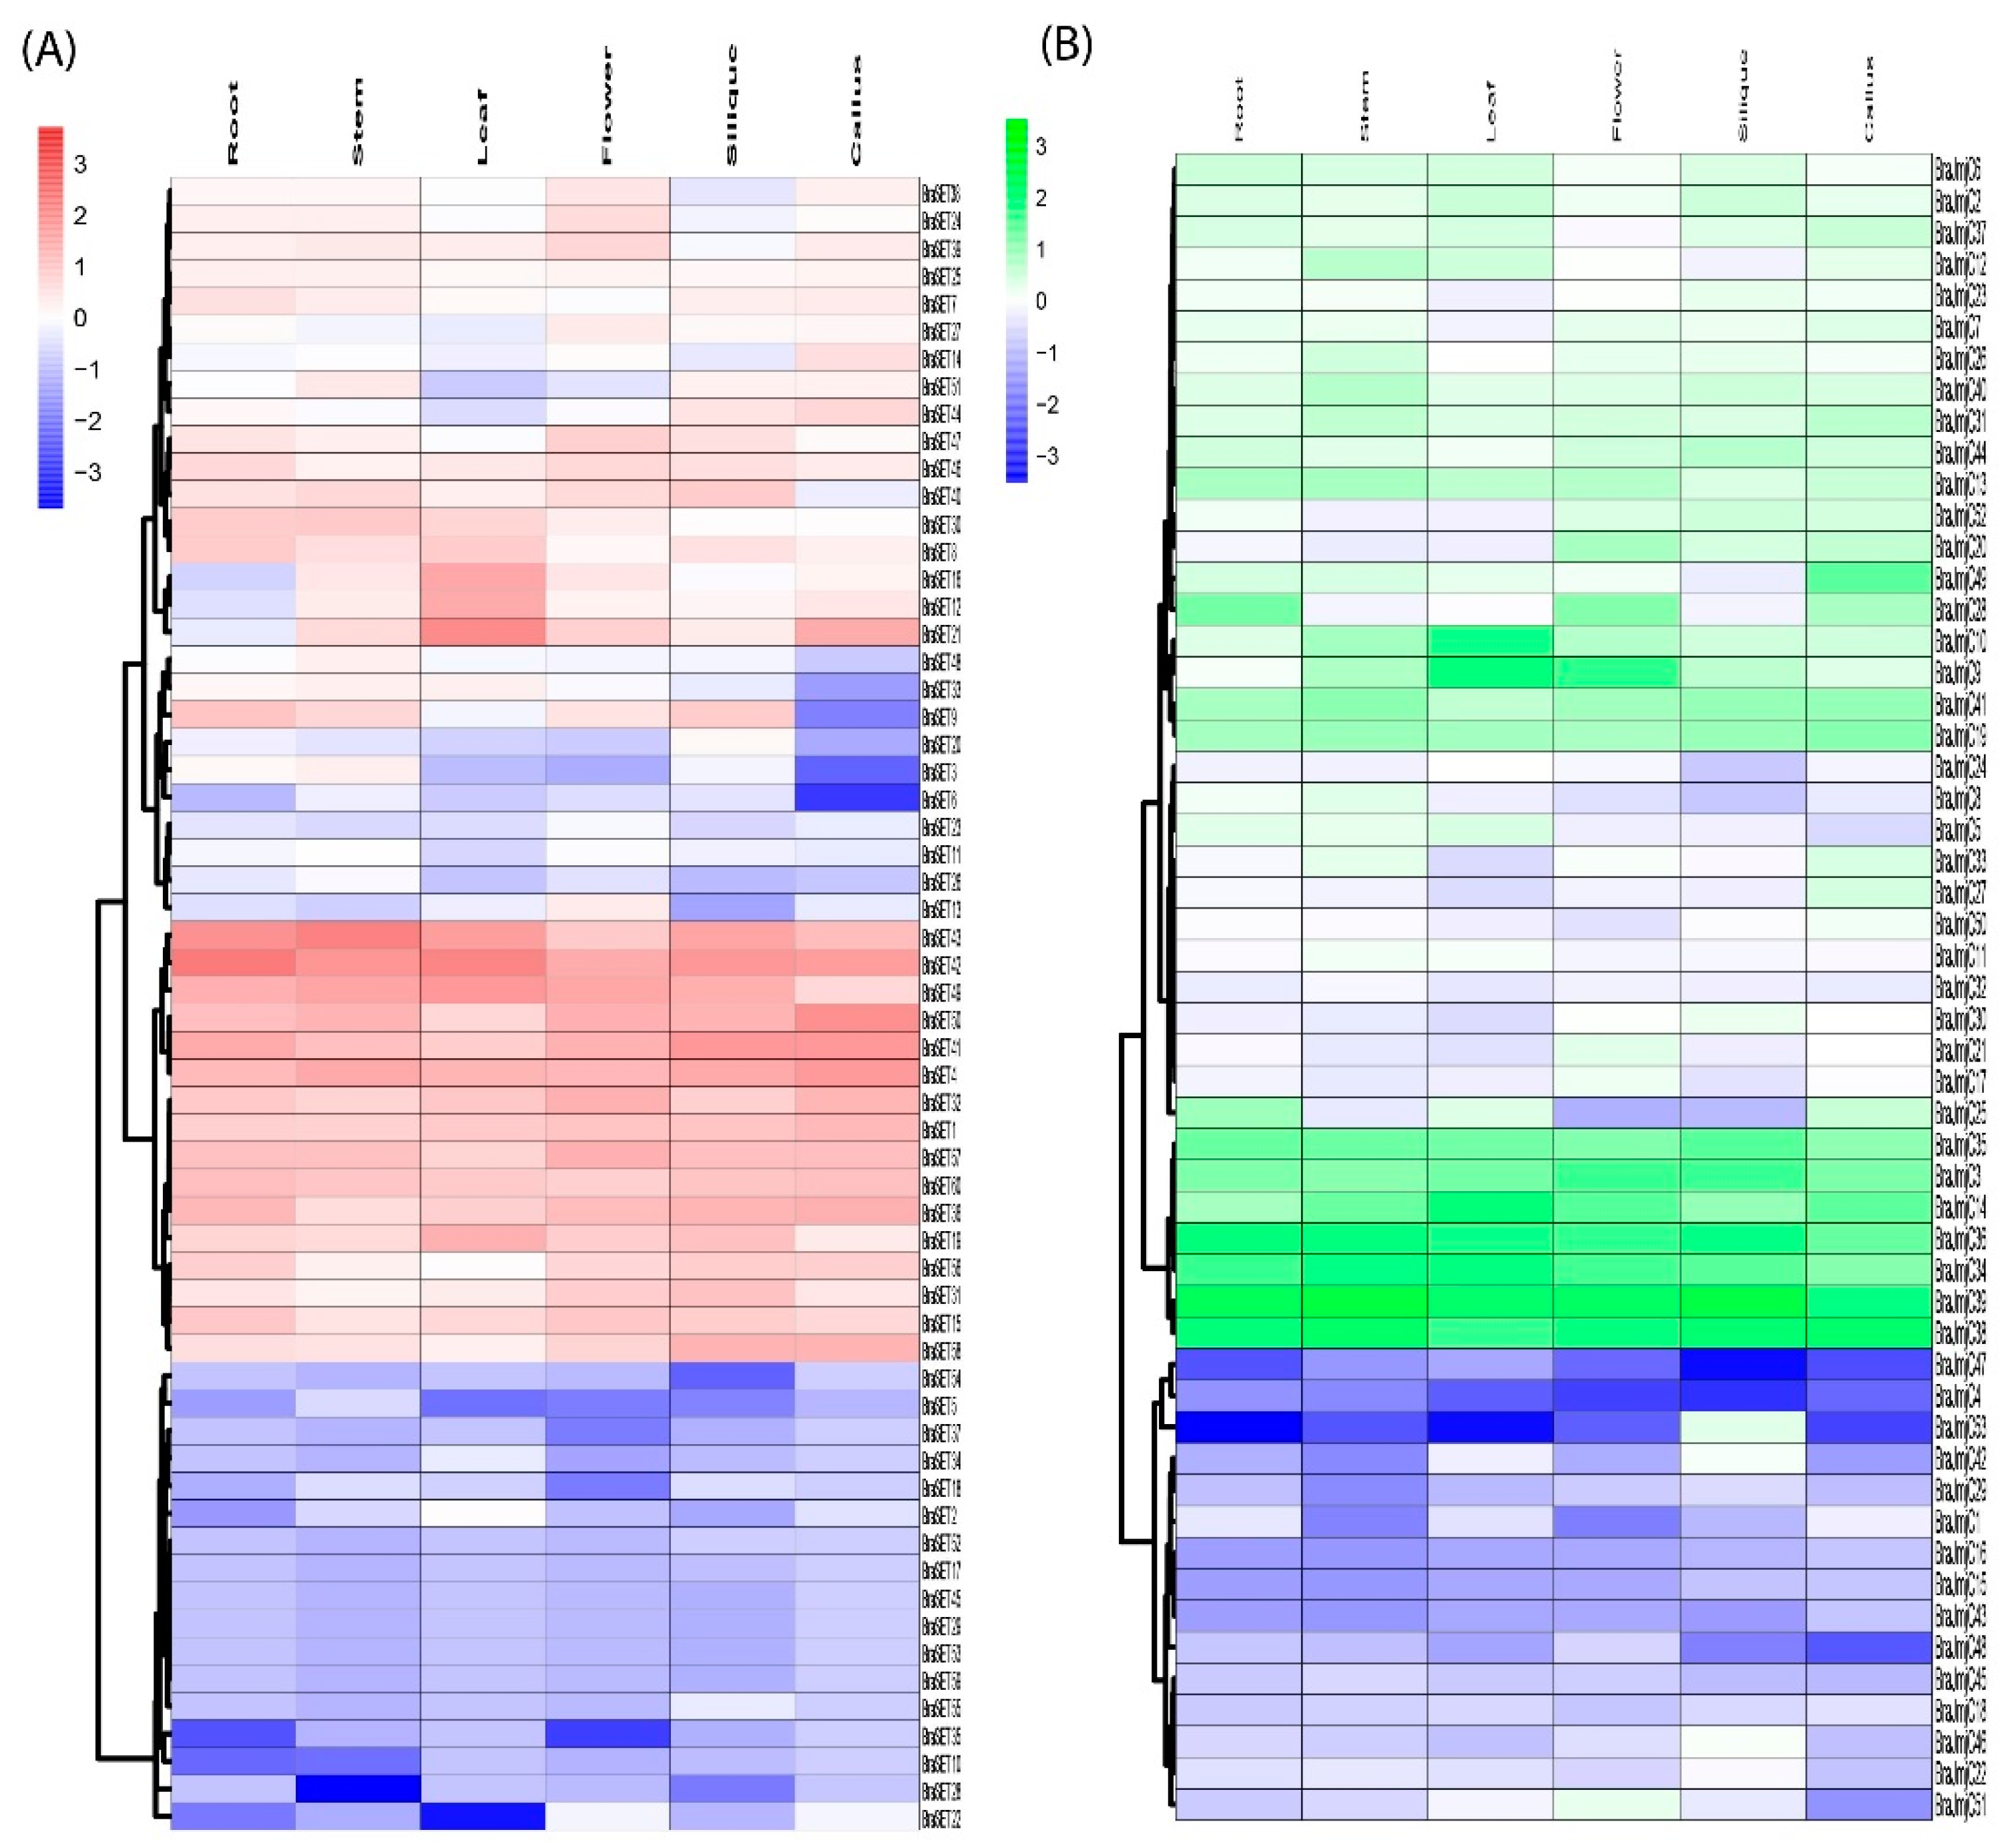
Previously published RNA-seq data on various tissues (i.e., roots, stems, leaves, flowers, siliques, and callus) was retrieved and used to gain insight into the divergence and putative functions of SET and JmjC genes in B. rapa growth and development [30]. Results demonstrated higher discrepancies in expression profiling of SET and JmjC gene members in B. rapa. Among 60 SET genes, BraSET29, BraSET45, and BraSET53 are not expressed and BraSET17, BraSET52-55, and BraSET59 showed random involvement in a particular organ (Figure 5A and Table S4). The remaining SETs were expressed in at least two or more organs. Few genes were selectively expressed in tissue-specific clustering (Figure S6A). Among them, one gene in flowers and five in siliques showed preferential expression patterns and could be selected as candidate genes for likely role in tissue improvement of B. rapa.
The data showed that 57 JmjC genes were expressed highly compared to SET; only one gene (BraJmjC43) did not show any expression pattern, while the rest were expressed highly in one or more tissues (Figure 5C and Table S4). In tissue-specific clustering (Figure S6B), we observed only two selective genes in siliques, suggesting their possible role in organ developmental pathways.
The expressional tendencies between 17 paralogous pairs were investigated for both SET and JmjC (eight and nine pairs, respectively), and their correlation values were calculated (Figure S7A and Table S5). Results revealed that paralogous pairs presented substantial distinction in six different tissues. Eight pairs of SET showed varied expression, including three pairs (BraSET6_BraSET9, BraSET58_BraSET59, and BraSET57_BraSET60), showing higher expression in all organs with positive correlation (>0.6). In addition, two pairs (BraSET45_BraSET46 and BraSET53_BraSET55) showed no correlation and the rest were expressed with mild positive correlation. These results indicated that due to pseudogenization, these genes might have lost function. On the other hand, for JmjC, four pairs (BraJmjC5_BraJmjC6, BraJmjC9_BraJmjC10, BraJmjC34_BraJmjC35, and BraJmjC40_BraJmjC41) showed higher expression in all tissues with higher PCC values (>0.6), one pair (BraJmjC43_BraJmjC48) had no correlation, one (BraJmjC17_BraJmjC18) exhibited negative correlation, and the rest showed mild positive correlation. In addition, the clustering image showed that only one gene participated in siliques, while the rest were not co-expressed in other tissues (Figure S7B). The divergences in the expression profiles for both SET and JmjC between paralogous pairs suggest that few of these pairs may gain new functions following the duplication during evolutionary process.
2.6. Cis-Element and Expression Analysis of SET and JmjC
The promoter regions of SET and JmjC was used for the identification of cis-regulatory elements by using the PlantCARE database. A total of seven major groups, such as light, hormones, stress factors, enhancers, other regulatory stress factors, and circadian were the most prominent promoter region and found to be conserved among SET and JmjC domains. For both SET and JmjC, we identified the number of genes that were responsible for various cis-regulatory elements (Table S6). These results demonstrated that numerous genes were involved in various signaling pathways, for instance, certain genes (39.62%) were light-responsive (L-BOX, ATI-motif, ATC-motif, AE-BOX, MRE, G-BOX, GAG-motif, and LAMP-ELEMENTS), followed by hormones (16.44%) (CGTCA, ABRE, ERE-motif, TGACG-motif, P-BOX, TGA, AuxRR-core, GARE-motif), and other regulatory stress elements (15.66%) (ARE, AT-Rich sequence, A-Box, GCN4-motif, CAT-BOX, o2-site, EIRE), while few genes (3.29% and 2.51%) participated in enhancers (GC-motif, 5UTR Py-rich stretch, and TA-Rich Region) and circadian. These results suggest that both SET and JmjC were highly responsive to light stress factors, which may be due to interaction with corresponding cis-elements that assist in regulating gene expression levels. There were some other common regulatory elements such as heat stress-responsive (HSE), drought responsible (MBS), low temperature responsible (LTR), and drought, cold, and salt stress-responsive elements (DRE), which indicate the diversity in function and the importance of these key genes in stress tolerance mechanisms.
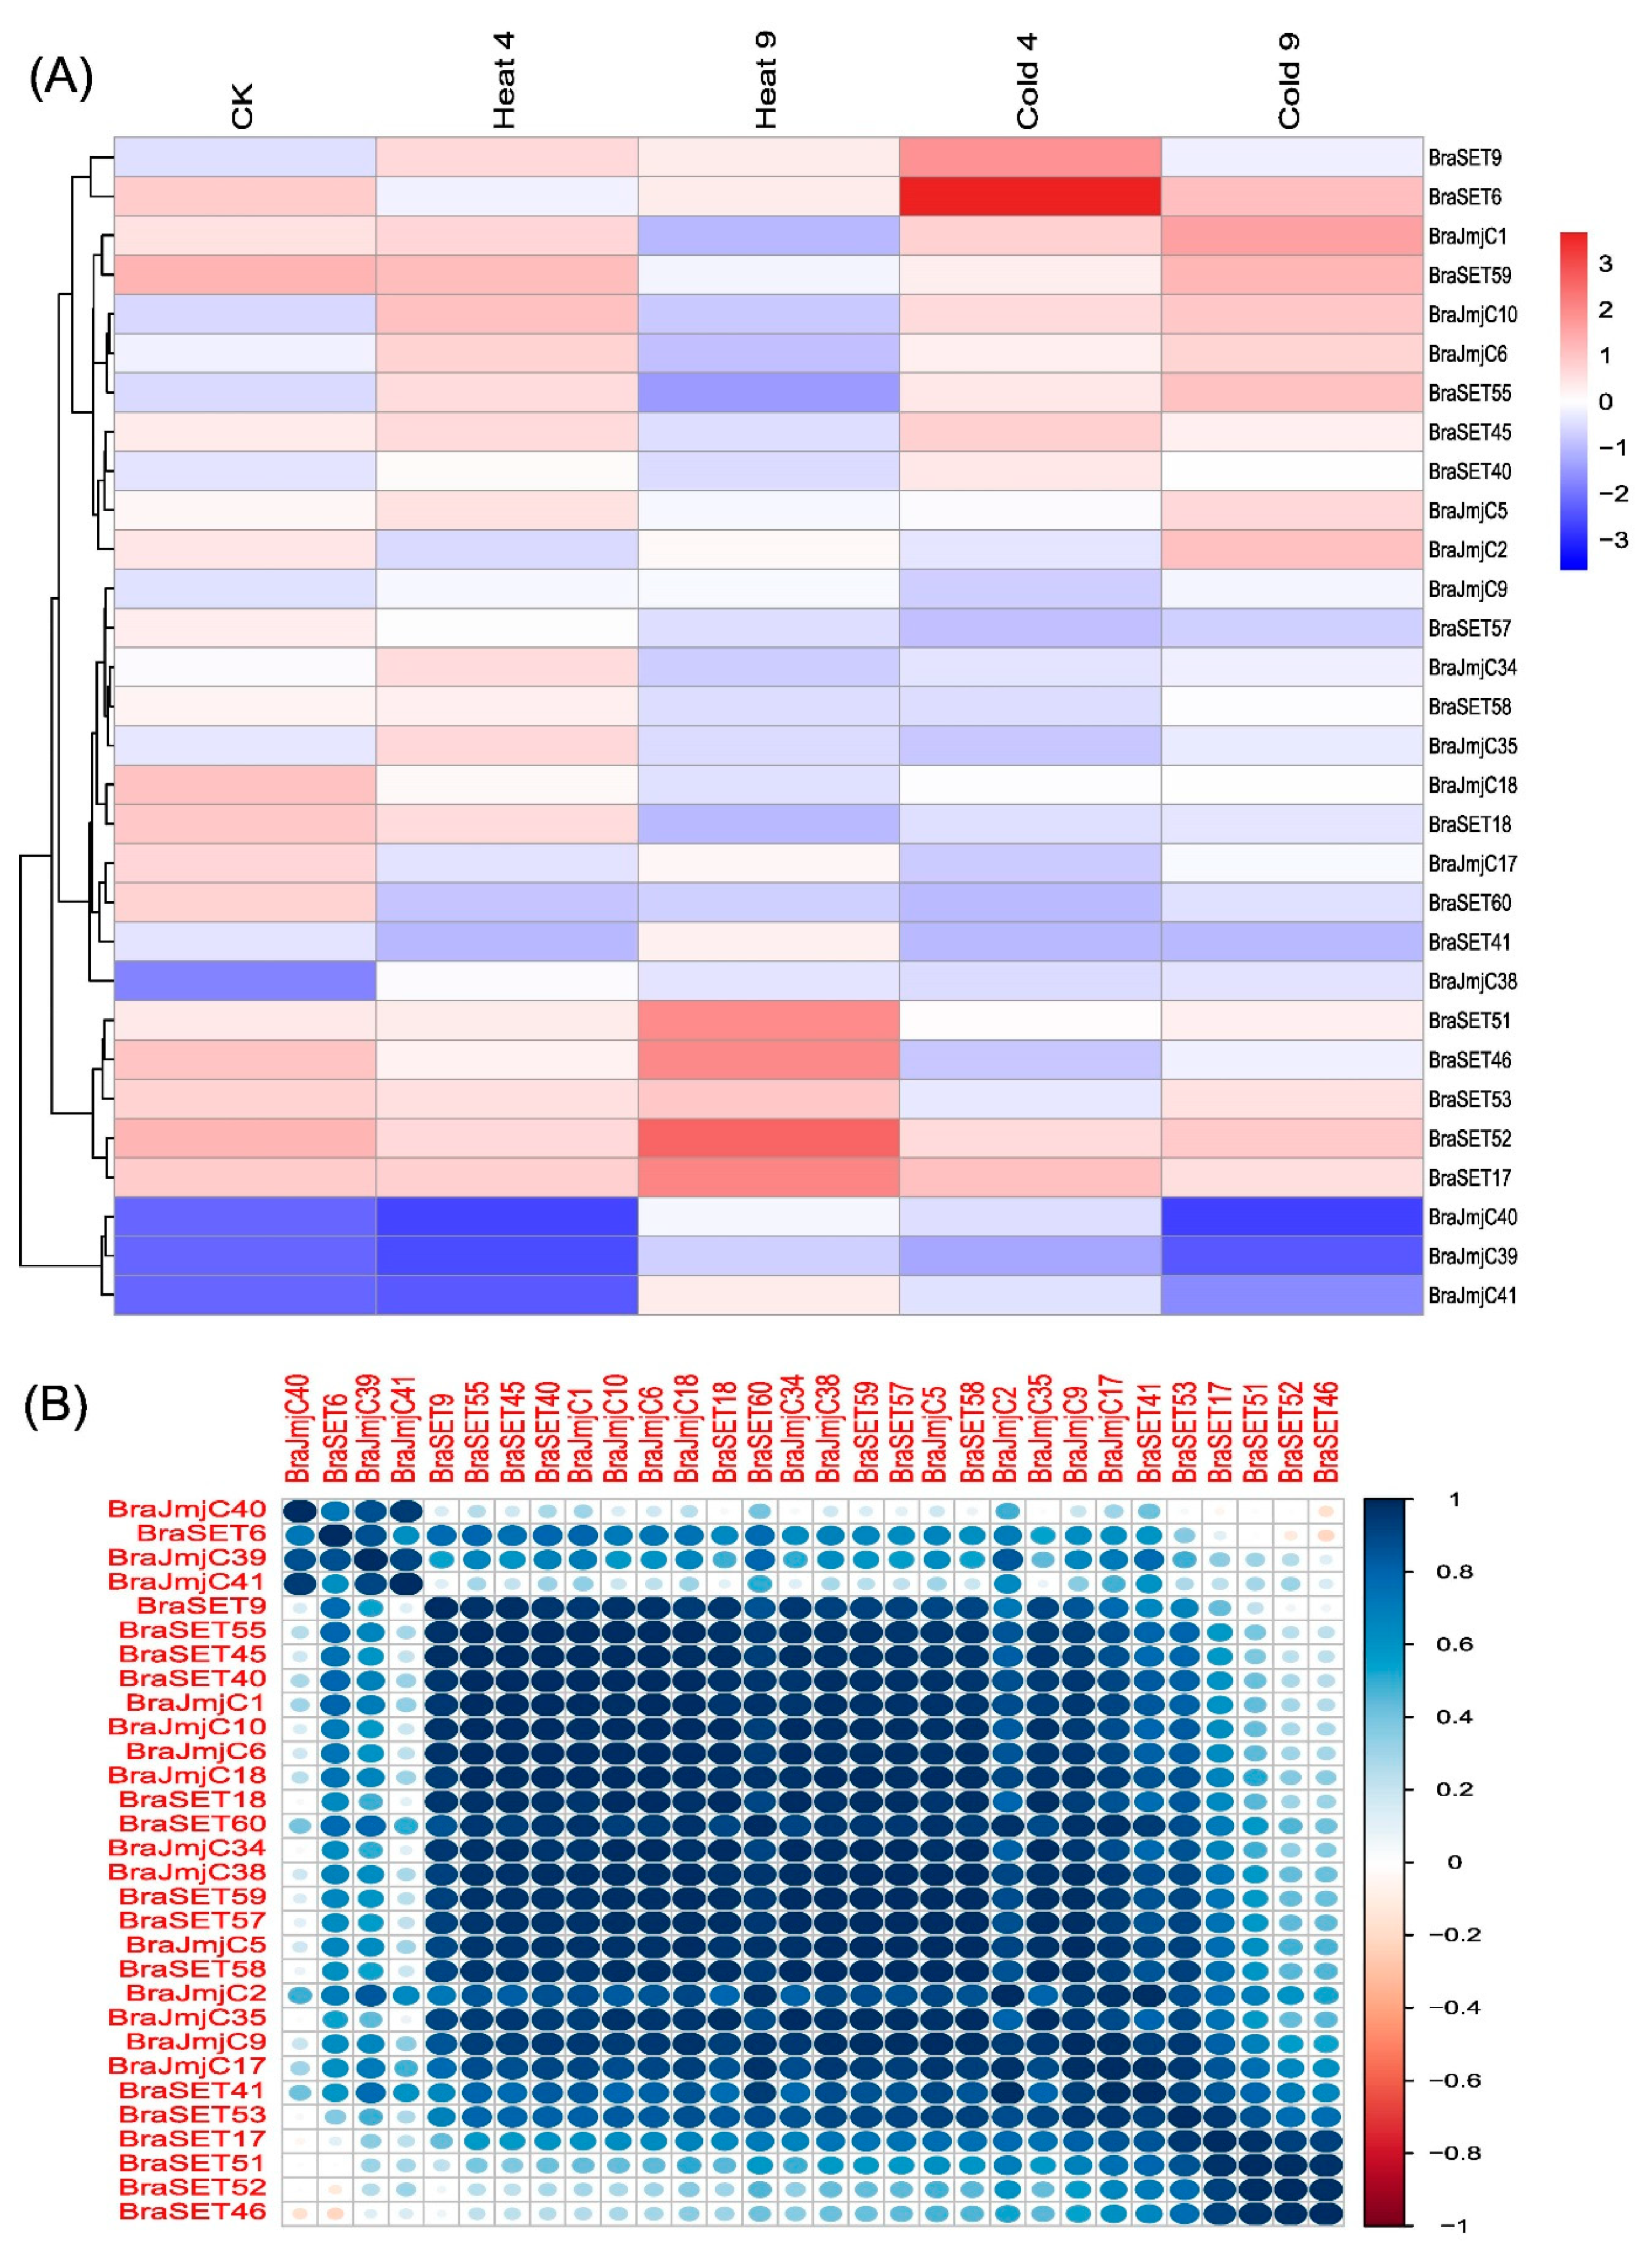
In angiosperms and vertebrates, histone modifications, such as methylation and demethylation, have been identified as crucial factors for regulating chromatin structure. As a result, both the JmjC and SET genes play a crucial role in developmental stages to tolerate abiotic stresses [41,47]. The importance of these genes and the results of cis-regulatory elements provide the means to study these genes’ dynamic expression under heat and cold stress. We randomly selected a total of 15 paralogous pairs of genes, including eight SET and seven JmjC, and analyzed them using qRT-PCR. A range of differential expression levels were observed after exposure to heat and cold stress (Figure 6A). Some of the paralogous pairs for both SET and JmjC exhibited similar patterns, whereas others showed significant variations. Under the two abiotic treatments (heat and cold), more than half of genes were induced by heat and exhibited striking expression patterns compared to the cold treatment. The PCCs based correlation analysis suggested both high positive and low negative correlation within selected genes (Figure 6B).
3. Discussion
To understand the gene structure, function, and evolution, a genome-wide gene family analysis is the first step [47]. Moreover, for the identification of histone modifiers in a genome, sequence-based searching and phylogenetic characterization are the most effective methods [41,48,49]. We performed a comprehensive search for SET and JmjC domain-containing genes throughout the B. rapa genome, and a total of 60 and 57 full-length SET and JmjC genes were identified, respectively. These genes were further divided into seven SET and nine JmjC distinct subgroups based on domain organization and phylogenetic analysis. The phylogenetic characterization of SET and JmjC was highly conserved among subgroups, suggesting the importance of their roles in regulatory mechanisms for plant improvement. SET (Class V) and JmjC (PKDM3) groups were preferentially expanded in B. rapa compared to A. thaliana, implying that these group members evolved substantially to meet some unique regulatory needs [36]. The result of our study is consistent with similar work on A. thaliana, O. sativa and Citrus [34,50]. This comprehensive analysis on phylogenetic relationships, syntenic regions, and the collinear relationship between B. rapa and A. thaliana also demonstrated that BraSET, BraJmjC, and BraLSD were divergent from the model plant at a high frequency.
Evolutionary history indicated that multiple polyploidization events have occurred in all extant angiosperms [51,52,53]. During the evolutionary process and genetic systems, gene duplications are the main driving force for novel biological functions, extensive development of the gene family, and the generation of evolutionary novelty [54]. B. rapa is tremendous model plant to study evolutionary process as it has undergone WGD and WGT events, which allows the study of the relationships among gene family fractionation and discrepancies in morphotypes [31,42]. As discussed earlier, angiosperms experienced polyploidization events in the evolutionary process, which led to the expansion of SET and JmjC genes in B. rapa resulting from the WGT event to allow non-functionalization, sub-functionalization, and neo-functionalization [55]. For duplicated types of genes, these fates help them by providing options to gain functional diversification. The analysis of duplication types revealed more segmental duplication (91.08%) compared to tandem, indicating that segmental duplication plays a significant role in the contribution and expansion of SET-domain, JmjC-domain, and LSD-domain proteins. Our findings also demonstrated a high occurrence of copy variation and gene retention following a WGT event, which supported the gene dosage hypothesis [29]. Furthermore, we also calculated the divergence rate for paralogous SET and JmjC. The comparison of nucleotide distance showed that JmjC diverged at approximately 9.04 MYA, earlier than SET which separated at 11.13 MYA. The divergence time for both SET and JmjC for paralogous gene pairs indicates that their divergence occurred during the divergence of B. rapa from A. thaliana (9.6–16.1 MYA) [45]. Generally, if the value of Ka/Ks is < 1, indicates gene pairs may have evolved from purifying selection (also called negative selection); Ka/Ks = 1 suggests neutral selection, while Ka/Ks > 1 means positive selection [56,57,58]. Three pairs of SET had a Ka/Ks > 1, specifying positive selection, the remaining SET showed values less than 1.00. These results suggest that these pairs underwent purifying selection and thus mainly act the maintenance of B. rapa.
Comparative structural analysis of both SET and JmjC shared common patterns among subgroups. It is worth mentioning that gene structure compositions might be useful for studying the origin of these genes. We observed in most of the subclasses contained more than one intron, and the rest exhibited consistency among the subgroups, indicating that the distribution pattern of introns and exons is pondered as the backbone of genes and the evolutionary fingerprint [31]. Synonymous and non-synonymous analysis showed that the SET and JmjC genes did not differ significantly among the three subgenomes (LF, MF1, and MF2) of B. rapa. Our study offers insight into the unique features and fairly high conservation in B. rapa. To comprehend plant functions, expression analysis of a gene can provide valuable clues. Some of the emerging evidence has supports that cellular processes and epigenetic regulations commonly occur during abiotic stress, emphasizing the significance of both DNA and histone modifications [59,60]. In plants, the alteration of histone modification and DNA methylation are coordinated with changes in the expression profiling and that are associated with stress-responsive genes to adapt to environmental changes. Recent studies have reported that several histone modifications including H3K4me3, H3K9ac, H3K9me2, H3K23ac, H3K27ac, H3K27me3, and H4ac, along with DNA methylation response to abiotic stresses, such as drought stress, salt, and temperature fluctuations [61,62]. The response of plants to temperature stresses are categorized into different types based on the exposure such as warm, high, chilling or freezing temperature. The low-temperature stress and high-temperature stress greatly affects plant growth and development, immunity and circadian rhythm, and poses a major threat to the global food supply [63]. In Arabidopsis, the understanding of SUMOylation has been progressed under heat stress conditions and also various chromatin components including H2B, GCN5, HDA19, and the deubiquitinating enzyme UBP26, which removes ubiquinone bound to H2B, have been found to be SUMOylated [64]. The heat stress treatment has been reported to decrease the SUMOylation of H2B and increase the status of the GCN5 HAT [64]. In Arabidopsis, vernalization processes involved in epigenetic regulation induced by environmental stresses and can be achieved by long-term exposure to cold temperatures [65]. In Arabidopsis, it has been estimated that 3 to 20% of the transcription changes occurred in response to cold stress [66,67]. The expression of HDA6 in Arabidopsis was induced by long-term low temperature treatments that resulted into mutation by showing sensitivity to freezing stress [68]. Expression profiling for 15 SET and JmjC paralogous pairs was analyzed after exposure to heat and cold treatments by qRT-PCR. The results, specifically for heat and cold stress genes, showed a high variation in the expression profile and provided valuable clues for robust candidate genes in improving stress tolerance mechanisms in B. rapa. The paralogous gene pairs respond differently. For most SET genes, the expression level increases after heat shock and 9 pairs showed a positive correlation. By contrast, the JmjC responded mostly negatively to cold treatment. In summary, some SET genes show active expression patterns upon heat and cold shock, which specifies that these genes may be participated in B. rapa responses to temperature stresses. The overall response of SET and JmjC across six various tissues was revealed by the combinatorial expression profiles against heat and cold stress. Certainly, the different organs/stages have dynamic expression patterns in specific tissues or treatments, and many of those SET and JmjC genes showed variation either up- or downregulation in definite tissues or treatments. Cis-elements and expression analysis results revealed that SET and JmjC genes expressed in various biotic, abiotic and hormone signaling, might have acquired new functions after duplication in the evolutionary processes. A common interacting pattern was observed in the expression profiling such as cis-acting element involved in heat stress-responsiveness (HSE) and in low-temperature responsiveness (LTR) as described in Table S6. Both SET and JmjC genes showed variable responses to these factors and can be assumed to be responsive against heat and cold stress.
Cumulatively, our results provide fundamental information about SET-domain, JmjC-domain, and LSD-domain protein members that will assist in the identification and for functional studies in boosting abiotic stress-resistant crop plants.
4. Material and Methods
4.1. Retrieval of Data Sequences
The sequences were downloaded from B. rapa genome (2.5 version), BRAD (http://brassicadb.org/brad/) [31]. The A. thaliana sequences were retrieved from TAIR (http://www.arabidopsis.org/) and the sequences of rice were extracted from the Rice Genome Annotation Project (http://rice.plantbiology.msu.edu/) [69]. The Hidden Markov Model profile (HMM) was used as a query in our study to find homologous proteins based on the domain information. For various families, such as SET (PF00856), JmjC (PF02373), SWIRM (PF04433), and Amino_oxidase (PF05193), the HMM file was downloaded from the Pfam 31.0 database, (https://pfam.sanger.ac.uk/) [70]. These potential protein sequences were manually analysed with the help of SMART (http://smart.embl-heidelberg.de/) [71] and NCBI databases (https://0-www-ncbi-nlm-nih-gov.brum.beds.ac.uk/). Proteins that contained both SWIRM and Amino_oxidase domains were identified as LSD genes. Sequences with obvious errors including gene length or domain compositions were eliminated.
4.2. Multiple Sequence Alignment (MSA) and Phylogenetic Analysis
For MSA of SET and JmjC candidate genes, we executed MUSCLE [72] by MEGA 7 software with the default options [73]. The phylogenetic trees were constructed using the maximum likelihood (ML) method. For the reliability of resulting tree, bootstrap values of 1000 replications were performed with the Jones, Taylor, and Thornton amino acid substitution model (JTT model), while keeping the other parameters as a default.
4.3. Calculation of the Ka/Ks ratio
The Ka/Ks ratios for the paralogs of SET and JmjC were calculated using MEGA 7.0 [73] software and was intended using the Nei-Gojobori method (Juke-Cantor) with 1000 bootstrap replicates. Additionally, the paralogous genes were identified by searching the term ‘syntenic region’ in the B. rapa genome. Gene pairs were selected among the subgenomes (i.e., LF = Least fractionated genome, and MF1 = Medium fractionated genome or MF2 = Most fractionated genome) of B. rapa. The rate of divergence was calculated by using the following formula: T = Ks/2r, where Ks represents the synonymous substitutions per site and r is the rate of divergence. For dicotyledonous plants, specifically B. rapa, the hypothesis is 1.5 synonymous substitutions per site of 108 years [74].
4.4. Conserved Motifs, Exon–Intron Structure Analysis, and Physicochemical Parameters of SET and JmjC Proteins
To identify the conserved motifs for both SET and JmjC proteins, Multiple Em for Motif Elicitation (MEME) software version 5.0.5 was used with the following parameters: maximum number of motifs 10, with a minimum width of 100 and a maximum of 120. The other parameters were set as default [75]. We used the Gene Structure Display Server (GSDS 2.0) (http://gsds.cbi.pku.edu.cn) for exon–intron structure [76]. The physicochemical properties of the proteins, such as molecular weight (MW), isoelectronic points (pI), and grand average of hydropathicity (GRAVY) values for each gene, were calculated using the PROTPARAM tool (http://web.expasy.org/protparam/). Finally, WOLF PSORT (https://wolfpsort.hgc.jp/) server was used to predict subcellular localization.
4.5. Cis-Elements and Proteins Interaction Predictions
The promoter sequences of SET and JmjC (selected as 2000 upstream bp) were retrieved from the B. rapa genome according to the generic file format (GFF). The various cis-elements were recognized by using the PlantCARE database (http://bioinformatics.psb.ugent.be/webtools/plantcare/html/) [77].
4.6. Chromosomal Location and Synteny Analysis of SET and JmjC
The chromosomal location of SET and JmjC was illustrated from top to bottom with respect to their position in the genome annotation using Mapchart [78]. For gene synteny analysis, the relationships were verified between the homologs of A. thaliana and subgenomes of B. rapa (LF, MF1, and MF2) obtained from BRAD (http://brassicadb.org/brad/searchSynteny.php). Circos program was applied to demonstrate the syntenic relationships among the chromosomes of B. rapa and A. thaliana [79]. Moreover, the paralogous pairs were recognized by either selecting gene pairs between LF and MF1 or MF1 and MF2 subgenomes of B. rapa.
4.7. Pearson Correlation Coefficient (PCC)
Pearson correlation coefficient for both RNA-seq and qRT-PCR was performed by MS Excel (Ver. 2013) and figure was prepared using RStudio [80].
4.8. Plant Material and Treatments
The seeds of Chinese cabbage (Chiifu-401-42) were grown in plastic pots containing a mixture of soil and vermiculite (3:1) placed in a growth chamber for five weeks. The following growth conditions were maintained: the temperature was set to 24/16 ºC, the photoperiod was 16/8 h, and the relative humidity was 65–70%. Definite treatments (heat and cold) were provided to the seedlings as follows: for heat and cold treatments, seedlings were exposed to 38 ºC and 4 ºC, respectively and samples were collected with an interval of untreated (CK), 4 and 9 h, respectively. Finally, the samples were divided into three biological replicates and kept frozen in liquid nitrogen, and immediately stored at −70 ºC for further analysis.
4.9. RNA Extraction and qRT-PCR validation
For RNA extraction, frozen leaves from both treatments and control plants were sampled. RNA was isolated by using Trizol (Invitrogen, Carlsbad, CA, USA) method, following the manufacturer’s protocols. cDNA was prepared from both treatment and control groups by reverse-transcribing the RNA through Primer Script RT reagent kit (TAKARA, Dalian, China). The list and sequence of the primers used in our study are provided in Table S7. For the validation of the specificity of the primers, BLAST tool was used against the B. rapa genome. The RT-PCR assays were performed with three biological and three technical replicates by following the guidelines explained in our previous study with slight modifications [81]. In brief, each reaction was performed in a 20-μL reaction mixture containing a diluted cDNA sample as the template, 2 × Power SYBR Green PCR Master Mix (Applied Biosystems), and 400 nM each of forward and reverse primers. The reactions were performed using a MyiQ Single-Color Real-Time PCR Detection System (Bio-Rad, Hercules, CA, USA) with the following cycling profile: 94 °C for 30 s, followed by 40 cycles at 94 °C for 10 s, and 58 °C for 30 s. A melting curve (61 cycles at 65 °C for 10 s) was generated to verify the specificity of the amplification. For qRT-PCR analysis, we randomly selected 15 pairs of syntenic paralogs and the B. rapa actin gene Bra028615 (Forward: CTCAGTCCAAAAGAGGTATTCT and Reverse: GTAGAATGTGTGATGCCAGATC) was used as an internal control for normalization. The relative fold expression was calibrated by using the comparative Ct-method. The gene expression levels for SET and JmjC were analyzed by following the previously reported study [30,82].
5. Conclusions
This study is an extensive genome-wide survey of the SET-domain, JmjC-domain, and LSD-domain proteins in B. rapa. We identified 60 SET and 57 JmjC genes by an in silico analysis of the B. rapa genome database. Phylogenetic analysis mapped closest putative orthologs of SET and JmjC from B. rapa and A. thaliana by sequence similarity, which were further divided into seven and nine subgroups, respectively. This classification was further supported by gene structure and motif analyses, with each group sharing a common junction of exon–intron and protein motifs. Transcriptomic analysis of B. rapa SET-domain, JmjC-domain, and LSD-domain proteins indicated that some of the family members exhibited tissue-specific expression. The expression analysis of SET and JmjC genes in response to heat and cold treatments indicated the co-occurrence of different signaling pathways. Our findings on genome-wide identification and expression analysis provide a foundation for the functional dissection of SET, JmjC, and LSD-domain in B. rapa.
Supplementary Materials
The following are available online at https://0-www-mdpi-com.brum.beds.ac.uk/2223-7747/8/12/526/s1, Figure S1: Motif structure and gene structure for SET. (A) The CDS regions are represented by green boxes, respectively. (B) The conserved motifs of SET were determined by MEME with complete protein sequences. The color configuration specifies different motif numbers (1–10). At the bottom of the figure, the relative position is proportionally displayed based on the kilobase scale, Figure S2: Motif structure and gene structure for JmjC. (A) The CDS regions are represented by green boxes, respectively. (B) The conserved motifs of SET were determined by MEME with complete protein sequences. The color configuration specifies different motif numbers (1–10). At the bottom of the figure, the relative position is proportionally displayed based on the kilobase scale. Figure S3: The consensus sequence of conserved motifs of SET and predicted length (amino acids) for each motif. Figure S4: The consensus sequence of conserved motifs of JmjC and predicted length (amino acids) for each motif. Figure S5: Chromosome locations of SET were obtained from the GFF file and displayed using Mapchart. The paralogous pairs are displayed in red. The paralogous pairs are displayed in red and while the three subgenomes (i.e., LF = Least fractionated, MF1 = Medium fractionated and MF2 = Most fractionated genome) of Brassica rapa are also visualized by different color. The ancestral karyotypes (i.e., AK1–AK7) are marked in different colors and the letters inside the circles represent the block positioned in the genome of Brassica rapa. Figure S6: Venn diagram analysis of the tissue-expression of SET (A) and JmjC (B), Figure S7. (A) Heat map of expression profiles (log2 fold-change) for 17 SET and JmjC paralogous pairs in six various tissues: silique, stem, root, flower, leaf, and callus. The Pearson correlation coefficients (PCCs) are also displayed in brackets, while NA indicates no available results for PCC. (B) Venn diagram analysis of the tissue-expression of paralogous pairs for both SET and JmjC. Table S1: The basic description of SET and JmjC genes in Brassica rapa, Table S2: Identification of SET and JmjC syntenic genes between A. thaliana along with three subgenomes of Brassica rapa, Table S3: Ka/Ks calculation of the paralog pairs of SET and JmjC in Brassica rapa, Table S4: The FPKM values of SET and JmjC genes in Brassica rapa, Table S5: Syntenic paralog pairs of SET and JmjC with PC and FPKM values, Table S6: Cis-elements of SET and JmjC genes in Brassica rapa, Table S7: Sequences of SET and JmjC gene primers used for quantitative real-time PCR.
Author Contributions
Conceptualization and methodology, and writing—original draft preparation G.L.; formal analysis, investigation, data curation, writing—review and editing, N.K.; software, X.M.; supervision, project administration, funding acquisition, X.H.
Funding
This study was financially supported by Jiangsu Provincial Natural Science Foundation of China (BK20190519), China Postdoctoral Science Foundation Funded Project (2019M651859) and the Key Projects of National Key Research and Development Plan (2017YFD0101803).
Acknowledgments
The authors express their gratitude to Miss Claire Gahagan (Ottawa Research and Development Center, Agriculture and Agri-Food Canada) for excellent support and serious comments to improve the paper.
Conflicts of Interest
The authors declare no conflict of interest.
References
- Allfrey, V.G.; Mirsky, A.E. Structural Modifications of Histones and their Possible Role in the Regulation of RNA Synthesis. Science 1964, 144, 559. [Google Scholar] [CrossRef] [PubMed]
- Rea, S.; Eisenhaber, F.; O’Carroll, D.; Strahl, B.D.; Sun, Z.W.; Schmid, M.; Opravil, S.; Mechtler, K.; Ponting, C.P.; Allis, C.D.; et al. Regulation of chromatin structure by site-specific histone H3 methyltransferases. Nature 2000, 406, 593–599. [Google Scholar] [CrossRef] [PubMed]
- Dillon, S.C.; Zhang, X.; Trievel, R.C.; Cheng, X. The SET-domain protein superfamily: Protein lysine methyltransferases. Genome Biol. 2005, 6, 227. [Google Scholar] [CrossRef] [PubMed]
- Tsukada, Y.; Fang, J.; Erdjument-Bromage, H.; Warren, M.E.; Borchers, C.H.; Tempst, P.; Zhang, Y. Histone demethylation by a family of JmjC domain-containing proteins. Nature 2006, 439, 811–816. [Google Scholar] [CrossRef] [PubMed]
- Klose, R.J.; Zhang, Y. Regulation of histone methylation by demethylimination and demethylation. Nat. Rev. Mol. Cell Biol. 2007, 8, 307–318. [Google Scholar] [CrossRef]
- Liu, C.; Lu, F.; Cui, X.; Cao, X. Histone methylation in higher plants. Annu. Rev. Plant Biol. 2010, 61, 395–420. [Google Scholar] [CrossRef]
- Johnson, L.; Mollah, S.; Garcia, B.A.; Muratore, T.L.; Shabanowitz, J.; Hunt, D.F.; Jacobsen, S.E. Mass spectrometry analysis of Arabidopsis histone H3 reveals distinct combinations of post-translational modifications. Nucleic Acids Res. 2004, 32, 6511–6518. [Google Scholar] [CrossRef]
- Zhang, K.; Sridhar, V.V.; Zhu, J.; Kapoor, A.; Zhu, J.-K. Distinctive core histone post-translational modification patterns in Arabidopsis thaliana. PLoS ONE 2007, 2, e1210. [Google Scholar] [CrossRef]
- Black, J.C.; Van Rechem, C.; Whetstine, J.R. Histone lysine methylation dynamics: Establishment, regulation, and biological impact. Mol. Cell 2012, 48, 491–507. [Google Scholar] [CrossRef]
- Thorstensen, T.; Grini, P.E.; Aalen, R.B. SET domain proteins in plant development. Biochim. Biophys. Acta 2011, 1809, 407–420. [Google Scholar] [CrossRef]
- Shi, Y.G.; Tsukada, Y. The discovery of histone demethylases. Cold Spring Harb. Perspect. Biol. 2013, 5, a017947. [Google Scholar] [CrossRef] [PubMed]
- Ng, D.W.; Wang, T.; Chandrasekharan, M.B.; Aramayo, R.; Kertbundit, S.; Hall, T.C. Plant SET domain-containing proteins: Structure, function and regulation. Biochim. Biophys. Acta 2007, 1769, 316–329. [Google Scholar] [CrossRef]
- Pontvianne, F.; Blevins, T.; Pikaard, C.S. Arabidopsis histone lysine methyltransferases. Adv. Bot. Res. 2010, 53, 1–22. [Google Scholar] [PubMed]
- Schneider, R.; Bannister, A.J.; Myers, F.A.; Thorne, A.W.; Crane-Robinson, C.; Kouzarides, T. Histone H3 lysine 4 methylation patterns in higher eukaryotic genes. Nat. Cell Biol. 2004, 6, 73–77. [Google Scholar] [CrossRef]
- Yu, Y.; Bu, Z.; Shen, W.-H.; Dong, A. An update on histone lysine methylation in plants. Prog. Nat. Sci. 2009, 19, 407–413. [Google Scholar] [CrossRef]
- Jackson, J.P.; Lindroth, A.M.; Cao, X.; Jacobsen, S.E. Control of CpNpG DNA methylation by the KRYPTONITE histone H3 methyltransferase. Nature 2002, 416, 556–560. [Google Scholar] [CrossRef]
- Fischer, A.; Hofmann, I.; Naumann, K.; Reuter, G. Heterochromatin proteins and the control of heterochromatic gene silencing in Arabidopsis. J. Plant Physiol. 2006, 163, 358–368. [Google Scholar] [CrossRef]
- Ebbs, M.L.; Bender, J. Locus-specific control of DNA methylation by the Arabidopsis SUVH5 histone methyltransferase. Plant Cell 2006, 18, 1166–1176. [Google Scholar] [CrossRef]
- Hennig, L.; Derkacheva, M. Diversity of Polycomb group complexes in plants: Same rules, different players? Trends Genet. 2009, 25, 414–423. [Google Scholar] [CrossRef]
- Kouzarides, T. Chromatin modifications and their function. Cell 2007, 128, 693–705. [Google Scholar] [CrossRef]
- Kwon, C.S.; Lee, D.; Choi, G.; Chung, W.I. Histone occupancy-dependent and -independent removal of H3K27 trimethylation at cold-responsive genes in Arabidopsis. Plant J. Cell Mol. Biol. 2009, 60, 112–121. [Google Scholar] [CrossRef] [PubMed]
- Hu, Y.; Zhang, L.; Zhao, L.; Li, J.; He, S.; Zhou, K.; Yang, F.; Huang, M.; Jiang, L.; Li, L. Trichostatin A selectively suppresses the cold-induced transcription of the ZmDREB1 gene in maize. PLoS ONE 2011, 6, e22132. [Google Scholar] [CrossRef] [PubMed]
- Roy, D.; Paul, A.; Roy, A.; Ghosh, R.; Ganguly, P.; Chaudhuri, S. Differential acetylation of histone H3 at the regulatory region of OsDREB1b promoter facilitates chromatin remodelling and transcription activation during cold stress. PLoS ONE 2014, 9, e100343. [Google Scholar] [CrossRef] [PubMed]
- Boyko, A.; Blevins, T.; Yao, Y.; Golubov, A.; Bilichak, A.; Ilnytskyy, Y.; Hollunder, J.; Meins, F., Jr.; Kovalchuk, I. Transgenerational adaptation of Arabidopsis to stress requires DNA methylation and the function of Dicer-like proteins. PLoS ONE 2010, 5, e9514. [Google Scholar] [CrossRef]
- Naydenov, M.; Baev, V.; Apostolova, E.; Gospodinova, N.; Sablok, G.; Gozmanova, M.; Yahubyan, G. High-temperature effect on genes engaged in DNA methylation and affected by DNA methylation in Arabidopsis. Plant Physiol. Biochem. 2015, 87, 102–108. [Google Scholar] [CrossRef]
- Correia, B.; Valledor, L.; Meijon, M.; Rodriguez, J.L.; Dias, M.C.; Santos, C.; Canal, M.J.; Rodriguez, R.; Pinto, G. Is the interplay between epigenetic markers related to the acclimation of cork oak plants to high temperatures? PLoS ONE 2013, 8, e53543. [Google Scholar] [CrossRef]
- Gao, G.; Li, J.; Li, H.; Li, F.; Xu, K.; Yan, G.; Chen, B.; Qiao, J.; Wu, X. Comparison of the heat stress induced variations in DNA methylation between heat-tolerant and heat-sensitive rapeseed seedlings. Breed. Sci. 2014, 64, 125–133. [Google Scholar] [CrossRef]
- Moghe, G.D.; Shiu, S.H. The causes and molecular consequences of polyploidy in flowering plants. Ann. N. Y. Acad. Sci. 2014, 1320, 16–34. [Google Scholar] [CrossRef]
- Birchler, J.A.; Veitia, R.A. The gene balance hypothesis: From classical genetics to modern genomics. Plant Cell 2007, 19, 395–402. [Google Scholar] [CrossRef]
- Tong, C.; Wang, X.; Yu, J.; Wu, J.; Li, W.; Huang, J.; Dong, C.; Hua, W.; Liu, S. Comprehensive analysis of RNA-seq data reveals the complexity of the transcriptome in Brassica rapa. BMC Genomics 2013, 14, 689. [Google Scholar] [CrossRef]
- The Brassica rapa Genome Sequencing Project Consortium; Wang, X.; Wang, H.; Wang, J.; Sun, R.; Wu, J.; Liu, S.; Bai, Y.; Mun, J.-H.; Bancroft, I.; et al. The genome of the mesopolyploid crop species Brassica rapa. Nat. Genet. 2011, 43, 1035. [Google Scholar] [CrossRef] [PubMed] [Green Version]
- Liu, S.; Liu, Y.; Yang, X.; Tong, C.; Edwards, D.; Parkin, I.A.P.; Zhao, M.; Ma, J.; Yu, J.; Huang, S.; et al. The Brassica oleracea genome reveals the asymmetrical evolution of polyploid genomes. Nat. Commun. 2014, 5, 3930. [Google Scholar] [CrossRef] [PubMed]
- Fan, S.; Wang, J.; Lei, C.; Gao, C.; Yang, Y.; Li, Y.; An, N.; Zhang, D.; Han, M. Identification and characterization of histone modification gene family reveal their critical responses to flower induction in apple. BMC Plant Biol. 2018, 18, 173. [Google Scholar] [CrossRef] [PubMed] [Green Version]
- Xu, J.; Xu, H.; Liu, Y.; Wang, X.; Xu, Q.; Deng, X. Genome-wide identification of sweet orange (Citrus sinensis) histone modification gene families and their expression analysis during the fruit development and fruit-blue mold infection process. Front. Plant Sci. 2015, 6, 607. [Google Scholar] [CrossRef] [PubMed] [Green Version]
- Aiese Cigliano, R.; Sanseverino, W.; Cremona, G.; Ercolano, M.R.; Conicella, C.; Consiglio, F.M. Genome-wide analysis of histone modifiers in tomato: Gaining an insight into their developmental roles. BMC Genomics 2013, 14, 57. [Google Scholar] [CrossRef] [Green Version]
- Gu, T.; Han, Y.; Huang, R.; McAvoy, R.J.; Li, Y. Identification and characterization of histone lysine methylation modifiers in Fragaria vesca. Sci. Rep. 2016, 6, 23581. [Google Scholar] [CrossRef] [Green Version]
- Dong, H.; Liu, D.; Han, T.; Zhao, Y.; Sun, J.; Lin, S.; Cao, J.; Chen, Z.-H.; Huang, L. Diversification and evolution of the SDG gene family in Brassica rapa after the whole genome triplication. Sci. Rep. 2015, 5, 16851. [Google Scholar] [CrossRef] [Green Version]
- Huang, Y.; Liu, C.; Shen, W.-H.; Ruan, Y. Phylogenetic analysis and classification of the Brassica rapa SET-domain protein family. BMC Plant Biol. 2011, 11, 175. [Google Scholar] [CrossRef] [Green Version]
- Kooistra, S.M.; Helin, K. Molecular mechanisms and potential functions of histone demethylases. Nat. Rev. Mol. Cell Biol. 2012, 13, 297–311. [Google Scholar] [CrossRef]
- Han, Y.; Li, X.; Cheng, L.; Liu, Y.; Wang, H.; Ke, D.; Yuan, H.; Zhang, L.; Wang, L. Genome-Wide analysis of soybean jmjc domain-containing proteins suggests evolutionary conservation following whole-genome duplication. Front. Plant Sci. 2016, 7, 1800. [Google Scholar] [CrossRef] [Green Version]
- Qian, S.; Wang, Y.; Ma, H. Expansion and functional divergence of jumonji c-containing histone demethylases: Significance of duplications in ancestral angiosperms and vertebrates. Plant Physiol. 2015, 168, 1321–1337. [Google Scholar] [CrossRef] [PubMed]
- Cheng, F.; Mandakova, T.; Wu, J.; Xie, Q.; Lysak, M.A.; Wang, X. Deciphering the diploid ancestral genome of the mesohexaploid Brassica rapa. Plant Cell 2013, 25, 1541–1554. [Google Scholar] [CrossRef] [PubMed] [Green Version]
- Schranz, M.E.; Lysak, M.A.; Mitchell-Olds, T. The ABC’s of comparative genomics in the Brassicaceae: Building blocks of crucifer genomes. Trends Plant Sci. 2006, 11, 535–542. [Google Scholar] [CrossRef] [PubMed]
- Maher, C.; Stein, L.; Ware, D. Evolution of Arabidopsis microRNA families through duplication events. Genome Res. 2006, 16, 510–519. [Google Scholar] [CrossRef] [Green Version]
- Wu, P.; Wang, W.; Li, Y.; Hou, X. Divergent evolutionary patterns of the MAPK cascade genes in Brassica rapa and plant phylogenetics. Hortic. Res. 2017, 4, 17079. [Google Scholar] [CrossRef] [Green Version]
- Lei, L.; Zhou, S.L.; Ma, H.; Zhang, L.S. Expansion and diversification of the SET domain gene family following whole-genome duplications in Populus trichocarpa. BMC Evol. Biol. 2012, 12, 51. [Google Scholar] [CrossRef] [Green Version]
- Marquez, Y.; Hopfler, M.; Ayatollahi, Z.; Barta, A.; Kalyna, M. Unmasking alternative splicing inside protein-coding exons defines exitrons and their role in proteome plasticity. Genome Res. 2015, 25, 995–1007. [Google Scholar] [CrossRef] [Green Version]
- Aquea, F.; Vega, A.; Timmermann, T.; Poupin, M.J.; Arce-Johnson, P. Genome-wide analysis of the SET domain group family in grapevine. Plant Cell Rep. 2011, 30, 1087–1097. [Google Scholar] [CrossRef]
- Zhu, X.; Ma, H.; Chen, Z. Phylogenetics and evolution of Su(var)3-9 SET genes in land plants: Rapid diversification in structure and function. BMC Evol. Biol. 2011, 11, 63. [Google Scholar] [CrossRef] [Green Version]
- Lu, F.; Li, G.; Cui, X.; Liu, C.; Wang, X.J.; Cao, X. Comparative analysis of JmjC domain-containing proteins reveals the potential histone demethylases in Arabidopsis and rice. J. Integr. Plant Biol. 2008, 50, 886–896. [Google Scholar] [CrossRef]
- Edger, P.P.; Pires, J.C. Gene and genome duplications: The impact of dosage-sensitivity on the fate of nuclear genes. Chromosome Res. 2009, 17, 699–717. [Google Scholar] [CrossRef] [PubMed] [Green Version]
- Jiao, Y.; Shi, C.; Edil, B.H.; de Wilde, R.F.; Klimstra, D.S.; Maitra, A.; Schulick, R.D.; Tang, L.H.; Wolfgang, C.L.; Choti, M.A.; et al. DAXX/ATRX, MEN1, and mTOR pathway genes are frequently altered in pancreatic neuroendocrine tumors. Science 2011, 331, 1199–1203. [Google Scholar] [CrossRef] [PubMed] [Green Version]
- Ohno, S.; Wolf, U.; Atkin, N.B. Evolution from fish to mammals by gene duplication. Hereditas 1968, 59, 169–187. [Google Scholar] [CrossRef] [PubMed]
- Hurles, M. Gene Duplication: The Genomic trade in spare parts. PLOS Biol. 2004, 2, e206. [Google Scholar] [CrossRef] [PubMed]
- Kim, J.; Lee, J.; Choi, J.P.; Park, I.; Yang, K.; Kim, M.K.; Lee, Y.H.; Nou, I.S.; Kim, D.S.; Min, S.R.; et al. Functional innovations of three chronological mesohexaploid Brassica rapa genomes. BMC Genomics 2014, 15, 606. [Google Scholar] [CrossRef] [Green Version]
- Li, J.; Zhang, Z.; Vang, S.; Yu, J.; Wong, G.K.; Wang, J. Correlation between Ka/Ks and Ks is related to substitution model and evolutionary lineage. J. Mol. Evol. 2009, 68, 414–423. [Google Scholar] [CrossRef]
- Lynch, M.; Conery, J.S. The evolutionary fate and consequences of duplicate genes. Science 2000, 290, 1151–1155. [Google Scholar] [CrossRef] [Green Version]
- Shazadee, H.; Khan, N. Identification and expression profiling of protein phosphatases (PP2C) gene family in Gossypium hirsutum L. Int. J. Mol. Sci. 2019, 20, 1395. [Google Scholar] [CrossRef] [Green Version]
- Avramova, Z. Transcriptional ‘memory’ of a stress: Transient chromatin and memory (epigenetic) marks at stress-response genes. Plant J. Cell Mol. Biol. 2015, 83, 149–159. [Google Scholar] [CrossRef]
- Slotkin, R.K.; Martienssen, R. Transposable elements and the epigenetic regulation of the genome. Nat. Rev. Genet. 2007, 8, 272–285. [Google Scholar] [CrossRef]
- Kim, J.M.; To, T.K.; Ishida, J.; Morosawa, T.; Kawashima, M.; Matsui, A.; Toyoda, T.; Kimura, H.; Shinozaki, K.; Seki, M. Alterations of lysine modifications on the histone H3 N-tail under drought stress conditions in Arabidopsis thaliana. Plant Cell Physiol. 2008, 49, 1580–1588. [Google Scholar] [CrossRef] [PubMed] [Green Version]
- Luo, M.; Liu, X.; Singh, P.; Cui, Y.; Zimmerli, L.; Wu, K. Chromatin modifications and remodeling in plant abiotic stress responses. Biochim. Biophys. Acta 2012, 1819, 129–136. [Google Scholar] [CrossRef] [PubMed]
- Berr, R.B. A Cornerstone for Plant Responses to Environmental Stresses? Abiotic and Biotic Stress in Plants—Recent Advances and Future Perspectives; IntechOpen: London, UK, 2016. [Google Scholar]
- Miller, M.J.; Barrett-Wilt, G.A.; Hua, Z.; Vierstra, R.D. Proteomic analyses identify a diverse array of nuclear processes affected by small ubiquitin-like modifier conjugation in Arabidopsis. Proc. Natl. Acad. Sci. USA 2010, 107, 16512–16517. [Google Scholar] [CrossRef] [PubMed] [Green Version]
- Song, J.; Angel, A.; Howard, M.; Dean, C. Vernalization—A cold-induced epigenetic switch. J. Cell Sci. 2012, 125, 3723–3731. [Google Scholar] [CrossRef] [PubMed] [Green Version]
- Chinnusamy, V.; Zhu, J.; Zhu, J.K. Cold stress regulation of gene expression in plants. Trends Plant Sci. 2007, 12, 444–451. [Google Scholar] [CrossRef] [PubMed]
- Matsui, A.; Ishida, J.; Morosawa, T.; Mochizuki, Y.; Kaminuma, E.; Endo, T.A.; Okamoto, M.; Nambara, E.; Nakajima, M.; Kawashima, M.; et al. Arabidopsis transcriptome analysis under drought, cold, high-salinity and ABA treatment conditions using a tiling array. Plant Cell Physiol. 2008, 49, 1135–1149. [Google Scholar] [CrossRef] [Green Version]
- To, T.K.; Nakaminami, K.; Kim, J.M.; Morosawa, T.; Ishida, J.; Tanaka, M.; Yokoyama, S.; Shinozaki, K.; Seki, M. Arabidopsis HDA6 is required for freezing tolerance. Biochem. Biophys. Res. Commun. 2011, 406, 414–419. [Google Scholar] [CrossRef]
- Kawahara, Y.; de la Bastide, M.; Hamilton, J.P.; Kanamori, H.; McCombie, W.R.; Ouyang, S.; Schwartz, D.C.; Tanaka, T.; Wu, J.; Zhou, S.; et al. Improvement of the Oryza sativa nipponbare reference genome using next generation sequence and optical map data. Rice 2013, 6, 4. [Google Scholar] [CrossRef] [Green Version]
- Finn, R.D.; Bateman, A.; Clements, J.; Coggill, P.; Eberhardt, R.Y.; Eddy, S.R.; Heger, A.; Hetherington, K.; Holm, L.; Mistry, J.; et al. Pfam: The protein families database. Nucleic Acids Res. 2014, 42, D222–D230. [Google Scholar] [CrossRef] [Green Version]
- Letunic, I.; Doerks, T.; Bork, P. SMART 7: Recent updates to the protein domain annotation resource. Nucleic Acids Res. 2012, 40, D302–D305. [Google Scholar] [CrossRef]
- Edgar, R.C. MUSCLE: Multiple sequence alignment with high accuracy and high throughput. Nucleic Acids Res. 2004, 32, 1792–1797. [Google Scholar] [CrossRef] [PubMed] [Green Version]
- Kumar, S.; Stecher, G.; Tamura, K. MEGA7: Molecular evolutionary genetics analysis version 7.0 for bigger datasets. Mol. Biol. Evol. 2016, 33, 1870–1874. [Google Scholar] [CrossRef] [PubMed] [Green Version]
- Koch, M.A.; Haubold, B.; Mitchell-Olds, T. Comparative evolutionary analysis of chalcone synthase and alcohol dehydrogenase loci in Arabidopsis, arabis, and related genera (Brassicaceae). Mol. Biol. Evol. 2000, 17, 1483–1498. [Google Scholar] [CrossRef] [PubMed] [Green Version]
- Bailey, T.L.; Boden, M.; Buske, F.A.; Frith, M.; Grant, C.E.; Clementi, L.; Ren, J.; Li, W.W.; Noble, W.S. MEME SUITE: Tools for motif discovery and searching. Nucleic Acids Res. 2009, 37, W202–W208. [Google Scholar] [CrossRef] [PubMed]
- Wang, Y.; Wang, Q.; Zhao, Y.; Han, G.; Zhu, S. Systematic analysis of maize class III peroxidase gene family reveals a conserved subfamily involved in abiotic stress response. Gene 2015, 566, 95–108. [Google Scholar] [CrossRef]
- Lescot, M.; Déhais, P.; Thijs, G.; Marchal, K.; Moreau, Y.; Van de Peer, Y.; Rouzé, P.; Rombauts, S. PlantCARE, a database of plant cis-acting regulatory elements and a portal to tools for in silico analysis of promoter sequences. Nucleic Acids Res. 2002, 30, 325–327. [Google Scholar] [CrossRef]
- Voorrips, R.E. MapChart: Software for the graphical presentation of linkage maps and QTLs. J. Hered. 2002, 93, 77–78. [Google Scholar] [CrossRef] [Green Version]
- Krzywinski, M.; Schein, J.; Birol, İ.; Connors, J.; Gascoyne, R.; Horsman, D.; Jones, S.J.; Marra, M.A. Circos: An information aesthetic for comparative genomics. Genome Res. 2009, 19, 1639–1645. [Google Scholar] [CrossRef] [Green Version]
- Khan, N.; Hu, C.-M.; Amjad Khan, W.; Hou, X. Genome-Wide identification, classification, and expression divergence of glutathione-transferase family in Brassica rapa under multiple hormone treatments. BioMed Res. Int. 2018. [Google Scholar] [CrossRef] [Green Version]
- Wang, W.; Wu, P.; Li, Y.; Hou, X. Genome-wide analysis and expression patterns of ZF-HD transcription factors under different developmental tissues and abiotic stresses in Chinese cabbage. Mol. Genet. Genomics 2016, 291, 1451–1464. [Google Scholar] [CrossRef]
- Khan, N.; Hu, C.-M.; Amjad Khan, W.; Naseri, E.; Ke, H.; Huijie, D.; Hou, X. Evolution and expression divergence of E2 gene family under multiple abiotic and phytohormones stresses in Brassica rapa. BioMed Res. Int. 2018. [Google Scholar] [CrossRef] [PubMed] [Green Version]
Figure 1.
Phylogenetic relationship of SET (A) and JmjC (B) between B. rapa and A. thaliana. The phylogenetic tree was constructed by MEGA 7 using the Maximum Likelihood Method (1000 bootstrap). Genes of B. rapa and A. thaliana are marked with different colors.
Figure 1.
Phylogenetic relationship of SET (A) and JmjC (B) between B. rapa and A. thaliana. The phylogenetic tree was constructed by MEGA 7 using the Maximum Likelihood Method (1000 bootstrap). Genes of B. rapa and A. thaliana are marked with different colors.

Figure 2.
The ratio SET and JmjC, and their overlap among three subgenomes (i.e., LF = Least fractionated, MF1 = Medium Fractionated and MF2 = Most Fractionated genome) of B. rapa.
Figure 2.
The ratio SET and JmjC, and their overlap among three subgenomes (i.e., LF = Least fractionated, MF1 = Medium Fractionated and MF2 = Most Fractionated genome) of B. rapa.

Figure 3.
(A) Chromosome locations of JmjC were obtained from the GFF file and displayed using Mapchart. The paralogous pairs are displayed in red and while the three subgenomes (i.e., LF = Least fractionated, MF1 = Medium Fractionated and MF2 = Most Fractionated genome) of Brassica rapa are also visualized by different color. The ancestral karyotypes (i.e., AK1–AK7) are marked in different colors and the letters inside the circles represent the block positioned in the genome of B. rapa. (B) It represents the proportion of AK in B. rapa genome.

Figure 4.
The ratio between Ks and Ka for paralogous gene pairs in Brassica rapa.

Figure 5.
Heat map of expression profiles (log2 fold-change) for SET (A) and JmjC (B) in the six various tissues: stem, flower, callus, silique, root, and leaf. The expression levels are indicated by the color bar.
Figure 5.
Heat map of expression profiles (log2 fold-change) for SET (A) and JmjC (B) in the six various tissues: stem, flower, callus, silique, root, and leaf. The expression levels are indicated by the color bar.

Figure 6.
(A) Relative expression (log2 fold-change) analysis of SET and JmjC genes under CK, heat and cold stress treatments in B. rapa. (B) Pearson’s correlation coefficients (PCCs) of relative gene expression of 15 paralogous pairs used for RT-PCR analysis during heat and cold stress treatments.
Figure 6.
(A) Relative expression (log2 fold-change) analysis of SET and JmjC genes under CK, heat and cold stress treatments in B. rapa. (B) Pearson’s correlation coefficients (PCCs) of relative gene expression of 15 paralogous pairs used for RT-PCR analysis during heat and cold stress treatments.

© 2019 by the authors. Licensee MDPI, Basel, Switzerland. This article is an open access article distributed under the terms and conditions of the Creative Commons Attribution (CC BY) license (http://creativecommons.org/licenses/by/4.0/).
Share and Cite
MDPI and ACS Style
Liu, G.; Khan, N.; Ma, X.; Hou, X. Identification, Evolution, and Expression Profiling of Histone Lysine Methylation Moderators in Brassica rapa. Plants 2019, 8, 526. https://0-doi-org.brum.beds.ac.uk/10.3390/plants8120526
AMA Style
Liu G, Khan N, Ma X, Hou X. Identification, Evolution, and Expression Profiling of Histone Lysine Methylation Moderators in Brassica rapa. Plants. 2019; 8(12):526. https://0-doi-org.brum.beds.ac.uk/10.3390/plants8120526
Chicago/Turabian StyleLiu, Gaofeng, Nadeem Khan, Xiaoqing Ma, and Xilin Hou. 2019. "Identification, Evolution, and Expression Profiling of Histone Lysine Methylation Moderators in Brassica rapa" Plants 8, no. 12: 526. https://0-doi-org.brum.beds.ac.uk/10.3390/plants8120526
Note that from the first issue of 2016, this journal uses article numbers instead of page numbers. See further details here.