Article

A Genome-Wide Survey of MATE Transporters in Brassicaceae and Unveiling Their Expression Profiles under Abiotic Stress in Rapeseed

1
Chongqing Engineering Research Center for Rapeseed, College of Agronomy and Biotechnology, Southwest University, No. 2 Tiansheng Road, Beibei, Chongqing 400715, China
2
Academy of Agricultural Sciences, Southwest University, Chongqing 400715, China
*
Authors to whom correspondence should be addressed.
These authors contributed equally to this work.
Submission received: 16 July 2020 / Revised: 14 August 2020 / Accepted: 17 August 2020 / Published: 20 August 2020
(This article belongs to the Special Issue Heavy Metal Stress in Plants)

Abstract

:
The multidrug and toxic compound extrusion (MATE) protein family is important in the export of toxins and other substrates, but detailed information on this family in the Brassicaceae has not yet been reported compared to Arabidopsis thaliana. In this study, we identified 57, 124, 81, 85, 130, and 79 MATE genes in A. thaliana, Brassica napus, Brassica oleracea, Brassica rapa, Brassica juncea, and Brassica nigra, respectively, which were unevenly distributed on chromosomes owing to both tandem and segmental duplication events. Phylogenetic analysis showed that these genes could be classified into four subgroups, shared high similarity and conservation within each group, and have evolved mainly through purifying selection. Furthermore, numerous B. napus MATE genes showed differential expression between tissues and developmental stages and between plants treated with heavy metals or hormones and untreated control plants. This differential expression was especially pronounced for the Group 2 and 3 BnaMATE genes, indicating that they may play important roles in stress tolerance and hormone induction. Our results provide a valuable foundation for the functional dissection of the different BnaMATE homologs in B. napus and its parental lines, as well as for the breeding of more stress-tolerant B. napus genotypes.

1. Introduction

In nature, plants are exposed to various exogenous and endogenous toxins during their lifespans, and they have developed a series of adaptive response mechanisms to dispose of and detoxify toxic compounds [1]. A group of secondary transporters first reported in Vibrio parahaemolyticus and Escherichia coli [2,3], the MATE (multidrug and toxic compound extrusion or multi-antimicrobial extrusion)/DTX (detoxification efflux carrier) family, is a universal family of proteins involved in the metabolism of toxic compounds and organic acids. Members of the MATE family are composed of 400–700 amino acids and contain 12 transmembrane helices [1,4]. However, the MATE gene family lacks a conserved consensus sequence, and MATE proteins share only about 40% sequence similarity [1]. Numerous studies indicate that MATE family proteins play widespread roles in various biological processes in plants, such as secondary metabolite transport [5,6,7,8,9,10], disease resistance [11,12], the detoxification of heavy metals [13,14,15], and the transport of plant hormones [16,17,18]. Numerous studies have characterized MATE genes from a wide range of living organisms, showing that they have even greater diversity in plant genomes than in mammalian genomes [19]. For example, 56 MATE genes have been isolated from Arabidopsis thaliana [13]. The MATE gene family has also been widely characterized in other plant species, including rice (Oryza sativa) (52) [20,21], maize (Zea mays) (49) [22], tomato (Solanum lycopersicum) (67) [4], upland cotton (Gossypium hirsutum) (72) [23], and soybean (Glycine max) (117) [24]. Recently, 67 MATE genes were identified in the C. sinensis genome [25]. However, genome-wide analysis of the MATE family in Brassicaceae species has been limited, and no such studies have been reported in rapeseed (Brassica napus).
In the Brassicaceae, the relationships of three diploid species (B. rapa, AA, 2n = 20; B. nigra, BB, 2n =  16; and B. oleracea, CC, 2n = 18) and three amphidiploid plants (B. juncea; AABB, 2n = 36; B. napus, AACC, 2n =  38; and Brassica carinata, BBCC, 2n = 34) have been thoroughly described according to the “triangle of U” theory [26,27], which also provides an excellent evolutionary model to investigate the expansion of gene families [28,29]. During the course of evolution, the Brassicaceae have experienced ɑ and β duplication events, as well as a triplication event specific to the Brassica clade compared with the model plant A. thaliana [30]. These whole-genome duplication (WGD) events, along with the merger of the two progenitor genomes, have resulted in copious gene duplication in the B. napus genome, followed by substantial gene loss [31]. Thus, Brassica is regarded as an ideal model for investigating the evolution of polyploidy [29]. However, no systematic and comprehensive study of this family is reported among Brassicaceae species. To date, with the completion of five Brassicaceae species (B. napus, B. oleracea, B. rapa, B. juncea, and B. nigra) genome sequencing [29,32,33,34,35,36], an investigation of the MATE gene family in Brassicaceae is now feasible and can not only provide insights into the evolutionary mechanisms of hybridization (allopolyploidy) among these species, but also lay a theoretical basis for a clearer understanding of the mechanisms involved in plant stress defense.
In present study, we identified MATE family genes in the Brassicaceae genomes available in the Brassica database (BRAD) [37] using the 57 MATE sequences from A. thaliana as queries. Then, we performed a detailed phylogenetic analysis of the structure, motifs, chromosome distribution, and duplication of these genes, as well as an evolutionary analysis. We also investigated the expression profiles of MATE genes in different tissues of B. napus and during responses to hormone treatment and heavy metal stress. Our results provide important information about the origin and evolution of the MATE family in Brassicaceae and lay a foundation for the further functional characterization of MATE genes in B. napus.

2. Results

2.1. Identification of MATE Transporters in Brassicaceae Species

Using 57 AtMATE protein sequences as queries, we identified 499 putative MATE genes from various Brassicaceae species, including 124 BnaMATE, 85 BraMATE, 81 BolMATE, 79 BniMATE, and 130 BjuMATE genes. Based on their homology relationship with the respective A. thaliana genes, these genes were named BnaMATE1 to BnaMATE57 for B. napus, BraMATE1 to BraMATE57 for B. rapa, BolMATE1 to BolMATE57 for B. oleracea, BniMATE1 to BniMATE57 for B. nigra and BjuMATE1 to BjuMATE57 for B. juncea, respectively (Figure 1, Table S2). Eight AtMATE genes (AtMATE2, AtMATE10, AtMATE11, AtMATE20, AtMATE22, AtMATE26, AtMATE32, and AtMATE57) had no orthologs among the other five species, which was indicative of gene loss during evolution between A. thaliana and Brassica species.
Basic information about these MATE genes in Brassicaceae species, including name, locus, molecular weight, subcellular localization, and other related information, is listed in Table S2. In B. napus, we found that BnaMATE genes encode proteins of 124 (BnaMATE56d) to 971 (BnaMATE15c) amino acids, with an average length of 489 amino acids. The relative molecular weights (MWs) ranged from 13.07 kDa (BnaMATE56d) to 107.53 kDa (BnaMATE15c), and theoretical pI (isoelectric point) values ranged from 4.89 (BnaMATE40d) to 10.55 (BnaMATE17d). Similarly, individual MATE proteins varied in length and physicochemical properties among the other five species (Table S2). These results suggest that MATE transporters might have changed between species to serve different functions.
Previous studies have localized MATE transporters to the plasma membrane, chloroplast, cytoplasm, vacuole, and endoplasmic reticulum, as well as extracellularly [24,38,39]. Here, we found the highest proportion localized in the plasma membrane (109 genes), accounting for >80% of all BnaMATE genes in B. napus; four genes were expressed in chloroplasts and 11 genes were expressed in the vacuoles. The trend in the other four species was similar, with 91.8% (B. rapa), 81.5% (B. oleracea), 91.5% (B. juncea), and 83.5% (B. nigra) of MATE genes, respectively (Table S2), expressed in the plasma membrane, which was consistent with previous results [24,39]. This strong representation of MATEs in the plasma membrane is consistent with their primary role of maintaining membrane integrity through the exclusion of toxins from plants.

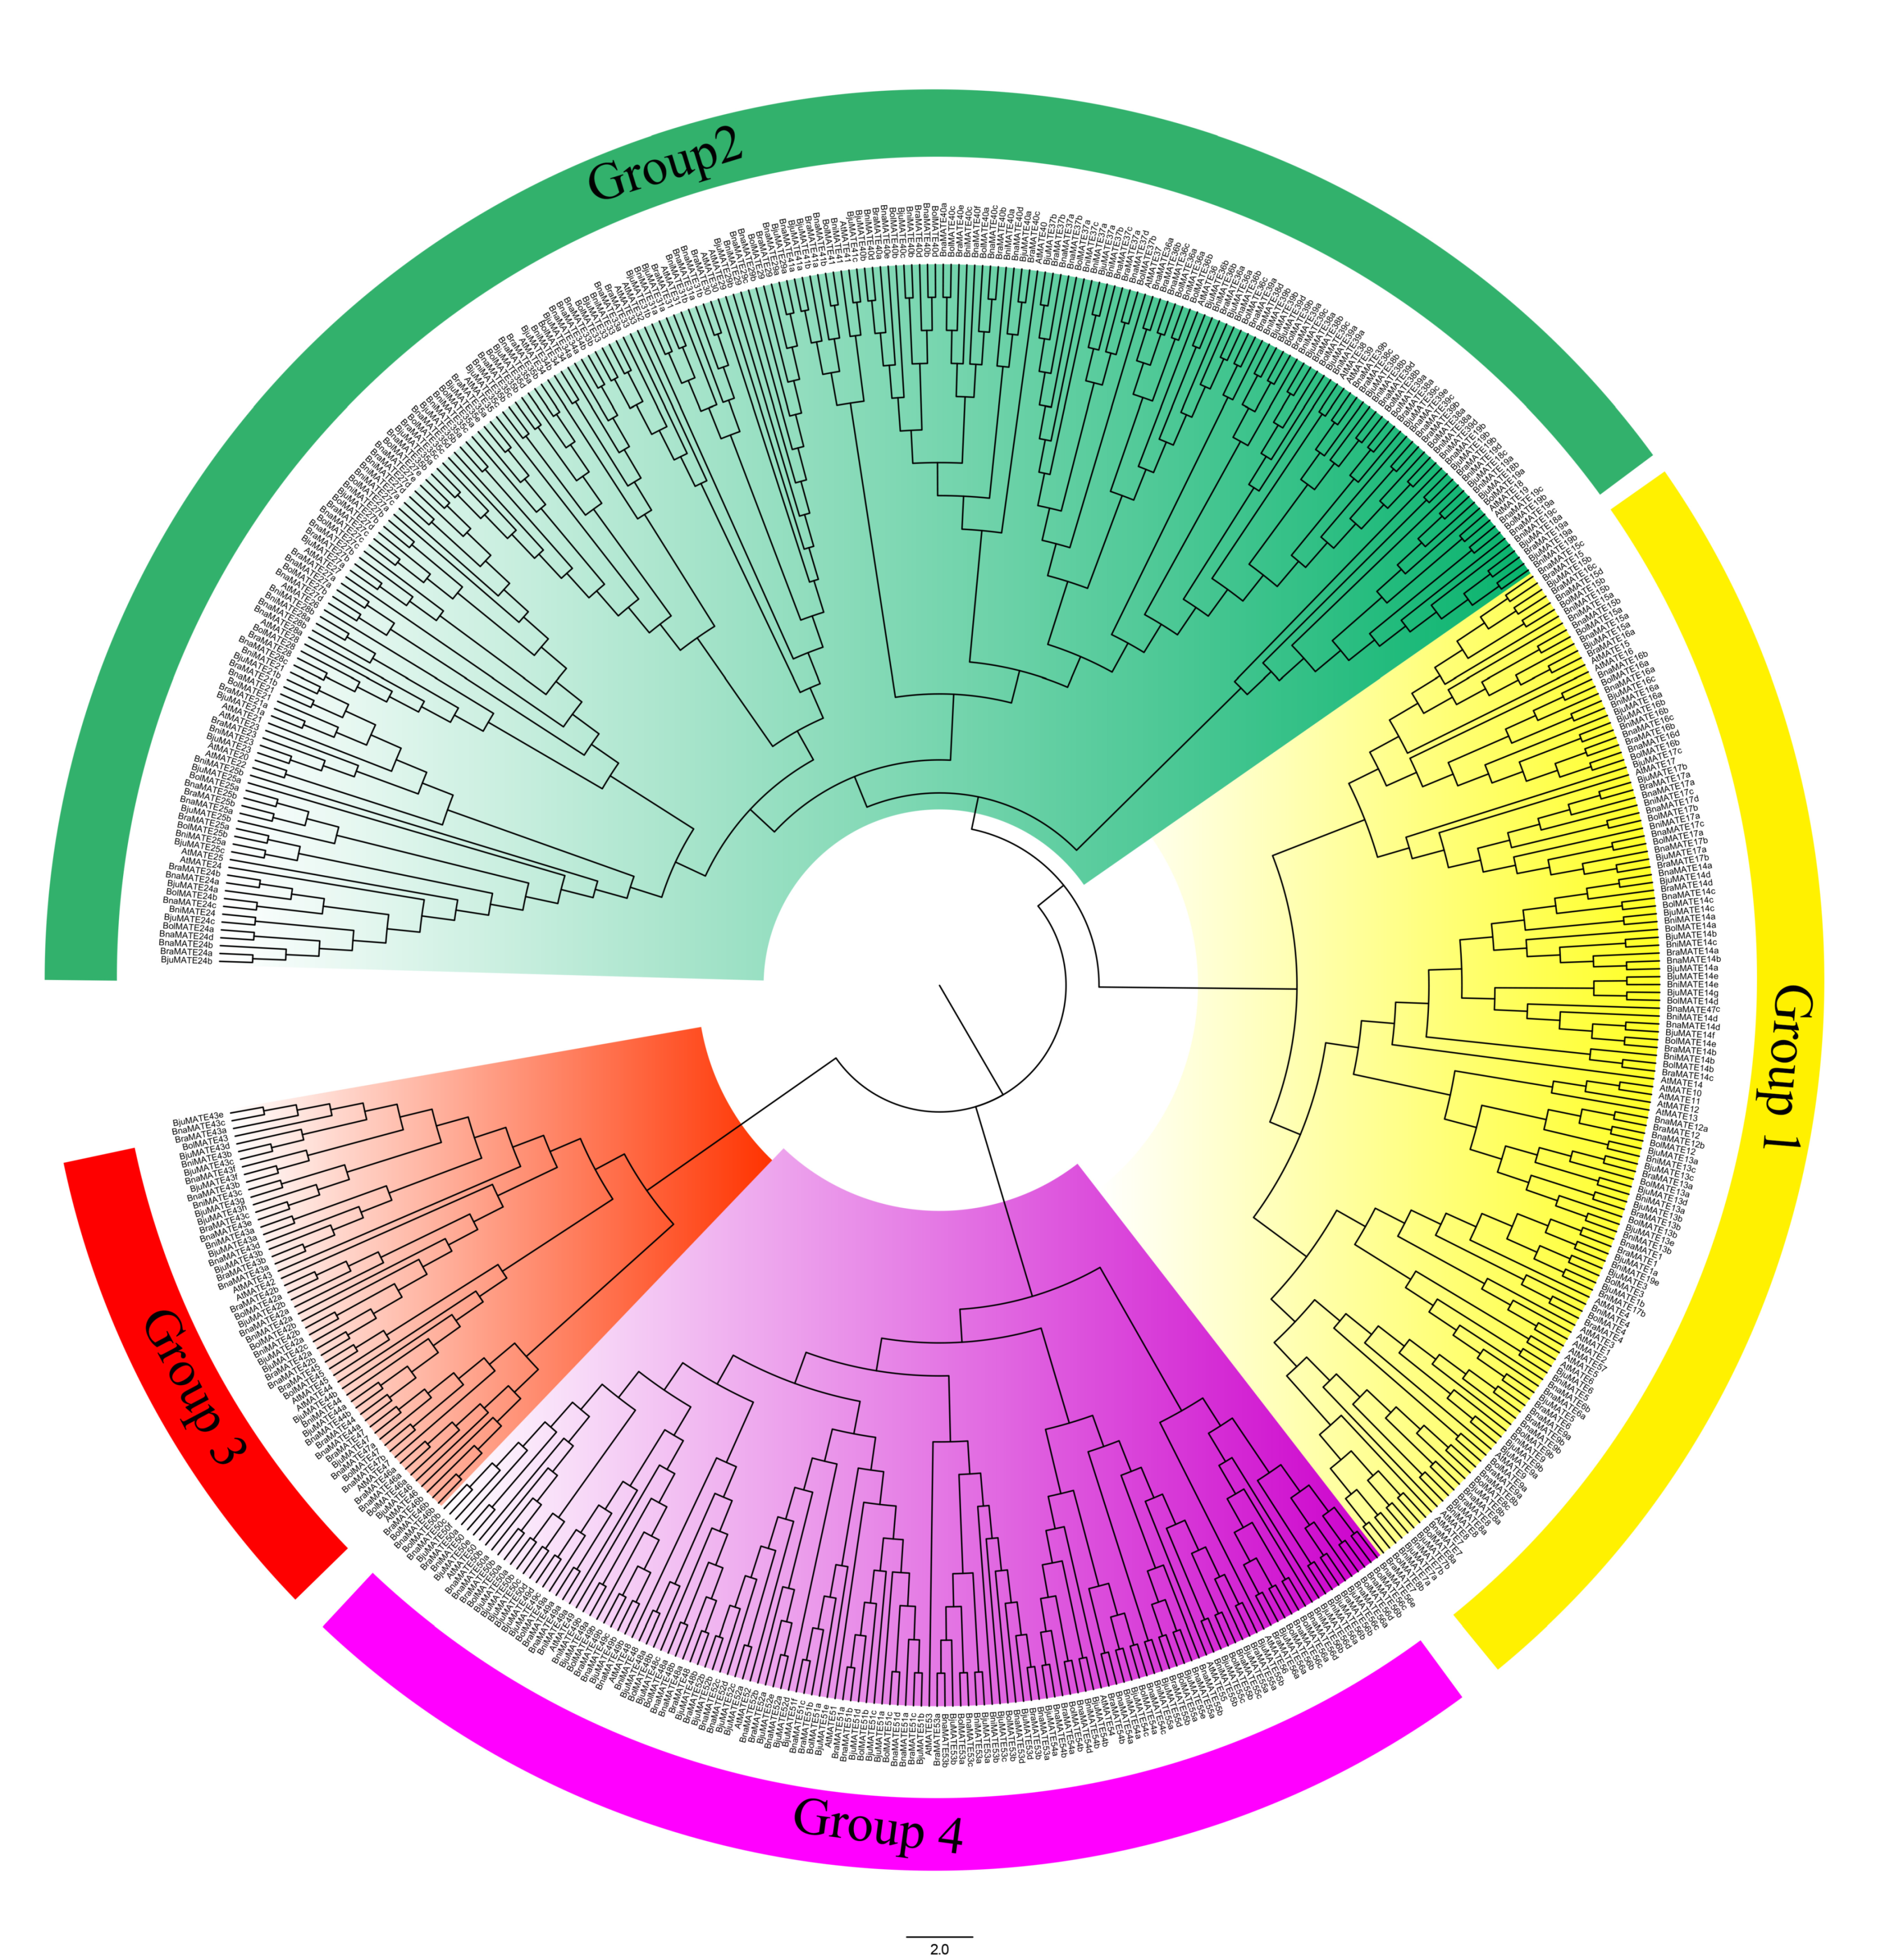
2.2. Phylogenetic Analysis of the MATE Transporters

To investigate the evolutionary relationships among MATE transporters between A. thaliana and various Brassicaceae species, we divided the 556 MATE transporters into four categories, denoted Groups 1–4 (Table 1 and Figure 1). Group 2 was the largest clade, with 230 members (24 in A. thaliana, 51 in B. napus, 37 in B. rapa, 34 in B. oleracea, 44 in B. juncea, and 40 in B. nigra), and Group 3 was the smallest, with 59 members (6 in A. thaliana, 15 in B. napus, 10 in B. rapa, 7 in B. oleracea, 15 in B. juncea, and 6 in B. nigra); Groups 1 and 4 contained 137 and 130 members, respectively (Figure 1). All of the MATE transporters we identified in Brassicaceae were classified into previously defined subgroups along with A. thaliana MATE proteins, suggesting that they might share similar functions within the subfamilies. In addition, the classifications were consistent with those of soybean MATE transporters [1,23,24], indicating that the classification adopted in this study was accurate and conforms to previous findings about plant MATE proteins.

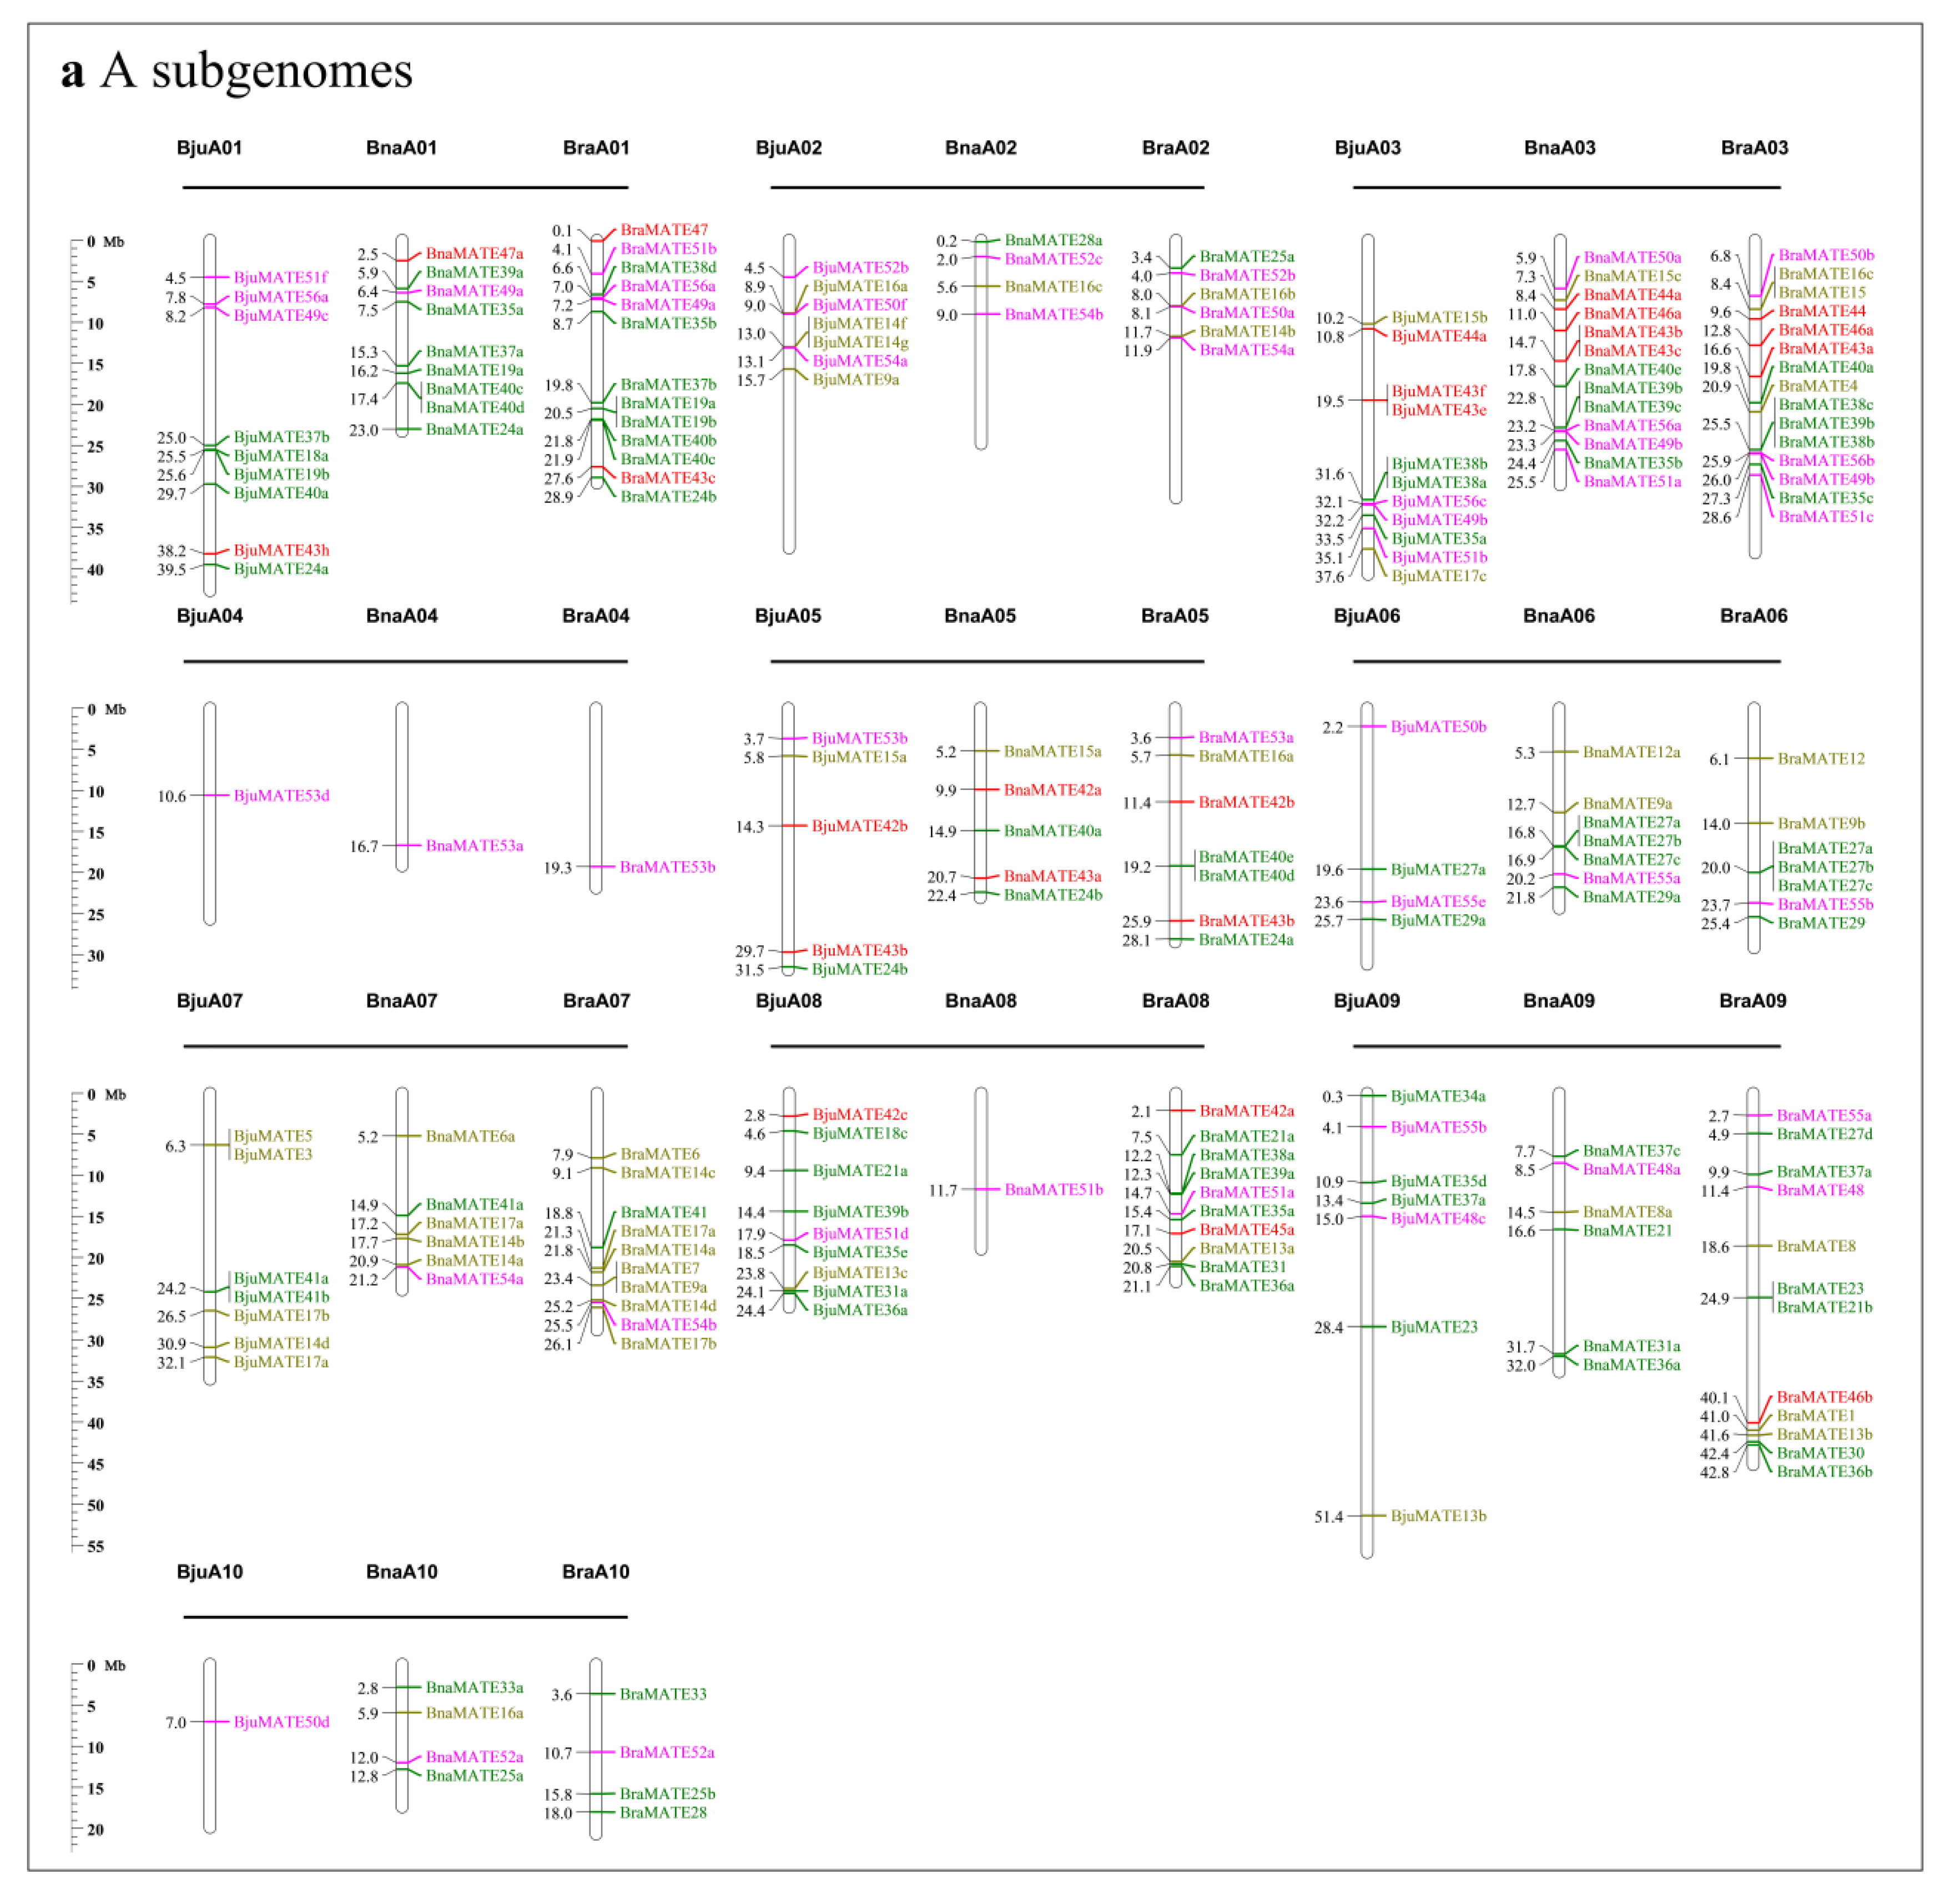
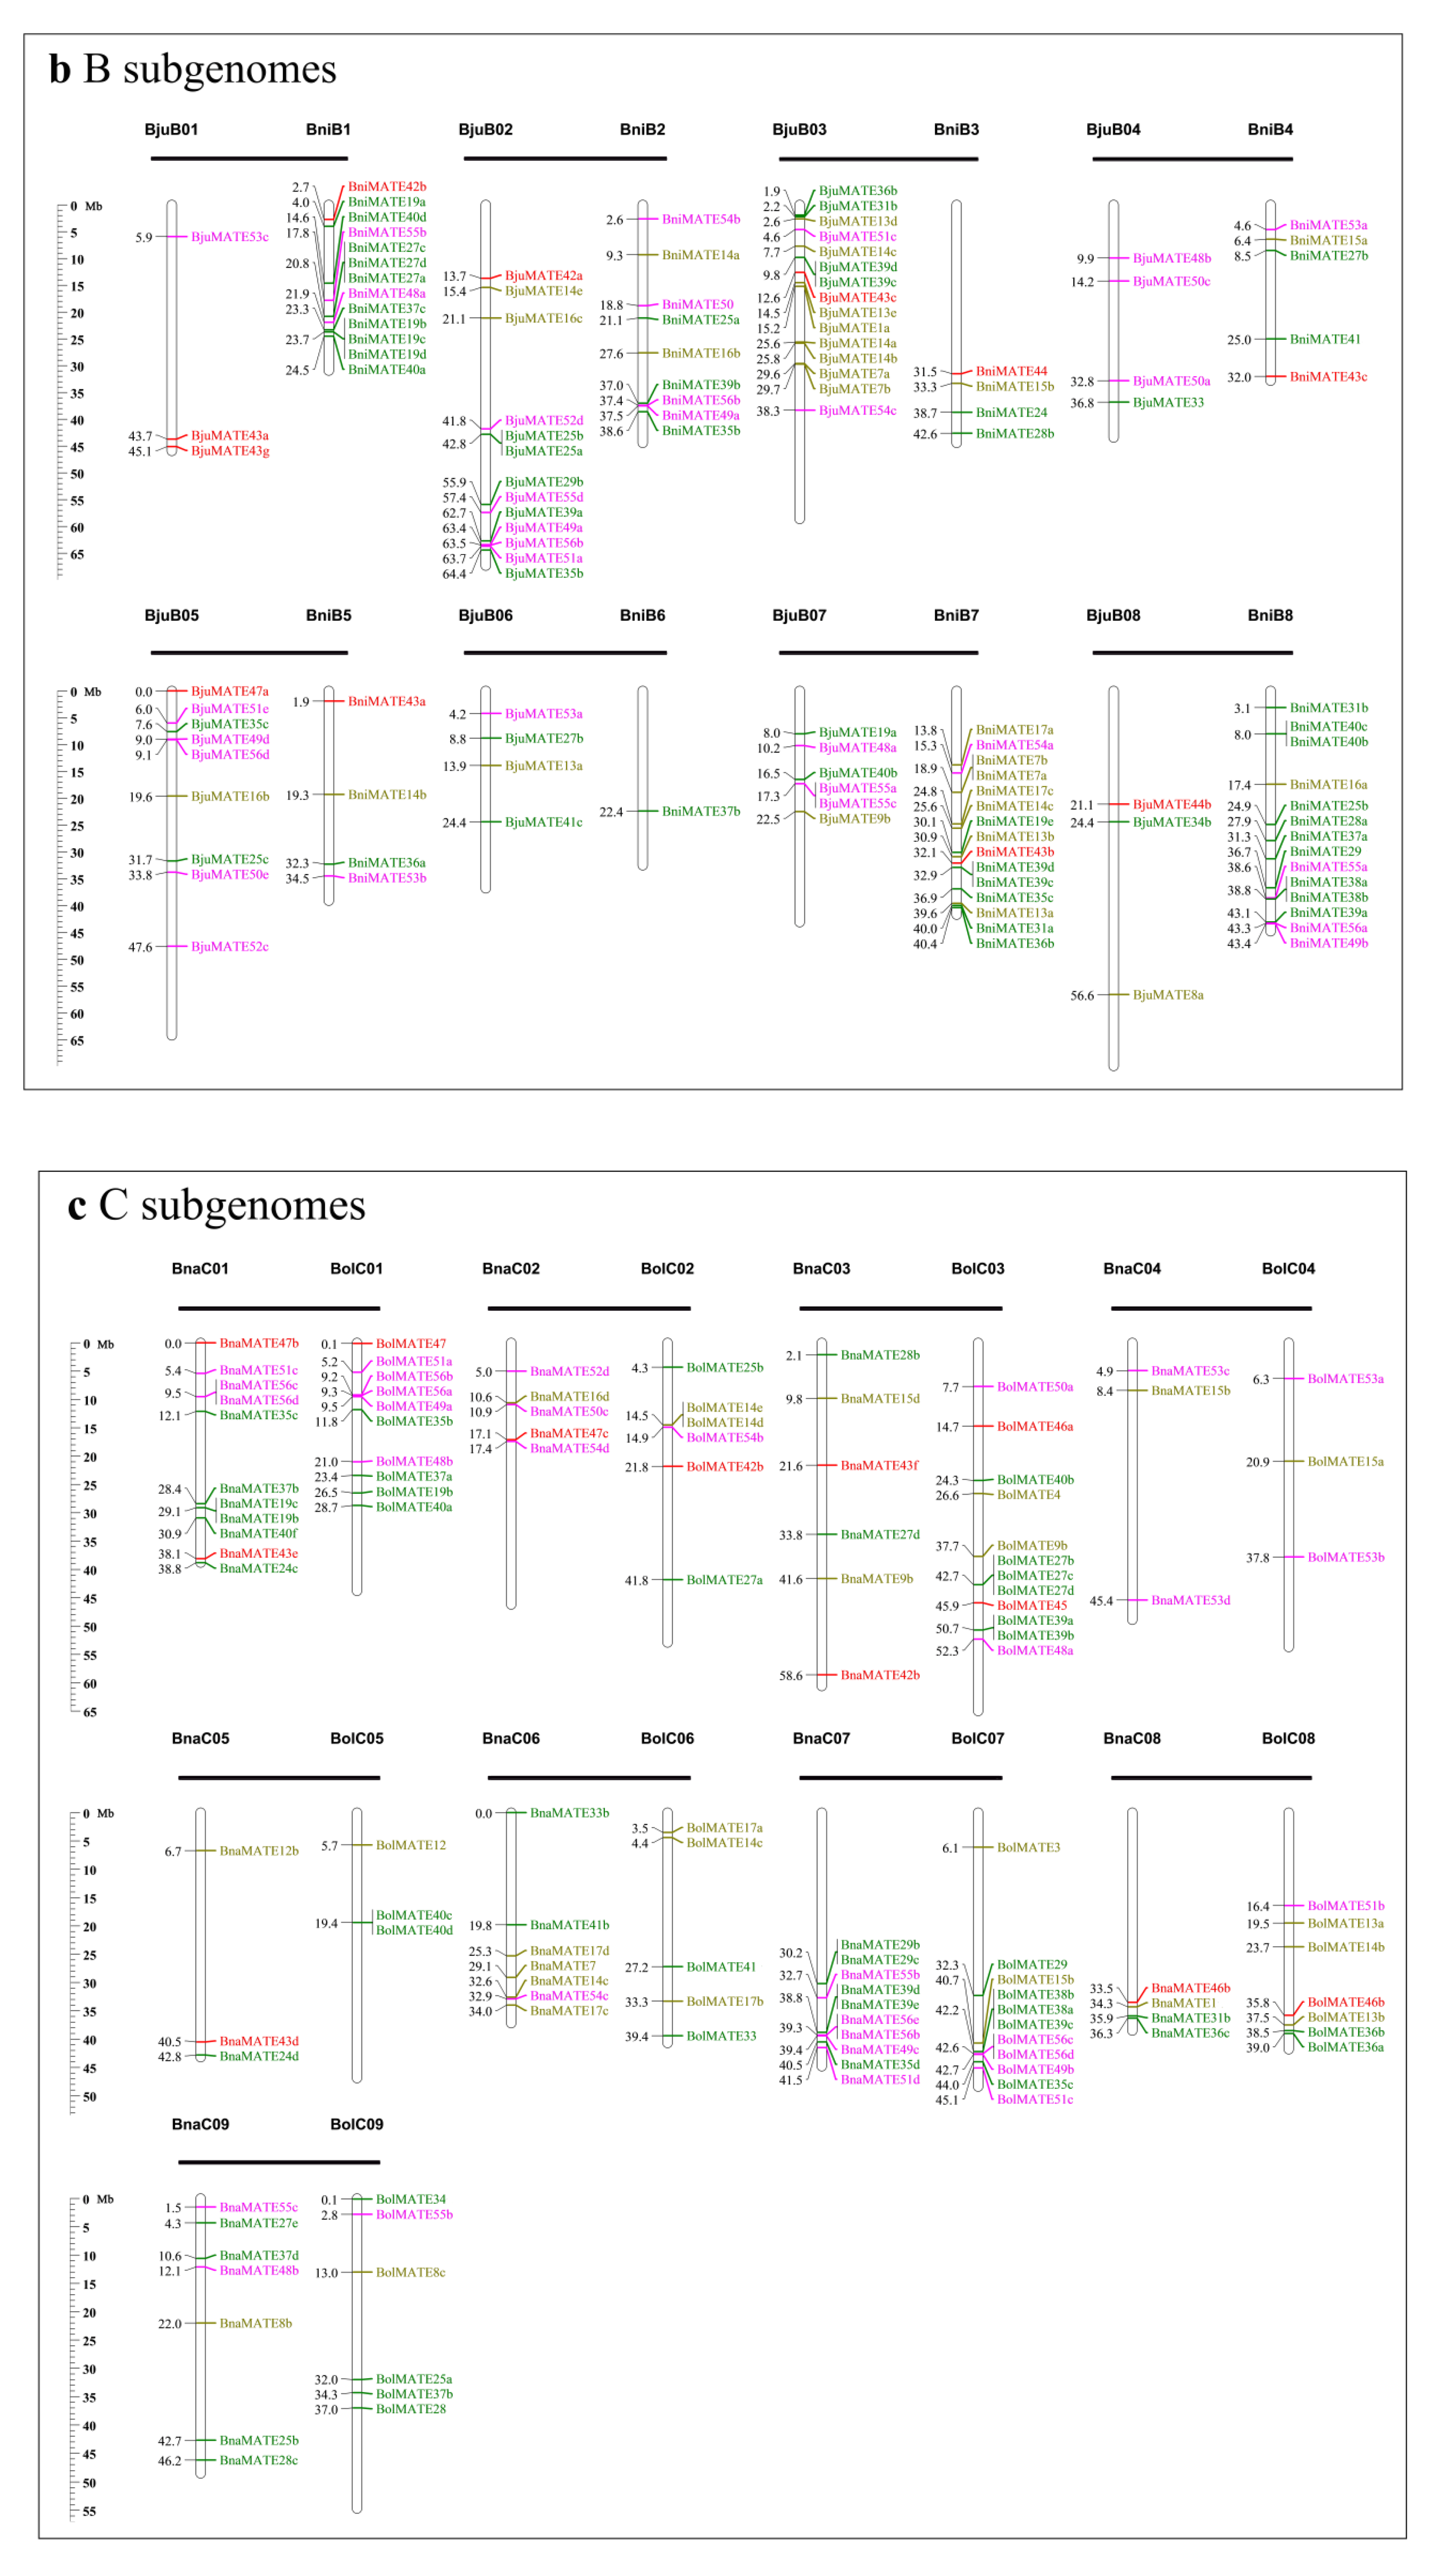
2.3. Chromosomal Location of MATE Genes in Brassicaceae Genomes

Based on the physical positions of these MATE genes in the Brassicaceae genomes, 443 of the 499 full-length MATE genes were accurately mapped onto 64 chromosomes among the five Brassicaceae species (202 in the An genome, 122 in the Bn genome, and 119 in the Cn genome) (Figure 2), whereas 56 MATE genes were assigned to random chromosomes (12), scaffold chromosomes (34), and contig chromosomes (10). Among them, 56 and 56 BnaMATE genes were distributed on the Ana and Cna subgenomes of B. napus; 61 and 57 BjuMATE genes were mapped to the Aju and Bju subgenomes of B. juncea; and 85 BraMATE genes were located on the Ara subgenomes of B. rapa, 65 BniMATE genes were located on the Bni subgenomes of B. nigra, and 63 BolMATE genes were located on the Col subgenomes of B. oleracea (Figure 2). However, the sum of the MATE genes from B. rapa (AA) and B. oleracea (CC) or from B. rapa (AA) and B. nigra (BB) in each subgenome was larger than that from B. napus (AACC) and B. juncea (AABB), suggesting that the MATE genes underwent a notable gene loss event during the evolution of B. napus, B. juncea, and their relatives. In addition, these genes were unevenly distributed on the chromosomes. For instance, regions dense in MATE genes were discovered on chromosomes A03, C01, and C07 in B. napus (Figure 2). In B. oleracea, chromosome C03 contained the greatest number of MATE genes, 12, whereas C04 and C05 contained three MATE genes. In B. rapa, chromosome A03 contained the most MATE genes, 15, whereas A04 contained two MATE genes. In B. nigra, chromosome B7 contained the most MATE genes, 17, and B6 contained one. In B. juncea, chromosome B03 contained the most MATE genes, 15, whereas A04 and A10 had only one (Figure 2), suggesting that they were unevenly distributed on each chromosome of Brassicaceae species.

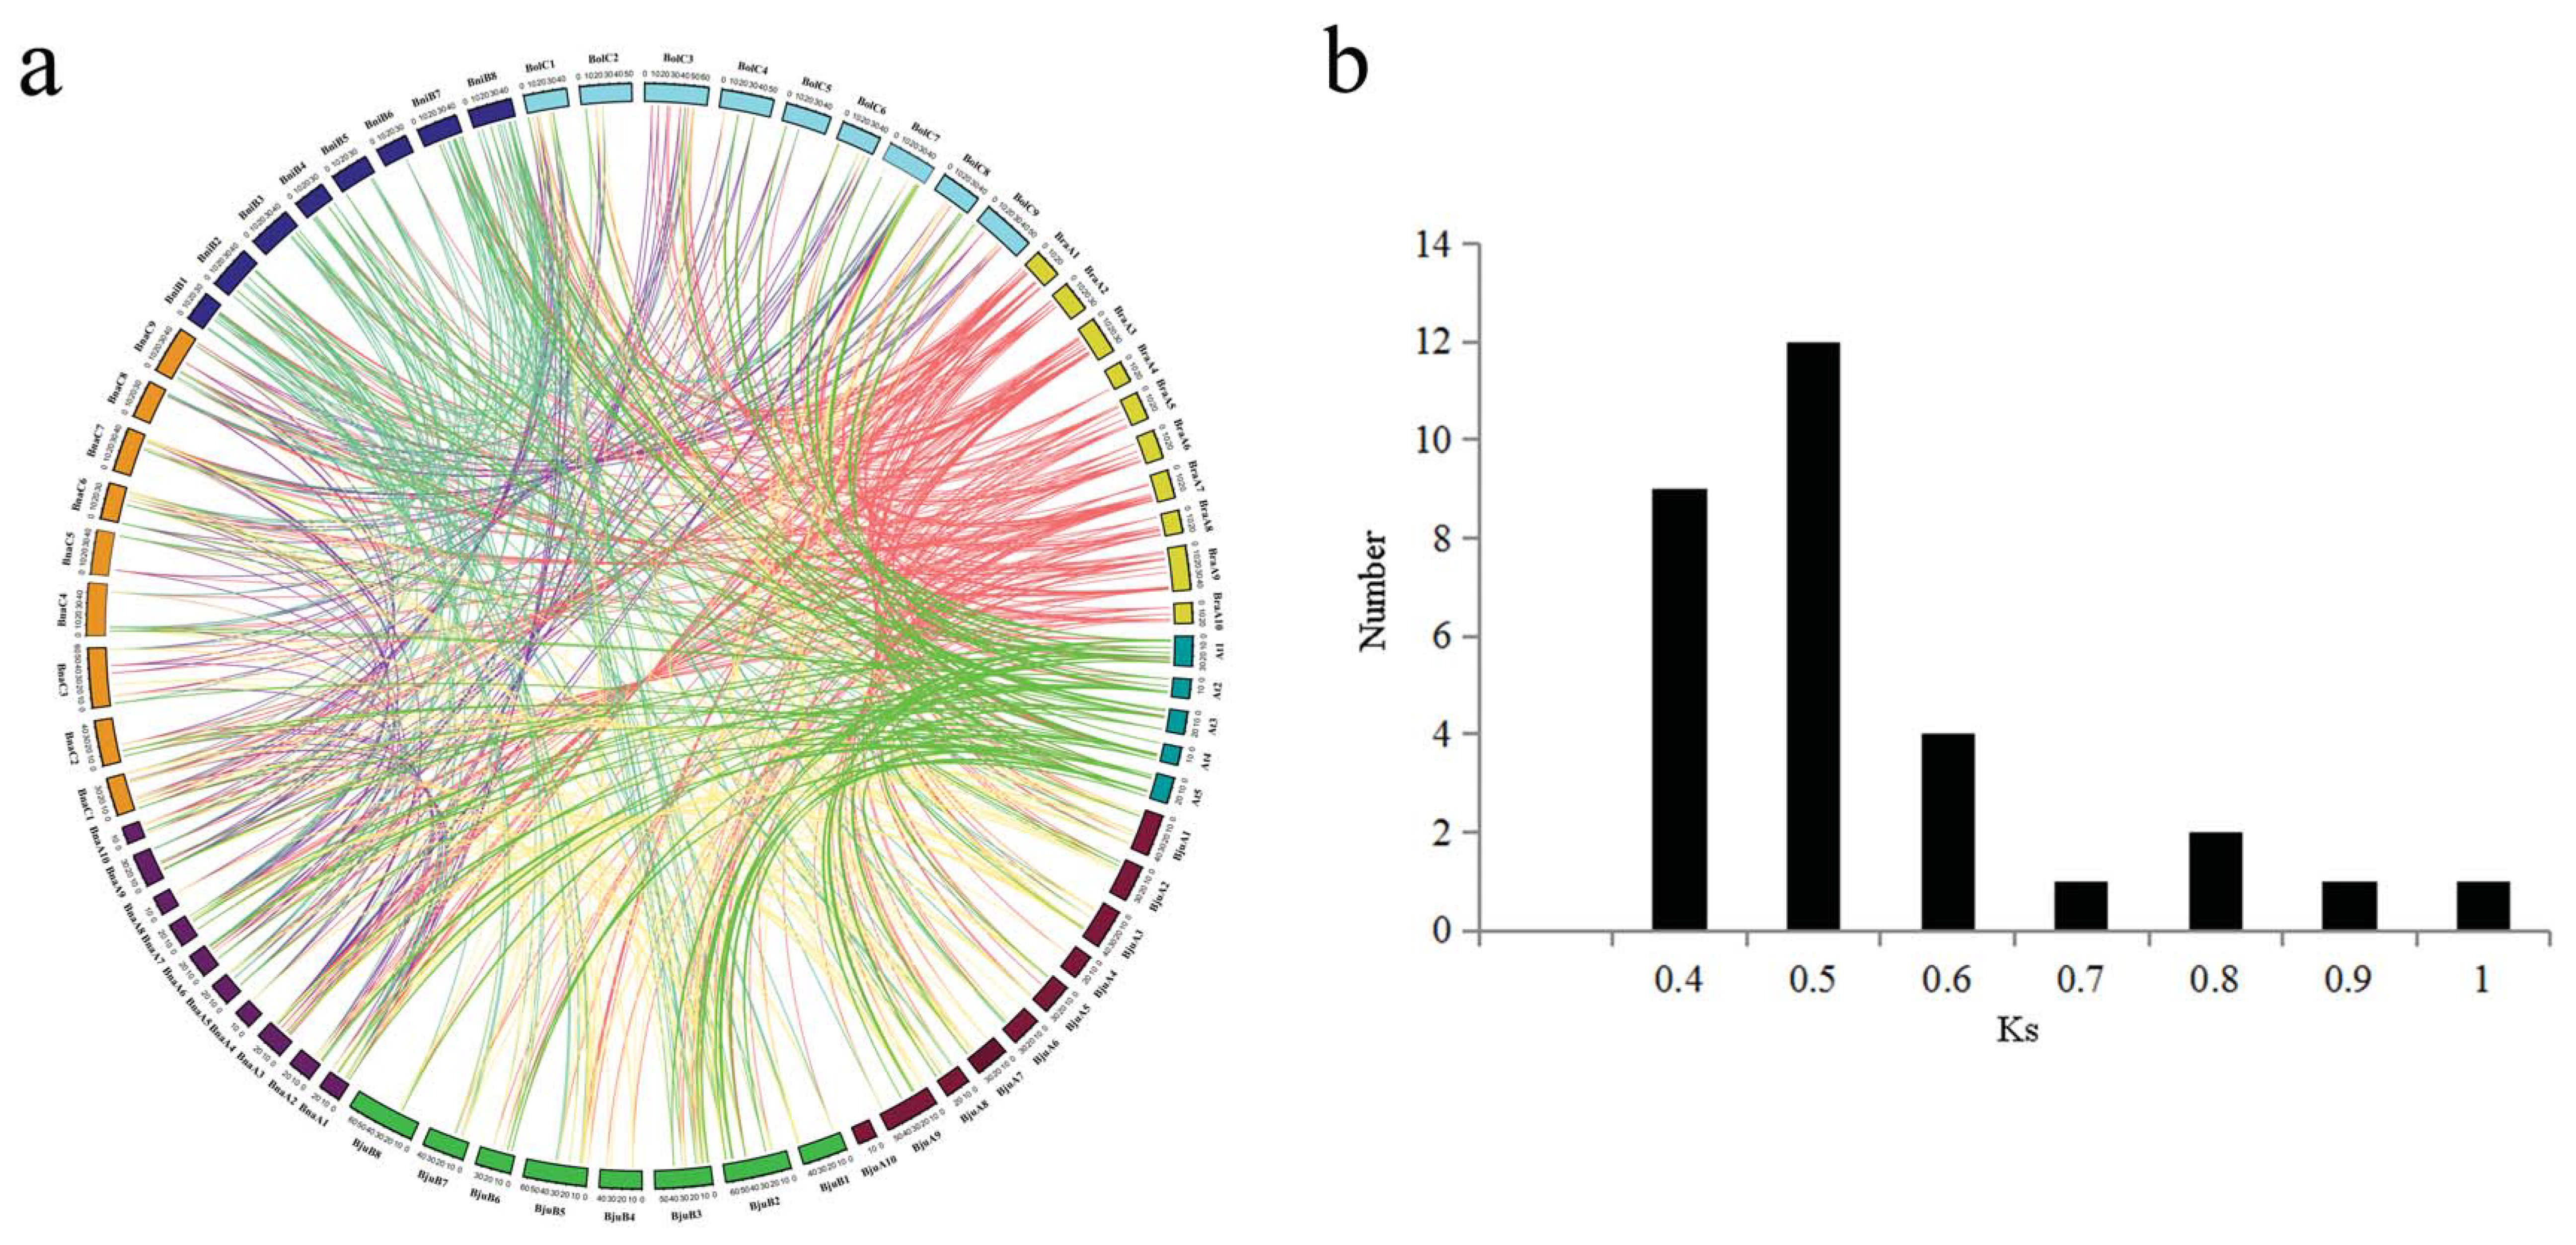
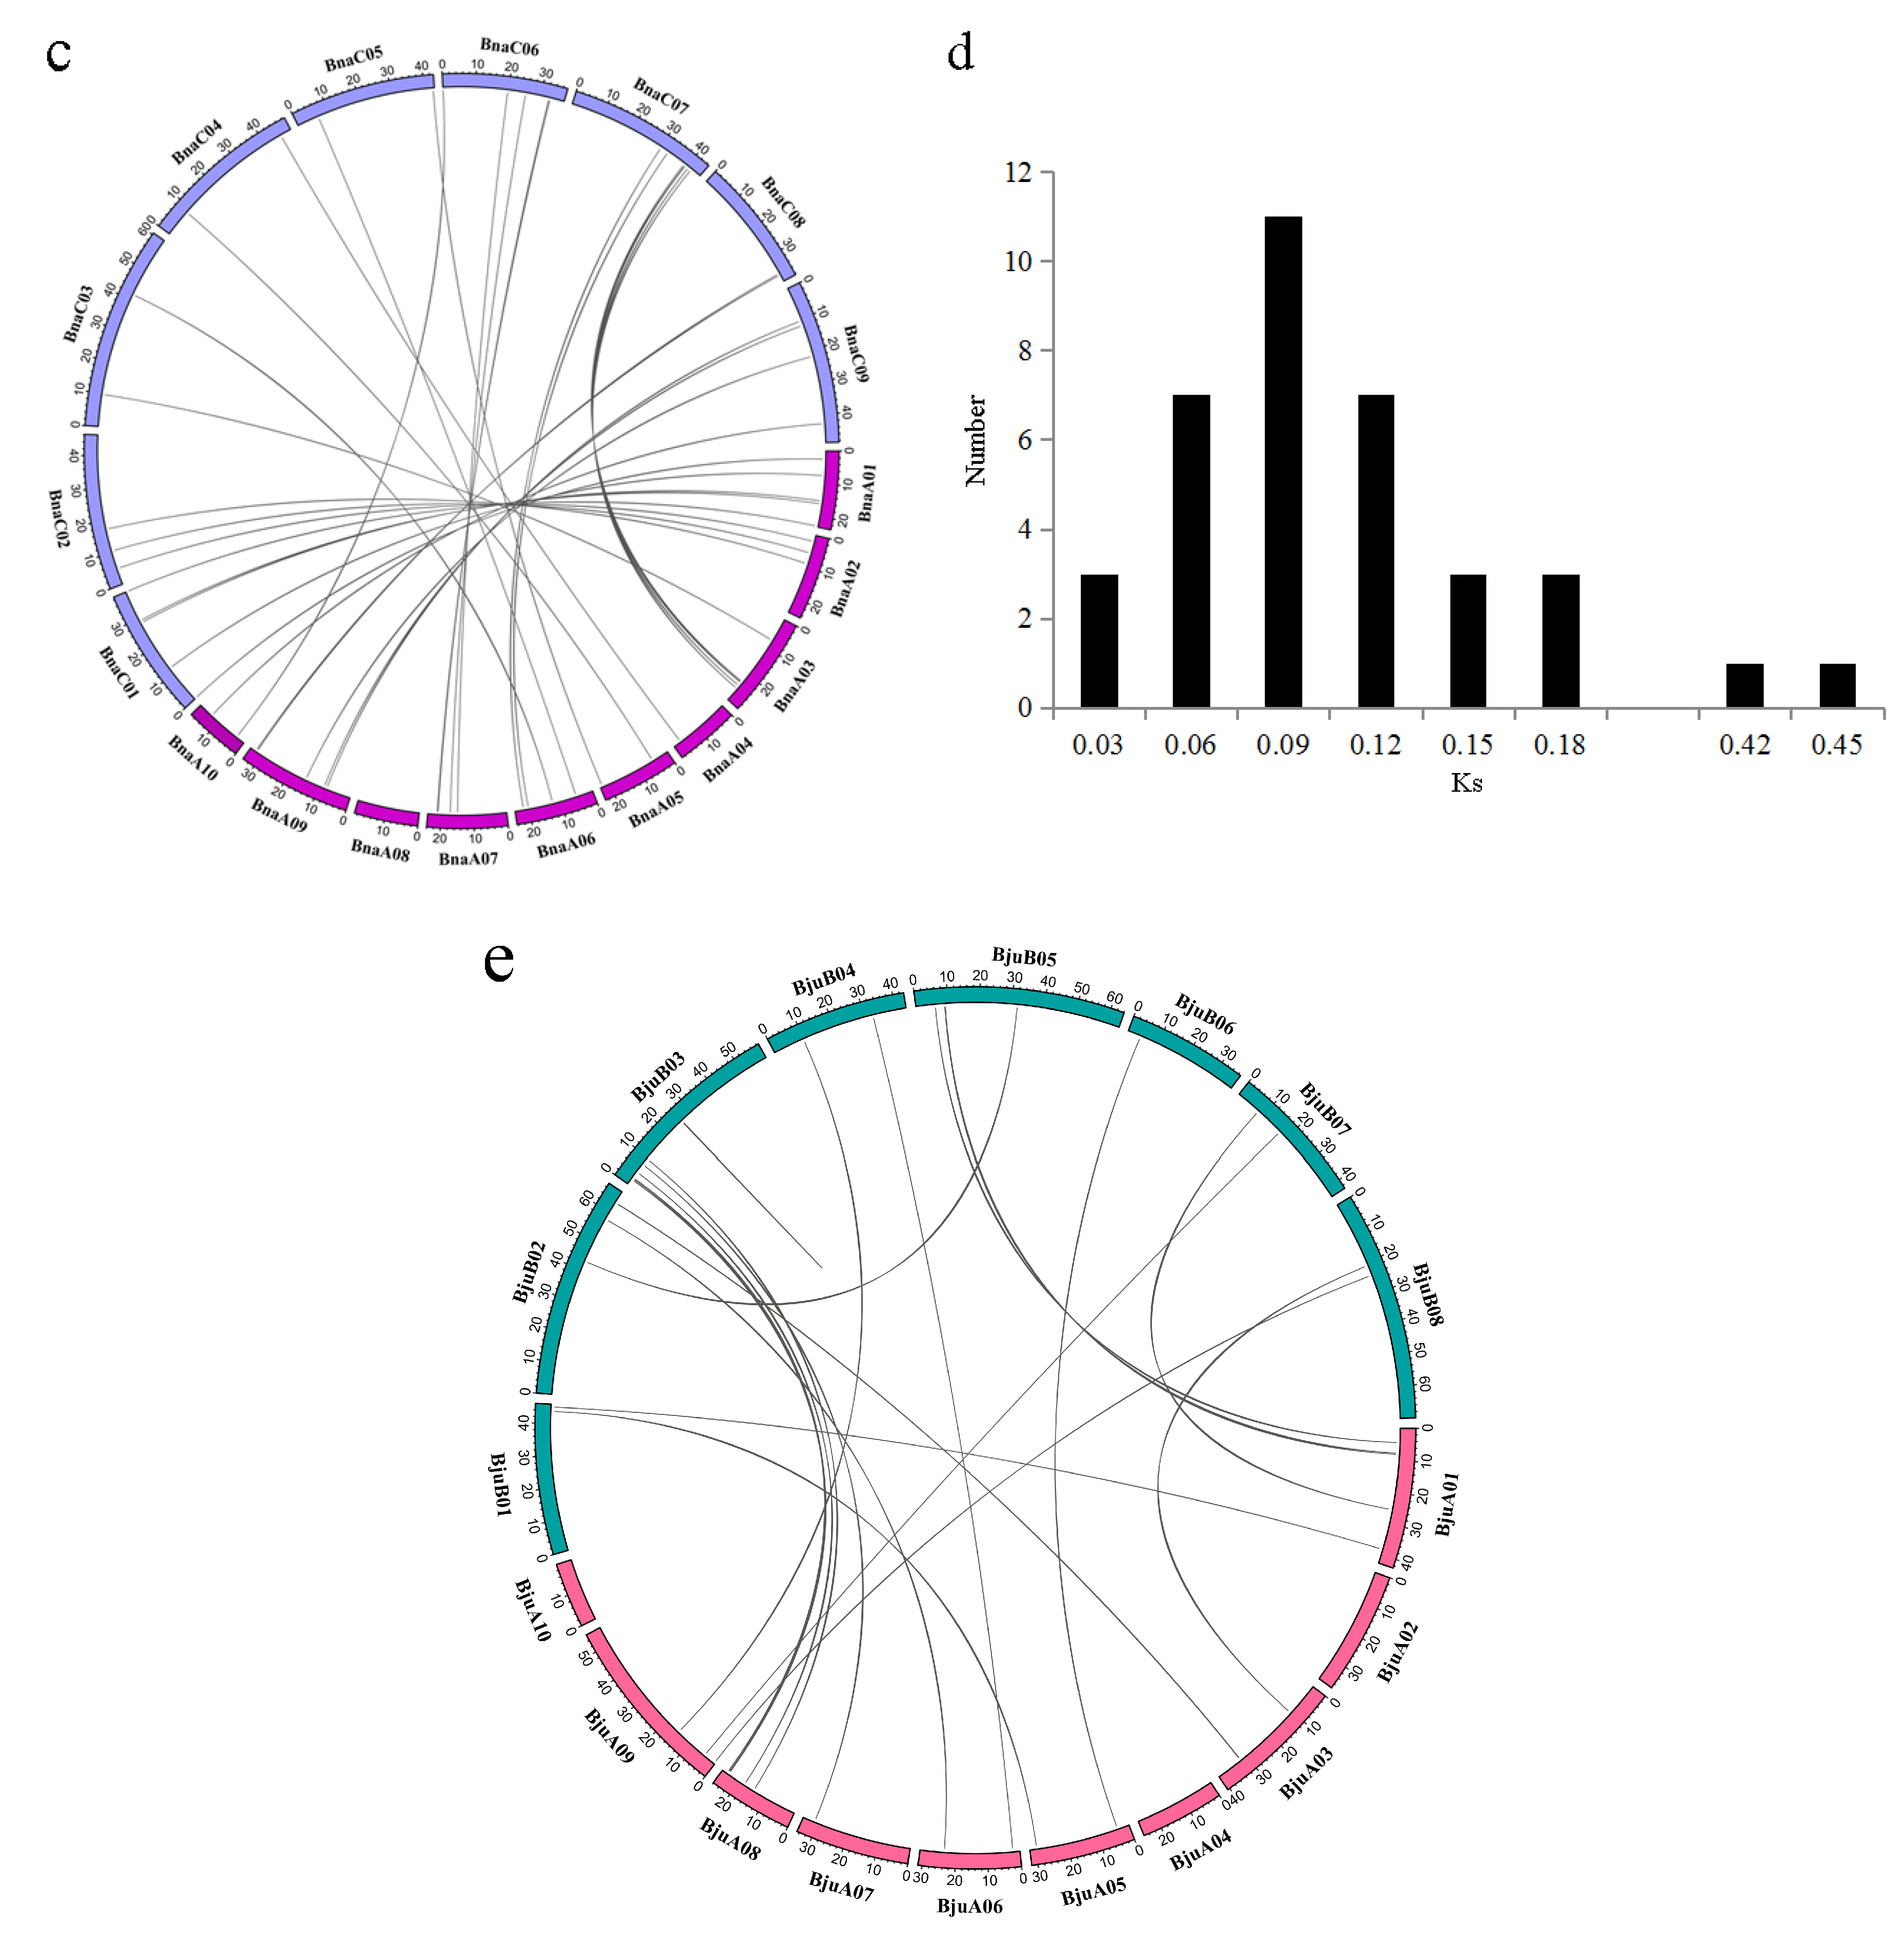
2.4. Synteny and Gene Duplication Analysis of MATE Transporters

To explore the entire evolutionary history of each MATE genes, we performed comparative analysis of MATE genes between A. thaliana and five Brassicaceae genomes (Figure 3a) and determined their patterns of orthologous gene retention or loss based on their collinearity relationships. In total, 40 A. thaliana MATE genes showed collinear relationships with the five Brassicaceae species. Among them, we identified 30 collinear gene pairs between A. thaliana and B. napus, 17 collinear gene pairs between A. thaliana and B. oleracea, 29 collinear gene pairs between A. thaliana and B. rapa, 23 collinear gene pairs between A. thaliana and B. juncea, and 15 collinear gene pairs between A. thaliana and B. nigra (Table S3). In addition, 52 gene pairs maintained their relative positions between the Ana subgenome of B. napus and the Ara genome of B. rapa, and 44 gene pairs maintained their relative positions between the Cna subgenome of B. napus and the Col genome of B. oleracea. Furthermore, 29 gene pairs maintained their relative positions between the Aju subgenome of B. juncea and the Ana genome of B. napus, and 42 gene pairs maintained their relative positions between the Bju subgenome of B. juncea and the Bni genome of B. nigra.
Of the 101,040 genes in the B. napus genome, 997 genes (0.99%) appeared to have undergone tandem duplication and 74,183 genes (73.4%) appeared to have undergone WGD or segmental duplication (Table S4), which showed less tandem duplication and more WGD or segmental duplication compared with the results of a previous study [40]. Furthermore, 113 out of 124 BnaMATE genes (91.1%) were derived from WGD or segmental duplication, which was a number slightly larger than the average percentage at the whole-genome level (73.4%). Therefore, it appears that WGD or segmental duplication played an important role in the expansion of the MATE family in B. napus. Likewise, we also examined the MATE gene expansion patterns in B. rapa, B. oleracea, B. nigra, and B. juncea, and we showed that all of the BraMATE genes (100%; 85/85) and most of the BolMATE (95.1%; 77/81), BniMATE (93.7%; 74/79), and BjuMATE genes (90.8%; 118/130) were derived from segmental duplication, followed by dispersed duplication (0% in B. rapa, 3.7% in B. oleracea, 3.8% in B. nigra, and 7.7% in B. juncea) (Table S4).
In addition, we used the synonymous base substitution rates (Ks values) as a proxy for time to estimate the approximate ages of the segmental duplication events [1]. Then, we predicted the Ks values for all collinear gene pairs. These ranged from 0.3322 to 0.9765 between B. napus and A. thaliana, with a mean of 0.4903 (Figure 3b). The divergence time ranged from 11.07 to 32.55 million years ago (MYA), with a mean of 16.34 MYA, indicating that the MATE genes of B. napus and A. thaliana diverged approximately 16 MYA. This is consistent with the likely timing of the recent whole-genome triplication event in Brassica, which has been estimated at approximately 9−15 MYA or even 28 MYA [41]. In addition, we identified 36 and 26 duplicate gene pairs in B. napus and B. juncea, respectively (Figure 3c,e). Then, we estimated the timing of the WGD event based on the distribution of Ks values, which ranged from 0.0192 to 0.4286 (mean, 0.135) in B. napus duplicate gene pairs and from 0.0310 to 0.2591 (mean, 0.1684) in B. juncea duplicate gene pairs. In B. napus, the corresponding duplication time range was 0.64−14.29 MYA (mean, 3.45 MYA), whereas in B. juncea, it was 1.03−8.64 MYA (mean, 5.61 MYA) (Table S5). One peak (0.06–0.09) in Ks values was observed in B. napus, representing the duplication time of these genes, which occurred during the formation of B. napus 7500–12,500 years ago (Figure 3d). Therefore, the processes of Brassicaceae speciation and whole-genome triplication likely played an important role in the divergence of the duplicated MATE genes among these species.
We also calculated the rates of nonsynonymous substitutions (Ka) and synonymous substitutions (Ks) and the Ka/Ks ratios of the MATE gene pairs to identify the evolutionary constraints acting on the MATE gene pairs, and we found that the Ka/Ks ratios of the duplicates were commonly less than 1 (Table S5), indicating that these genes were subject to purifying selection.

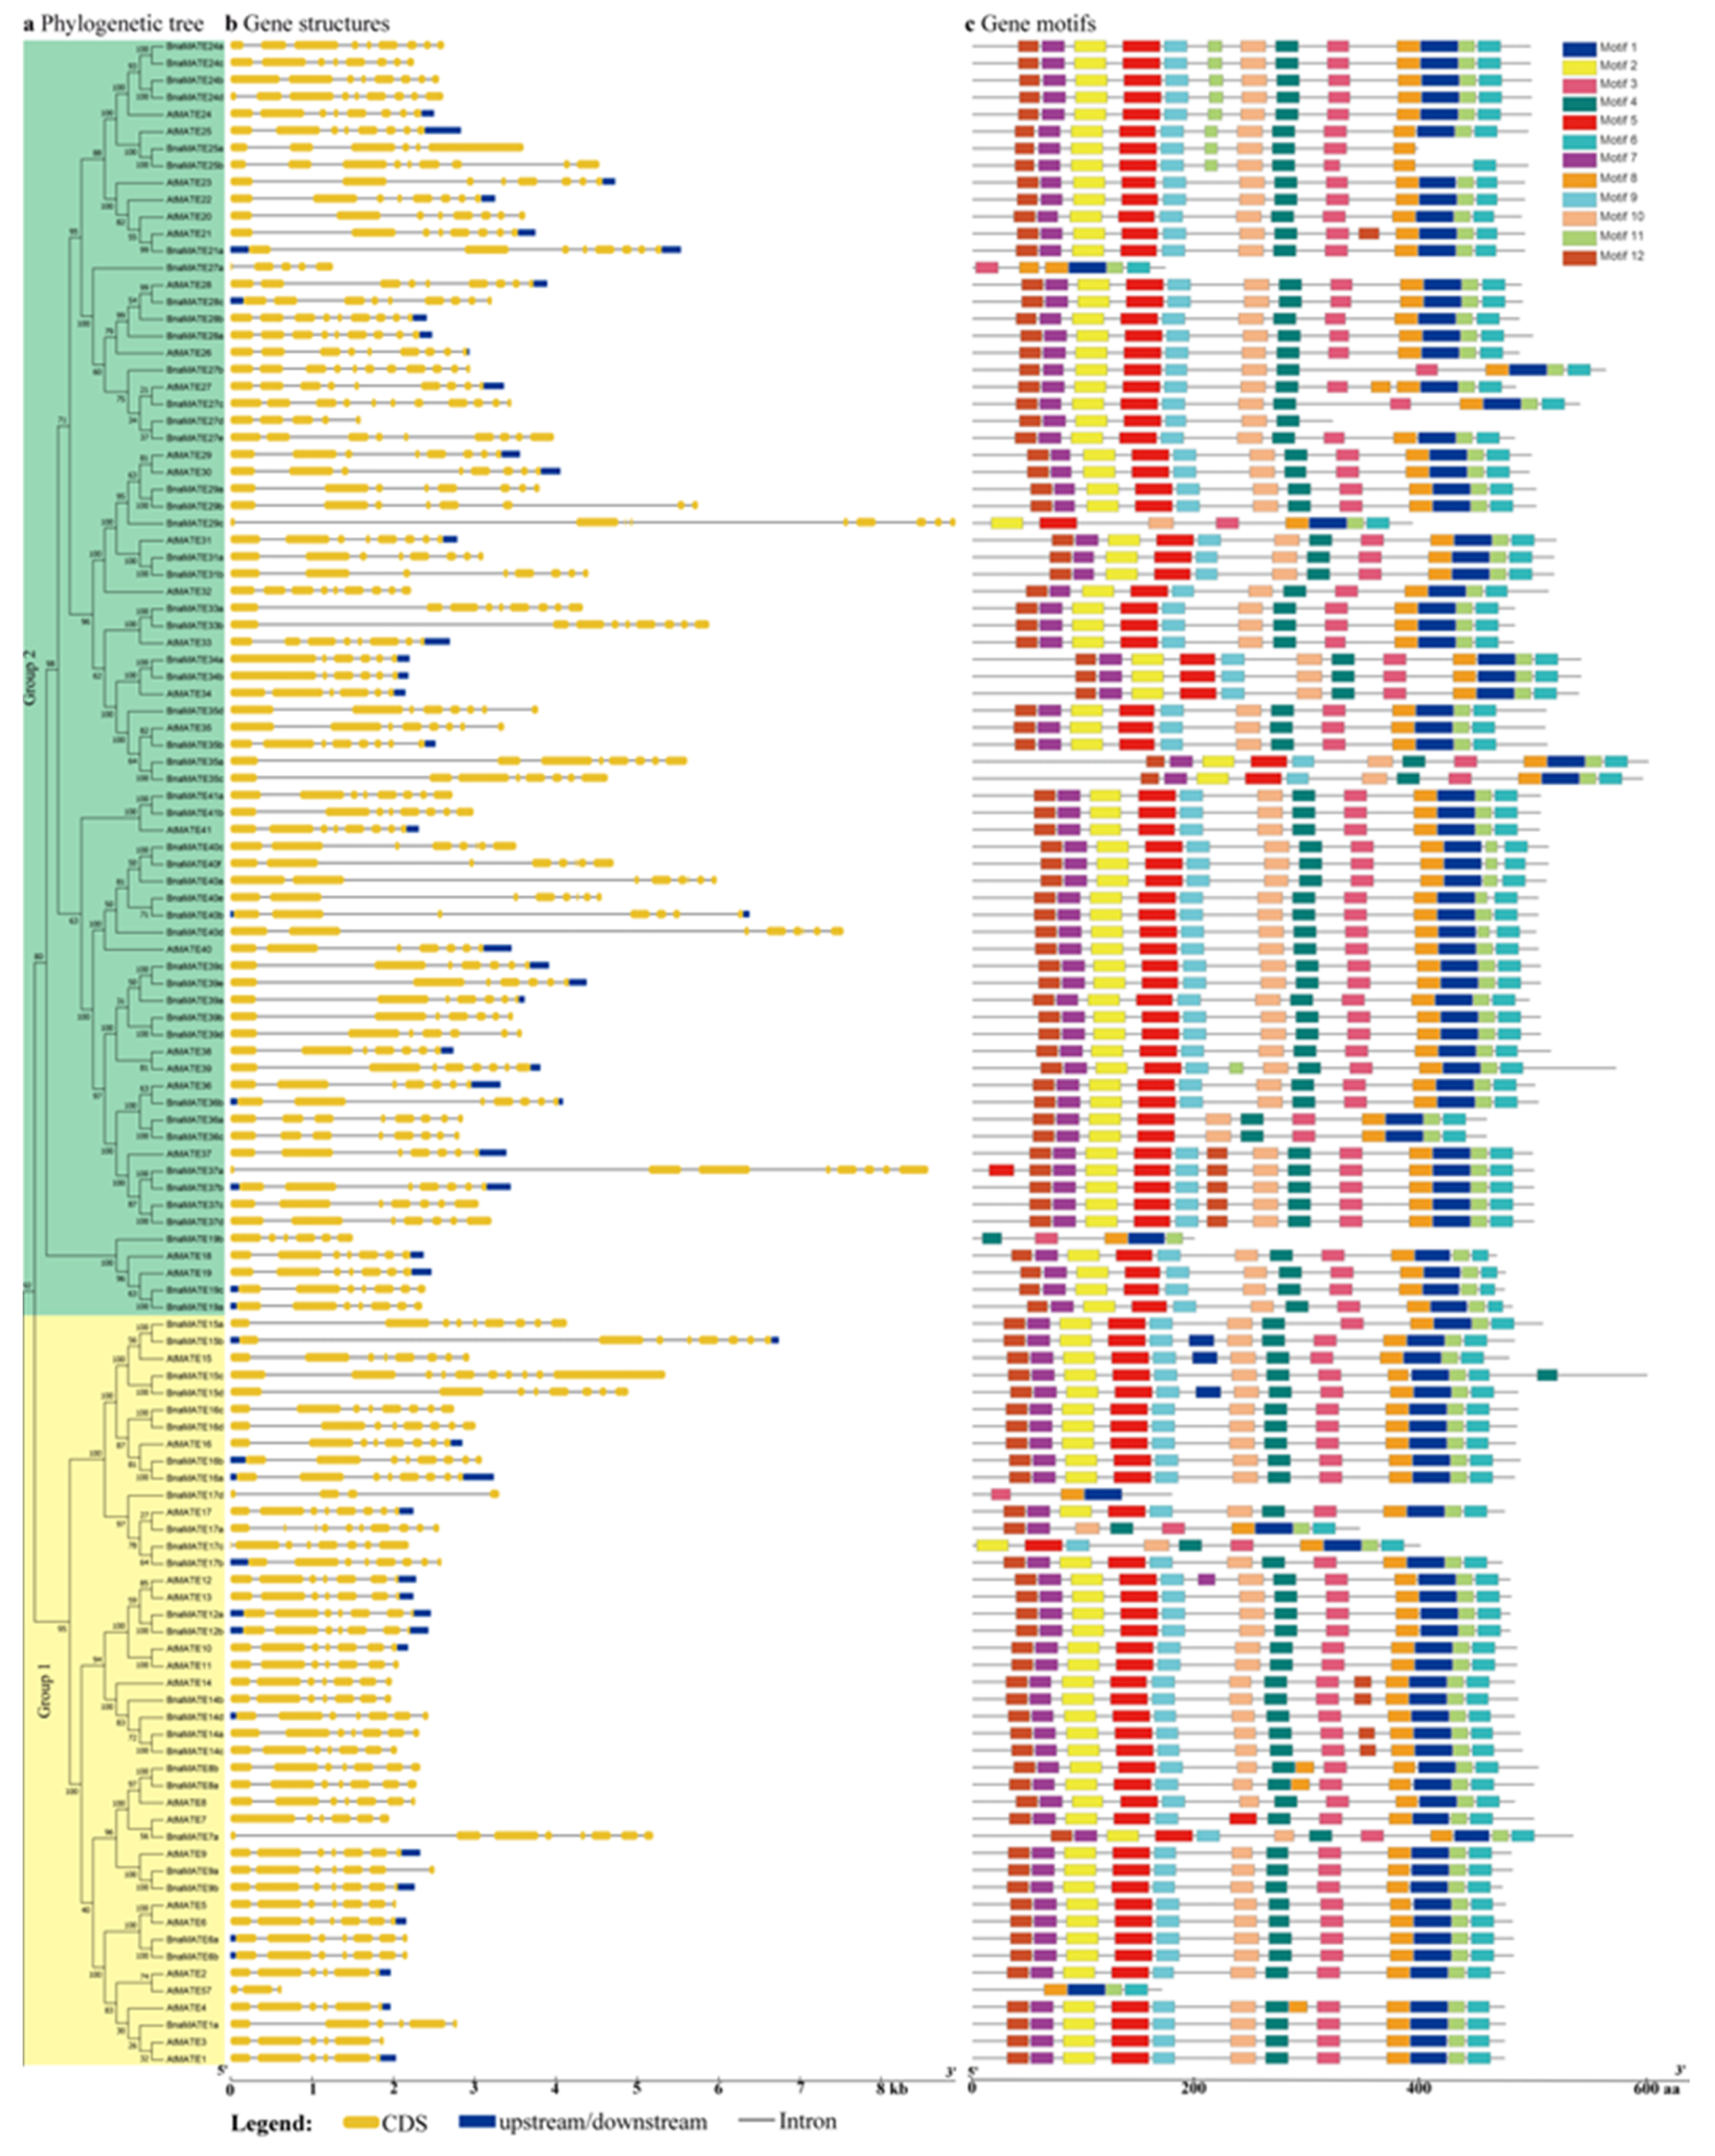
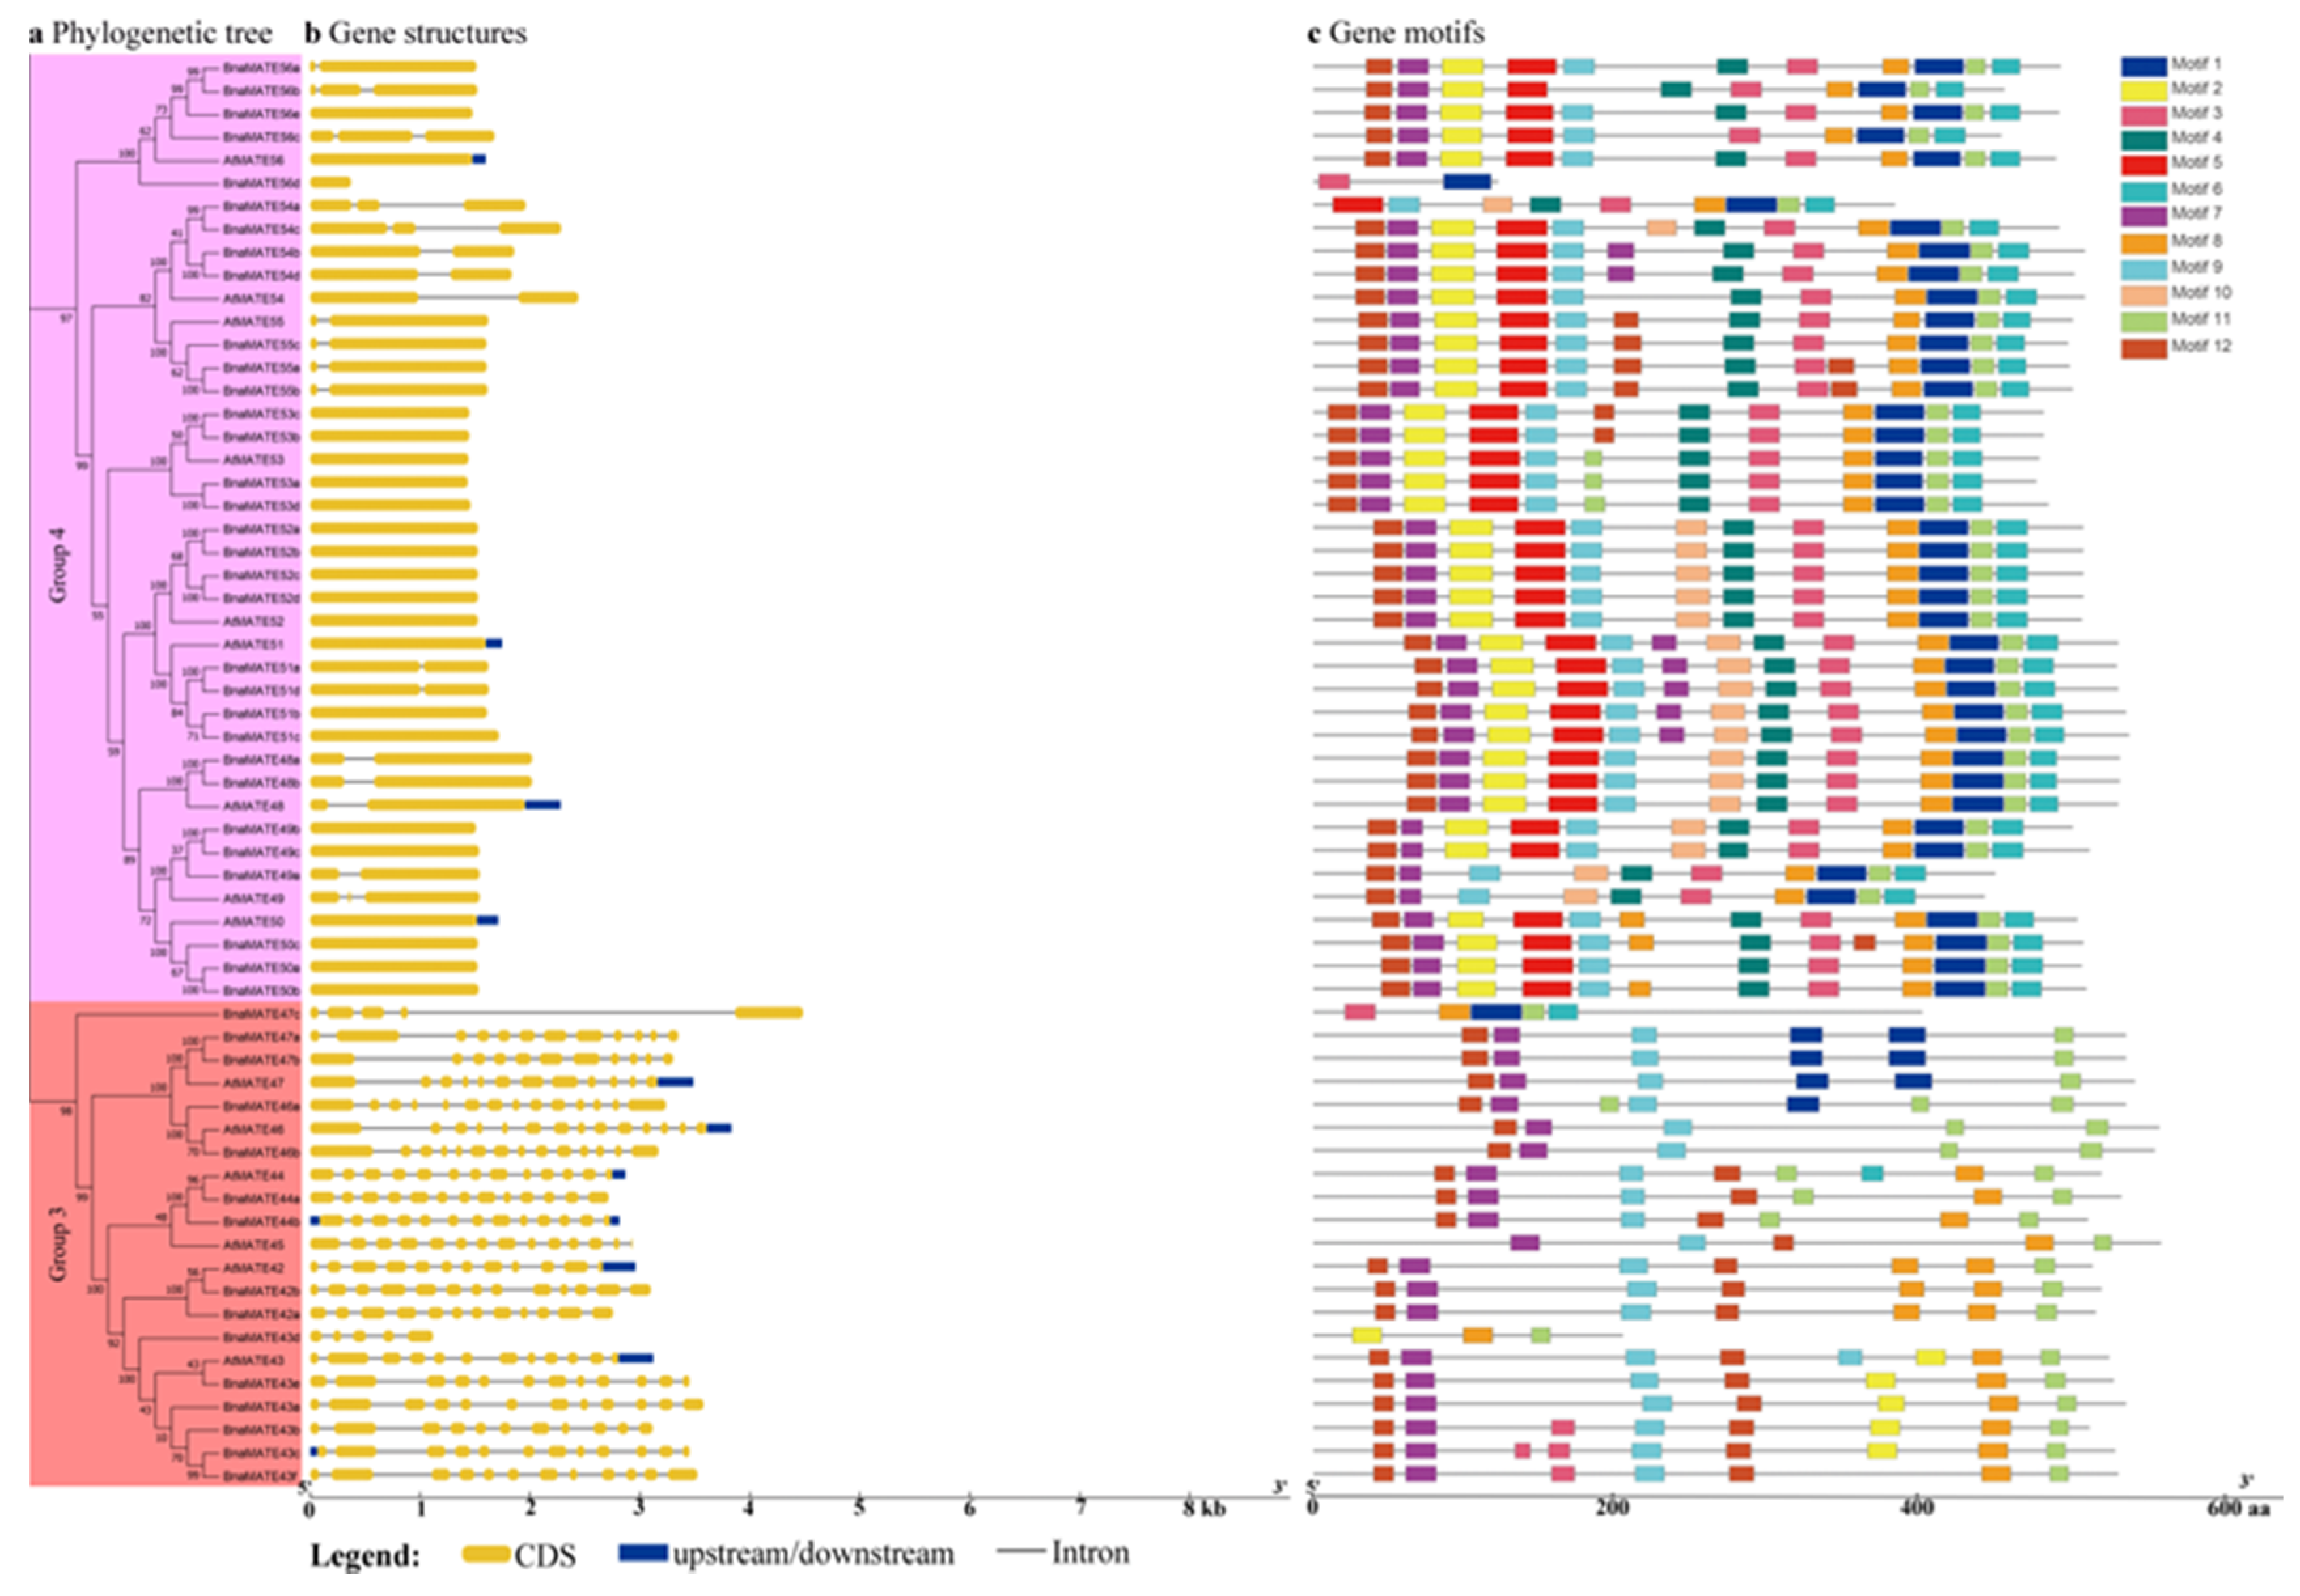
2.5. Analysis of MATE Gene Structures and Conserved Motifs between A. thaliana and B. napus

The allotetraploid Brassicaceae species rapeseed (B. napus) is one of the main oilseed crops worldwide, serving as a source of edible oil, biodiesel, and protein-rich animal feed. To provide a clear functional characterization of the BnaMATE genes, as well as to enable the manipulation of traits related to rapeseed metabolism, we analyzed the intron–exon structures of these genes using GSDS v2.0 (http://gsds.cbi.pku.edu.cn/index.php); the results are displayed along with the subgroups of phylogenetic tree (Figure 4a). Notably, the lengths and numbers of exons and introns were more similar within the same subgroup (Figure 4b). For example, the number of exons ranged from 5 to 11 in the largest group, Group 2, and the maximum number of exons (11–14 exons) was found in Group 3, except for BnaMATE43d and BnaMATE47c, which have only 5 exons. The genes in Group 4 generally had the smallest number of exons, 1–3, and the MATE genes in Group 1 had 4–10 exons. Our findings were in agreement with previous studies reporting that MATE genes from different groups were generally distinct, with each group sharing a common gene structural layout [22]. In addition, similar genes structures were observed among B. rapa, B. oleracea, B. nigra, and B. juncea, which were divided into the same subfamilies (Figure 1, Table S2).
Next, we identified the conserved motifs of MATE sequences using the MEME online software (Figure 4c, Figure S1). In most cases, the protein architecture was remarkably conserved within specific subgroups, providing further support to the phylogenetic analysis based on MATE domains (Figure S2) and suggesting that there are functional similarities within the groups. In addition, the types and sequences of the motifs are similar among Group 1, 2, and 4, which contain all 12 conserved motifs, whereas the most distinctive pattern of motifs was found in Group 3 proteins, which contain a smaller number of motifs. These findings suggest that these conserved motifs may have crucial roles in subfamily-specific functions.

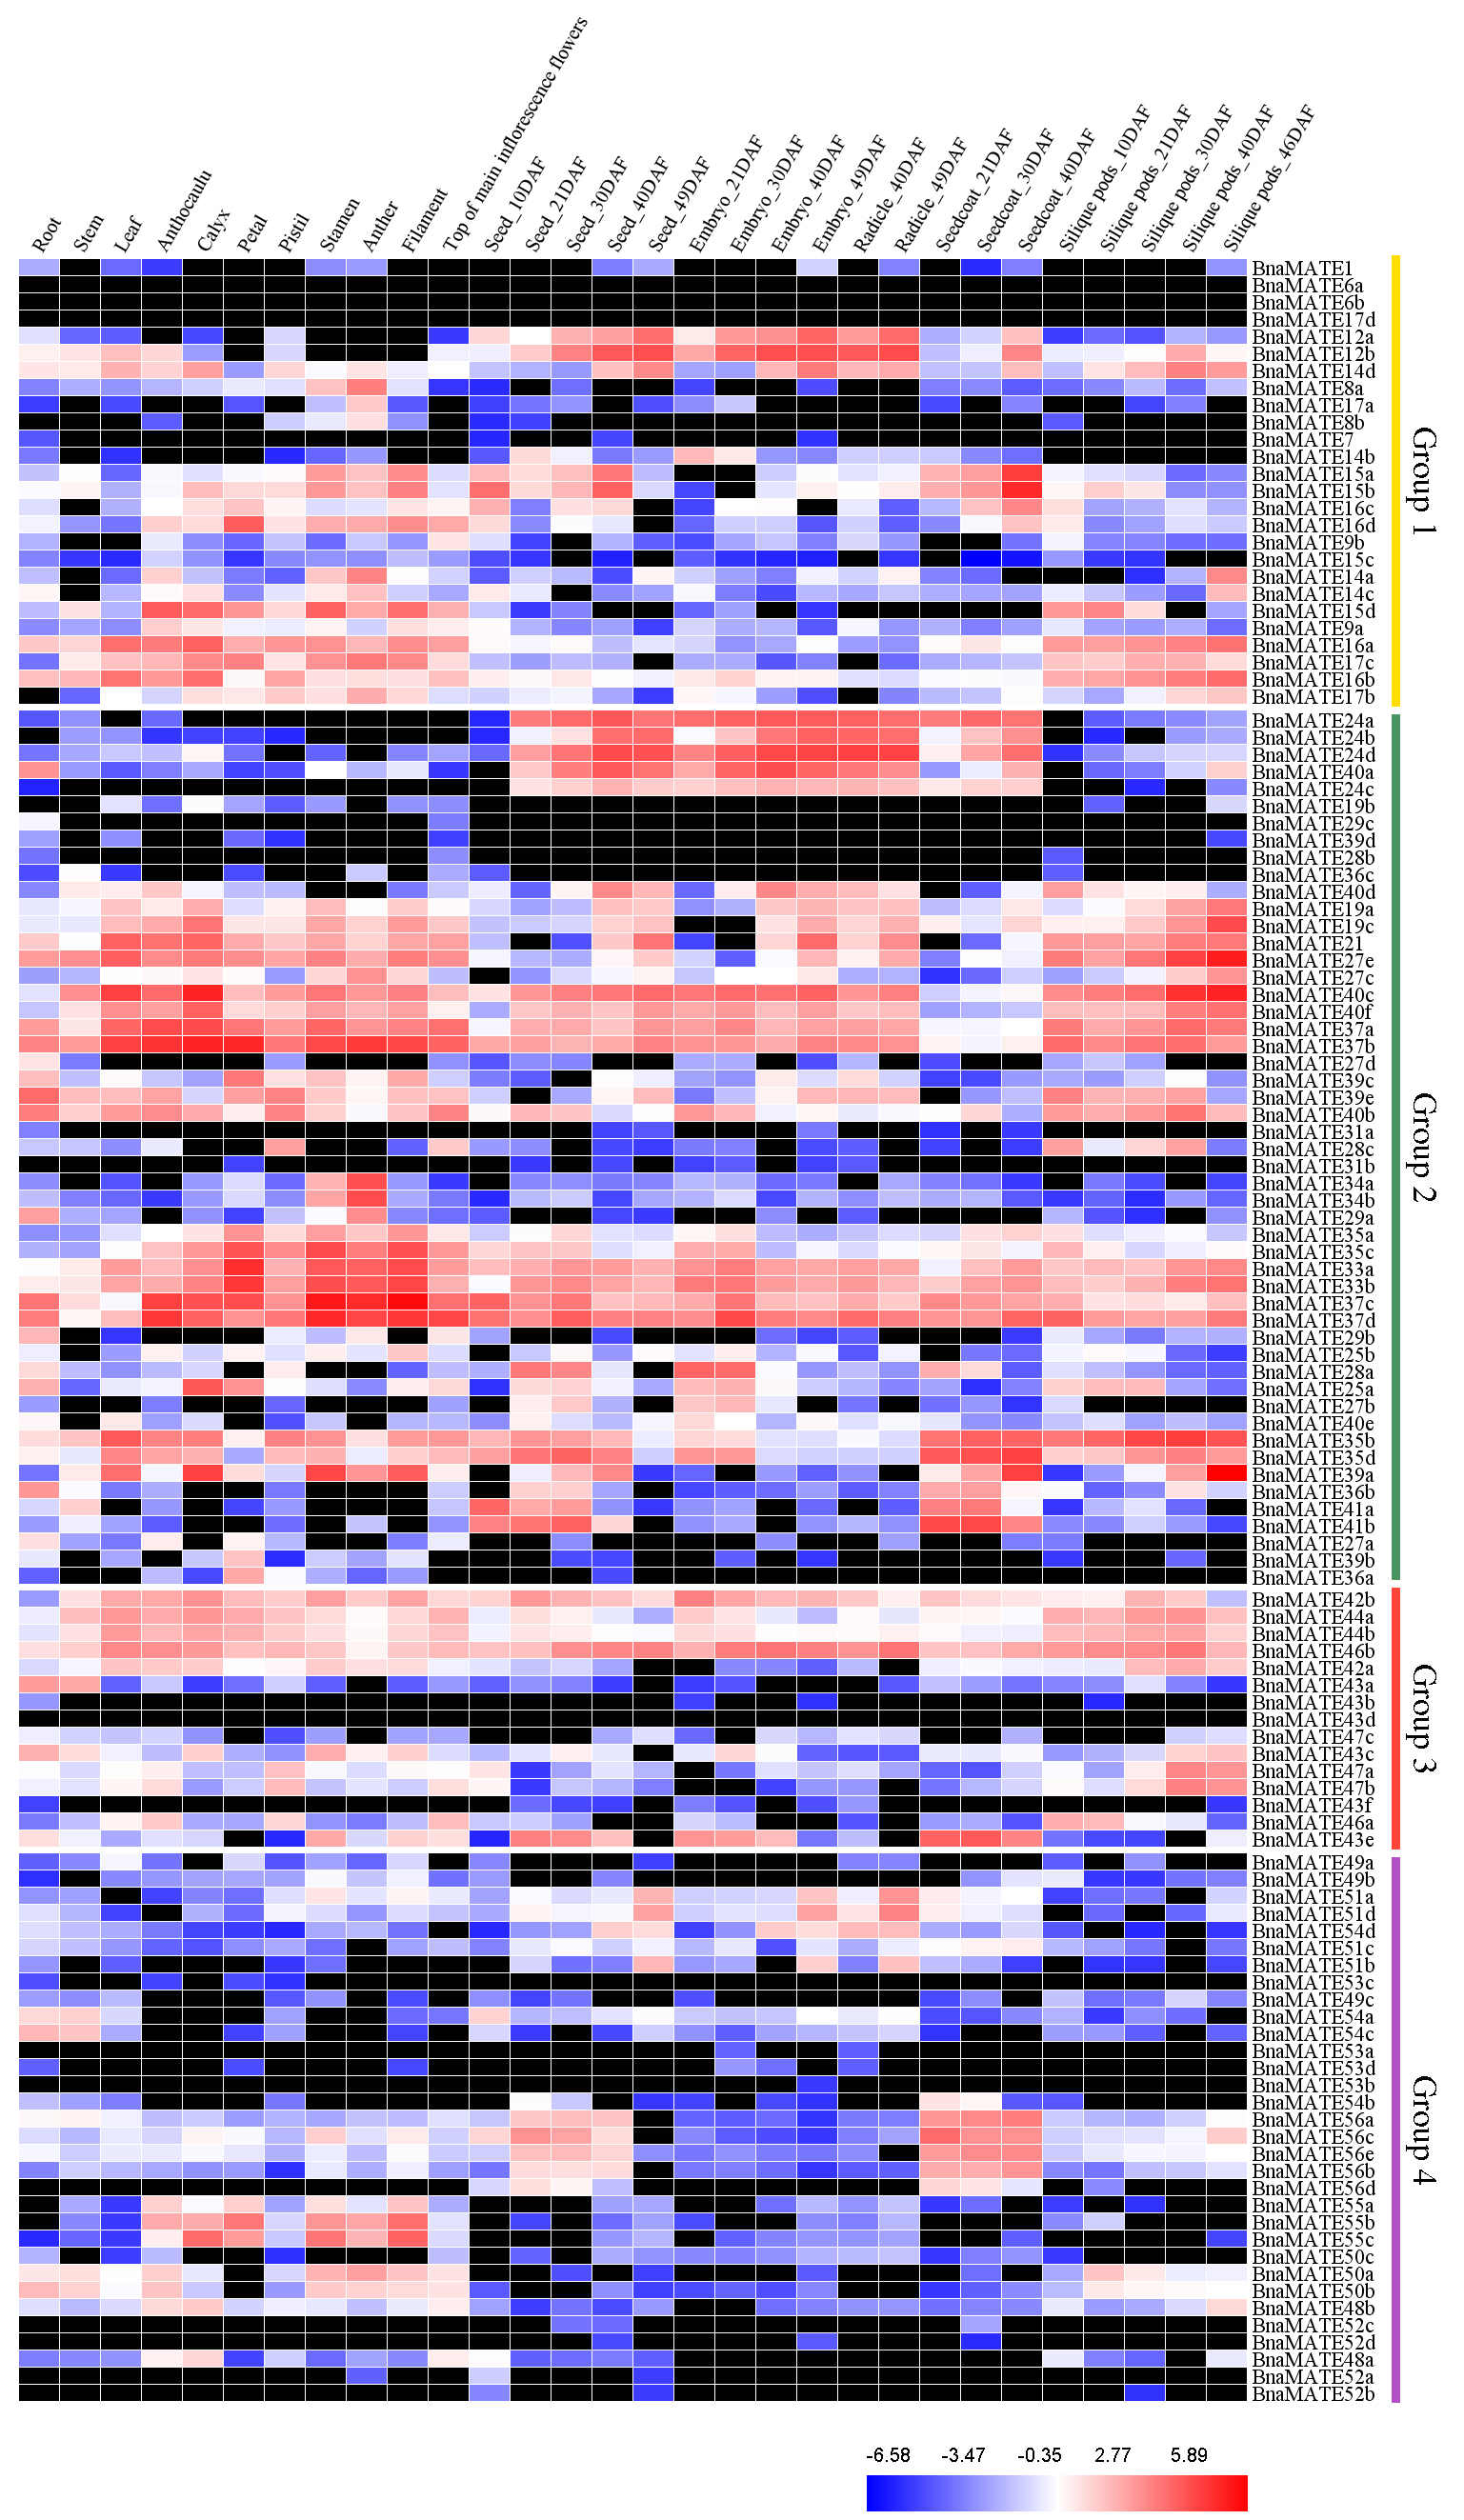
2.6. Expression Profiles of BnaMATE Genes in Various Rapeseed Tissues

Based on the transcriptome sequencing datasets from B. napus ZS11 (BioProject ID PRJNA358784), we characterized the relative transcript abundances of BnaMATE gene transcripts in 15 different tissues of rapeseed (Figure 5, Table S6). Within Group 1, most BnaMATE genes showed low or no expression in the tested tissues and organs, such as BnaMATE8a, BnaMATE8b, BnaMATE9a, BnaMATE9b, BnaMATE14a, BnaMATE14b, BnaMATE14c, and BnaMATE17a, which were expressed at low levels; in contrast, BnaMATE1, BnaMATE6a, BnaMATE6b, BnaMATE7, BnaMATE15c, and BnaMATE17d were barely expressed in the tested tissues and organs. However, BnaMATEs also displayed the specifically expression patterns; for example, BnaMATE12a and BnaMATE12b were more highly expressed in seeds and embryos than in other tissues; BnaMATE15a and BnaMATE15b were more highly expressed in seeds (40 DAF) and seed coats (40 DAF) than in other tissues; BnaMATE16a and BnaMATE16b were more highly expressed in the tissues of the whole flower, leaves, and silique pods compared with other tissues; and BnaMATE17b and BnaMATE17c were more highly expressed in flowers and seed pods than in other tissues (Figure 5).
In Group 2, BnaMATE19a and BnaMATE19c were more highly expressed in the tissues of flowers and late developmental tissues (at 40 and 49 DAF), including seeds, embryos, and silique pods, than in other tissues; BnaMATE24a, BnaMATE24b, BnaMATE24c, and BnaMATE24d were specifically expressed in seeds, embryos, and seed coat; BnaMATE35a, BnaMATE35b, BnaMATE35c, and BnaMATE35d were specifically expressed in flower, seed coat, and silique pod tissues; and BnaMATE40a, BnaMATE40c, and BnaMATE40f were highly expressed in seeds and embryos and (for the latter two) in leaves, anthocaulus, calyx, and silique pods. BnaMATE33a, BnaMATE33b, BnaMATE37a, BnaMATE37b, BnaMATE37c, and BnaMATE37d were expressed in all tissues at different developmental stages, and they were more highly expressed in flower tissues (anthocaulus, calyx, petal, pistils, stamens, anthers, filaments, and the tops of main inflorescence flowers). Finally, BnaMATE19b, BnaMATE31a, BnaMATE31b, BnaMATE28b, BnaMATE36c, and BnaMATE39d were barely expressed in any tissue (Figure 5).
Among Group 3 genes, most were expressed in at least one tissue, with the exception of BnaMATE43b, BnaMATE43d, and BnaMATE43f, which were barely detected in any tissue or organ. BnaMATE44a, BnaMATE44b, and BnaMATE46b were highly expressed throughout plant development, whereas BnaMATE43e was highly expressed in the seed coat as compared with other tissues (Figure 5).
In Group 4, BnaMATE55a, BnaMATE55b, and BnaMATE55c were specifically expressed in flower tissues (anthocaulus, calyx, petal, pistils, stamens, anthers, filaments, and the tops of main inflorescence flowers), and BnaMATE56a, BnaMATE56b, BnaMATE56c, BnaMATE56d, and BnaMATE56e were specifically expressed in seeds and seed coat (at 21, 30, and 40 DAF). In addition, the four BnaMATE52 genes and four BnaMATE53 genes were barely expressed in any tissues (Figure 5).
Overall, 11 BnaMATE genes were expressed in all tissues at different developmental stages, whereas 29 exhibited almost no expression, and 84 were specifically expressed in particular tissues, suggesting that they may play multiple or tissue-specific roles in the tested tissues and organs of B. napus.

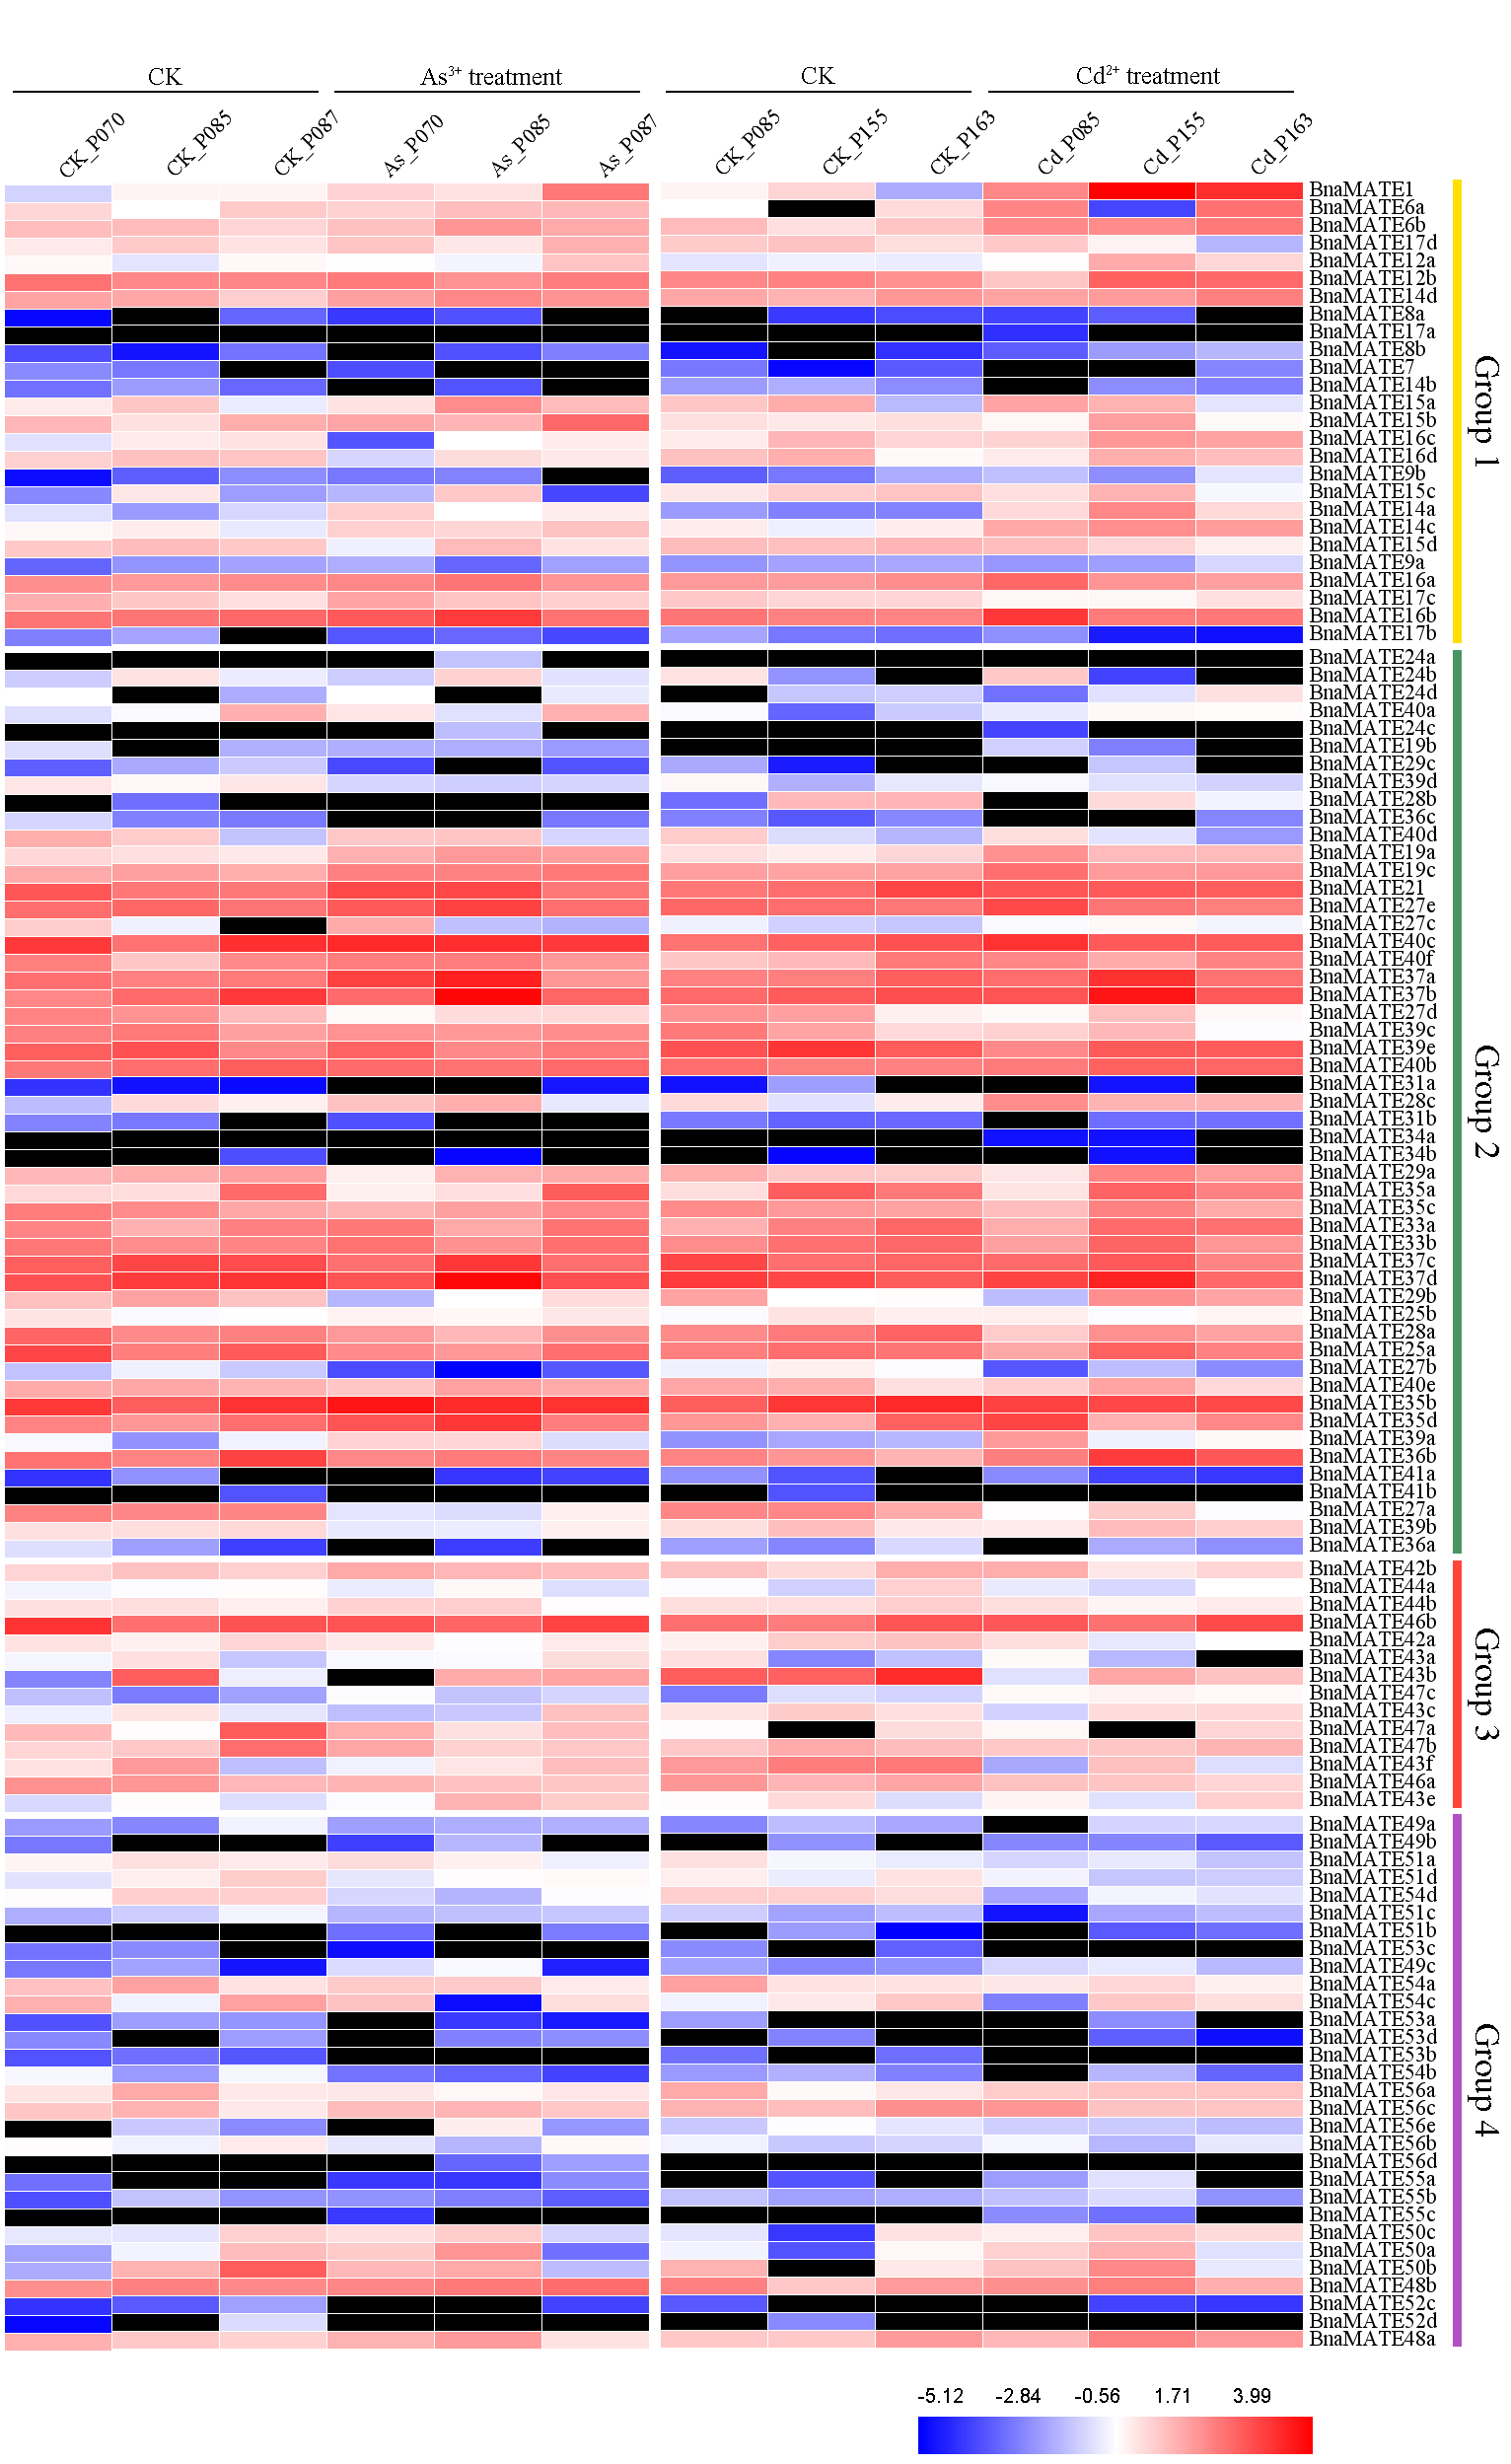
2.7. Expression Patterns of BnaMATE Genes under Heavy Metal Stress

Previous studies showed that the MATE genes have important roles in resistance to various abiotic stresses [13,14,15,16,17,18]. Thus, we investigated the expression patterns of the BnaMATE genes under As3+ and Cd2+ stress using RNA-seq. Under normal conditions, the expression patterns of BnaMATEs were similar to those identified in the absence of metal ion stress, with different expression profiles detected among different rapeseed varieties (Figure 6, Table S7). For instance, BnaMATE33a, BnaMATE33b, BnaMATE37a, BnaMATE37b, BnaMATE37c, and BnaMATE37d were highly expressed in all tissues, whereas BnaMATE31a, BnaMATE31b, and the members of BnaMATE52 and BnaMATE53 were expressed minimally or repressed. In general, the expression of BnaMATE genes in Groups 1, 2, and 4 was clearly induced by As3+ or Cd2+ treatment, whereas that of Group 3 genes was suppressed, compared with their expression under normal conditions (Figure 6).

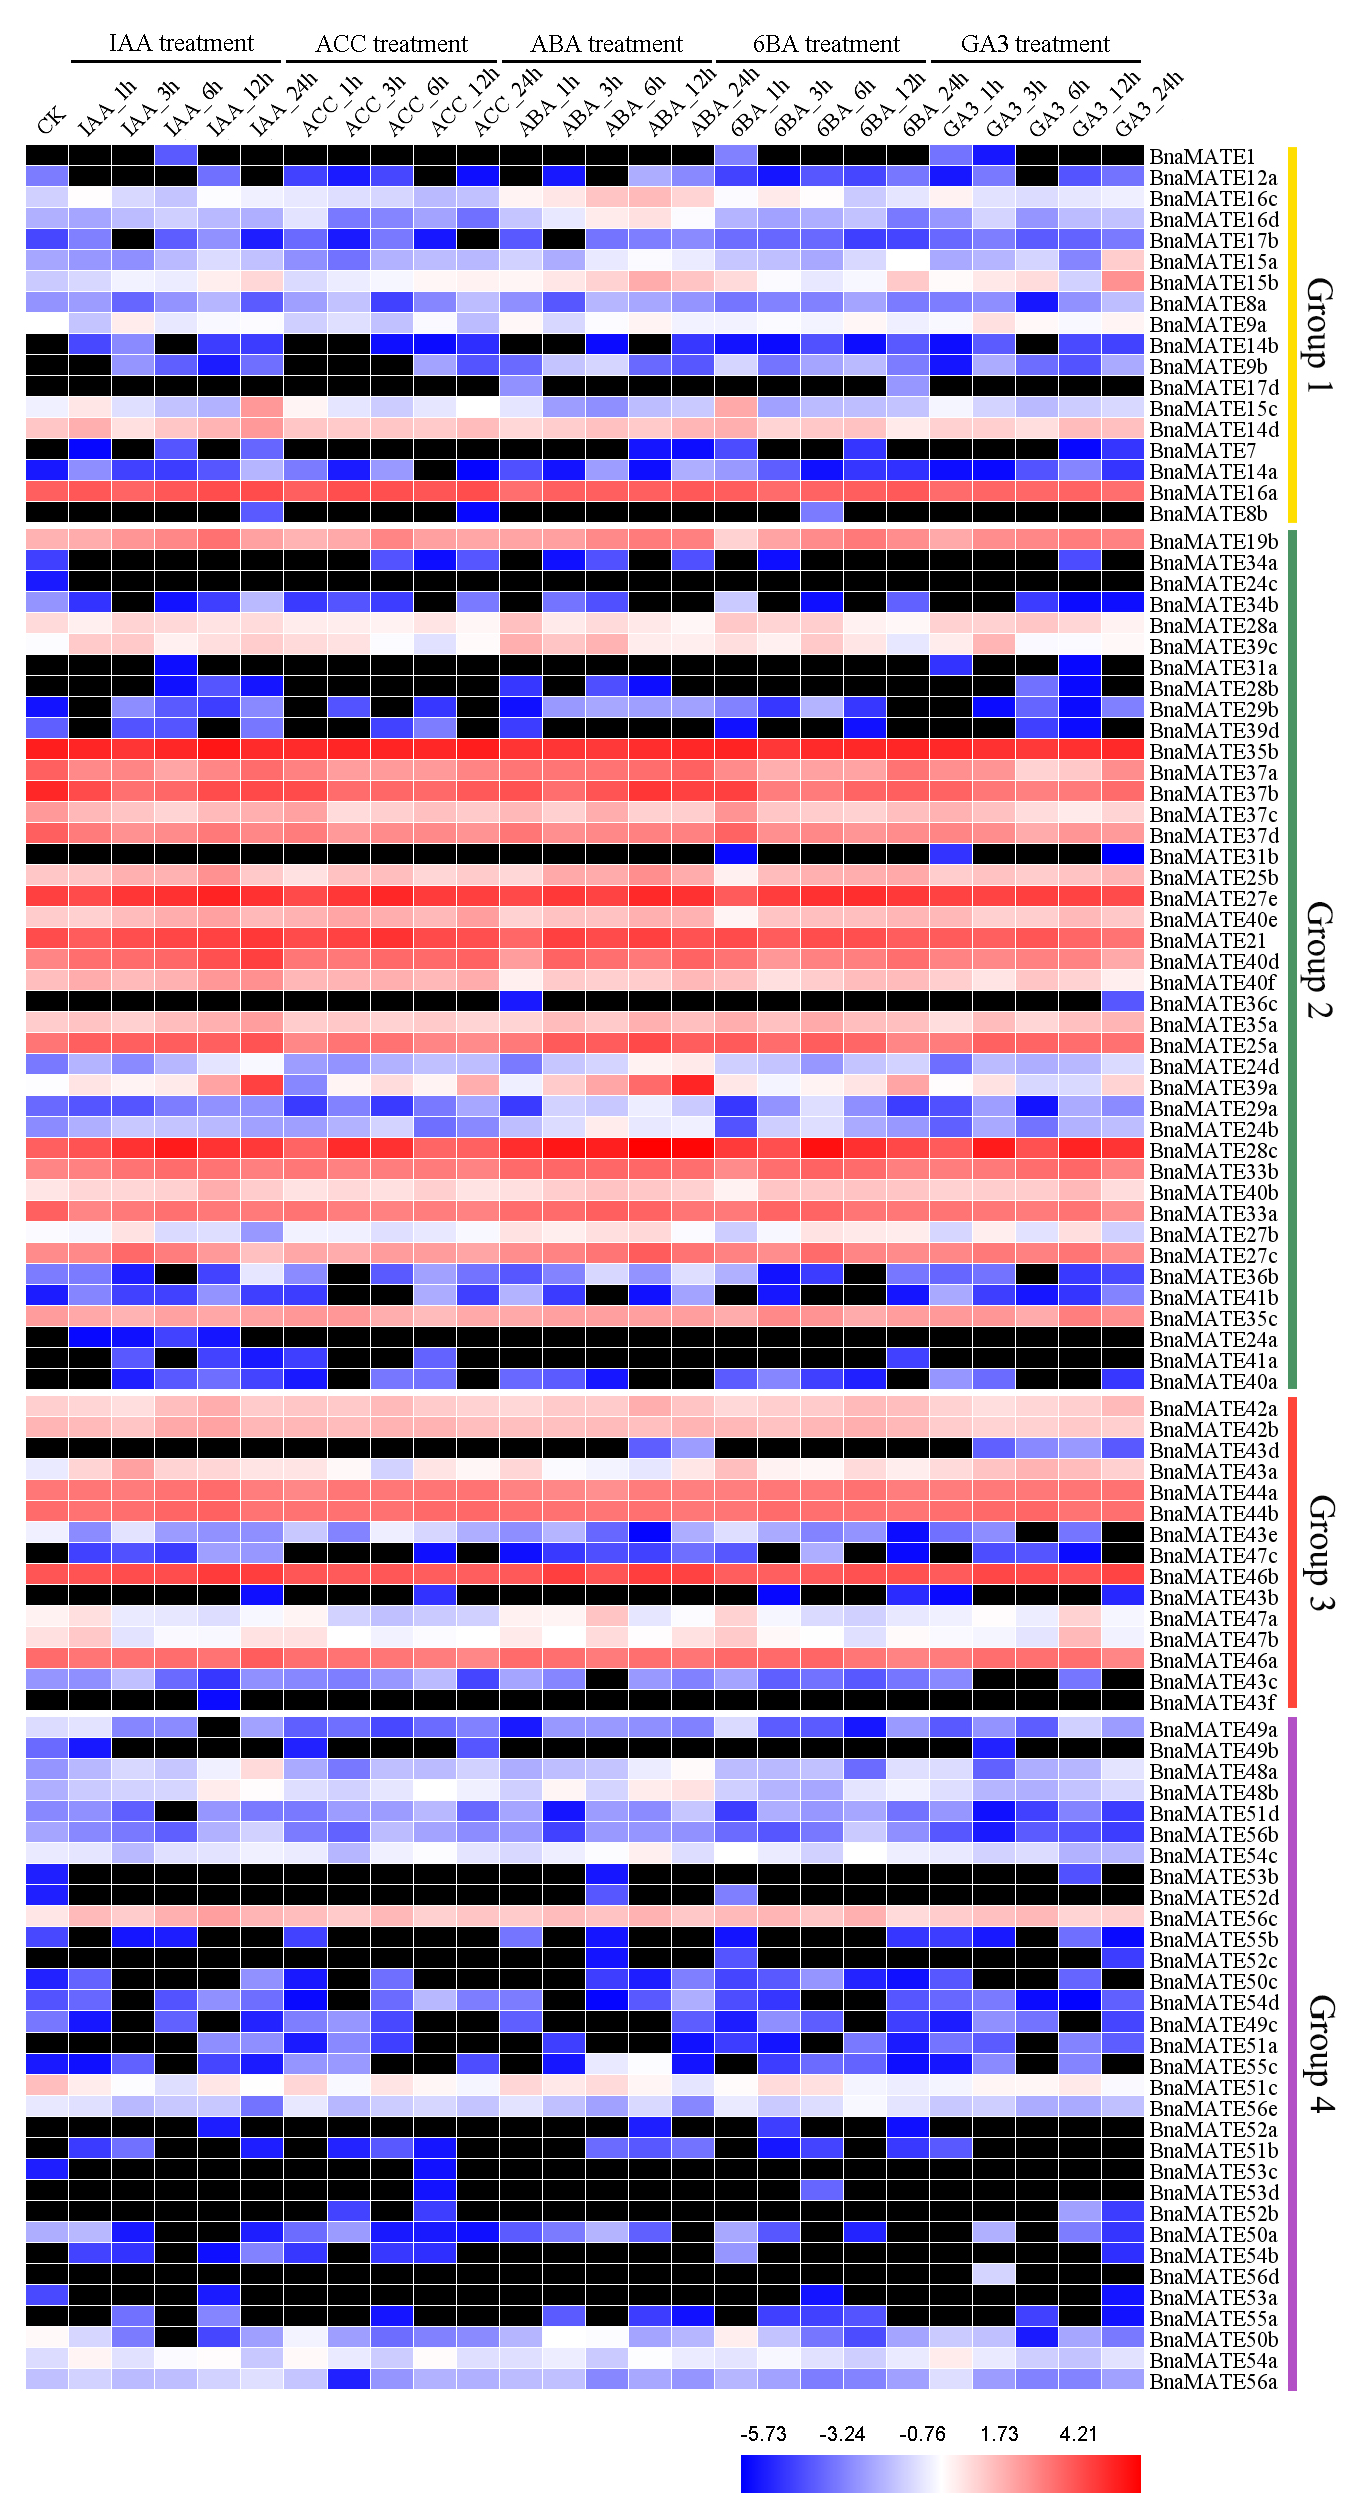
2.8. Expression Patterns of BnaMATE under Hormone Treatments

In A. thaliana, MATE family proteins have significant roles in the transport of hormones, including salicylic acid (SA) and abscisic acid (ABA) [11,16,17,18]. To explore the temporally and spatially specific expression patterns of the BnaMATE genes under hormone treatments, we used the transcriptome sequencing datasets to analysis their expression patterns over the course of treatment with the hormones indoleacetic acid (IAA), aminocyclopropane carboxylic acid (ACC), ABA, gibberellic acid (GA3), and 6-benzyladenine (6BA) (Figure 7). The Group 2 MATE genes showed relatively higher expression after the various hormone treatments than genes in the other three groups, whereas the Group 4 MATE genes were the most weakly expressed and in many cases showed no expression (Figure 7). Some BnaMATEs were up-regulated under multiple hormone treatments, including BnaMATE15b, BnaMATE19b, BnaMATE28c, BnaMATE39a, and BnaMATE43a, whereas others were up-regulated by specific hormone treatment: for example, BnaMATE16c and BnaMATE16d were highly expressed under ABA treatment, whereas BnaMATE39a, BnaMATE48a, and BnaMATE48b seemed more sensitive to IAA and ABA. Other BnaMATE genes were down-regulated by hormones treatment, such as BnaMATE12a, BnaMATE37a, BnaMATE37b, BnaMATE37c, BnaMATE37d, BnaMATE50a, BnaMATE50b, and BnaMATE51c. Overall, these results suggest that many BnaMATE genes may play important roles in processes related to hormones.

3. Discussion

Multidrug and toxic compound extrusion (MATE) is a present categorized multidrug efflux transporter family in almost all prokaryotes and eukaryotes, which is a large family of secondary active transporters in all kingdoms of life [4,22]. Recently, numerous studies of the MATE family have been carried out in plants, in species including rice [20,21], maize [22], tomato [4], upland cotton [23], soybean [24] and potato [38], but they have rarely been studied in the Brassicaceae. However, the Brassicaceae, given their complex history of genome duplication, are a particularly good model for investigating polyploidy in evolution, which is a major evolutionary process in eukaryotes [29,33]. Thus, the completion of Brassicaceae genome sequencing provides an excellent opportunity for the genome-wide characterization of the MATE family in the major Brassica plants, which include three diploid (B. rapa, B. nigra and B. oleracea) and two allotetraploid species (B. juncea and B. napus). Based on our results, we identified 124, 85, 81, 79, and 130 MATE genes in B. napus, B. rapa, B. oleracea, B. nigra, and B. juncea, which in all cases exceeds the 57 found in A. thaliana [13] and is consistent with the past genome duplications. In addition, the phylogenetic tree was supported by the intron–exon structures and motif compositions, as these showed considerable conservation within each group and greater differences between groups, particularly in the numbers and sizes of introns and exons (Figure 2, Table S2). The exonization of intronic sequences and pseudoexonization of exonic sequences play major roles in the divergence of gene structure, which is another likely cause for the functional diversification of MATE genes [43]. Introns are thought to alter gene activities, and the presence of introns in the genome is believed to impose a substantial burden on the host. Interestingly, the only intronless MATE genes were found in Group 4, whose members contains a maximum of only two introns, which is consistent with the patterns in cotton and maize [22,39]; this strongly supports the likelihood that the expansion of the MATE genes in Brassicaceae was also governed by intron loss and gain.
Gene duplication is a major driving force in gene family evolution and expansion [44]. In this study, 113 out of 124 BnaMATE genes (91.1%) were derived from WGD or segmental duplication, suggesting that such duplication events were the main contributors to the expansion of the BnaMATE genes. To establish strong evidence for homology, we assessed microsynteny within the Brassicaceae genomes, as well as syntenic genes between the Brassicaceae and A. thaliana genomes. There were 57 MATE genes in A. thaliana, which would be expected to have 171 MATE genes in B. rapa and B. oleracea given the whole-genome triplication (WGT) that occurred in Brassica species [33,41], and 342 MATE genes in B. napus, which was generated through hybridization of the progenitor species B. rapa and B. oleracea 7500–12,500 years ago [29]. In actuality, we found 85 BraMATE, 81 BolMATE, and 124 BnaMATE genes, indicating that duplicated genes were lost after WGT. Since the divergence of A. thaliana and Brassica, about 35% of genes in Brassica have been lost via deletion [45]. In total, we identified 29 collinear gene pairs between A. thaliana and B. rapa, but only 17 collinear gene pairs between A. thaliana and B. oleracea, although this may be due to assembly errors in the currently available B. oleracea genome information. B. napus, as an allopolyploid, was created through the hybridization of its diploid progenitors B. oleracea and B. rapa. The number of MATE genes (124) in B. napus was far less than the sum of the MATE genes in B. oleracea (81) and B. rapa (85), indicating that MATE gene loss that occurred during the evolution of B. napus. B. juncea is descended from a hybridization between B. rapa and B. nigra. Gene loss occurred among the MATEs of B. juncea as well, such that the number of MATE genes (130) in B. juncea is likewise much lower than the sum of those in B. rapa (85) and B. nigra (79). When we determined the Ka and Ks values, an important tool in investigating the type of selection pressure acting on protein-coding genes [46], we found that, interestingly, the Ka/Ks ratio was <1 for all gene pairs of A. thaliana and B. napus or B. napus and B. napus, indicating that the BnaMATE genes have undergone large-scale purifying selection.
Our synteny analysis between B. napus and its diploid progenitors B. oleracea and B. rapa indicated that most Brassica MATE genes were located in syntenic regions, with 52 gene pairs shared between the Ana subgenome of B. napus and the Ara genome of B. rapa, 44 gene pairs shared between the Cna subgenome of B. napus and the Col genome of B. oleracea, 29 gene pairs shared between the Aju subgenome of B. juncea and the Ana genome of B. napus, and 42 gene pairs shared between the Bju subgenome of B. juncea and Bni genome of B. nigra. Nonetheless, some MATE genes in diploid progenitors were lost. The progenitor species had different numbers of chromosomes, and the A, B, and C subgenomes have undergone rearrangements, during which genes were presumably lost in the process of polyploidization.
According to our phylogenetic analysis, these MATE genes were classified into four groups, which is congruent with previous findings [1,23,24], suggesting similar evolutionary trajectories among these plants. In contrast, the previous studies reported that five MATE subfamilies were identified in tomato [4] and C. sinensis [25], six were identified in potato [36], and seven were identified in maize [22], indicating a functional diversification among plant species in the complex plant processes. In addition, phylogenetic analysis revealed that all of the MATE family genes from Brassicaceae are closely associated with AtMATE genes within the same groups (Figure 1) and exhibited similar exon–intron structures (Figure 4), indicating that members within the subfamily have highly conserved and might have similar functions in the same groups [47]. Group 1 contains 26 BnaMATE genes along with AtMATE1 from A. thaliana, whose protein product mediates the efflux of plant-derived or exogenous toxic compounds from the cytoplasm, conveying resistance to Cd2+ [13], while other members of Group 1 were rarely reported. Group 2 contains 51 BnaMATE genes, along with A. thaliana genes whose products are reported to mediate the transport of alkaloids and phenolic compounds and influence multidrug resistance, such as AtMATE19, AtMATE33, AtMATE35, and AtMATE41. AtMATE19, also known as ALF5 (ABERRANT LATERAL ROOT FORMATION 5), encodes a protein involved in multidrug resistance [48]. The protein product of AtMATE35, also known as FFT (FLOWER FLAVONOID TRANSPORTER), was considered to be a flavonoid transporter [49]; however, other evidence suggests that AtMATE35, as well as AtMATE33, functions as a vacuolar chloride channel involved in cell turgescence during stomatal movements, root hair elongation, and pollen germination [50]. AtMATE41 is also known as TT12 (TRANSPARENT TESTA 12), and previous studies raised the possibility that the functional of TT12 is a flavonoid transporter in Arabidopsis, which is highly specific expressed in developing seeds [7,51,52]. Among the B. napus MATE genes in Group 2, BnaMATE19 genes, because of their close relation with characterized transporters, seem to be the best candidates for conveying the protection of roots against inhibitory compounds; the BnaMATE33 and BnaMATE35 genes most likely encode proteins that function as chloride channels essential for turgor regulation, which may also be involved in the transport phenolic compounds, along with BnaMATE41. Group 3 contains 15 BnaMATE genes along with AtMATE42, AtMATE43, and AtMATE47 from A. thaliana and BolMATE42a from B. oleracea. AtMATE42 encodes the root citrate transporter, which, together with the root malate transporter ALMT1, is involved in the primary mechanism of aluminum (Al) tolerance [53]. AtMATE43 (FRD3, FERRIC REDUCTASE DEFECTIVE 3) encodes a protein responsible for loading citrate, a chelator of Fe, into the root xylem for efficient Fe translocation [54,55]. The AtMATE47 (EDS5, ENHANCED DISEASE SUSCEPTIBILITY) protein product participates in SA-dependent signaling for disease resistance [12,56]. BolMATE42a, also called BolMATE (KF031944), is the homolog of an A. thaliana gene encoding a protein that activates citrate efflux upon exposure to Al3+, leading to enhanced Al tolerance [15].
Overall, these findings strongly suggest that BnaMATE42, BnaMATE43, and BnaMATE47 may be related to Fe and Al homeostasis. Additionally, Group 4 contains 32 BnaMATE genes along with AtMATE48, AtMATE50, and AtMATE51 from A. thaliana. AtMATE48 (BCD1, BUSH, AND CHLOROTIC DWARF 1) is involved in maintaining cellular Fe homeostasis by secreting excess Fe [57], whereas AtMATE50 acts as an ABA efflux transporter [18]; AtMATE51 (ADS1, ACTIVATED DISEASE SUSCEPTIBILITY 1) negatively regulates the accumulation of the plant immune activator SA for disease resistance [11]. Thus, members of this group, especially BnaMATE48, BnaMATE50, and BnaMATE51, encode proteins involved in ABA and SA efflux and Fe tolerance mechanisms.
Gene expression analysis is widely considered a valuable tool for obtaining fundamental information on the possible functions of genes under study [22,39]. To further analyze the temporally and spatially specific expression patterns of BnaMATE genes, we defined their transcription levels in 15 tissues at different developmental stages. We found that most showed differing expression in different tissues (Figure 5), implying that individual MATE genes may play specific roles in the development of individual tissues under normal conditions. The transcription levels of Group 2 BnaMATE genes were higher than those for the other three groups, indicating that the Group 2 genes may be important throughout B. napus development. It is well established that tissue-specific gene expression plays a crucial role in developmental and other physiological processes in specific tissue [58,59]. Among the BnaMATE genes, BnaMATE19a and BnaMATE19c seemed to have high expression levels late in development (Figure 5), and both were orthologous to AtMATE19, which is involved in multidrug resistance [48]. BnaMATE33a, BnaMATE33b, and BnaMATE35c were specifically expressed at high levels in floral organs (Figure 5), and they were orthologous to AtDTX33 and AtDTX35, respectively, which are thought to function as vacuolar chloride channels involved in cell turgescence [50]; AtMATE35 is also considered to be a flavonoid transporter [48]. BnaMATE35b and BnaMATE35d were highly expressed in floral organs, seed coat, and silique pods (Figure 5), suggesting that those proteins may have the same function as AtMATE35. BnaMATE41a and BnaMATE41b had high expression levels during the prometaphase of seed development (Figure 5), which is in accordance with previous studies [7], and they were orthologous to AtMATE41 (TT12), implying that the proteins could play a similar role in flavonoid transport [7,50,51]. BnaMATE37c and BnaMATE37d were highly expressed in all of tissues tested, and BnaMATE24 genes were strongly specifically expressed in seeds, embryos, and seed coat, but no information is available on the functions of these genes or their homologs. Interestingly, we found that BnaMATE47a and BnaMATE47b had a high expression in silique pods (at 30, 40, and 46 DAF) and were probably necessary for SA-dependent signaling, given their close phylogenetic relationship with A. thaliana AtMATE47 [12,56]. We also found tissue-specific gene expression in Group 4 genes: BnaMATE56a, BnaMATE56b, BnaMATE56c, BnaMATE56d, and BnaMATE56e were preferentially expressed in seeds and seed coat. These BnaMATE56 genes were orthologous to AtMATE56, which encodes a protein that participates in increasing CO2 and stomatal closure [60]. It seems that the function of the BnaMATE56 genes has been diverted over evolutionary time. Overall, the results revealed that most duplicated BnaMATE gene pairs had diverse expression patterns, suggesting that the functions of duplicated genes have tended to diversify, conforming to a major theme of long-term evolution.
Having established these basic patterns of MATE gene expression, we next sought to assess how these are influenced by plant exposure to abiotic stress. Heavy metal (Cd2+ and As3+) pollution in agricultural soils is a critical problem affecting crop production and quality, and the expression of some MATE genes is reported to increase in response to various abiotic stresses in plants [13,14,15,61,62,63]. Therefore, we carried out transcriptome expression profiling in B. napus seeds under As3+ and Cd2+ stress, which showed expression changes in BnaMATE genes in response to As3+ and/or Cd2+ stress. For instance, BnaMATE1 showed higher expression under Cd2+ treatment (Figure 6); this was consistent with its status as the homolog of AtMATE1, which is involved in Cd2+ detoxification [13], and it strongly suggests that BnaMATE1 might play an important role in Cd2+ tolerance. BnaMATE6a and BnaMATE6b showed expression patterns similar to that of BnaMATE1, implying that they may have similar functions. Furthermore, 18 and 26 genes were observably up-regulated (to >2-fold) under As3+ or Cd2+ treatment, respectively, compared to control conditions (CK), and 25 and 19 genes were down-regulated (to <0.5-fold); thus, all of these genes may have specific roles in As3+ and Cd2+ stress response. We also noted that some pairs of duplicated genes showed a distinct divergence of expression levels: for example, BnaMATE43b was down-regulated under As3+ or Cd2+ treatment, whereas BnaMATE43e was up-regulated. These results implied that these duplicated genes have developed diverse functions in response to As3+ and Cd2+ stress in the evolutionary history.
Previous studies have confirmed that MATE genes act in hormone transport [16,17,18]. We analyzed the expression profile of the BnaMATE genes in plants treated with five separate hormones for different periods of time through transcriptome expression profiling (Figure 7). We found a variety of expression patterns among BnaMATE family genes. For instance, BnaMATE27e, BnaMATE35c, BnaMATE42a, BnaMATE42b, BnaMATE44a, BnaMATE44b, BnaMATE46a, BnaMATE46b were not induced in response to hormone treatments, whereas BnaMATE12a, BnaMATE37a, BnaMATE37b, BnaMATE37c, BnaMATE37d, BnaMATE50a, BnaMATE50b, and BnaMATE51c were down-regulated, and BnaMATE15b, BnaMATE19b, BnaMATE39a, BnaMATE28c, and BnaMATE43a were up-regulated. Interestingly, BnaMATE16c and BnaMATE16d were specifically up-regulated under ABA treatment, implying that they may function in stomatal closure [64,65], and BnaMATE39a, BnaMATE48a, and BnaMATE48b seemed more sensitive to IAA and ABA than to other hormones (Figure 7). Since BnaMATE50a and BnaMATE50b were orthologous to AtMATE50, which acts as an ABA efflux transporter [18], and BnaMATE51c was orthologous to AtMATE51, which negatively regulates the accumulation of the plant immune activator SA for disease resistance [11], we believe that these BnaMATEs also have specific roles in responses to different hormones. Our results showed the first comprehensive analysis of MATE family genes and investigated expression profiles of BnaMATEs under heavy metals or hormones treatment, laying the foundation for further elucidating the roles of MATE genes in the export of toxins and other substrates.

4. Materials and Methods

4.1. Identification of MATE Transporters in Brassicaceae Species

The MATE transporter gene family has at least 56 members in the A. thaliana genome [13], and a 57th gene, AT2G04066 (Gene ID: 814942), is described by the term “MATE efflux family protein” in the NCBI (National Center for Biotechnology Information) database [66] and was therefore included in this study. The protein sequences of the 57 MATE transporters were downloaded from The Arabidopsis Information Resource (TAIR) database (Table S2) [67]. Using 57 AtMATE sequences as queries, a BLASTp analysis [68] was performed against whole-genome sequences in the BRAD database [37]. The candidate sequences were chosen based on an E-value of ≤1 × 10–30 and further analyzed using Pfamscan (http://www.ebi.ac.uk/Tools/pfa/pfamscan/) to confirm the presence of a MATE domain (PF01554.18, MATE). BLAST analysis of the MATE protein sequences in the B. napus genome database was performed using Geneious 4.8.5 software (http://www.geneious.com/; Biomatters, Auckland, New Zealand). The candidate genes were named using two- or three-letter abbreviations (italicized) denoting the source organism, the family name, and the positions in the subtribe, e.g., BnaMATE1a. The A. thaliana sequences were named following the generic system proposed for A. thaliana as AtMATE1 to AtMATE57, respectively [13].
Genomic, protein, and coding sequences from A. thaliana were downloaded from TAIR and those from B. napus (v5), B. rapa (v3.0), B. oleracea (v1.1), B. juncea (v1.5), and B. nigra (v1.1) were downloaded from the BRAD database. The physicochemical properties of the deduced proteins, including the molecular weight (MW) and isoelectric point (pI), were determined using the ExPASy-ProtParam tool (http://web.expasy.org/protparam/) [69].

4.2. Subcellular Location Analysis of Brassicaceae MATE Transporters

Subcellular location prediction of the candidate MATE proteins was performed with the online TargetP1.1 (http://www.cbs.dtu.dk/services/TargetP/) server [70] and Protein Prowler Subcellular Localization Predictor version 1.2 (http://bioinf.scmb.uq.edu.au/Pprowler_webapp_1-2/) [71]. Validation and determination of the possible cell compartmentalization, as suggested by the two software programs, was done with WoLF PSORT (https://wolfpsort.hgc.jp/) [72].

4.3. Phylogenetic Analysis of Brassicaceae MATE Transporters

The protein sequences of the MATE proteins from A. thaliana and B. napus were used for multiple protein sequence alignments selected with MUSCLE [73] by Molecular Evolutionary Genetics Analysis (MEGA) 7.0 software (Arizona State University, Tempe, Arizona, USA) [74]. Phylogenetic trees were built using the neighbor-joining (NJ) method with 1000 replicates for the bootstrap test [75], and the evolutionary distances were computed using the Poisson correction method [76]. The phylogenetic trees were visualized using FigTree v1.4.2 (http://tree.bio.ed.ac.uk/software/figtree/).

4.4. Chromosomal Distribution, Gene Duplication, and Evolutionary Analysis of Brassicaceae MATE Genes

All MATE genes were mapped to the chromosomes of Brassicaceae species according to their physical distances in the GFF genome files, which were downloaded from BRAD [37]. The physical chromosome maps were visualized with MapChart 2.2 (Plant Research International, Wageningen, Netherlands) [77]. Multiple collinear scanning toolkits (MCScanX) (University of Georgia, Athens, GA, USA) with the default parameters were used to view collinearity and analyze the gene replication events between A. thaliana and the five Brassicaceae species [78].
TBtools was used to construct a schematic diagram of the putative duplications of the MATE genes [79] and calculate the ratio of the nonsynonymous substitution rate (Ka) to the synonymous substitution rate (Ks) with the NG (Nei and Gojobori) method [80]. Divergence time was inferred using the formula T = Ks/2R, where R is 1.5 × 10⁻⁸ synonymous substitutions per site per year [81].

4.5. Gene Structure and Conserved Motif Analysis of BnaMATE Genes

The Gene Structure Display Server (GSDS 2.0: http://gsds.cbi.pku.edu.cn/) [42] was used to analyze the coding regions and genomic DNA sequences of the candidate MATE genes from A. thaliana and B. napus to determine their exon–intron structures. The conserved domains of the MATE protein family were predicted by the NCBI conserved domain search (www.ncbi.nlm.nih.gov/Structure/cdd/wrpsb.cgi) and further confirmed by conducting a Pfam database search. Conserved motifs were determined using MEME 5.0.1 (http://meme-suite.org/) with the following parameters—Motif width, between 6 and 300 residues; Number of repetitions, any; maximum number of motifs, 12 [19] and visualized using TBtools (https://github.com/CJ-Chen/TBtools) [79].

4.6. Expression Patterns of BnaMATE Genes among Tissues and Developmental stages

To obtain a better understanding of the functions of the BnaMATE genes, we investigated their transcriptional levels in the different tissues and organs (roots, stems, leaves, anthocaulus, calyx, petal, pistils, stamens, anthers, filaments, the top of main inflorescence flowers, seeds, embryos, seed coat, and silique pods) of B. napus Zhongshuang No. 11 (ZS11) at different developmental stages. The resulting data were deposited in BioProject with ID PRJNA358784. The fragments per kilobase per million mapped fragments (FPKM) values were normalized using log2 transformation, and then the similarities and differences of the BnaMATE genes were visualized with heatmaps drafted by using Heatmap Illustrator 1.0 (HemI 1.0) (Huazhong University of Science and Technology, Wuhan, Hubei, China) [82].

4.7. Transcriptome Analysis of BnaMATE Genes in Response to Abiotic Stresses

The expression profiles of BnaMATE genes under heavy metal (As3+ and Cd2+) [83] and hormone (BioProject ID PRJNA608211) treatments were investigated by RNA sequencing (RNA-seq). The plant materials and heavy metal and hormone treatments were as described in previous work [83,84,85]. The expression profiles of candidate BnaMATE genes were calculated based on FPKM values and visualized as heatmaps by using HemI 1.0 [82].

Supplementary Materials

Supplementary Materials can be found at https://0-www-mdpi-com.brum.beds.ac.uk/2223-7747/9/9/1072/s1. Table S1. The tissues and organs from B. napus ZS11 used in this study; Table S2. List of the identified MATE genes in B. naps genome; Table S3. MATE collinear genes in A. thaliana, B. napus, B. oleracea, B. rapa, B. juncea and B. nigra; Table S4. Gene duplication pattern in B. napus, B. oleracea, B. rapa, B. nigra and B. juncea; Table S5. The Ka/Ks values duplicaiton time for duplicated MATE gene pairs in B. napus; Table S6. Heat map of expression levels of B. napus MATE family genes at the indicated growth periods and tissues and organs; Table S7 Comparison expression analysis of BnaMATE family genes in rapeseed between the CK and As3+/Cd2+ treatments; Table S8. Comparison expression analysis of BnaMATE family genes in rapeseed between the CK and hormones treatment; Figure S1. The detailed information of motif logos are obtained from the MEME Suite website, Figure S2: The detailed information of conserved domains of MATE proteins between B. napus and A. thaliana.

Author Contributions

C.Q. (Cunmin Qu) and J.L. conceived and designed the experiments; C.Q. (Cailin Qiao) and J.Y. conducted the experiments; Y.W. and S.X. collected and analyzed the data; C.Q. (Cailin Qiao) and M.G. carried out the experiments and performed software; H.D. and Z.T. analyzed the transcriptome data and collected the plant materials; C.Q. (Cailin Qiao), J.Y. and C.Q. (Cunmin Qu) wrote the manuscript; K.L. and J.L. reviewed the manuscript. All authors have read and agreed to the published version of the manuscript.

Funding

This work was supported by National Key R&D Program of China (2018YFD0100500), the National Natural Science Foundation of China (31830067), Fundamental Research Funds for the Central Universities (XDJK2020B030, XDJK2019C099), and the “111” Project (B12006), Modern Agro-industry Technology Research System (CARS-13), Chongqing Special Postdoctoral Science Foundation (cstc2019jcyj-bsh0102).

Acknowledgments

We would like to thank Meichen Zhu and Xintong Zhou for data analysis in this study.

Conflicts of Interest

The authors declare no conflict of interest.

References

  1. Wang, L.; Bei, X.; Gao, J.; Li, Y.; Yan, Y.; Hu, Y. The similar and different evolutionary trends of MATE family occurred between rice and Arabidopsis thaliana. BMC Plant Biol. 2016, 16, 207. [Google Scholar] [CrossRef] [PubMed] [Green Version]
  2. Morita, Y.; Kodama, K.; Shiota, S.; Mine, T.; Kataoka, A.; Mizushima, T.; Tsuchiya, T. NorM, a Putative Multidrug Efflux Protein, of Vibrio parahaemolyticus and Its Homolog in Escherichia coli. Antimicrob. Agents Chemother. 1998, 42, 1778–1782. [Google Scholar] [CrossRef] [PubMed] [Green Version]
  3. Brown, M.H.; Paulsen, I.T.; Skurray, R.A. The multidrug efflux protein NorM is a prototype of a new family of transporters. Mol. Microbiol. 1999, 31, 394–395. [Google Scholar] [CrossRef] [PubMed]
  4. Santos, A.L.d.; Chaves-Silva, S.; Yang, L.; Maia, L.G.S.; Chalfun-Júnior, A.; Sinharoy, S.; Zhao, J.; Benedito, V.A. Global analysis of the MATE gene family of metabolite transporters in tomato. BMC Plant Biol. 2017, 17, 185. [Google Scholar] [CrossRef] [PubMed]
  5. Takanashi, K.; Shitan, N.; Yazaki, K. The multidrug and toxic compound extrusion (MATE) family in plants. Plant Biotechnol. 2014, 31, 417–430. [Google Scholar] [CrossRef] [Green Version]
  6. Shoji, T.; Inai, K.; Yazaki, Y.; Sato, Y.; Takase, H.; Shitan, N.; Yazaki, K.; Goto, Y.; Toyooka, K.; Matsuoka, K.; et al. Multidrug and Toxic Compound Extrusion-Type Transporters Implicated in Vacuolar Sequestration of Nicotine in Tobacco Roots. Plant Physiol. 2009, 149, 708–718. [Google Scholar] [CrossRef] [Green Version]
  7. Debeaujon, I.; Peeters, A.; Léon-Kloosterziel, K.; Koornneef, M. The TRANSPARENT TESTA12 gene of Arabidopsis encodes a multidrug secondary transporter-like protein required for flavonoid sequestration in vacuoles of the seed coat endothelium. Plant Cell 2001, 13, 853–871. [Google Scholar] [CrossRef] [Green Version]
  8. Pérez-Díaz, R.; Ryngajllo, M.; Pérez-Díaz, J.; Peña-Cortés, H.; Casaretto, J.A.; González-Villanueva, E.; Ruiz-Lara, S. VvMATE1 and VvMATE2 encode putative proanthocyanidin transporters expressed during berry development in Vitis vinifera L. Plant Cell Rep. 2014, 33, 1147–1159. [Google Scholar] [CrossRef]
  9. Gomez, C.; Terrier, N.; Torregrosa, L.; Vialet, S.; Fournier-Level, A.; Verriès, C.; Souquet, J.M.; Mazauric, J.P.; Klein, M.; Cheynier, V.; et al. Grapevine MATE-Type Proteins Act as Vacuolar H+-Dependent Acylated Anthocyanin Transporters. Plant Physiol. 2009, 150, 402–415. [Google Scholar] [CrossRef] [Green Version]
  10. Gomez, C.; Conejero, G.; Torregrosa, L.; Cheynier, V.; Terrier, N.; Ageorges, A. In vivo grapevine anthocyanin transport involves vesicle-mediated trafficking and the contribution of anthoMATE transporters and GST. Plant J. 2011, 67, 960–970. [Google Scholar] [CrossRef]
  11. Sun, X.; Gilroy, E.M.; Chini, A.; Nurmberg, P.L.; Hein, I.; Lacomme, C.; Birch, P.R.J.; Hussain, A.; Yun, B.W.; Loake, G.J. ADS1 encodes a MATE-transporter that negatively regulates plant disease resistance. New Phytol. 2011, 192, 471–482. [Google Scholar] [CrossRef] [PubMed] [Green Version]
  12. Ishihara, T.; Sekine, K.T.; Hase, S.; Kanayama, Y.; Seo, S.; Ohashi, Y.; Kusano, T.; Shibata, D.; Shah, J.; Takahashi, H. Overexpression of the Arabidopsis thaliana EDS5 gene enhances resistance to viruses. Plant Biol. 2008, 10, 451–461. [Google Scholar] [CrossRef] [PubMed]
  13. Li, L.; He, Z.; Pandey, G.K.; Tsuchiya, T.; Luan, S. Functional cloning and characterization of a plant efflux carrier for multidrug and heavy metal detoxification. J. Biol. Chem. 2002, 277, 5360–5368. [Google Scholar] [CrossRef] [PubMed] [Green Version]
  14. Furukawa, J.; Yamaji, N.; Wang, H.; Mitani, N.; Murata, Y.; Sato, K.; Katsuhara, M.; Takeda, K.; Ma, J.F. An Aluminum-Activated Citrate Transporter in Barley. Plant Cell Physiol. 2007, 48, 1081–1091. [Google Scholar] [CrossRef] [Green Version]
  15. Wu, X.; Li, R.; Shi, J.; Wang, J.; Sun, Q.; Zhang, H.; Xing, Y.; Qi, Y.; Zhang, N.; Guo, Y.D. Brassica oleracea MATE Encodes a Citrate Transporter and Enhances Aluminum Tolerance in Arabidopsis thaliana. Plant Cell Physiol. 2014, 55, 1426–1436. [Google Scholar] [CrossRef] [Green Version]
  16. Serrano, M.; Wang, B.; Aryal, B.; Garcion, C.; Abou-Mansour, E.; Heck, S.; Geisler, M.; Mauch, F.; Nawrath, C.; Métraux, J.P. Export of Salicylic Acid from the Chloroplast Requires the Multidrug and Toxin Extrusion-Like Transporter EDS5. Plant Physiol. 2013, 162, 1815–1821. [Google Scholar] [CrossRef] [Green Version]
  17. Yamasaki, K.; Motomura, Y.; Yagi, Y.; Nomura, H.; Kikuchi, S.; Nakai, M.; Shiina, T. Chloroplast envelope localization of EDS5, an essential factor for salicylic acid biosynthesis in Arabidopsis thaliana. Plant Signal Behav. 2013, 8, e23603. [Google Scholar] [CrossRef] [Green Version]
  18. Zhang, H.; Zhu, H.; Pan, Y.; Yu, Y.; Luan, S.; Li, L. A DTX/MATE-Type Transporter Facilitates Abscisic Acid Efflux and Modulates ABA Sensitivity and Drought Tolerance in Arabidopsis. Mol. Plant 2014, 7, 1522–1532. [Google Scholar] [CrossRef] [Green Version]
  19. Omote, H.; Hiasa, M.; Matsumoto, T.; Otsuka, M.; Moriyama, Y. The MATE proteins as fundamental transporters of metabolic and xenobiotic organic cations. Trends Pharmacol. Sci. 2006, 27, 587–593. [Google Scholar] [CrossRef]
  20. Hvorup, R.N.; Winnen, B.; Chang, A.B.; Jiang, Y.; Zhou, X.F.; Saier, M.H. The multidrug/oligosaccharidyl-lipid/polysaccharide (MOP) exporter superfamily. Eur. J. Biochem. 2003, 270, 799–813. [Google Scholar] [CrossRef]
  21. Tiwari, M.; Sharma, D.; Singh, M.; Tripathi, R.D.; Trivedi, P.K. Expression of OsMATE1 and OsMATE2 alters development, stress responses and pathogen susceptibility in Arabidopsis. Sci. Rep. 2014, 4, 3964. [Google Scholar] [CrossRef] [PubMed] [Green Version]
  22. Zhu, H.; Wu, J.; Jiang, Y.; Jin, J.; Zhou, W.E.I.; Wang, Y.U.; Han, G.; Zhao, Y.; Cheng, B. Genomewide analysis of MATE-type gene family in maize reveals microsynteny and their expression patterns under aluminum treatment. J. Genet. 2016, 95, 691–704. [Google Scholar] [CrossRef] [PubMed]
  23. Xu, L.; Shen, Z.; Chen, W.; Si, G.; Meng, Y.; Guo, N.; Sun, X.; Cai, Y.; Lin, Y.; Gao, J. Phylogenetic analysis of upland cotton MATE gene family reveals a conserved subfamily involved in transport of proanthocyanidins. Mol. Biol. Rep. 2019, 46, 161–175. [Google Scholar] [CrossRef] [PubMed]
  24. Liu, J.; Li, Y.; Wang, W.; Gai, J.; Li, Y. Genome-wide analysis of MATE transporters and expression patterns of a subgroup of MATE genes in response to aluminum toxicity in soybean. BMC Genom. 2016, 17, 223. [Google Scholar] [CrossRef] [PubMed] [Green Version]
  25. Julião, M.H.M.; Silva, S.R.; Ferro, J.A.; Varani, A.M. A Genomic and Transcriptomic Overview of MATE, ABC, and MFS Transporters in Citrus sinensis Interaction with Xanthomonas citri subsp. citri. Plants 2020, 9, 794. [Google Scholar]
  26. Nagaharu, U.; Nagaharu, N. Genome analysis in Brassica with special reference to the experimental formation of B. napus and peculiar mode of fertilization. J. Japan Bot. 1935, 7, 389–452. [Google Scholar]
  27. Kim, J.; Lee, J.; Choi, J.P.; Park, I.; Yang, K.; Kim, M.K.; Lee, Y.H.; Nou, I.S.; Kim, D.S.; Min, S.R.; et al. Functional innovations of three chronological mesohexaploid Brassica rapa genomes. BMC Genom. 2014, 15, 606. [Google Scholar] [CrossRef] [Green Version]
  28. Yu, J.; Hu, F.; Dossa, K.; Wang, Z.; Ke, T. Genome-wide analysis of UDP-glycosyltransferase super family in Brassica rapa and Brassica oleracea reveals its evolutionary history and functional characterization. BMC Genom. 2017, 18, 474. [Google Scholar] [CrossRef] [Green Version]
  29. Chalhoub, B.; Denoeud, F.; Liu, S.; Parkin, I.A.; Tang, H.; Wang, X. Early allopolyploid evolution in the post-Neolithic Brassica napus oilseed genome. Science 2014, 345, 950–953. [Google Scholar] [CrossRef] [Green Version]
  30. Jenczewski, E.; Chèvre, A.M.; Alix, K. Chromosomal and Gene Expression Changes in Brassica Allopolyploids. In Polyploid and Hybrid Genomics; Chen, Z.J., Birchler, J.A., Eds.; John Wiley & Sons, Inc.: Oxford, IA, USA, 2013; pp. 171–186. [Google Scholar]
  31. Lee, T.-H.; Tang, H.; Wang, X.; Paterson, A.H. PGDD: A database of gene and genome duplication in plants. Nucleic Acids Res. 2013, 41, D1152–D1158. [Google Scholar] [CrossRef]
  32. Sun, F.; Fan, G.; Hu, Q.; Zhou, Y.; Guan, M.; Tong, C.; Li, J.; Du, D.; Qi, C.; Jiang, L.; et al. The high-quality genome of Brassica napus cultivar ‘ZS11’ reveals the introgression history in semi-winter morphotype. Plant J. 2017, 92, 452–468. [Google Scholar] [CrossRef] [PubMed] [Green Version]
  33. Liu, S.; Liu, Y.; Yang, X.; Tong, C.; Edwards, D.; Parkin, I.A.P.; Zhao, M.; Ma, J.; Yu, J.; Huang, S.; et al. The Brassica oleracea genome reveals the asymmetrical evolution of polyploid genomes. Nat. Commun. 2014, 5, 3930. [Google Scholar] [CrossRef] [PubMed]
  34. Wang, X.; Wang, H.; Wang, J.; Sun, R.; Wu, J.; Liu, S.; Bai, Y.; Mun, J.H.; Bancroft, I.; Cheng, F.; et al. The genome of the mesopolyploid crop species Brassica rapa. Nat. Genet. 2011, 43, 1035–1039. [Google Scholar] [CrossRef] [PubMed] [Green Version]
  35. Yang, J.; Liu, D.; Wang, X.; Ji, C.; Cheng, F.; Liu, B.; Hu, Z.; Chen, S.; Pental, D.; Ju, Y.; et al. The genome sequence of allopolyploid Brassica juncea and analysis of differential homoeolog gene expression influencing selection. Nat. Genet. 2016, 48, 1225–1232. [Google Scholar] [CrossRef]
  36. Perumal, S.; Koh, C.S.; Jin, L.; Buchwaldt, M.; Higgins, E.; Zheng, C.; Sankoff, D.; Robinson, S.J.; Kagale, S.; Navabi, Z.; et al. High contiguity long read assembly of Brassica nigra allows localization of active centromeres and provides insights into the ancestral Brassica genome. BioRxiv 2020, 932665. [Google Scholar] [CrossRef] [Green Version]
  37. Cheng, F.; Liu, S.; Wu, J.; Fang, L.; Sun, S.; Liu, B.; Li, P.; Hua, W.; Wang, X. BRAD, the genetics and genomics database for Brassica plants. BMC Plant. Biol. 2011, 11, 136. [Google Scholar] [CrossRef] [Green Version]
  38. Li, Y.; He, H.; He, L.F. Genome-wide analysis of the MATE gene family in potato. Mol. Biol. Rep. 2019, 46, 403–414. [Google Scholar] [CrossRef]
  39. Lu, P.; Magwanga, R.O.; Guo, X.; Kirungu, J.N.; Lu, H.; Cai, X.; Zhou, Z.; Wei, Y.; Wang, X.; Zhang, Z.; et al. Genome-Wide Analysis of Multidrug and Toxic Compound Extrusion (MATE) Family in Gossypium raimondii and Gossypium arboreum and Its Expression Analysis Under Salt, Cadmium, and Drought Stress. G3 Genes Genom. Genet. 2018, 8, 2483–2500. [Google Scholar]
  40. Wei, L.; Zhu, Y.; Liu, R.; Zhang, A.; Zhu, M.; Xu, W.; Lin, A.; Lu, K.; Li, J. Genome wide identification and comparative analysis of glutathione transferases (GST) family genes in Brassica napus. Sci. Rep. 2019, 9, 9196. [Google Scholar] [CrossRef] [Green Version]
  41. Cheng, F.; Wu, J.; Wang, X. Genome triplication drove the diversification of Brassica plants. Hortic. Res. 2014, 1, 14024. [Google Scholar] [CrossRef] [Green Version]
  42. Hu, B.; Jin, J.; Guo, A.Y.; Zhang, H.; Luo, J.; Gao, G. GSDS 2.0: An upgraded gene feature visualization server. Bioinformatics 2015, 31, 1296–1297. [Google Scholar] [CrossRef] [Green Version]
  43. Fan, K.; Wang, M.; Miao, Y.; Ni, M.; Bibi, N.; Yuan, S.; Li, F.; Wang, X. Molecular Evolution and Expansion Analysis of the NAC Transcription Factor in Zea mays. PLoS ONE 2014, 9, e111837. [Google Scholar] [CrossRef] [PubMed] [Green Version]
  44. Taylor, J.S.; Raes, J. Duplication and Divergence: The Evolution of New Genes and Old Ideas. Annu. Rev. Genet. 2004, 38, 615–643. [Google Scholar] [CrossRef] [PubMed] [Green Version]
  45. Town, C.D.; Cheung, F.; Maiti, R.; Crabtree, J.; Haas, B.J.; Wortman, J.R.; Hine, E.E.; Althoff, R.; Arbogast, T.S.; Tallon, L.J.; et al. Comparative Genomics of Brassica oleracea and Arabidopsis thaliana Reveal Gene Loss, Fragmentation, and Dispersal after Polyploidy. Plant Cell 2006, 18, 1348–1359. [Google Scholar] [CrossRef] [PubMed] [Green Version]
  46. Zhang, Z.; Li, J.; Zhao, X.Q.; Wang, J.; Wong, G.K.; Yu, J. KaKs_Calculator: Calculating Ka and Ks through model selection and model averaging. Genom. Proteom. Bioinf. 2006, 4, 259–263. [Google Scholar] [CrossRef] [Green Version]
  47. Sun, H.; Fan, H.J.; Ling, H.Q. Genome-wide identification and characterization of the bHLH gene family in tomato. BMC Genom. 2015, 16, 9. [Google Scholar] [CrossRef] [Green Version]
  48. Diener, A.C.; Gaxiola, R.A.; Fink, G.R. Arabidopsis ALF5, a multidrug efflux transporter gene family member, confers resistance to toxins. Plant Cell 2001, 13, 1625–1637. [Google Scholar] [CrossRef] [Green Version]
  49. Thompson, E.P.; Wilkins, C.; Demidchik, V.; Davies, J.M.; Glover, B.J. An Arabidopsis flavonoid transporter is required for anther dehiscence and pollen development. J. Exp. Bot. 2010, 61, 439–451. [Google Scholar] [CrossRef] [Green Version]
  50. Zhang, H.; Zhao, F.; Tang, R.; Yu, Y.; Song, J.; Wang, Y.; Li, L.; Luan, S. Two tonoplast MATE proteins function as turgor-regulating chloride channels in Arabidopsis. Proc. Natl. Acad. Sci. USA 2017, 114, E2036–E2045. [Google Scholar] [CrossRef] [Green Version]
  51. Chai, Y.; Lei, B.; Huang, H.; Li, J.; Yin, J.; Tang, Z.; Wang, R.; Chen, L. TRANSPARENT TESTA 12 genes from Brassica napus and parental species: Cloning, evolution, and differential involvement in yellow seed trait. Mol. Genet. Genom. 2009, 281, 109–123. [Google Scholar] [CrossRef]
  52. Marinova, K.; Pourcel, L.; Weder, B.; Schwarz, M.; Barron, D.; Routaboul, J.M.; Debeaujon, I.; Klein, M. The Arabidopsis MATE Transporter TT12 Acts as a Vacuolar Flavonoid/H+-Antiporter Active in Proanthocyanidin-Accumulating Cells of the Seed Coat. Plant Cell 2007, 19, 2023–2038. [Google Scholar] [CrossRef] [Green Version]
  53. Liu, J.; Luo, X.; Shaff, J.; Liang, C.; Jia, X.; Li, Z.; Magalhaes, J.; Kochian, L.V. A promoter-swap strategy between the AtALMT and AtMATE genes increased Arabidopsis aluminum resistance andimproved carbon-use efficiency for aluminum resistance. Plant J. 2012, 71, 327–337. [Google Scholar] [CrossRef] [PubMed]
  54. Green, L.S.; Rogers, E.E. FRD3 Controls Iron Localization in Arabidopsis. Plant Physiol. 2004, 136, 2523–2531. [Google Scholar] [CrossRef] [PubMed] [Green Version]
  55. Durrett, T.P.; Gassmann, W.; Rogers, E.E. The FRD3-Mediated Efflux of Citrate into the Root Vasculature Is Necessary for Efficient Iron Translocation. Plant Physiol. 2007, 144, 197–205. [Google Scholar] [CrossRef] [PubMed] [Green Version]
  56. Nawrath, C.; Heck, S.; Parinthawong, N.; Métraux, J.P. EDS5, an Essential Component of Salicylic Acid–Dependent Signaling for Disease Resistance in Arabidopsis, Is a Member of the MATE Transporter Family. Plant Cell 2002, 14, 275–286. [Google Scholar] [CrossRef] [PubMed] [Green Version]
  57. Seo, P.J.; Park, J.; Park, M.J.; Kim, Y.S.; Kim, S.G.; Jung, J.H.; Park, C.M. A Golgi-localized MATE transporter mediates iron homoeostasis under osmotic stress in Arabidopsis. Biochem. J. 2012, 442, 551–561. [Google Scholar] [CrossRef] [Green Version]
  58. Ingram, G.C.; Boisnard-Lorig, C.; Dumas, C.; Rogowsky, P.M. Expression patterns of genes encoding HD-ZipIV homeo domain proteins define specific domains in maize embryos and meristems. Plant J. 2000, 22, 401–414. [Google Scholar] [CrossRef]
  59. Gallie, D.R.; Geisler-Lee, J.; Chen, J.; Jolley, B. Tissue-specific expression of the ethylene biosynthetic machinery regulates root growth in maize. Plant Mol. Biol. 2009, 69, 195–211. [Google Scholar] [CrossRef]
  60. Tian, W.; Hou, C.; Ren, Z.; Pan, Y.; Jia, J.; Zhang, H.; Bai, F.; Zhang, P.; Zhu, H.; He, Y.; et al. A molecular pathway for CO2 response in Arabidopsis guard cells. Nat. Commun. 2015, 6, 6057. [Google Scholar] [CrossRef] [Green Version]
  61. Yokosho, K.; Yamaji, N.; Fujii-Kashino, M.; Ma, J.F. Functional Analysis of a MATE Gene OsFRDL2 Revealed its Involvement in Al-Induced Secretion of Citrate, but a Lower Contribution to Al Tolerance in Rice. Plant Cell Physiol. 2016, 57, 976–985. [Google Scholar] [CrossRef] [Green Version]
  62. Liu, J.; Magalhaes, J.V.; Shaff, J.; Kochian, L.V. Aluminum-activated citrate and malate transporters from the MATE and ALMT families function independently to confer Arabidopsis aluminum tolerance. Plant J. 2009, 57, 389–399. [Google Scholar] [CrossRef] [PubMed] [Green Version]
  63. Wang, J.; Hou, Q.; Li, P.; Yang, L.; Sun, X.; Benedito, V.A.; Wen, J.; Chen, B.; Mysore, K.S.; Zhao, J. Diverse functions of multidrug and toxin extrusion (MATE) transporters in citric acid efflux and metal homeostasis in Medicago truncatula. Plant J. 2017, 90, 79–95. [Google Scholar] [CrossRef] [PubMed] [Green Version]
  64. Cai, S.; Chen, G.; Wang, Y.; Huang, Y.; Marchant, D.B.; Wang, Y.; Yang, Q.; Dai, F.; Hills, A.; Franks, P.J.; et al. Evolutionary Conservation of ABA Signaling for Stomatal Closure. Plant Physiol. 2017, 174, 732–747. [Google Scholar] [CrossRef] [PubMed]
  65. Xie, Y.; Mao, Y.; Zhang, W.; Lai, D.; Wang, Q.; Shen, W. Reactive Oxygen Species-Dependent Nitric Oxide Production Contributes to Hydrogen-Promoted Stomatal Closure in Arabidopsis. Plant Physiol. 2014, 165, 759–773. [Google Scholar] [CrossRef] [PubMed] [Green Version]
  66. Lu, S.; Wang, J.; Chitsaz, F.; Derbyshire, M.K.; Geer, R.C.; Gonzales, N.R.; Gwadz, M.; Hurwitz, D.I.; Marchler, G.H.; Song, J.S.; et al. CDD/SPARCLE: The conserved domain database in 2020. Nucleic Acids Res. 2020, 48, D265–D268. [Google Scholar] [CrossRef] [Green Version]
  67. Reiser, L.; Subramaniam, S.; Li, D.; Huala, E. Using the Arabidopsis information resource (TAIR) to find information about Arabidopsis genes. Curr. Protoc. Bioinform. 2017, 60, 1.11.1–1.11.45. [Google Scholar] [CrossRef]
  68. Altschul, S.F.; Madden, T.L.; Schäffer, A.A.; Zhang, J.; Zhang, Z.; Miller, W.; Lipman, D.J. Gapped BLAST and PSI-BLAST: A new generation of protein database search programs. Nucleic Acids Res. 1997, 25, 3398–3402. [Google Scholar] [CrossRef] [Green Version]
  69. Gasteiger, E.; Gattiker, A.; Hoogland, C.; Ivanyi, I.; Appel, R.D.; Bairoch, A. ExPASy: The proteomics server for in-depth protein knowledge and analysis. Nucleic Acids Res. 2003, 31, 3784–3788. [Google Scholar] [CrossRef] [Green Version]
  70. Emanuelsson, O.; Brunak, S.; von Heijne, G.; Nielsen, H. Locating proteins in the cell using TargetP, SignalP and related tools. Nat. Protoc. 2007, 2, 953–971. [Google Scholar] [CrossRef]
  71. Boden, M.; Hawkins, J. Prediction of subcellular localization using sequence-biased recurrent networks. Bioinformatics 2005, 21, 2279–2286. [Google Scholar] [CrossRef] [Green Version]
  72. Horton, P.; Park, K.J.; Obayashi, T.; Fujita, N.; Harada, H.; Adams-Collier, C.J.; Nakai, K. WoLF PSORT: Protein localization predictor. Nucleic Acids Res. 2007, 35, W585–W587. [Google Scholar] [CrossRef] [PubMed] [Green Version]
  73. Edgar, R.C. MUSCLE: Multiple sequence alignment with high accuracy and high throughput. Nucleic Acids Res. 2004, 32, 1792–1797. [Google Scholar] [CrossRef] [PubMed] [Green Version]
  74. Kumar, S.; Stecher, G.; Tamura, K. MEGA7: Molecular Evolutionary Genetics Analysis Version 7.0 for Bigger Datasets. Mol. Biol. Evol. 2016, 33, 1870–1874. [Google Scholar] [CrossRef] [PubMed] [Green Version]
  75. Saitou, N.; Nei, M. The neighbor-joining method A new method for reconstructing phylogenetic trees. Mol. Biol. Evol. 1987, 4, 406–425. [Google Scholar] [PubMed]
  76. Zuckerkandl, E.; Pauling, L. Evolutionary divergence and convergence in proteins. In Evolving Genes and Proteins; Bryson, V., Vogel, H.J., Eds.; Academic Press: New York, NY, USA, 1965; pp. 97–166. [Google Scholar]
  77. Voorrips, R.E. MapChart: Software for the graphical presentation of linkage maps and QTLs. J. Hered. 2002, 93, 77–78. [Google Scholar] [CrossRef] [Green Version]
  78. Wang, Y.; Tang, H.; Debarry, J.D.; Tan, X.; Li, J.; Wang, X.; Lee, T.H.; Jin, H.; Marler, B.; Guo, H.; et al. MCScanX: A toolkit for detection and evolutionary analysis of gene synteny and collinearity. Nucleic Acids Res. 2012, 40, e49. [Google Scholar] [CrossRef] [Green Version]
  79. Chen, C.; Chen, H.; Zhang, Y.; Thomas, H.R.; Frank, M.H.; He, Y.; Xia, R. TBtools: An Integrative Toolkit Developed for Interactive Analyses of Big Biological Data. Mol. Plant. 2020, 13, 1192–1204. [Google Scholar] [CrossRef]
  80. Nei, M.; Gojobori, T. Simple methods for estimating the numbers of synonymous and nonsynonymous nucleotide substitutions. Mol. Biol. Evol. 1986, 3, 418–426. [Google Scholar]
  81. Koch, M.A.; Haubold, B.; Mitchell-Olds, T. Comparative evolutionary analysis of chalcone synthase and alcohol dehydrogenase loci in Arabidopsis, Arabis, and related genera (Brassicaceae). Mol. Biol. Evol. 2000, 17, 1483–1498. [Google Scholar] [CrossRef] [Green Version]
  82. Zhang, Z.; Deng, W.; Wang, Y.; Liu, Z.; Cheng, H.; Xue, Y. HemI: A Toolkit for Illustrating Heatmaps. PLoS ONE 2014, 9, e111988. [Google Scholar]
  83. Wan, Y.; Wang, Z.; Xia, J.; Shen, S.; Guan, M.; Zhu, M.; Qiao, C.; Sun, F.; Liang, Y.; Li, J.; et al. Genome-Wide Analysis of Phosphorus Transporter Genes in Brassica and Their Roles in Heavy Metal Stress Tolerance. Int. J. Mol. Sci. 2020, 21, 2209. [Google Scholar] [CrossRef] [PubMed] [Green Version]
  84. Guo, P.; Wen, J.; Yang, J.; Ke, Y.; Wang, M.; Liu, M.; Ran, F.; Wu, Y.; Li, P.; Li, J.; et al. Genome-wide survey and expression analyses of the GRAS gene family in Brassica napus reveals their roles in root development and stress response. Planta 2019, 250, 1051–1072. [Google Scholar] [CrossRef] [PubMed] [Green Version]
  85. Ke, Y.Z.; Wu, Y.W.; Zhou, H.J.; Chen, P.; Wang, M.M.; Liu, M.M.; Li, P.F.; Yang, J.; Li, J.N.; Du, H. Genome-wide survey of the bHLH super gene family in Brassica napus. BMC Plant Biol. 2020, 20, 115. [Google Scholar] [CrossRef] [PubMed] [Green Version]
Figure 1. Phylogenetic analysis of the multidrug and toxic compound extrusion (MATE) transporters. The rooted neighbor-joining phylogenetic tree was constructed using MEGA7.0 and visualized using Figure Tree v1.4.2. There are 556 MATEs in A. thaliana and five Brassicaceae species, including 57 AtMATEs, 124 BnaMATEs, 85 BraMATEs, 81 BolMATEs, 79 BniMATEs, and 130 BjuMATEs. These MATE transporters are divided into four subgroups, Groups 1–4, which are marked in yellow, green, red, and purple, respectively. The outer circle represents the four groups.
Plants 09 01072 g001
Figure 2. Chromosomal distribution and analysis of duplication events in MATE family genes among Brassicaceae species. (a) Chromosomal distribution and analysis of duplication events in MATE family genes among A subgenome. (b) Chromosomal distribution and analysis of duplication events in MATE family genes among B subgenome. (c) Chromosomal distribution and analysis of duplication events in MATE family genes among C subgenome. Genes from the same subgroups are indicated by the same color, which is consistent with that for the corresponding family in the phylogenetic tree (Figure 1); genes located on the scaffold are not shown. The labels on the corresponding chromosomes indicate the source organism and the subgenome. The scales indicate the sizes of the various Brassica genomes (Mb). Bra, B. rapa; Bol, B. oleracea; Bni, B. nigra; Bna, B. napus; Bju, B. juncea.
Plants 09 01072 g002aPlants 09 01072 g002b
Figure 3. Duplicated and orthologous genes in the Brassicaceae. (a) Circle plot of orthologous genes in A. thaliana (At), B. oleracea (Bol), B. rapa (Bra), B. napus (Bna), B. juncea (Bju), and B. nigra (Bni). (b) Density of Ks values of MATE gene pairs between B. napus and A. thaliana. (c) Duplicate gene pairs in B. napus. (d) Density of Ks values of duplicated MATE genes in B. napus. (e) Duplicate gene pairs in B. juncea.
Plants 09 01072 g003aPlants 09 01072 g003b
Figure 4. Gene structure and conserved motifs in MATE genes from Brassica napus and Arabidopsis thaliana. (a) The neighbor-joining tree was generated from the alignment of 181 MATE genes from A. thaliana and B. napus. The different background colors represent the four subgroups. (b) Gene structures were generated using the Gene Structure Display Server (GSDS 2.0) [42]. Yellow boxes indicate exons, black lines indicate introns, and blue boxes indicate untranslated regions (UTRs) of genes. (c) Conserved motifs were detected using MEME and are shown as boxes of different colors (numbered as motifs 1–12).
Plants 09 01072 g004aPlants 09 01072 g004b
Figure 5. Expression patterns of all 124 BnaMATE genes in 15 different tissues at different developmental stages in B. napus. The color bar represents log2 expression levels (fragments per kilobase per million mapped fragments, or FPKM). Red, blue, and white indicate high, low, and medium expression levels, respectively, and black indicates no expression (FPKM = 0). The abbreviations above the heatmap indicate the different tissues and organs/developmental stages of B. napus ZS11 (listed in Table S1).
Plants 09 01072 g005
Figure 6. Expression analysis of BnaMATE family genes in different rapeseed tissues under As3+ and Cd2+ treatment. The color bar represents log2 expression levels (FPKM). Red, blue, and white indicate high, low, and medium expression levels, respectively, and black indicates no expression (FPKM = 0). The abbreviations above the heatmap indicate the different cultivars of B. napus tested (listed in Table S7).
Plants 09 01072 g006
Figure 7. Expression analysis of BnaMATE family genes under hormone treatments. The color bar represents log2 expression levels (FPKM). Red, blue, and white indicate high, low, and medium expression levels, respectively, and black indicates no expression (FPKM = 0). 18 BnaMATE genes are not shown because their expression was not detected in any condition. The abbreviations above the heatmap indicate the different hormones used to treat rapeseed plants (listed in Table S8).
Plants 09 01072 g007
Table 1. Statistics for MATE genes in each subgroup between A. thaliana and five Brassicaceae species.
TypeFamilyA. thalianaB. napusB. oleraceaB. rapaB. junceaB. nigra
Group 1MATE1AtMATE11/12/
MATE1AtMATE2/////
MATE1AtMATE3/1/1/
MATE1AtMATE4/11/1
MATE1AtMATE5///11
MATE1AtMATE62/11/
MATE1AtMATE71/122
MATE1AtMATE823121
MATE1AtMATE922221
MATE1AtMATE10/////
MATE1AtMATE11/////
MATE1AtMATE12211//
MATE1AtMATE13/2253
MATE1AtMATE1445475
MATE1AtMATE1542122
MATE1AtMATE1642332
MATE1AtMATE1742233
MATE1AtMATE57/////
Group 2MATE2AtMATE18///3/
MATE2AtMATE1932225
MATE2AtMATE20/////
MATE2AtMATE2111221
MATE2AtMATE22/////
MATE2AtMATE23//111
MATE2AtMATE2442231
MATE2AtMATE2522232
MATE2AtMATE26/////
MATE2AtMATE2755424
MATE2AtMATE28311/2
MATE2AtMATE2931121
MATE2AtMATE30//1//
MATE2AtMATE312/122
MATE2AtMATE32/////
MATE2AtMATE3321111
MATE2AtMATE3421/21
MATE2AtMATE3543353
MATE2AtMATE3633222
MATE2AtMATE3742223
MATE2AtMATE38/2422
MATE2AtMATE3953244
MATE2AtMATE4064534
MATE2AtMATE4121131
Group 3MATE3AtMATE4222232
MATE3AtMATE4361383
MATE3AtMATE442/121
MATE3AtMATE45/11//
MATE3AtMATE462221/
MATE3AtMATE473111/
Group 4MATE4AtMATE4822131
MATE4AtMATE4932242
MATE4AtMATE5032261
MATE4AtMATE514336/
MATE4AtMATE524/25/
MATE4AtMATE5342242
MATE4AtMATE5442232
MATE4AtMATE5532252
MATE4AtMATE5654242

