How Supplementary or Night-Interrupting Low-Intensity Blue Light Affects the Flower Induction in Chrysanthemum, A Qualitative Short-Day Plant


Abstract
:
1. Introduction
2. Materials and Methods
2.1. Growth Conditions and Plant Materials
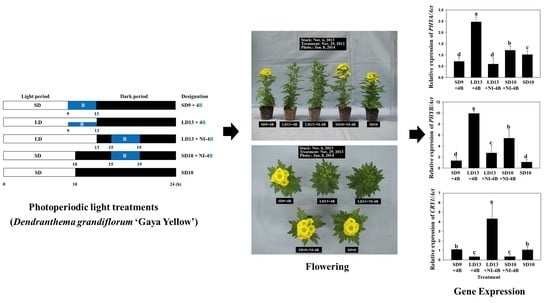
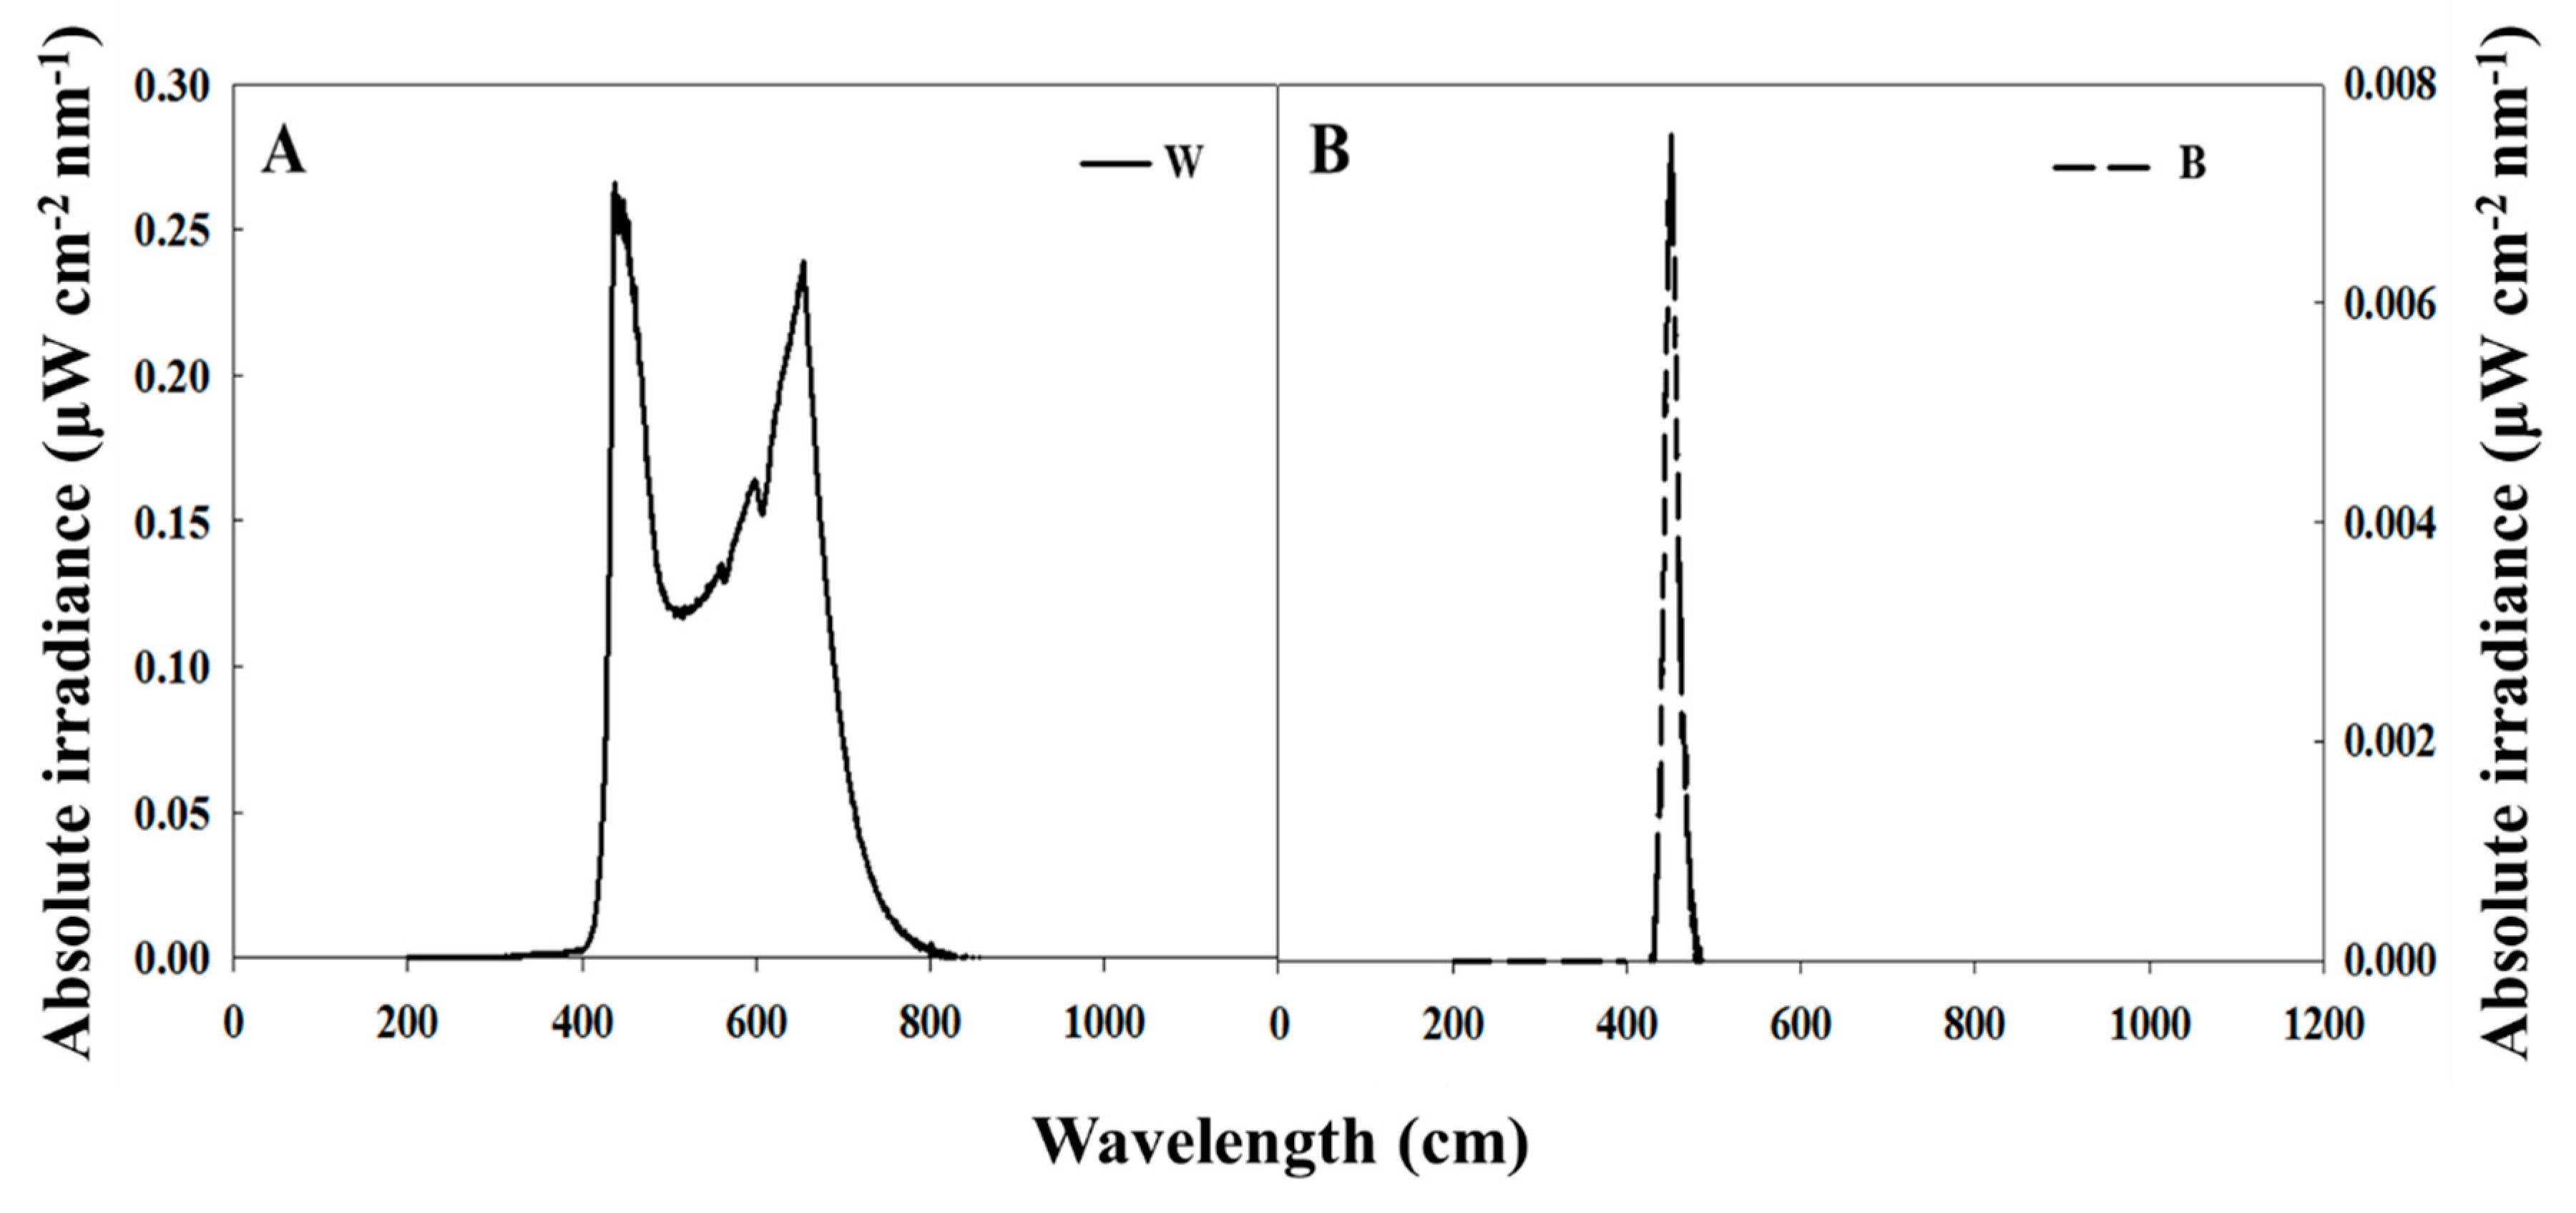
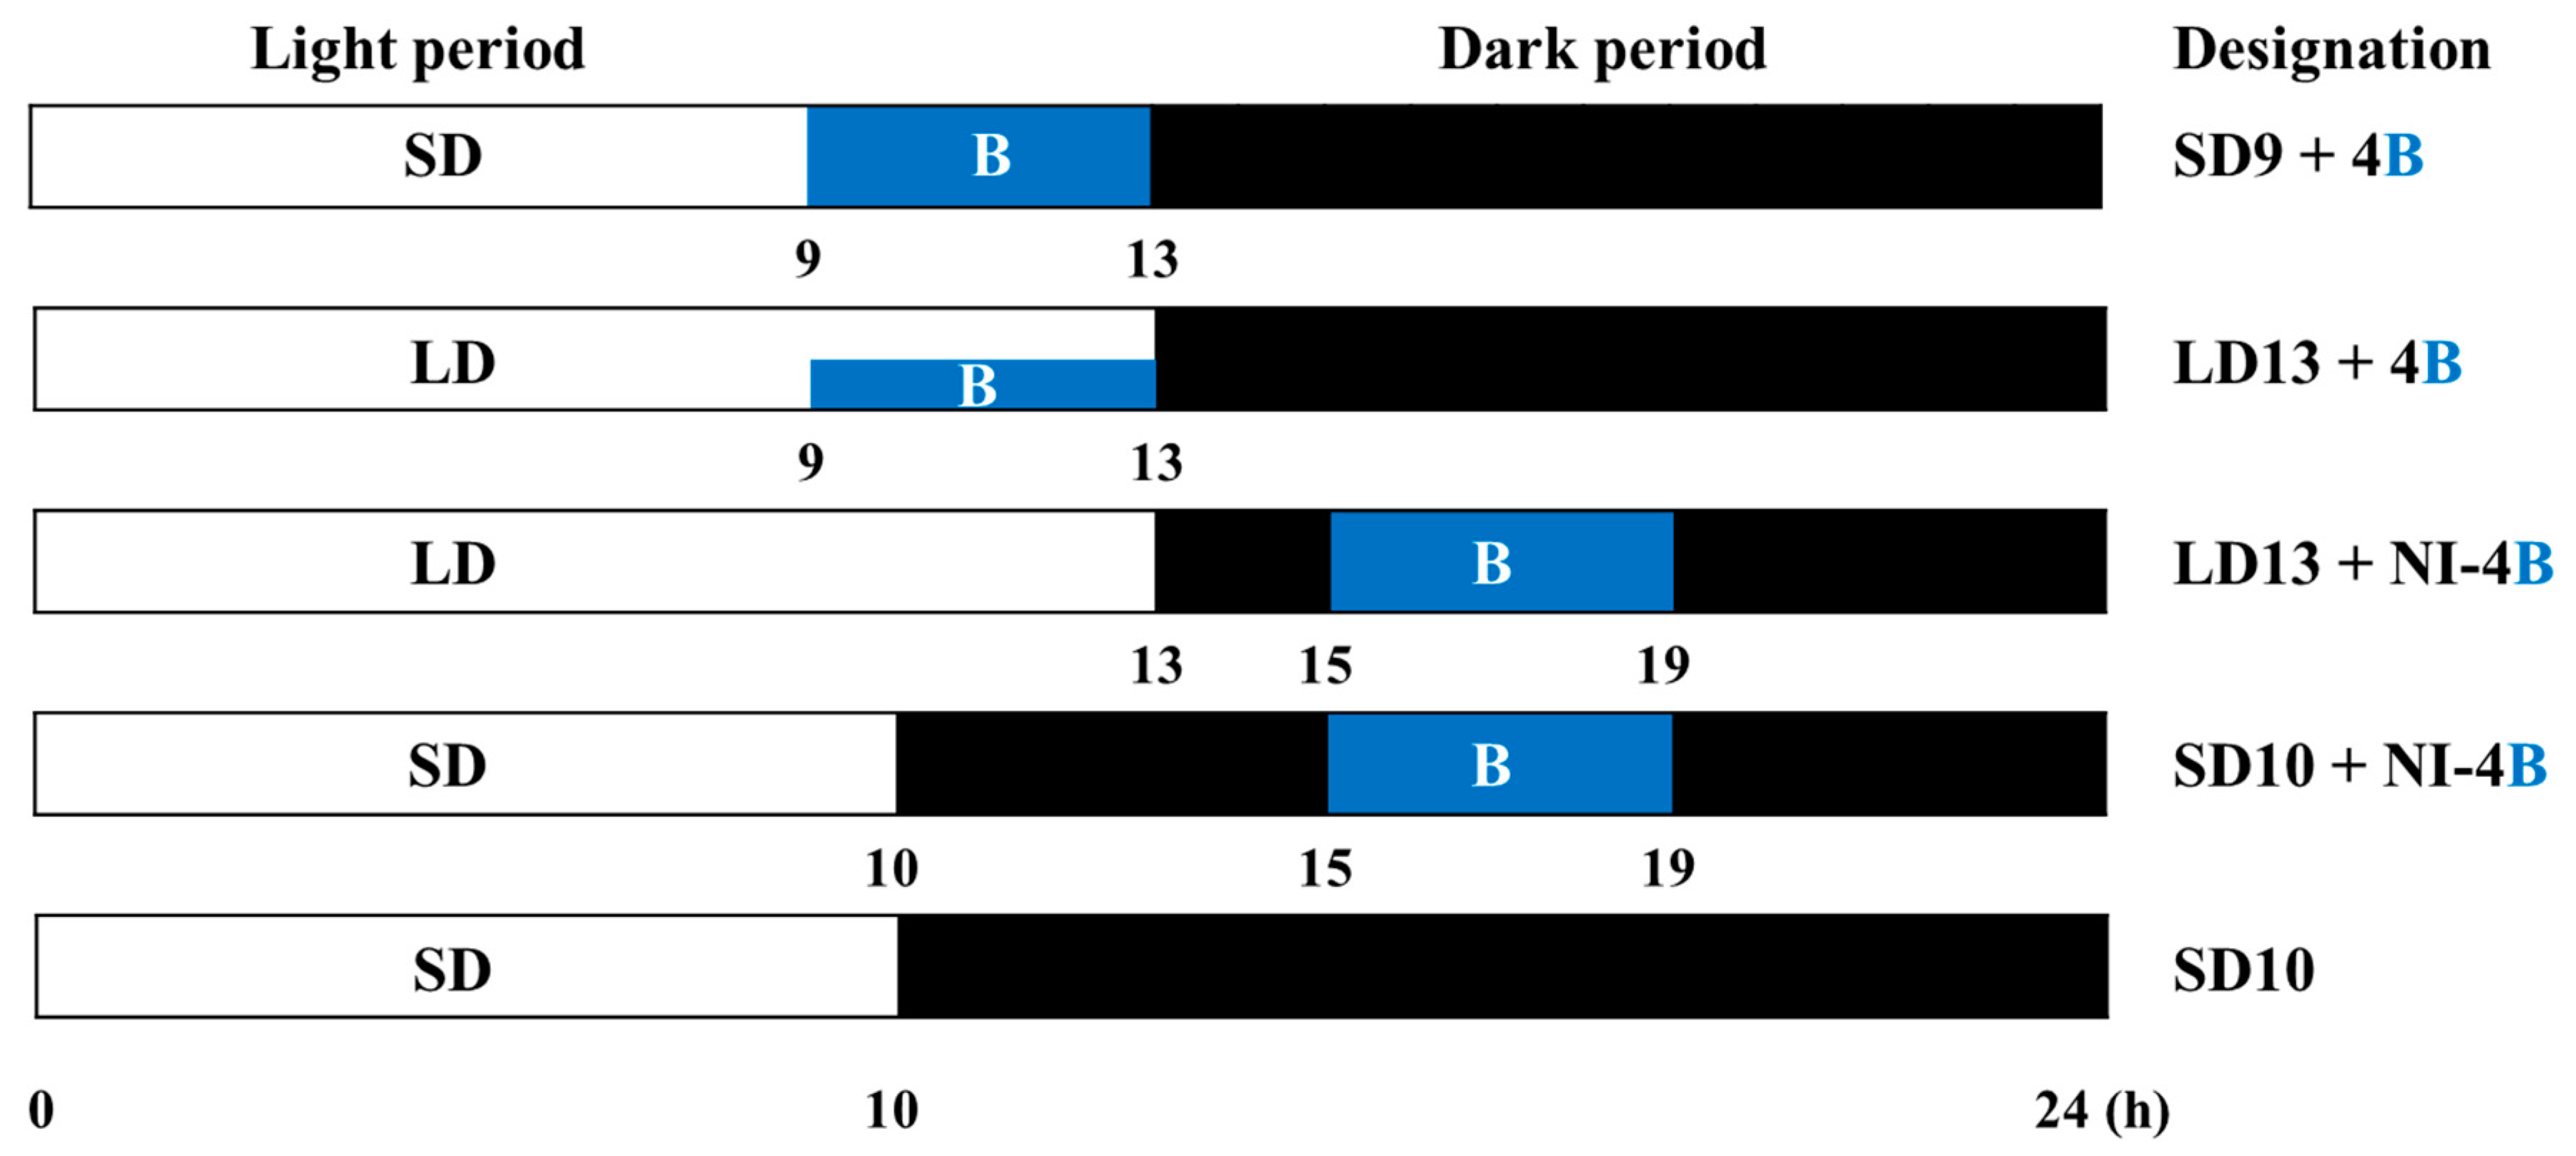
2.2. Photoperiodic Light Treatments
2.3. Data Collection and Statistical Analysis
2.4. Total RNA Isolation, cDNA Synthesis, and Real-Time Polymerase Chain Reaction (PCR) of Selected Genes
3. Results
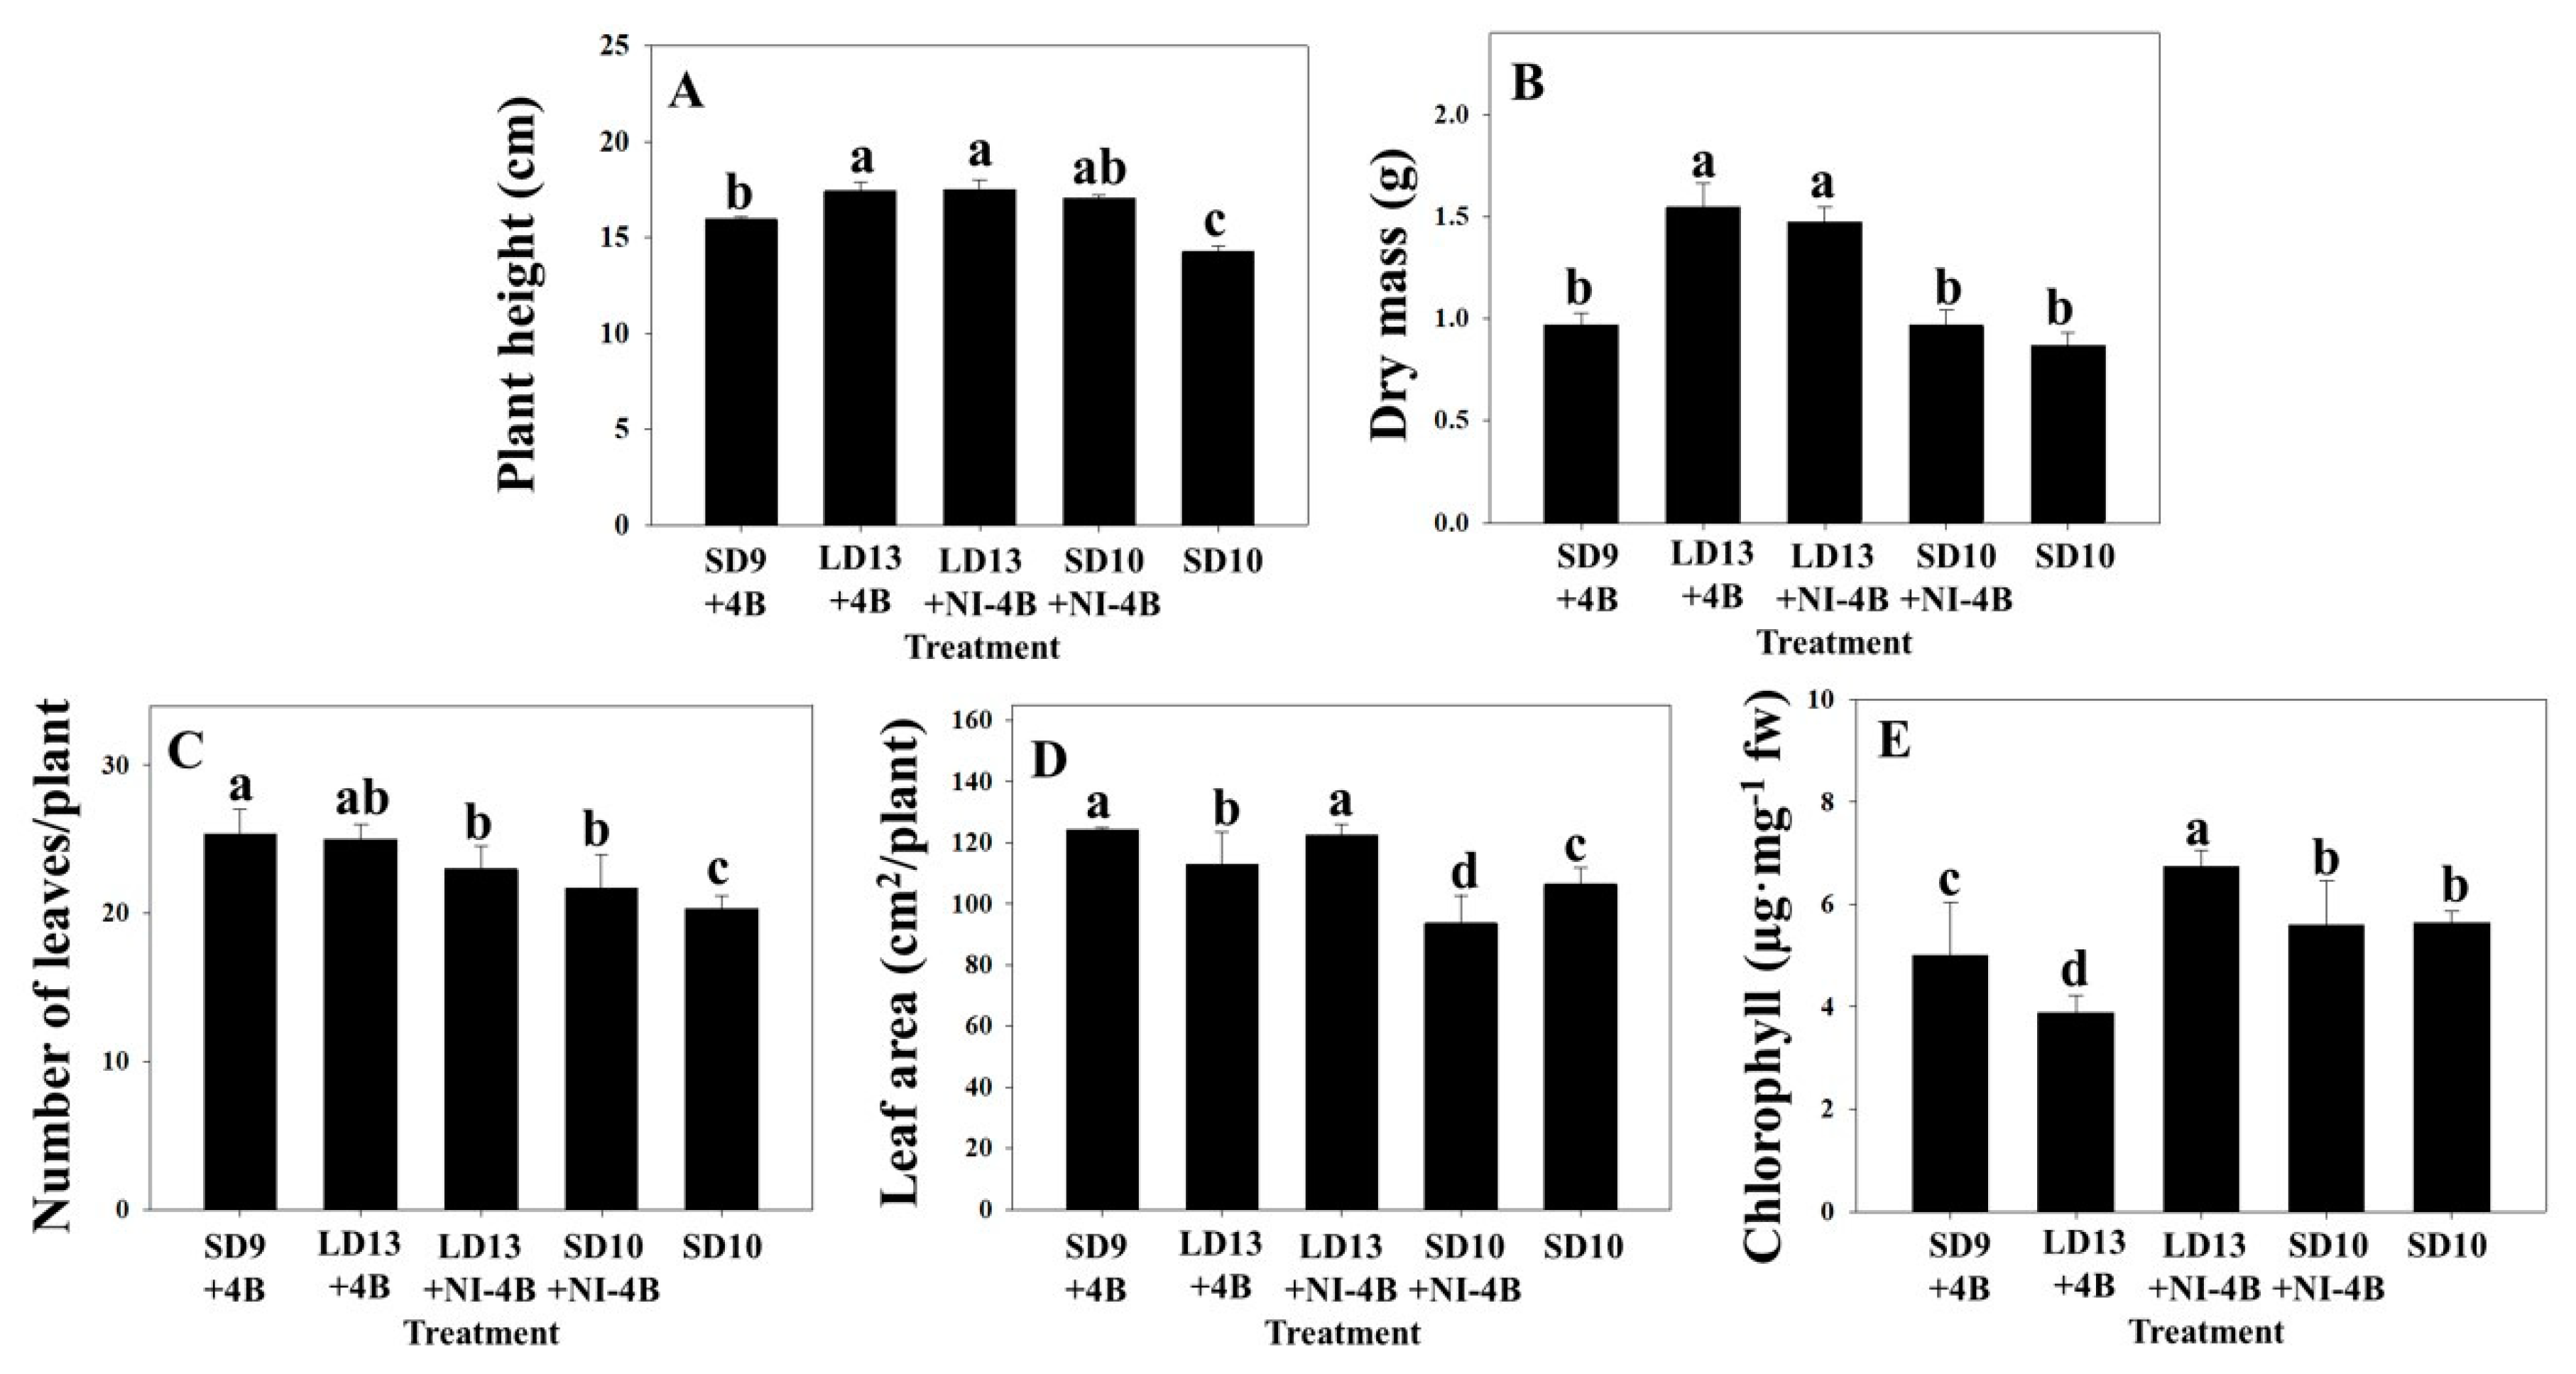
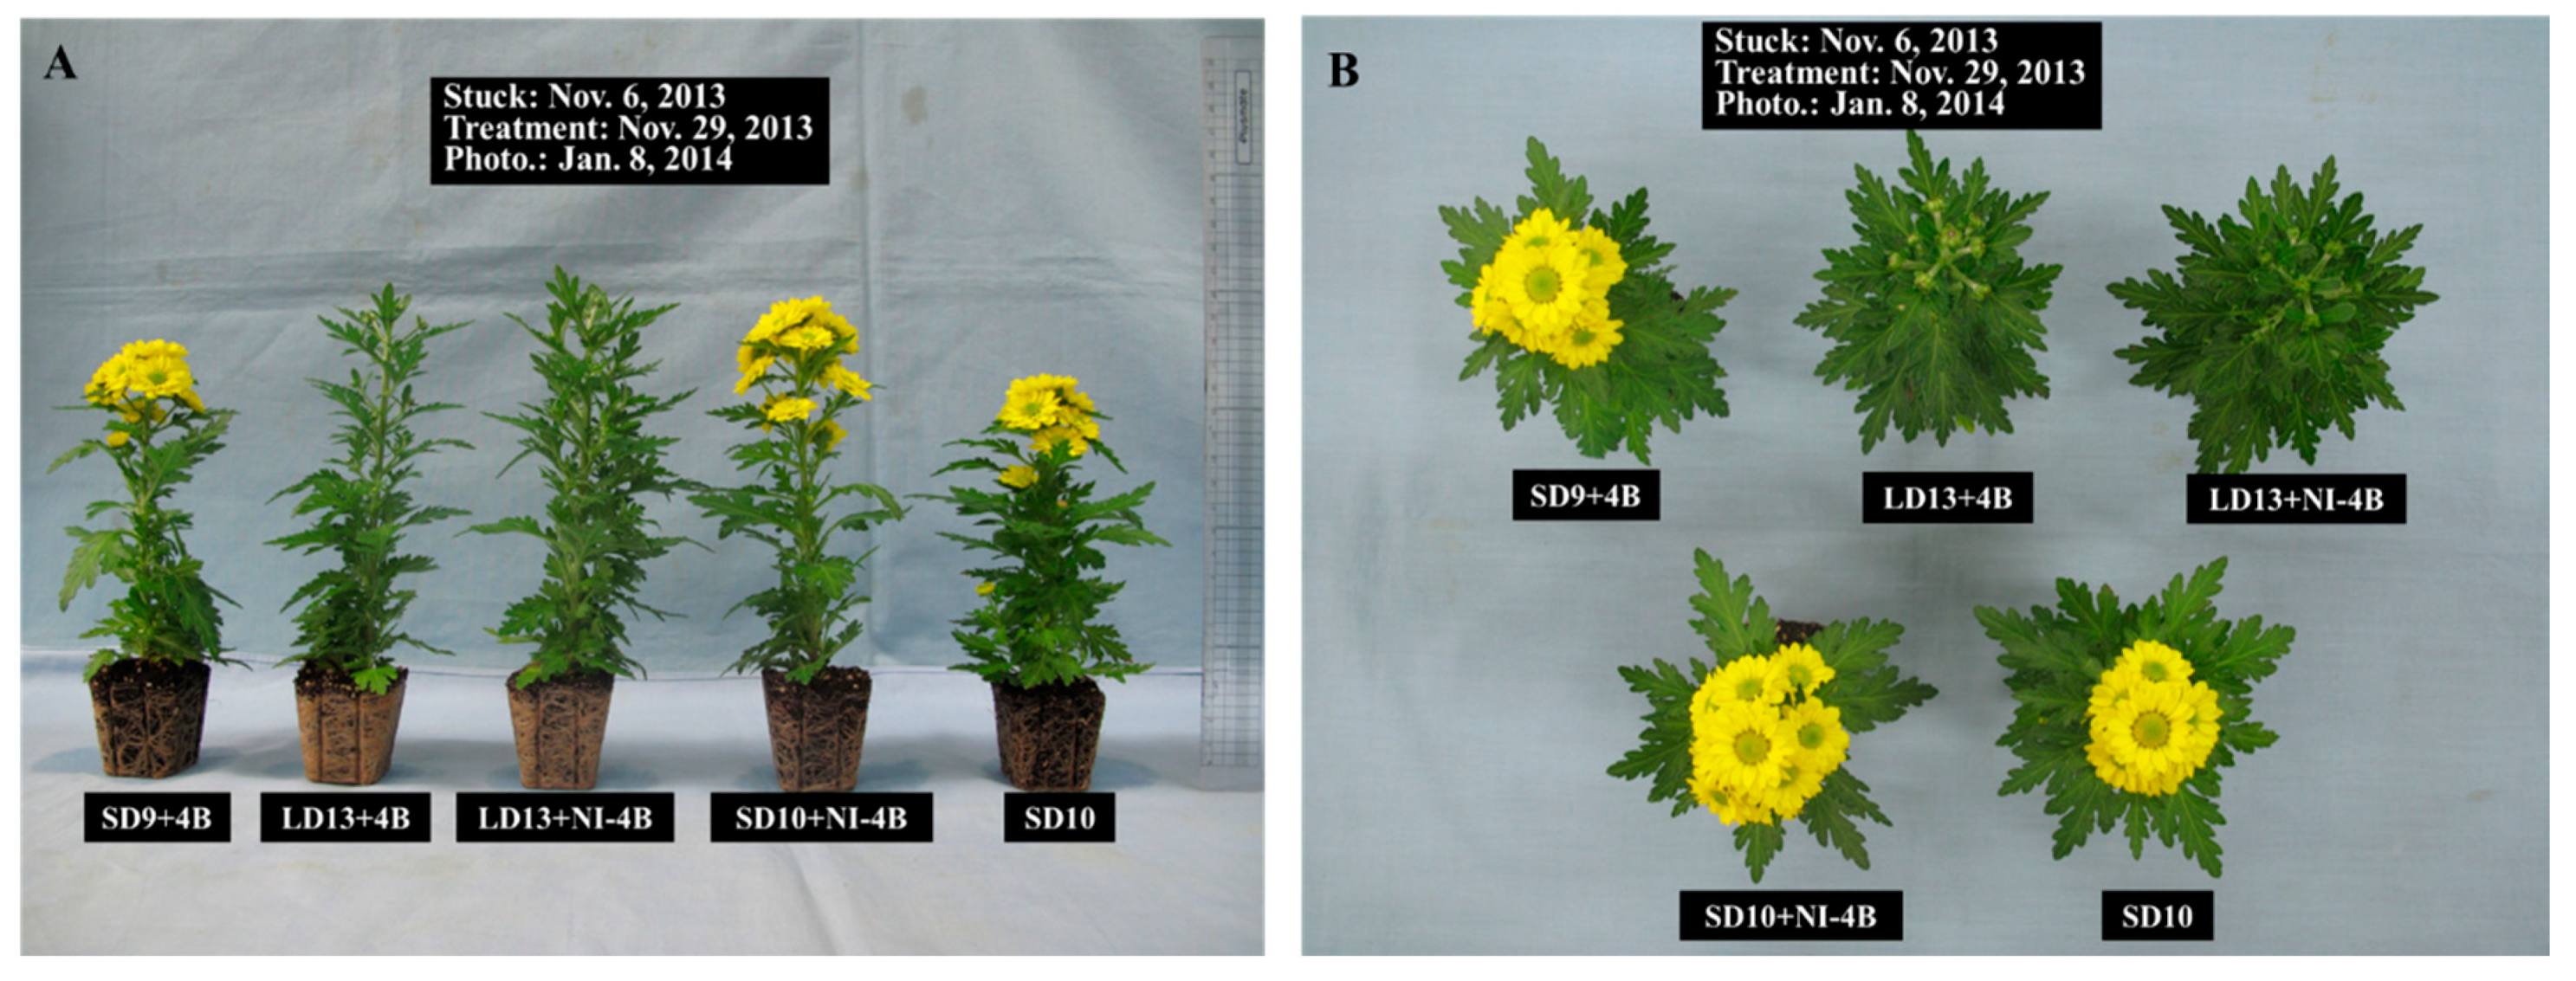
3.1. Morphogenesis
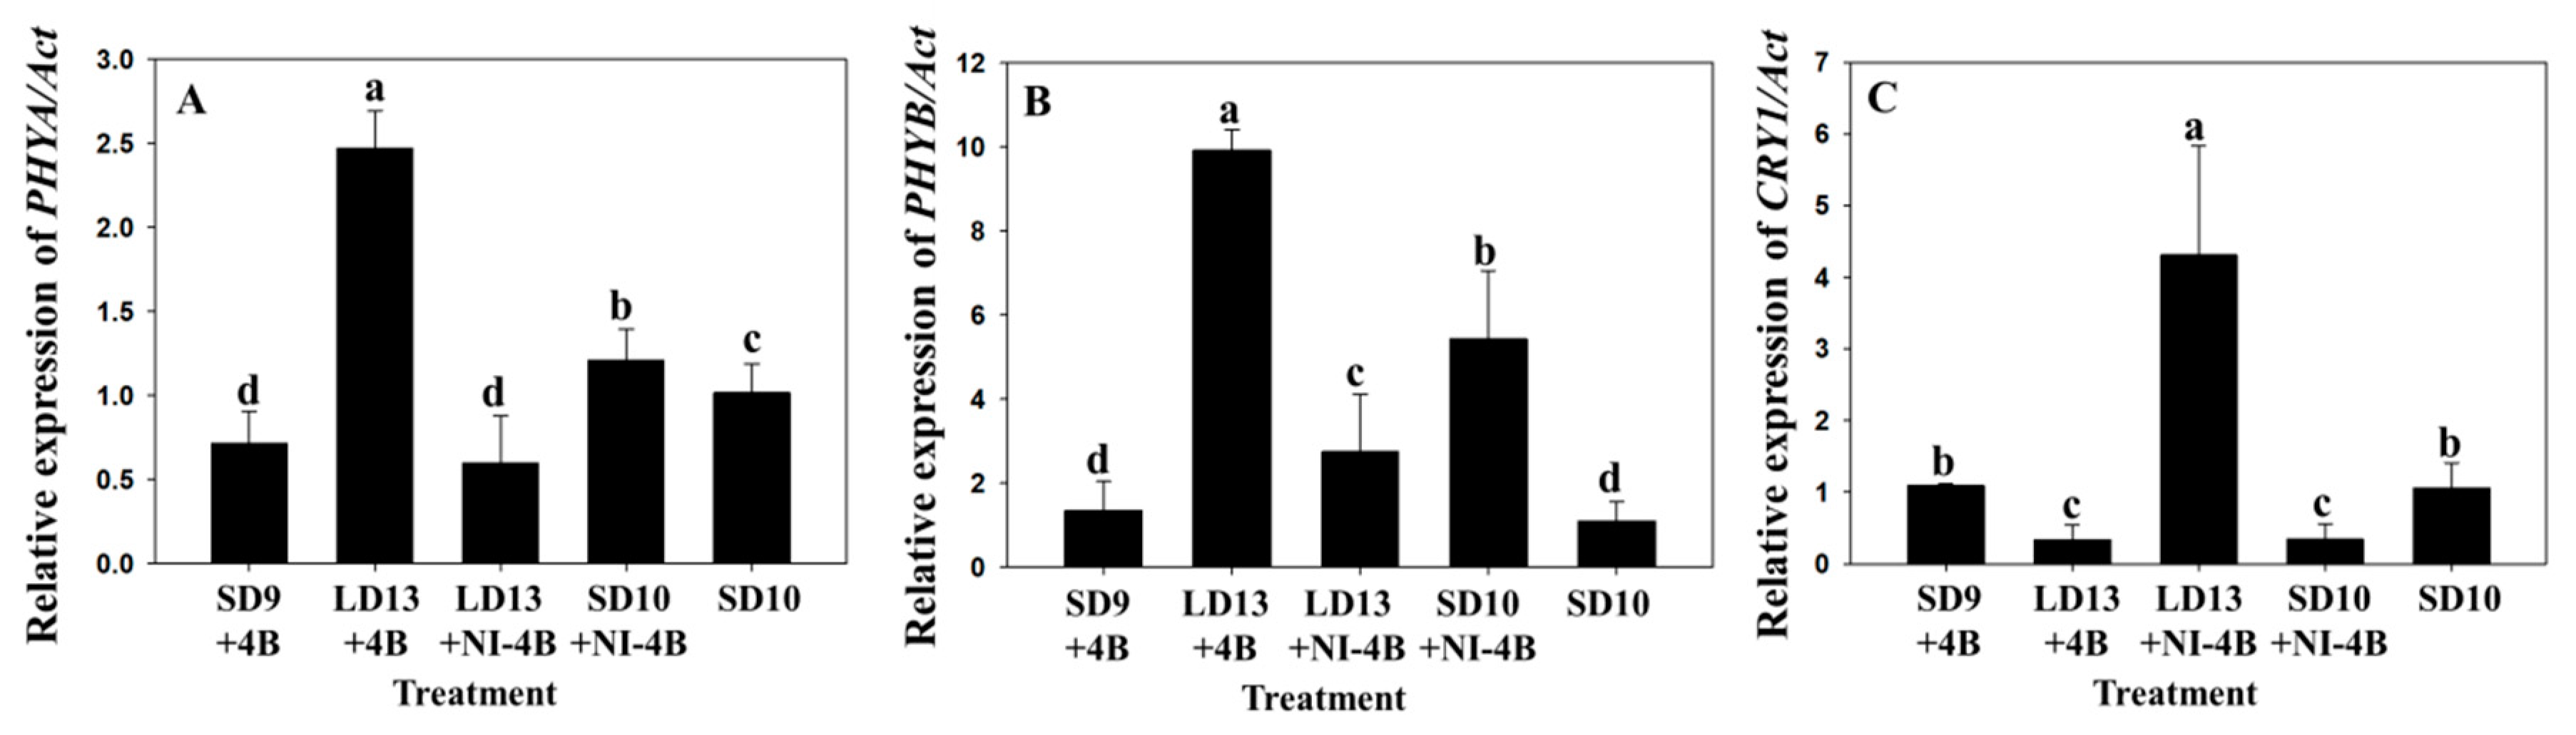
3.2. Flowering and Gene Expression
4. Discussion
4.1. Plant Height
4.2. Dry Mass and Leaf Growth
4.3. Expression of Genes Related to the Morphogenesis and Flowering
Author Contributions
Funding
Acknowledgments
Conflicts of Interest
References
- Demotes-Mainard, S.; Péron, T.; Corot, A.; Bertheloot, J.; Gourrierec, J.G.-L.; Pelleschi-Travier, S.; Crespel, L.; Morel, P.; Huché-Thélier, L.; Boumaza, R.; et al. Plant responses to red and far-red lights, applications in horticulture. Environ. Exp. Bot. 2016, 121, 4–21. [Google Scholar] [CrossRef]
- Galvāo, V.C.; Fankhauser, C. Sensing the light environment in plants: Photoreceptors and early signaling steps. Curr. Opin. Neurobiol. 2015, 34, 46–53. [Google Scholar] [CrossRef] [Green Version]
- Huché-Thélier, L.; Crespel, L.; Gourrierec, J.G.-L.; Morel, P.; Sakr, S.; LeDuc, N. Light signaling and plant responses to blue and UV radiations—Perspectives for applications in horticulture. Environ. Exp. Bot. 2016, 121, 22–38. [Google Scholar] [CrossRef]
- Kami, C.; Lorrain, S.; Hornitschek, P.; Fankhauser, C. Light-regulated plant growth and development. Curr. Top. Dev. Biol. 2010, 91, 29–66. [Google Scholar] [CrossRef] [Green Version]
- Cashmore, A.R.; Jarillo, J.A.; Wu, Y.-J.; Liu, D. Cryptochromes: Blue light receptors for plants and animals. Science 1999, 284, 760–765. [Google Scholar] [CrossRef]
- Clack, T.; Mathews, S.; Sharrock, R.A. The phytochrome apoprotein family inArabidopsis is encoded by five genes: The sequences and expression of PHYD and PHYE. Plant Mol. Biol. 1994, 25, 413–427. [Google Scholar] [CrossRef]
- Sharrock, R.A.; Quail, P.H. Novel phytochrome sequences in Arabidopsis thaliana: Structure, evolution, and differential expression of a plant regulatory photoreceptor family. Genes Dev. 1989, 3, 1745–1757. [Google Scholar] [CrossRef] [Green Version]
- Wang, K.; Weng, Q.; Huang, L.; Wang, K.; Deng, J.; Jiang, R.; Ye, Z.; Gan, M. A new source of multi-spectral high spatial resolution night-time light imagery—JL1-3B. Remote Sens. Environ. 2018, 215, 300–312. [Google Scholar] [CrossRef]
- Runkle, E.S.; Heins, R. Manipulating the light environment to control flowering and morphogenesis of herbaceous plants. Acta Hortic. 2006, 711, 51–60. [Google Scholar] [CrossRef]
- Yamada, A.; Tanigawa, T.; Suyama, T.; Matsuno, T.; Kunitake, T. Night break treatment using different light sources promotes or delays growth and flowering of Eustoma grandiflorum (Raf.) Shinn. J. Jpn. Soc. Hortic. Sci. 2008, 77, 69–74. [Google Scholar] [CrossRef] [Green Version]
- Park, Y.G.; Muneer, S.; Jeong, B.R. Morphogenesis, flowering, and gene expression of Dendranthema grandiflorum in response to shift in light quality of night interruption. Int. J. Mol. Sci. 2015, 16, 16497–16513. [Google Scholar] [CrossRef] [Green Version]
- Appelgren, M. Effects of light quality on stem elongation of Pelargonium in vitro. Sci. Hortic. 1991, 45, 345–351. [Google Scholar] [CrossRef]
- Dougher, T.A.; Bugbee, B. Long-term blue light effects on the histology of lettuce and soybean leaves and stems. J. Am. Soc. Hortic. Sci. 2004, 129, 467–472. [Google Scholar] [CrossRef] [Green Version]
- Folta, K.M.; Lieg, E.J.; Durham, T.; Spalding, E.P. Primary inhibition of hypocotyl growth and phototropism depend differently on phototropin-mediated increases in cytoplasmic calcium induced by blue light. Plant Physiol. 2003, 133, 1464–1470. [Google Scholar] [CrossRef] [PubMed] [Green Version]
- Kubota, C.; Rajapakse, N.C.; Young, R.E. Carbohydrate status and transplant quality of micropropagated broccoli plantlets stored under different light environments. Postharvest Biol. Technol. 1997, 12, 165–173. [Google Scholar] [CrossRef]
- Rajapakse, N.C.; McMahon, M.J.; Kelly, J.W. End of day far-red light reverses height reduction of chrysanthemum induced by CuSO4 spectral filters. Sci. Hortic. 1993, 53, 249–259. [Google Scholar] [CrossRef]
- Senger, H. The effect of blue light on plants and microorganisms. Photochem. Photobiol. 1982, 35, 911–920. [Google Scholar] [CrossRef]
- Fankhauser, C.; Ulm, R. Light-regulated interactions with SPA proteins underlie cryptochrome-mediated gene expression. Genes Dev. 2011, 25, 1004–1009. [Google Scholar] [CrossRef] [Green Version]
- Hirose, F.; Shinomura, T.; Tanabata, T.; Shimada, H.; Takano, M. Involvement of rice cryptochromes in de-etiolation responses and flowering. Plant Cell Physiol. 2006, 47, 915–925. [Google Scholar] [CrossRef]
- Jeong, S.W.; Hogewoning, S.W.; Van Ieperen, W. Responses of supplemental blue light on flowering and stem extension growth of cut chrysanthemum. Sci. Hortic. 2014, 165, 69–74. [Google Scholar] [CrossRef]
- Higuchi, Y.; Sumitomo, K.; Oda, A.; Shimizu, H.; Hisamatsu, T. Day light quality affects the night-break response in the short-day plant chrysanthemum, suggesting differential phytochrome-mediated regulation of flowering. J. Plant Physiol. 2012, 169, 1789–1796. [Google Scholar] [CrossRef] [PubMed]
- Park, Y.G.; Jeong, B.R. Night interruption light quality changes morphogenesis, flowering, and gene expression in Dendranthema grandiflorum. Hortic. Environ. Biotechnol. 2019, 60, 167–173. [Google Scholar] [CrossRef]
- Dere, S.; Gunes, T.; Sivaci, R. Spectrophotometric determination of chlorophyll—a, b and total carotenoid contents of some algae species using different solvents. Turk. J. Bot. 1998, 22, 13–17. [Google Scholar]
- Livak, K.J.; Schmittgen, T.D. Analysis of relative gene expression data using real-time quantitative PCR and the 2-∆∆Ct method. Methods 2001, 25, 402–408. [Google Scholar] [CrossRef] [PubMed]
- Brown, C.S.; Schuerger, A.C.; Sager, J.C. Growth and photomorphogenesis of pepper plants under red light-emitting diodes with supplemental blue or far-red lighting. J. Am. Soc. Hortic. Sci. 1995, 120, 808–813. [Google Scholar] [CrossRef] [Green Version]
- Hoenecke, M.; Bula, R.; Tibbitts, T. Importance of `blue’ photon levels for lettuce seedlings grown under red-light-emitting diodes. HortScience 1992, 27, 427–430. [Google Scholar] [CrossRef] [Green Version]
- Holmes, M.G. Action spectra for changes in the “high irradiance reaction” in hypocotyls of Sinapis alba L. Planta 1981, 153, 267–272. [Google Scholar] [CrossRef]
- Kim, S.-J.; Hahn, E.-J.; Heo, J.-W.; Ali, M.B. Effects of LEDs on net photosynthetic rate, growth and leaf stomata of chrysanthemum plantlets in vitro. Sci. Hortic. 2004, 101, 143–151. [Google Scholar] [CrossRef]
- Oyaert, E.; Volckaert, E.; DeBergh, P. Growth of chrysanthemum under coloured plastic films with different light qualities and quantities. Sci. Hortic. 1999, 79, 195–205. [Google Scholar] [CrossRef]
- Schuerger, A.C.; Brown, C.S.; Stryjewski, E.C. Anatomical features of pepper plants (Capsicum annuum L.) grown under red light-emitting diodes supplemented with blue or far-red light. Ann. Bot. 1997, 79, 273–282. [Google Scholar] [CrossRef]
- Shimizu, H.; Ma, Z.; Tazawa, S.; Douzono, M.; Runkle, E.S.; Heins, R. Blue light inhibits stem elongation of chrysanthemum. Acta Hortic. 2006, 711, 363–368. [Google Scholar] [CrossRef]
- Wheeler, R.M.; Mackowiak, C.L.; Sager, J.C. Soybean stem growth under high-pressure sodium with supplemental blue lighting. Agron. J. 1991, 83, 903–906. [Google Scholar] [CrossRef]
- Khattak, A.M.; Pearson, S. Spectral filters and temperature effects on the growth and development of chrysanthemums under low light integral. Plant Growth Regul. 2006, 49, 61–68. [Google Scholar] [CrossRef]
- Kong, Y.; Stasiak, M.; Dixon, M.A.; Zheng, Y. Blue light associated with low phytochrome activity can promote elongation growth as shade-avoidance response: A comparison with red light in four bedding plant species. Environ. Exp. Bot. 2018, 155, 345–359. [Google Scholar] [CrossRef]
- Xu, Y.L.; Gage, D.A.; Zeevaart, J. Gibberellins and stem growth in Arabidopsis thaliana. Effects of photoperiod on expression of the GA4 and GA5 loci. Plant Physiol. 1997, 114, 1471–1476. [Google Scholar] [CrossRef] [Green Version]
- Heo, J.; Lee, C.; Chakrabarty, D.; Paek, K.-Y. Growth responses of marigold and salvia bedding plants as affected by monochromic or mixture radiation provided by a light-emitting diode (LED). Plant Growth Regul. 2002, 38, 225–230. [Google Scholar] [CrossRef]
- Muleo, R.; Morini, S. Light quality regulates shoot cluster growth and development of MM106 apple genotype in in vitro culture. Sci. Hortic. 2006, 108, 364–370. [Google Scholar] [CrossRef]
- Hao, X.; Papadopoulos, A.P. Effects of supplemental lighting and cover materials on growth, photosynthesis, biomass partitioning, early yield and quality of greenhouse cucumber. Sci. Hortic. 1999, 80, 1–18. [Google Scholar] [CrossRef]
- Wang, X.Y.; Xu, X.M.; Cui, J. The importance of blue light for leaf area expansion, development of photosynthetic apparatus, and chloroplast ultrastructure of Cucumis sativus grown under weak light. Photosynthetica 2015, 53, 213–222. [Google Scholar] [CrossRef]
- Iacona, C.; Muleo, R. Light quality affects in vitro adventitious rooting and ex vitro performance of cherry rootstock Colt. Sci. Hortic. 2010, 125, 630–636. [Google Scholar] [CrossRef]
- Dougher, T.A.; Bugbee, B.G. Difference in response of wheat, soybean and lettuce to reduced blue radiation. J. Photochem. Photobiol. 2011, 73, 199–207. [Google Scholar] [CrossRef]
- Eskins, K. Light-quality effects on Arabidopsis development. Red, blue and far-red regulation and morphology. Physiol. Plant. 1992, 86, 439–444. [Google Scholar] [CrossRef]
- Gang, Z.; Yu, T.; Banghua, Y.; Xiaolei, L. A study on the relationship between the chlorophyll content and the yield of plant of tartary buckwheat. In Proceedings of the 5th International Symposium on Buckwheat, Taiyuan, China, 20–26 August 1992; pp. 122–126. [Google Scholar]
- Zhao, X.-Y.; Yu, X.-H.; Liu, X.; Lin, C. Light regulation of gibberellins metabolism in seedling development. J. Integr. Plant Biol. 2007, 49, 21–27. [Google Scholar] [CrossRef]
- Mockler, T.; Yang, H.; Yu, X.; Parikh, D.; Cheng, Y.-C.; Dolan, S.; Lin, C. Regulation of photoperiodic flowering by Arabidopsis photoreceptors. Proc. Natl. Acad. Sci. USA 2003, 100, 2140–2145. [Google Scholar] [CrossRef] [PubMed] [Green Version]
- Johnson, E.; Bradley, M.; Harberd, N.P.; Whitelam, G.C. Photoresponses of light-grown phyA mutants of Arabidopsis (Phytochrome A is required for the perception of daylength extensions). Plant Physiol. 1994, 105, 141–149. [Google Scholar] [CrossRef] [Green Version]
- Mockler, T.C.; Guo, H.; Yang, H.; Lin, D.C. Antagonistic actions of Arabidopsis cryptochromes and phytochrome B in the regulation of floral induction. Development 1999, 126, 2073–2082. [Google Scholar]
- Franklin, K.A.; Praekelt, U.; Stoddart, W.M.; Billingham, O.E.; Halliday, K.J.; Whitelam, G.C. Phytochromes B, D, and E act redundantly to control multiple physiological responses in Arabidopsis. Plant Physiol. 2003, 131, 1340–1346. [Google Scholar] [CrossRef] [Green Version]
- Shinomura, T.; Nagatani, A.; Hanzawa, H.; Kubota, M.; Watanabe, M.; Furuya, M. Action spectra for phytochrome A- and B-specific photoinduction of seed germination in Arabidopsis thaliana. Proc. Natl. Acad. Sci. USA 1996, 93, 8129–8133. [Google Scholar] [CrossRef] [Green Version]
- Usami, T.; Mochizuki, N.; Kondo, M.; Nishimura, M.; Nagatani, A. Cryptochromes and phytochromes synergistically regulate Arabidopsis root greening under blue light. Plant Cell Physiol. 2004, 45, 1798–1808. [Google Scholar] [CrossRef]
- Ishikawa, R.; Shinomura, T.; Takano, M.; Shimamoto, K. Phytochrome dependent quantitative control of Hd3a transcription is the basis of the night break effect in rice flowering. Genes Genet. Syst. 2009, 84, 179–184. [Google Scholar] [CrossRef] [Green Version]


| Gene | Accession no. | Forward Primer | Reverse Primer |
|---|---|---|---|
| CRY1 | NM_116961 | 5′-CGTAAGGGATCACCGAGTAAAG-3′ | 5′-CTTTTAGGTGGGAGTTGTGGAG-3′ |
| PHYA | EU915082 | 5′-GACAGTGTCAGGCTTCAACAAG-3′ | 5′-ACCACCAGTGTGTGTTATCCTG-3′ |
| PHYB | NM_127435 | 5′-GTGCTAGGGAGATTACGCTTTC-3′ | 5′-CCAGCTTCTGAGACTGAACAGA-3′ |
| Actin | AB205087 | 5′-CGTTTGGATCTTGCTGGTCG-3′ | 5′-CAGGACATCTGAAACGCTCA-3′ |
| Treatment z | Flowering (%) | DVB y (Day) | No. of Flowers/Plant | Flower width (cm) |
|---|---|---|---|---|
| SD9 + 4B | 100 | 17.7 c x | 11.0 c | 2.6 b |
| LD13 + 4B | 100 | 22.5 b | 21.3 a | 0.7 c |
| LD13 + NI − 4B | 100 | 28.7 a | 15.3 b | 0.5 d |
| SD10 + NI − 4B | 100 | 18.0 c | 15.0 b | 2.8 a |
| SD10 | 100 | 17.5 c | 11.0 c | 2.9 a |
| F-test | *** | *** | *** |
Publisher’s Note: MDPI stays neutral with regard to jurisdictional claims in published maps and institutional affiliations. |
© 2020 by the authors. Licensee MDPI, Basel, Switzerland. This article is an open access article distributed under the terms and conditions of the Creative Commons Attribution (CC BY) license (http://creativecommons.org/licenses/by/4.0/).
Share and Cite
Park, Y.G.; Jeong, B.R. How Supplementary or Night-Interrupting Low-Intensity Blue Light Affects the Flower Induction in Chrysanthemum, A Qualitative Short-Day Plant. Plants 2020, 9, 1694. https://0-doi-org.brum.beds.ac.uk/10.3390/plants9121694
Park YG, Jeong BR. How Supplementary or Night-Interrupting Low-Intensity Blue Light Affects the Flower Induction in Chrysanthemum, A Qualitative Short-Day Plant. Plants. 2020; 9(12):1694. https://0-doi-org.brum.beds.ac.uk/10.3390/plants9121694
Chicago/Turabian StylePark, Yoo Gyeong, and Byoung Ryong Jeong. 2020. "How Supplementary or Night-Interrupting Low-Intensity Blue Light Affects the Flower Induction in Chrysanthemum, A Qualitative Short-Day Plant" Plants 9, no. 12: 1694. https://0-doi-org.brum.beds.ac.uk/10.3390/plants9121694