Article

Bioeffectors as Biotechnological Tools to Boost Plant Innate Immunity: Signal Transduction Pathways Involved

by
Helena Martin-Rivilla
*,
Ana Garcia-Villaraco
,
Beatriz Ramos-Solano
,
Francisco Javier Gutierrez-Mañero
and
Jose Antonio Lucas
Plant Physiology, Pharmaceutical and Health Sciences Department, Faculty of Pharmacy, Universidad San Pablo-CEU Universities, 28668 Boadilla del Monte, Spain
*
Author to whom correspondence should be addressed.
Submission received: 13 November 2020 / Revised: 1 December 2020 / Accepted: 2 December 2020 / Published: 8 December 2020
(This article belongs to the Collection Feature Papers in Plant‒Soil Interactions)

Abstract

:
The use of beneficial rhizobacteria (bioeffectors) and their derived metabolic elicitors are efficient biotechnological alternatives in plant immune system elicitation. This work aimed to check the ability of 25 bacterial strains isolated from the rhizosphere of Nicotiana glauca, and selected for their biochemical traits from a group of 175, to trigger the innate immune system of Arabidopsis thaliana seedlings against the pathogen Pseudomonas syringae pv. tomato DC3000. The five strains more effective in preventing pathogen infection were used to elucidate signal transduction pathways involved in the plant immune response by studying the differential expression of Salicylic acid and Jasmonic acid/Ethylene pathway marker genes. Some strains stimulated both pathways, while others stimulated either one or the other. The metabolic elicitors of two strains, chosen for the differential expression results of the genes studied, were extracted using n-hexane, ethyl acetate, and n-butanol, and their capacity to mimic bacterial effect to trigger the plant immune system was studied. N-hexane and ethyl acetate were the most effective fractions against the pathogen in both strains, achieving similar protection rates although gene expression responses were different from that obtained by the bacteria. These results open an amount of biotechnological possibilities to develop biological products for agriculture.

1. Introduction

The diseases caused by different pathogen organisms in plants represent a significant and persistent threat and a challenge to supply food worldwide [1,2]. Because of that, the study of plants’ immune system as a mechanism to counteract the attack of pathogens is fundamental, especially in this year that has been declared International Year of Plant Health by the FAO (Food and Agriculture Organization of the United Nations).
Plants can activate patter-triggered-immunity (PTI) by the recognition of PAMPs/MAMPs (pathogen-/microbe-associated molecular patterns), or effector-triggered immunity [3] (ETI) by the recognition of pathogen effectors. PTI response activates when some specific receptors located on cells surface, called pattern recognition receptors (PRRs), detect these PAMPs/MAMPs. However, plants can also respond to endogenous molecules that have been released by pathogens, which implies recognition of virulent pathogen molecules, called effectors, by intracellular receptors. This last recognition leads to a second line of defense, the effector-triggered immunity (ETI) and also to the transcription of resistance genes (PR genes). These endogenous effectors recognized by plants are much more variable in structure and composition than PAMPs/MAMPs [4].
Pieterse et al. [5] classified induced resistance triggered by pathogens with respect to the type of triggering agent in: Systemic acquired resistance (SAR), herbivore induced resistance (HIR) and induced systemic resistance (ISR). SAR is a form of induced resistance that happens in plants after localized exposure to a pathogen and that depends on the accumulation of salicylic acid (SA) and the activation of the Nonexpressor of Pathogenesis-Related Protein 1 (NPR1). SA accumulates after pathogen infection, binding NPR1 and triggering induction of pathogenesis-related genes (PR). Although SA-mediated resistance acts against a wide plethora of pathogens, it has been reported that SAR is generally more effective facing to biotrophic and hemibiotrophic pathogens [6,7].
In contrast, Pieterse et al. [8] described ISR as an answer triggered by non-pathogen rhizobacteria (bioeffectors). However, different elicitors such as antibiotics, surfactants or chemical inducers [9] are also able to induce ISR. In this case, ISR response was described as dependent on jasmonic acid (JA) and ethylene (ET) signaling pathways and also needs the involvement of NPR1 [10,11]. Plant defensin1 (PDF1) [12,13], and MYC2 also play an essential role in this signaling pathway [14].
These bioeffectors and some of their elicitors (structural molecules or metabolic molecules released to the medium) induce in plants a physiological alert state prior to stress challenge known as priming [15]. Plants in this state are able to develop a faster and/or stronger activation of defensive responses after the attack of pathogens, insects or in response to abiotic stress [16]. After bioeffectors or their elicitors are sensed, the SA or JA/ET signaling pathways are activated to trigger plant resistance [17]. Therefore, the study of these transduction signal pathways is meaningful for understanding the plant immune system and their defenses against pathogens. This can contribute to promote the use of bioeffectors and their elicitors as a useful biotechnological strategy to develop a sustainable agriculture without using agrochemicals and pesticides [17].
It is known that the rhizosphere of wild plant species is a worthy source for finding putative effective beneficial bacteria (bioeffectors) because plants are able to select those bacteria that boost their fitness by releasing nutrients into the surrounding soil through root exudates [18,19]. Thanks to this well-known ability of the plants to strongly select beneficial bacterial strains in the rhizosphere to improve their health and to survive to adverse conditions [18,19,20], bacteria isolated from the rhizosphere of Nicotiana glauca Graham, a Solanaceae native of Southern Spain with a strong secondary metabolism [21], were studied. This plant was chosen for our work because it is a wild species capable of thriving in very poor soils and in extreme drought and temperature conditions, therefore it was deduced that it should have a powerful associated rhizospheric microbiome that would allow it to survive to these harsh conditions. Moreover, N. glauca synthesizes anabasin, a toxic alkaloid, which suggests the existence of an inducible secondary metabolism associated to defence mechanisms [21]. All these characteristics of this plant species led us to presume that the rhizosphere of wild populations of N. glauca would be a rich source for finding effective bioeffectors with very interesting metabolic capacities.
The effects induced in the plants by the beneficial rhizobacteria depend on molecules (elicitors), so we considered that after the extraction of these elicitors, it would be possible to find out which ones were able to reproduce the effects of the rhizobacteria and therefore were responsible of this effect.
The general objective of this work was therefore to find beneficial rhizobacteria (bioeffectors) from N. glauca rhizosphere efficient in triggering the innate defense response of A. thaliana plants, as well as effective derived metabolic elicitors, trying to elucidate the mechanisms involved in the protection. To achieve this objective the following partial objectives were defined: (i) To perform a screening of N. glauca rhizobacteria to select those strains efficient in triggering the innate response of Arabidopsis plants against the pathogen P. syringae DC3000, (ii) to study the mechanisms involved in plant defense triggered by the most effective bioeffectors against the pathogen P. syringae DC3000, (iii) to obtain the metabolic elicitors from the most effective bioeffectors and assay their ability to mimic bacterial response.
To reach our goals, ISR experiments were carried out in A. thaliana plants using the bioeffectors and the metabolic elicitors of the chosen strains to protect the plants against P. syringae DC3000; the differential expression of marker genes for the SA and JA/ET transduction pathways were studied on plants inoculated with selected strains and selected metabolic elicitors.
The ISR experiments were carried out in A. thaliana plants because its short life cycle facilitates the performance of experiments at laboratory level. Furthermore, it is easy to infect this plant with specific pathogens (e.g., P. syringae DC 3000) and to study the consequent plant immune responses. This plant is able to trigger a wide sort of general PTI and ETI responses against pathogens [22]. In addition, it exists extensive literature on the defensive responses of this plant to compare with our results. As it is a model plant, the data obtained would be very relevant for the scientific community and could be then extrapolated to crops of commercial or economic interest.

2. Results

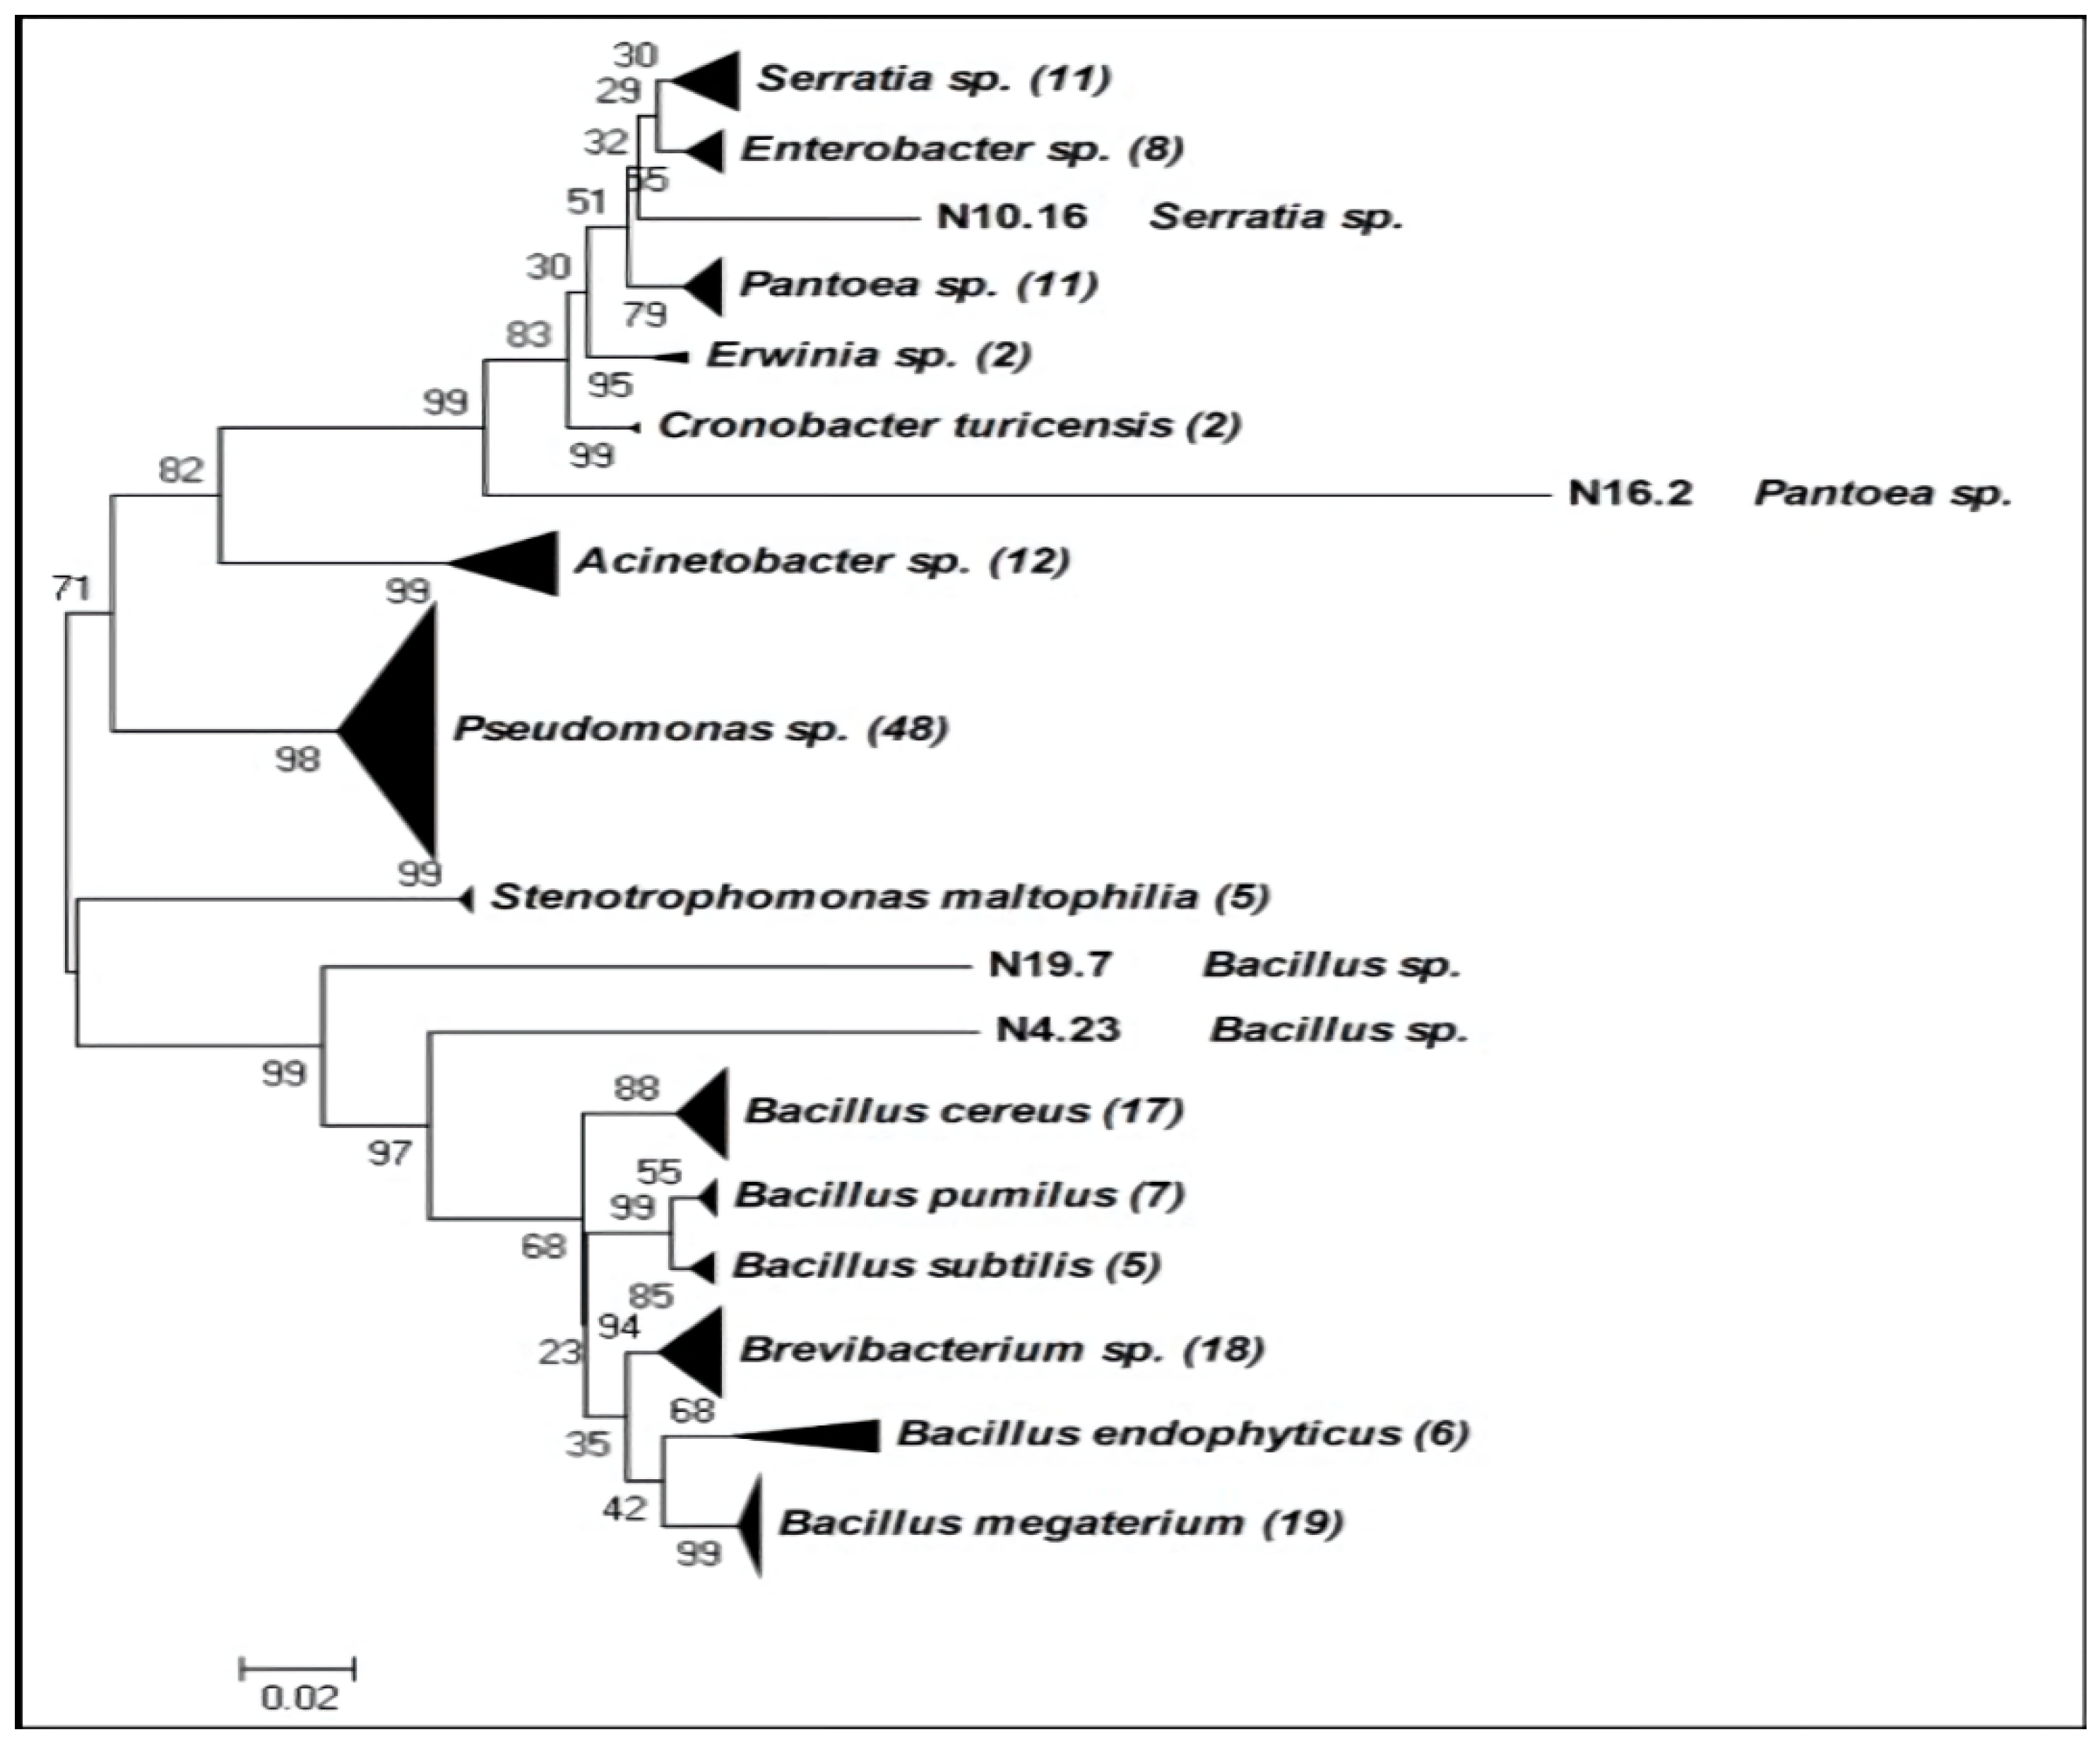
2.1. Beneficial Rhizobacteria Screening: Phylogenetic Tree and Biochemical Tests

A phylogenetic tree was performed with the 16S rRNA sequences of the 175 bacterial strains (Figure 1). Two main groups appeared, one made up of Gram-positive (74 strains) and the other of Gram-negative bacteria (101 strains).
In the Gram-negative group, eight genera were found (Serratia, Enterobacter, Pantoea, Erwinia, Cronobacter, Acinetobacter, Pseudomonas, and Stenotrophomonas), being Pseudomonas especially diverse in species (five species identified: P. putida, P. reinekei, P. brassicacearum, P. fragi, and P. fluorescens). In the Gram-positive group, only two genera were found, (Bacillus and Brevibacterium). Within Bacillus, two species were especially abundant, Bacillus cereus and Bacillus megaterium (Figure 1).
Biochemical tests (auxin-like compounds production [23], siderophores production [24], phosphate solubilization [25], and chitinases production [26,27]) for identifying putative beneficial rhizobacteria were carried out to the 175 strains. The results of these tests are shown in Table 1.
Within Gram-negative bacteria, Enterobacter was the only genus across all isolates tested that were capable of producing indole acetic acid (IAA). Siderophore producing isolates were present in all genera. Acinetobacter and Pseudomonas showed the highest percentage of phosphate solubilizes, but also isolates of Enterobacter, Pantoea and Erwinia were able to solubilize phosphate. Finally, all Stenotrophomonas isolates were able to produce chitinases (100%). Isolates able to produce siderophores and also solubilize phosphates belonged to Enterobacter, Pantoea, Erwinia, Acinetobacter, and Pseudomonas. Those able to produce siderophores and also chitinases were present among Stenotrophomonas and Pseudomonas, although less abundant among the latter (2.08%). The unique genus that had isolates with three biochemical traits was Enterobacter. It was able to produce siderophores and IAA and also, to solubilize phosphate.
Within Gram-positive bacteria, none of the isolates produced IAA, however all were able to produce siderophores. Only B. cereus, Brevibacterium sp., and B. megaterium were able to solubilize phosphate. B. cereus and B. subtilis were able to produce chitinases. The isolates that were able to produce siderophores and also solubilize phosphates were B. cereus, Brevibacterium sp., and B. megaterium. The isolates that were able to produce siderophores and also chitinases were B. cereus and B. subtilis. The unique isolate that had three biochemical traits was B. cereus. It was able to produce siderophores and chitinases and also to solubilize phosphate.

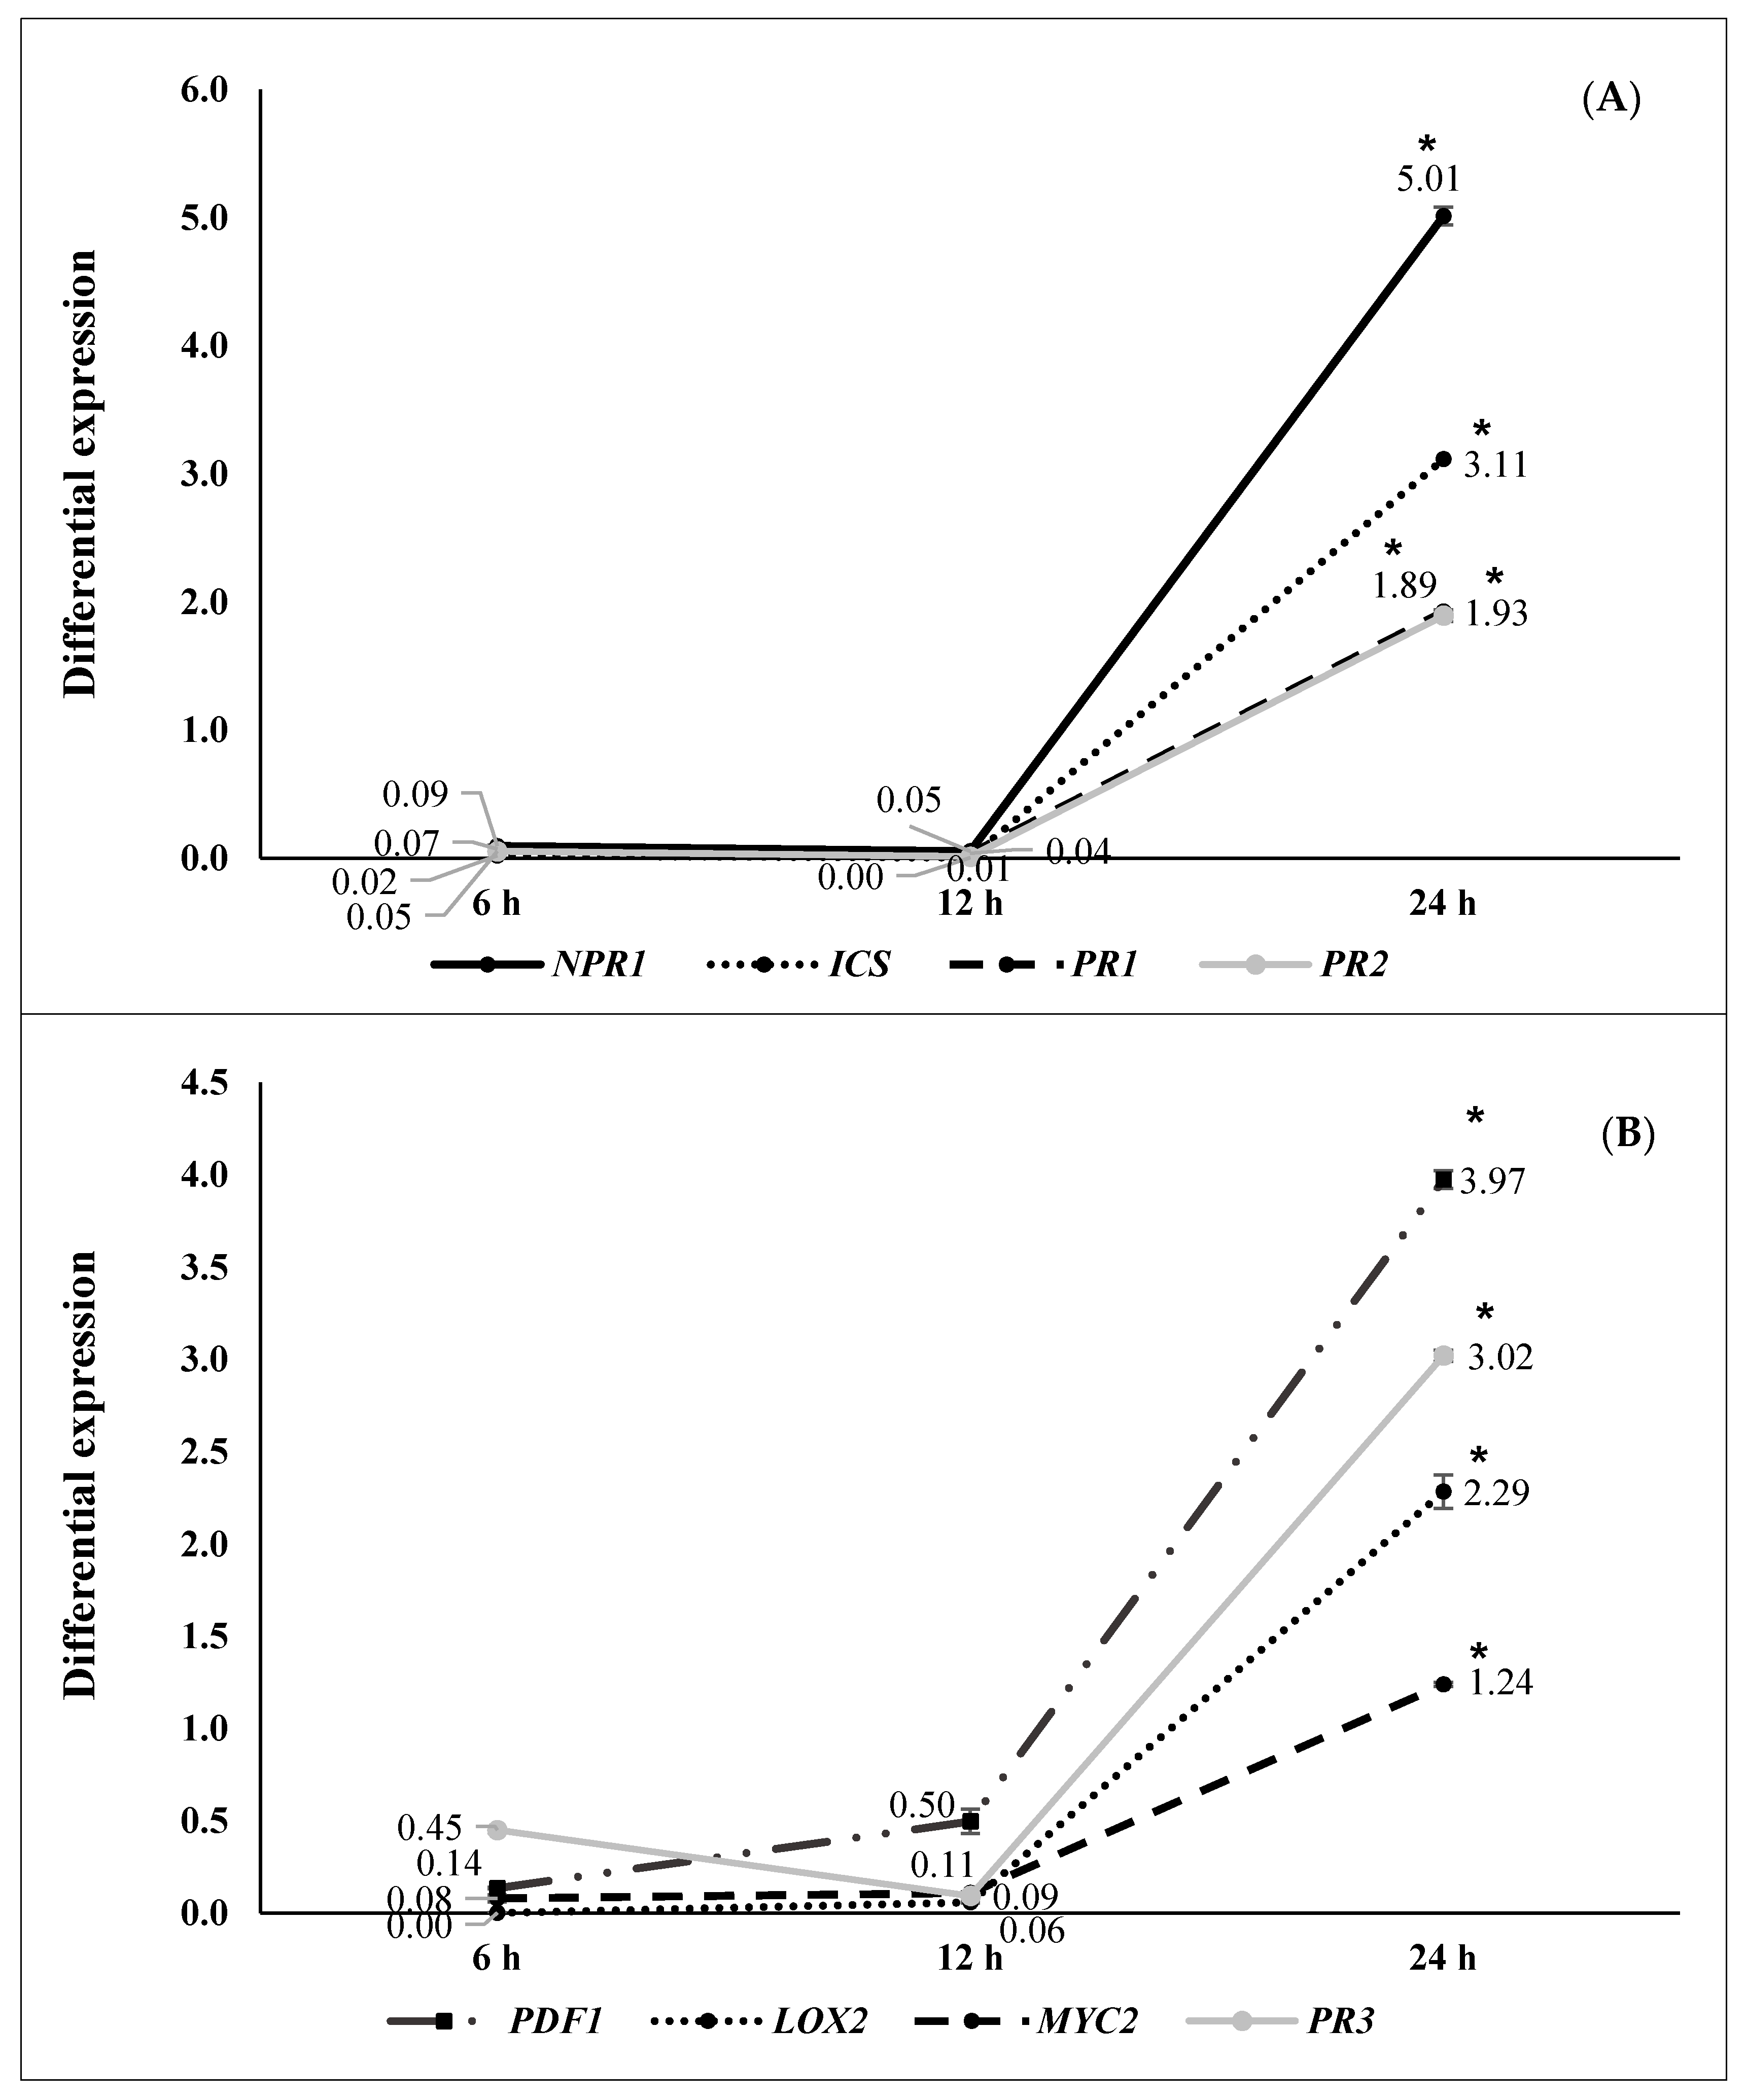
2.2. ISR by Beneficial Rhizobacteria

According to the results obtained from the phylogenetic tree (Figure 1) and the biochemical tests (Table 1), 25 strains were chosen (15 Gram-negative and 10 Gram-positive) to develop a first protection experiment against the pathogen P. syringae DC3000. All selected strains had at least two or three biochemical traits, except N 10.7 Serratia odorifera, N 12.34 S. rubidaea, and N 11.14 Bacillus endophyticus that only had one activity, but they were able to reduce growth of other strains in plate (data not shown), probably due to the production of antibiotics. The selected strains and their biochemical traits are shown in Table 2.
Table 3 shows the percentage (%) of protection induced in seedlings of A. thaliana inoculated with the 25 selected strains and the percentage of protection of negative and positive control plants. All Gram-negative bacteria significantly protected against the pathogen, except N 8.22, N 10.6, N 10.21, N 15.23, and N 18.10. Protection achieved by N 16.24 was not statistically significant. N 5.12 (P. putida), N 8.17 (S. maltophilia), N 12.34 (S. rubidaea), and N 21.24 (P. fluorescens) were the Gram-negative bacteria that induced the highest protection, even above of that of the positive control. Therefore, these four strains were chosen for assessing differential gene expression of eight genes, markers of different signal transduction pathways related to plant immune system.
Within Gram-positive bacteria, all of them significantly protected against the pathogen, except N 11.14, N 11.22, and N 11.36. Strain N 4.1 (B. cereus) was the Gram-positive bacterium that performed best; hence, it was selected to assess the differential gene expression of eight genes, markers of different signal transduction pathways related to plant immune system.
Differential gene expression at 6, 12, and 24 h after pathogen challenge (hapc) of A. thaliana plants inoculated with selected strains (N 5.12 (P. putida), N 8.17 (S. maltophilia), N 12.34 (S. rubidaea), N 21.24 (P. fluorescens), and N 4.1 (B. cereus) is shown in Figure 2, Figure 3, Figure 4, Figure 5 and Figure 6. Three different behaviors appeared among the five strains. The first behavior was a strong and significant increase at 6 hapc, followed by strains N 5.12 (Figure 2) and N 21.24 (Figure 5); N 5.12 increased the expression of NPR1 (12.55 times), PDF1 (376.54 times) and PR3 (4.53 times), while N 21.24 strongly induced ICS (42.11 times) and LOX2 (10.66 times) at 6 hapc. A second behavior pattern was a significant increase in expression at 12 hapc, only followed by N 12.34 (Figure 4) with a very high increment of the differential expression of NPR1(149.74 times), PR2 (57.09 times), PDF1 (675.98 times), PR3 (41.37 times), and LOX2 (32.79 times). The third pattern was a significant increase at 24 hapc, followed by strains N 8.17 (Figure 3) and N 4.1 (Figure 6). ICS (1.79 times), PR1 (1.95 times), PR2 (2.22 times), and MYC2 (2.02 times) were the genes induced by N 8.17, while all genes studied were induced by N 4.1 (from 1.24 times for MYC2 until 5.01 times for NPR1).

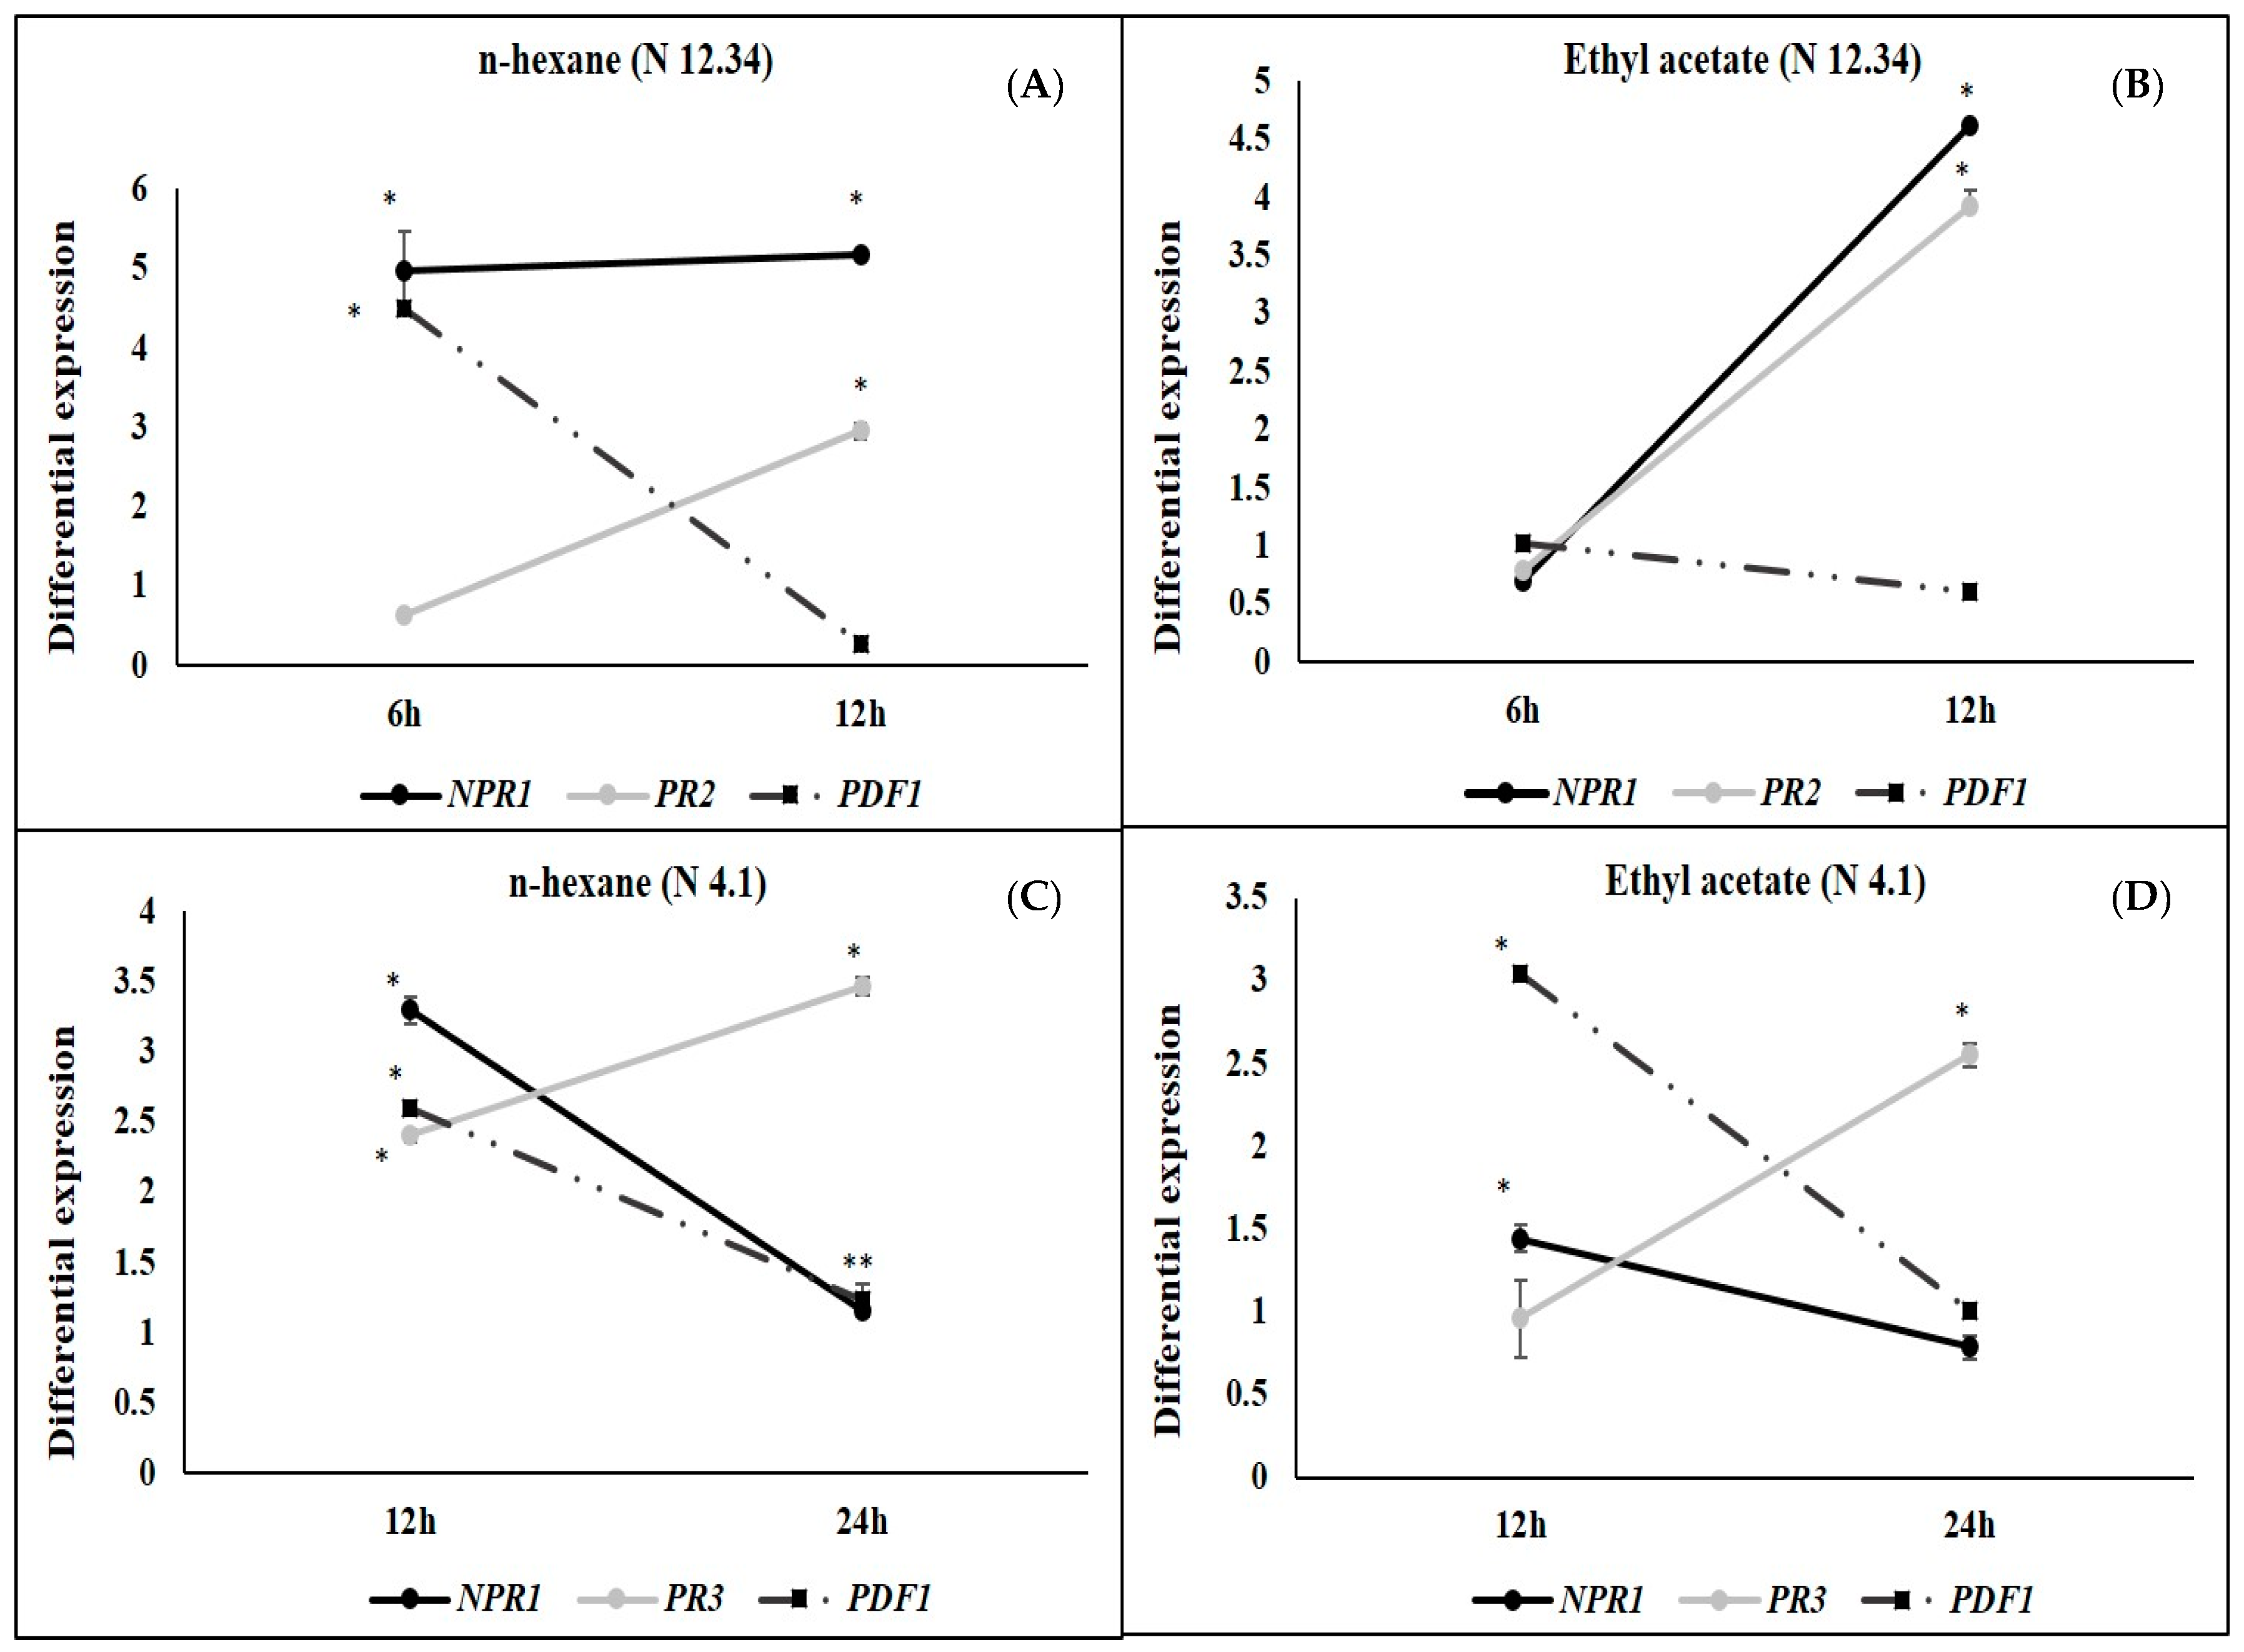
2.3. ISR by Metabolic Elicitors

Based on all the previous results, two strains were selected to extract their metabolic elicitors and to check the capacity of these metabolic elicitors to mimic protective effects of bacteria. They were selected N 12.34 (S. rubidaea), the Gram-negative strain that showed the highest differential expression (Figure 4) and N 4.1 (B. cereus) as it was the Gram-positive strain with better protection among the Gram-positive and which ranked second among all (Table 3).
The three fractions extracted from each strain (n-hexane, ethyl acetate and n-butanol), achieved significant protection (Table 4), having an outstanding performance the metabolic elicitors in the n-hexane and ethyl acetate fractions. Protection of the n-hexane (61.26%) and the ethyl acetate (54.64%) fractions of N 12.34 and protection of the n-hexane (68.11%) and the ethyl acetate (67.30%) fractions of N 4.1 was similar to that obtained with the bacterial strains (56.64% for N 12.34 and 69.45% for N 4.1, respectively).
Differential gene expression induced by the metabolic elicitors in the n-hexane and ethyl acetate fractions (the fractions with greatest protective capacity) from N 12.34 and N 4.1 is shown in Figure 7. In the case of N 12.34, analysis was performed at 6 and 12 hapc, and in that of N 4.1, at 12 and 24 hapc. Genes and sampling moments were selected according to the results obtained in the previous experiment of differential gene expression (with the bioeffectors).
The two metabolic elicitor fractions from N 12.34 induced the same behavior in the genes studied: Expression of NPR1 and PR2 increased from 6 to 12 hapc, while PDF1 decreased. Both metabolic elicitor fractions from N 4.1 also had the same behavior: Expression of NPR1 and PDF1 decreased from 12 to 24 hapc, while PR3 increased.

3. Discussion

In the present study, the efficiency of bioeffectors and derived metabolic elicitors to trigger the immune system of A. thaliana conferring protection against P. syringae pv. tomato DC3000 has been shown.
The 175 strains were isolated in 2010 [21] from the rhizosphere of wild populations of N. glauca. This plant species was chosen as it was hypothesized that its very active secondary metabolism would select a good group of bacteria to ensure plant fitness.
The rationale of plant’s selection capacity has been widely demonstrated, and also the use of the rhizosphere as a source of highly specialized strains [29,30,31], since it is one of the most complex and diverse ecosystems on earth. This suggests a definite role of plant-derived metabolites in the microbiome assemblage in the rhizosphere [32,33]. According to previous results, the common culturable bacterial genera in the rhizosphere of N. glauca includes Bacillus sp., Pseudomonas sp., Enterobacter sp., Acinetobacter sp., Burkholderia sp., Arthrobacter sp., and Paenibacillus sp. [21].
In the present study, almost 100% of the strains produced siderophores. Siderophore production is related to iron limiting nutrient [29,34,35], but also has been related to biocontrol and/or systemic induction of secondary metabolism. Therefore, siderophore-producing strains may have the ability to protect plants against pathogens through a complex and inducible secondary metabolism, which is probably related to defense [36,37].
Regarding the production of auxins and the ability to solubilize insoluble phosphorus, only one genus of those of our study was capable of producing auxins (Enterobacter sp). However, the solubilization of phosphates was a very abundant activity among the strains studied. Our results support that N. glauca selects rhizobacteria related to nutrition or biocontrol activities (phosphate solubilization and siderophore production) rather than those able to affect plant growth regulator balance (auxins production).
The production of chitinases was well represented within the Gram-positive group, but among the Gram-negatives, only the Stenotrophomonas genus was able to produce them, consistent with Ramos Solano et al. [21]. Many species of rhizospheric microorganisms produce chitinolytic enzymes to protect themselves against fungi, since chitin is a major structural component of most fungal cell walls. Hence, these microorganisms have an excellent potential as biocontrol agents [38,39].
The strains that were selected for ISR experiment were able to produce siderophores, and they had also some other complementary capacities, mainly the production of chitinases. This selection criterion has already been used by other authors with the aim of finding bacteria capable of inducing systemic resistance in plants [21,40,41,42]. The strain N 16.15 (Enterobacter sp.) was the only non-siderophore producing isolate, but it was one of the two strains that produced auxins, and was chosen for this reason. Some authors have shown that auxins are related to the induction of systemic resistance [43,44]. Three strains, N 10.7 (S. odorifera), N 12.34 (S. rubidaea) and N 11.14 (B. enterophyticus) were chosen with only one biochemical trait, because of their capacity to reduce growth of other strains in plate (data not shown), probably due to the production of antibiotics. This working scheme has proved to be very effective, since 16 out of the 25 strains chosen induced systemic resistance against the pathogen P. syringae DC3000 (Table 3).
To determine signal transduction pathways triggered by the five outstanding strains, from the 25 previously selected, the differential expression of marker genes of the SA and JA/ET signaling pathways was studied. For this experiment, the criterion followed for the bioeffector selection was the highest protection against P. syringae DC 3000 infection within both bacterial groups (Gram-positive and Gram-negative). To date, most bioeffectors studied for their ability to trigger ISR mechanisms belong to the group of Gram-negative bacteria, especially bacteria of the genus Pseudomonas [45]. However, Gram-positive bacteria, and among them, those of the genus Bacillus, have gained much importance in the last decade because of the great potential to trigger resistance mechanisms against a wide range of pathogens [46,47].
Three types of defensive responses were detected, according to the time needed to increase gene expression: Rapid, intermediate and slow. The rapid response (at 6 hapc) was generated by strains N 5.12 (P. putida) (Figure 2) and N 21.24 (P. fluorescens) (Figure 5). N 5.12 induced a strong differential expression of NPR1, a marker of SA pathway, PDF1 and PR3, markers of the JA/ET pathway. Interestingly, N 21.24 induced a strong differential expression of ICS and LOX2 involved in SA and JA synthesis, respectively. The intermediate response (at 12 hapc) was produced by N 12.34 (S. rubidaea) (Figure 4), which induced a strong differential expression of markers of SA pathway (NPR1 and PR2), and markers of the JA/ET pathway (PDF1 and PR3). The different behavior generated by these three strains is also reflected in their defensive capacity. Although the three induced resistance above the positive control (BTH), N 5.12 and N 12.34 induced a lower protection than N 21.24, which was the most effective of all the tested. Contrary to Caarls et al. [48], we observed a simultaneous high expression of NPR1 and PDF1 at 6 hapc for N 5.12 and at 12 hapc for N 12.34, suggesting that SA is not suppressing the expression of PDF1 as these authors indicated. This may be related to the monomerization process of NPR1 protein, (which has not been determined in this work), as well as with the location of this protein (nucleus or cytoplasm), which plays an important role in the suppression or not of the genes involved in the synthesis of JA by SA [49,50]. The higher protection achieved by N 21.24 (Table 3), is probably related to the high expression of the genes related to the synthesis of SA and JA (ICS and LOX2) at 6 hapc (Figure 5), something that was specific to this strain. Nowadays, the importance of high concentrations of SA and JA to trigger defensive responses mediated by both hormones is widely accepted [5,48,50]. Slow-response strains showed a progressive increase on expression from 0 to 24 hapc. These strains, N 8.17 (S. maltophilia) (Figure 3) and N 4.1 (B. cereus) (Figure 6) ranked right after N 21.24 in Arabidopsis protection (Table 3). N 8.17 follows the classic SA response pathway elicitation by a beneficial strain: High expression levels of ICS and NPR1 and consequently, high expression levels of PR1, while genes related with the JA/ET pathway were not expressed. Strain N 4.1 was able to stimulate both pathways (SA and JA/ET) simultaneously, according to the high expression levels of SA markers genes (NPR1, ICS, and PR1) and JA/ET markers (PDF1, LOX 2 and PR3) (Figure 6), demonstrating again that these two pathways are not necessarily antagonistic, as previously indicated by several authors [51,52].
Based on gene expression and protection results, the Gram-negative Serratia rubidaea N 12.34 and the Gram-positive Bacillus cereus N 4.1 were selected to extract their metabolic elicitors. Bacterial elicitors capable of starting defensive immune responses in plants, have been found to be structural molecules, (e.g., flagellin [53]), or metabolic elicitors that are released into the medium [17,45,54,55,56,57]. Our research delves into the study of mixtures of metabolic elicitors extracted from rhizobacteria and according to their solubility in three different organic solvents. The objective was to compare the effect of these fractions with that of the bacteria (bioeffectors), looking for similarities or differences in the response. For this reason, the genes studied and the hapc sampling moments in each case were set according to the results obtained with the bacterial strains.
For both bacteria, metabolic elicitors in the n-hexane and the ethyl acetate fractions were as efficient in triggering the defensive response in the plant as the bioeffectors (Table 3 and Table 4). Although a lack of effect of structural elicitors cannot be ruled out, it is evidenced herein that both bacteria are capable of releasing metabolic elicitors with the ability to elicit defensive metabolism in the plant very efficiently. On the other hand, since both fractions have elicitation capacity, it seems that the diversity of elicitors is high. This has also been proven by other authors using the same fractions [28,55,58].
Although metabolic elicitors of the two fractions studied protected to the same extent as the bacteria, the expression of the analyzed genes had different behaviors. The strain N 12.34 induced gene expression levels more intensely (up to 140 times. Figure 4) than metabolic elicitors (Figure 7A,B). The different intensity could be due to either the abundance of elicitors when the bacteria is delivered alive, holding all determinants, as compared to a subset of the same elicitors delivered on fractions, or because the plant is more sensitive to elicitors not present in the n-hexane and ethyl acetate fractions. The large difference in the levels of genetic expression indicates a level of priming also different. It is known that the priming can modify the distribution of energetic resources compromising plant growth in favor of a more production of metabolites involved in defensive response [59,60]. Therefore, in this case the use of metabolic elicitors may have advantages over bioeffectors.
Interestingly, metabolic elicitors in both fractions from S. rubidaea N 12.34 were able to activate the SA pathway, increasing the expression of NPR1 and PR2 (Figure 7A,B). In both fractions, PDF1 expression (marker of the JA/ET pathway) decreased, which indicate that the metabolic elicitors present in this fraction were only activating the SA mediated transduction pathway, while the bacterial strain activated both. These results show that the elicitors detected by the plant in both cases have to be different, and so would be the PRRs involved in that response [61].
Regarding the B. cereus strain N 4.1, the two metabolic elicitor fractions (Figure 7C,D) did not match the bacterium except for PR3, a marker of the JA/ET pathway. These results suggest a lower diversity of effective metabolic elicitors, pointing out a more relevant role of structural elicitors triggering the SA mediated pathway observed with the live strain.
All these results show the great number of possibilities offered by elicitors to trigger the immune system of plants, which opens a plethora of biotechnological solutions to different stress situations. Application of elicitors has many advantages from the agronomic point of view because it is more economical and profitable to conserve a molecule than a live bacterium, which has nutritional and environmental requirements. In addition, the use of elicitors also implies less environmental aware for possible cases of ecological niches competition between edaphic species and also avoids problems of infectious pathogenesis and alterations of the rhizosphere [62,63].

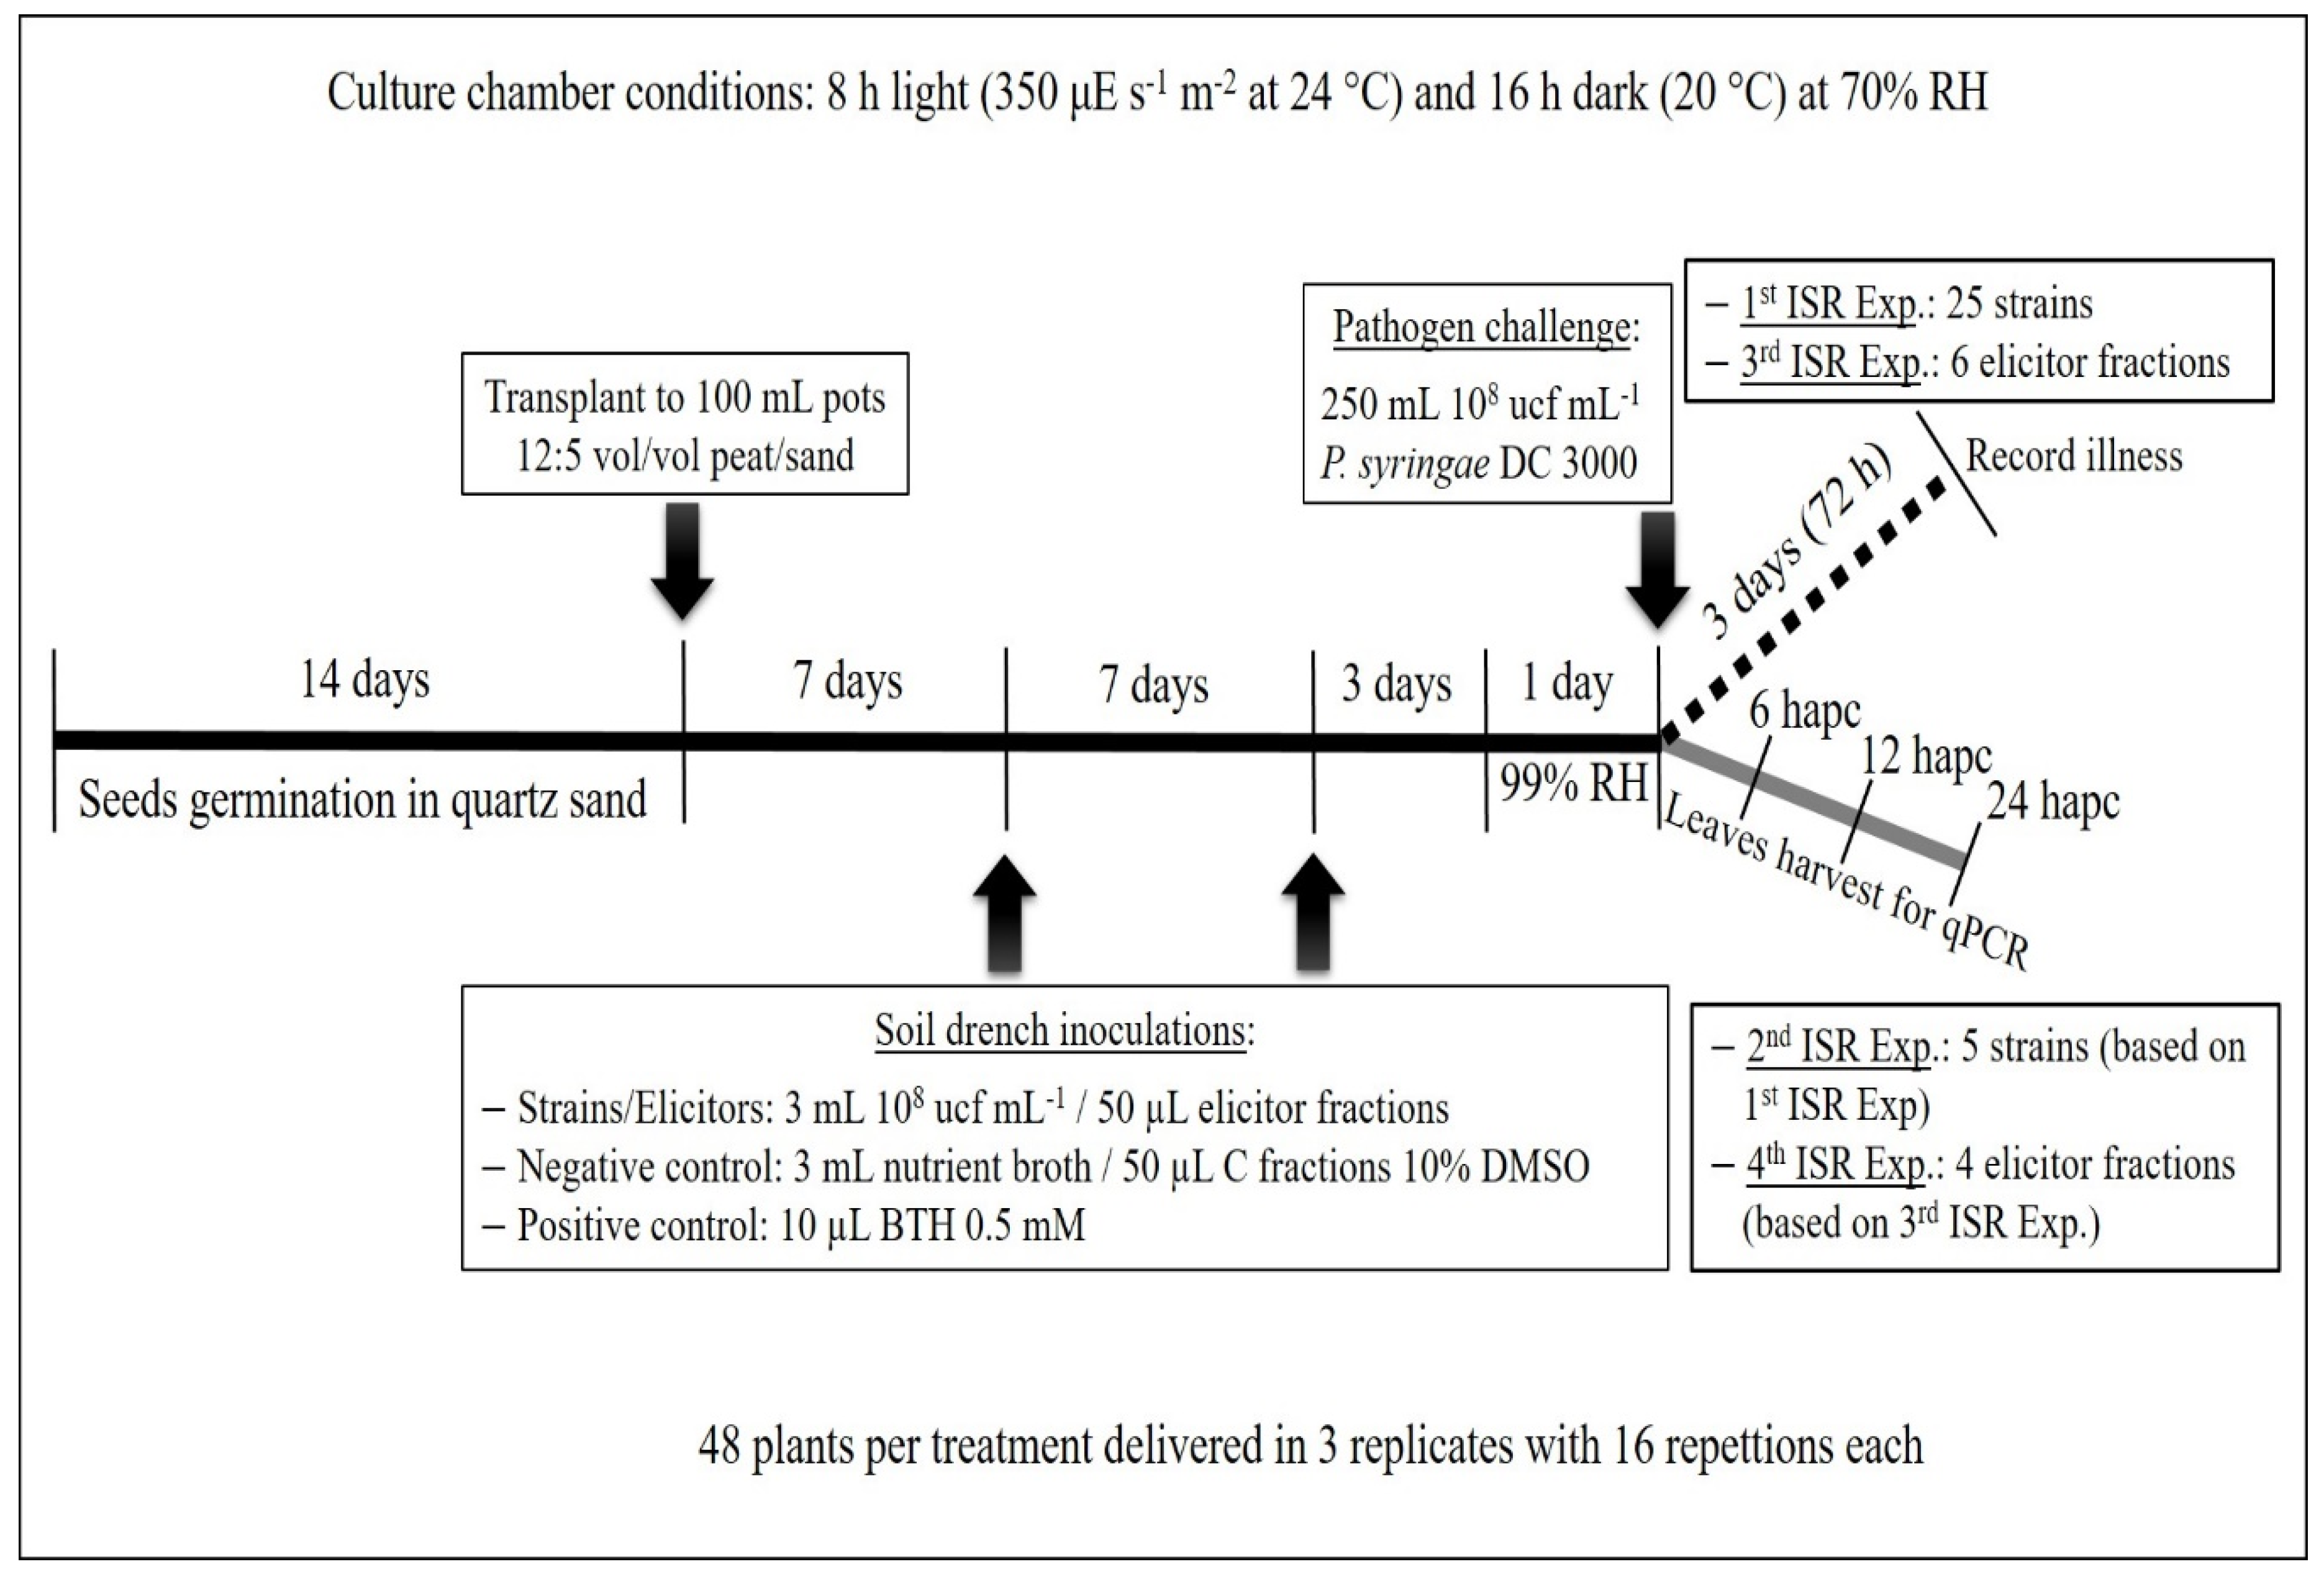
4. Material and Methods

A screening of 175 isolates was carried out. Firstly, biochemical tests for putative beneficial rhizobacteria traits were carried out to all isolates. The 16S rRNA partial sequencing of all isolates was analyzed and a phylogenetic tree was performed with these sequences. Twenty-five strains selected based on their biochemical traits and avoiding phylogenetic redundancy were assayed to determine their ability to trigger plant protection (ISR). The most effective strains (five) were studied to understand the mechanisms involved in protection. Finally, metabolic elicitors (molecules released to the medium) were obtained from the two most effective bacteria to demonstrate their ability to mimic the protective response triggered by the live strains.

4.1. Origin of Bacteria

Bacteria used in this work were isolated from the rhizosphere of wild populations of N. glauca Graham in three different soils and physiological stages of the plant. A total of 960 isolates were obtained and 50% were tested for their putative beneficial rhizobacteria traits, as explained in the work of Ramos-Solano et al. [21]. In the present study, a subset of 175 strains from the non-assayed group of bacteria were used. These isolates and the pathogen P. syringae pv. tomato DC3000 were maintained in 20% glycerol, frozen at −80 °C and plated to check viability.

4.2. 16S rRNA Partial Sequencing Phylogenetic Analysis

Bacteria were identified by 16S rRNA partial sequencing phylogenetic analysis. They were grown in PCA (Plate Count Agar (CONDA)) Petri dishes for 48 h and then in nutrient broth (CONDA) under shaking for 24 h at 28 °C in both cases. DNA was extracted from 1.8 mL of each bacterial culture by using the UltranClean Microbial DNA isolation Kit (Mo Bio, Carlsbad, CA, USA, EE.UU). DNA amount and quality were checked with a Nano Drop 2000 Thermo Scientific.
Each DNA sample was amplified with 16S rRNA universal primers: 1492R (5′TACGGYTACCTTGTTACGACTT3′) and 27F (5′AGAGTTTGATCMTGGCTCAG 3′). Amplification reactions were carried out with 5µL DNA (20 ng µL−1), 1 unit of DNA polymerase (Biotools Hotsplit), 0.5 µL of Primer F (30 µM) and 0.5 µL of Primer R (30 µM), 2.5 µL of 10X standard reaction buffer with MgCl2 (Biotools), 0.625 µL of dNTPs (10 mM each, Biotools), 0.375 µL of 100% DMSO (Dimehyl sulfoxide) and ultrapure water up to a volume of 25 µL.
The reaction mixtures were incubated in a thermocycler (Gene Amp PCR system 2700, Applied Biosystems, South San Francisco, CA, USA) at 94 °C for 2 min and then subjected to 10 cycles, consisting of 94 °C for 0.3 min, 50 °C for 0.30 min and 72 °C for 1 min and 20 cycles consisting of 94 °C for 0.3 min, 50 °C for 0.3 min and 72 °C for 1 min. Finally, the mixtures were incubated at 72 °C for 7 min. PCR products were purified with UltraClean PCR Clean-up DNA purification kit (MO BIO). Purified PCR products were sequenced in an ABI PRIMS” 377 DNA Sequencer (Applied Biosystems). Sequences were visualized with Sequence Scanner software v1.0. (Applied Bio-systems, Foster City, CA, USA), and editing was performed using the software Clone Manager Professional Suite v6.0. (Sci-Ed Software, Cary, NC, USA). Sequence alignment was carried out on the server MAFFT v6.0 (http://mafft.cbrc.jp/alignment/software/) and annotated by BLASTN 2.2.6. in the National Centre for Biotechnology Information (NCBI: http://0-www-ncbi-nlm-nih-gov.brum.beds.ac.uk/) and Ribosomal Database Project Release 10 (RDP: http://rdp.cme.msu.edu/) databases. Finally, a phylogenetic tree was performed with the 16S rRNA sequences. The sequences reported in this work are available in the GenBank database under the accession numbers, MH571489 to MH571661.

4.3. Phylogenetic Tree

An unrooted tree was performed with MEGA v4.0.2. with aligned sequences in MAFFT v6. The evolutionary distances were inferred using the neighbor-joining method. The bootstrap consensus tree inferred from 1000 replicates was taken to represent the evolutionary history of the taxa analyzed. The percentage of replicate trees in which the associated taxa clustered together in more than 50% of the 1000 replicates of the bootstrap test are shown next to the branches. All positions containing gaps and missing data were eliminated from the data set (complete deletion option).

4.4. Biochemical Tests for Putative Beneficial Rhizobacteria Traits

The following biochemical tests for putative beneficial rhizobacteria traits were performed on all bacterial isolates: Auxin-like compounds production [23], siderophores production [24], phosphate solubilization [25], and chitinases production [26,27].
For the detection of auxin-like substances, a colorimetric technique was used. Bacterial isolates were inoculated onto half-strength Tryptic Soy Agar (TSA; Difco Laboratories, Sparks, MD, USA) in a grid pattern. Each inoculated plate was overlaid with an 82-mm-diameter nitrocellulose membrane (Amersham Biosciences, Little Chalfont, UK) and subsequently, Salkowski’s reagent (2% (v/v) 0.5 M FeCl3 in 35% (v/v) perchloric acid) was applied to the membrane and incubated for 2 h to allow for color reaction development. Sensitivity of the assay was determined using known concentrations of pure IAA (Sigma Chemical Co., St. Louis, MO, USA).
To detect the production of siderophores, the culture medium described by Alexander and Zuberer [24] was used. This medium contains CAS (Chrome azurol S), to which iron is bound as part of the Fe-CAS complex, blue in color; those bacteria capable of producing siderophores separate the iron from the complex producing a yellow halo around the bacterial growth zone, a halo that is measured in mm after 24 h of incubation at 28 °C.
To demonstrate the ability of the strains to solubilize phosphate, the bacteria were cultured in the medium described by De Freitas et al. [25], which contains potato dextrose agar and yeast extract (PDYA) with freshly precipitated calcium phosphate. The hydrolysis halo made in this culture medium around the colonies was measured in mm after 24 h of incubation at 28 °C. The presence of a hydrolysis halo confirms the ability of the strain to solubilize phosphate.
To assess the ability of the strains to produce chitinases, the culture medium described by Frändberg and Shunürer et al. [27] was used. This medium contains colloidal chitin, K2HPO4, KH2PO4, MgSO4, NaCl, KCl, yeast extract and agar. Those bacteria able to produce chitinases produce a transparent halo (the medium is opaque) around the bacterial growth zone, a halo that is measured in mm after 5 days of incubation at 30 °C.

4.5. First ISR Experiment. Screening for Isolates Able to Induce Systemic Resistance

Based on phylogenetic analysis and putative beneficial rhizobacteria traits, 25 strains were selected for a first induced systemic resistance (ISR) assay. These bacteria (bioeffectors) were inoculated in A. thaliana plants at root level and challenged with the pathogen to evaluate their ability to protect plants.
A. thaliana wild type Columbia ecotype 0 seeds (provided by the Nottingham Arabidopsis Stock Centre (NASC)) were germinated in quartz sand and two-week-old seedlings were then individually transplanted to 100 mL pots filled with 12:5 (v/v) peat/sand mixture (60 g/pot). Forty-eight plants per treatment (strains and controls) were used; plants were arranged in three replicates, with sixteen repetitions each. Plants were watered with 5 mL of tap water once a week and with 5 mL of half-strength Hoagland solution per plant once a week. Strains were inoculated twice by soil drench with 3 mL of a suspension of bacterial cells, grown for 24 h in nutrient broth (CONDA) at 28 °C, and adjusted to a density of 108 cfu mL−1, in the first and the second week after transplant. Negative control plants were mock-inoculated by soil drench with 3 mL of sterile nutrient broth and positive control plants were inoculated by soil drench with 10 µL of BTH (Benzothiadiazole) 0.5 mM [28]. Four days after the second bacterial inoculation, plants were pathogen challenged with P. syringae DC3000. One day before pathogen challenge, plants were maintained with 99% relative humidity to ensure stomata opening in order to allow disease progress. P. syringae DC3000 was centrifuged (10 min at 2890× g) and cells were suspended in 10 mM MgSO4 to achieve 108 cfu mL−1. It was inoculated by spraying the total of the plants with 250 mL. Plants were incubated in a culture chamber (Sanyo MLR-350H) with an 8 h light (350 μE s−1 m−2 at 24 °C) and 16 h dark period (20 °C) at 70% relative humidity for 72 h, and disease severity was recorded as the number of leaves with disease symptoms relative to the total number of leaves. Results were relativized using the disease severity of negative control plants as 0% protection. All the ISR experimental design is represented as a timeline in Figure 8.

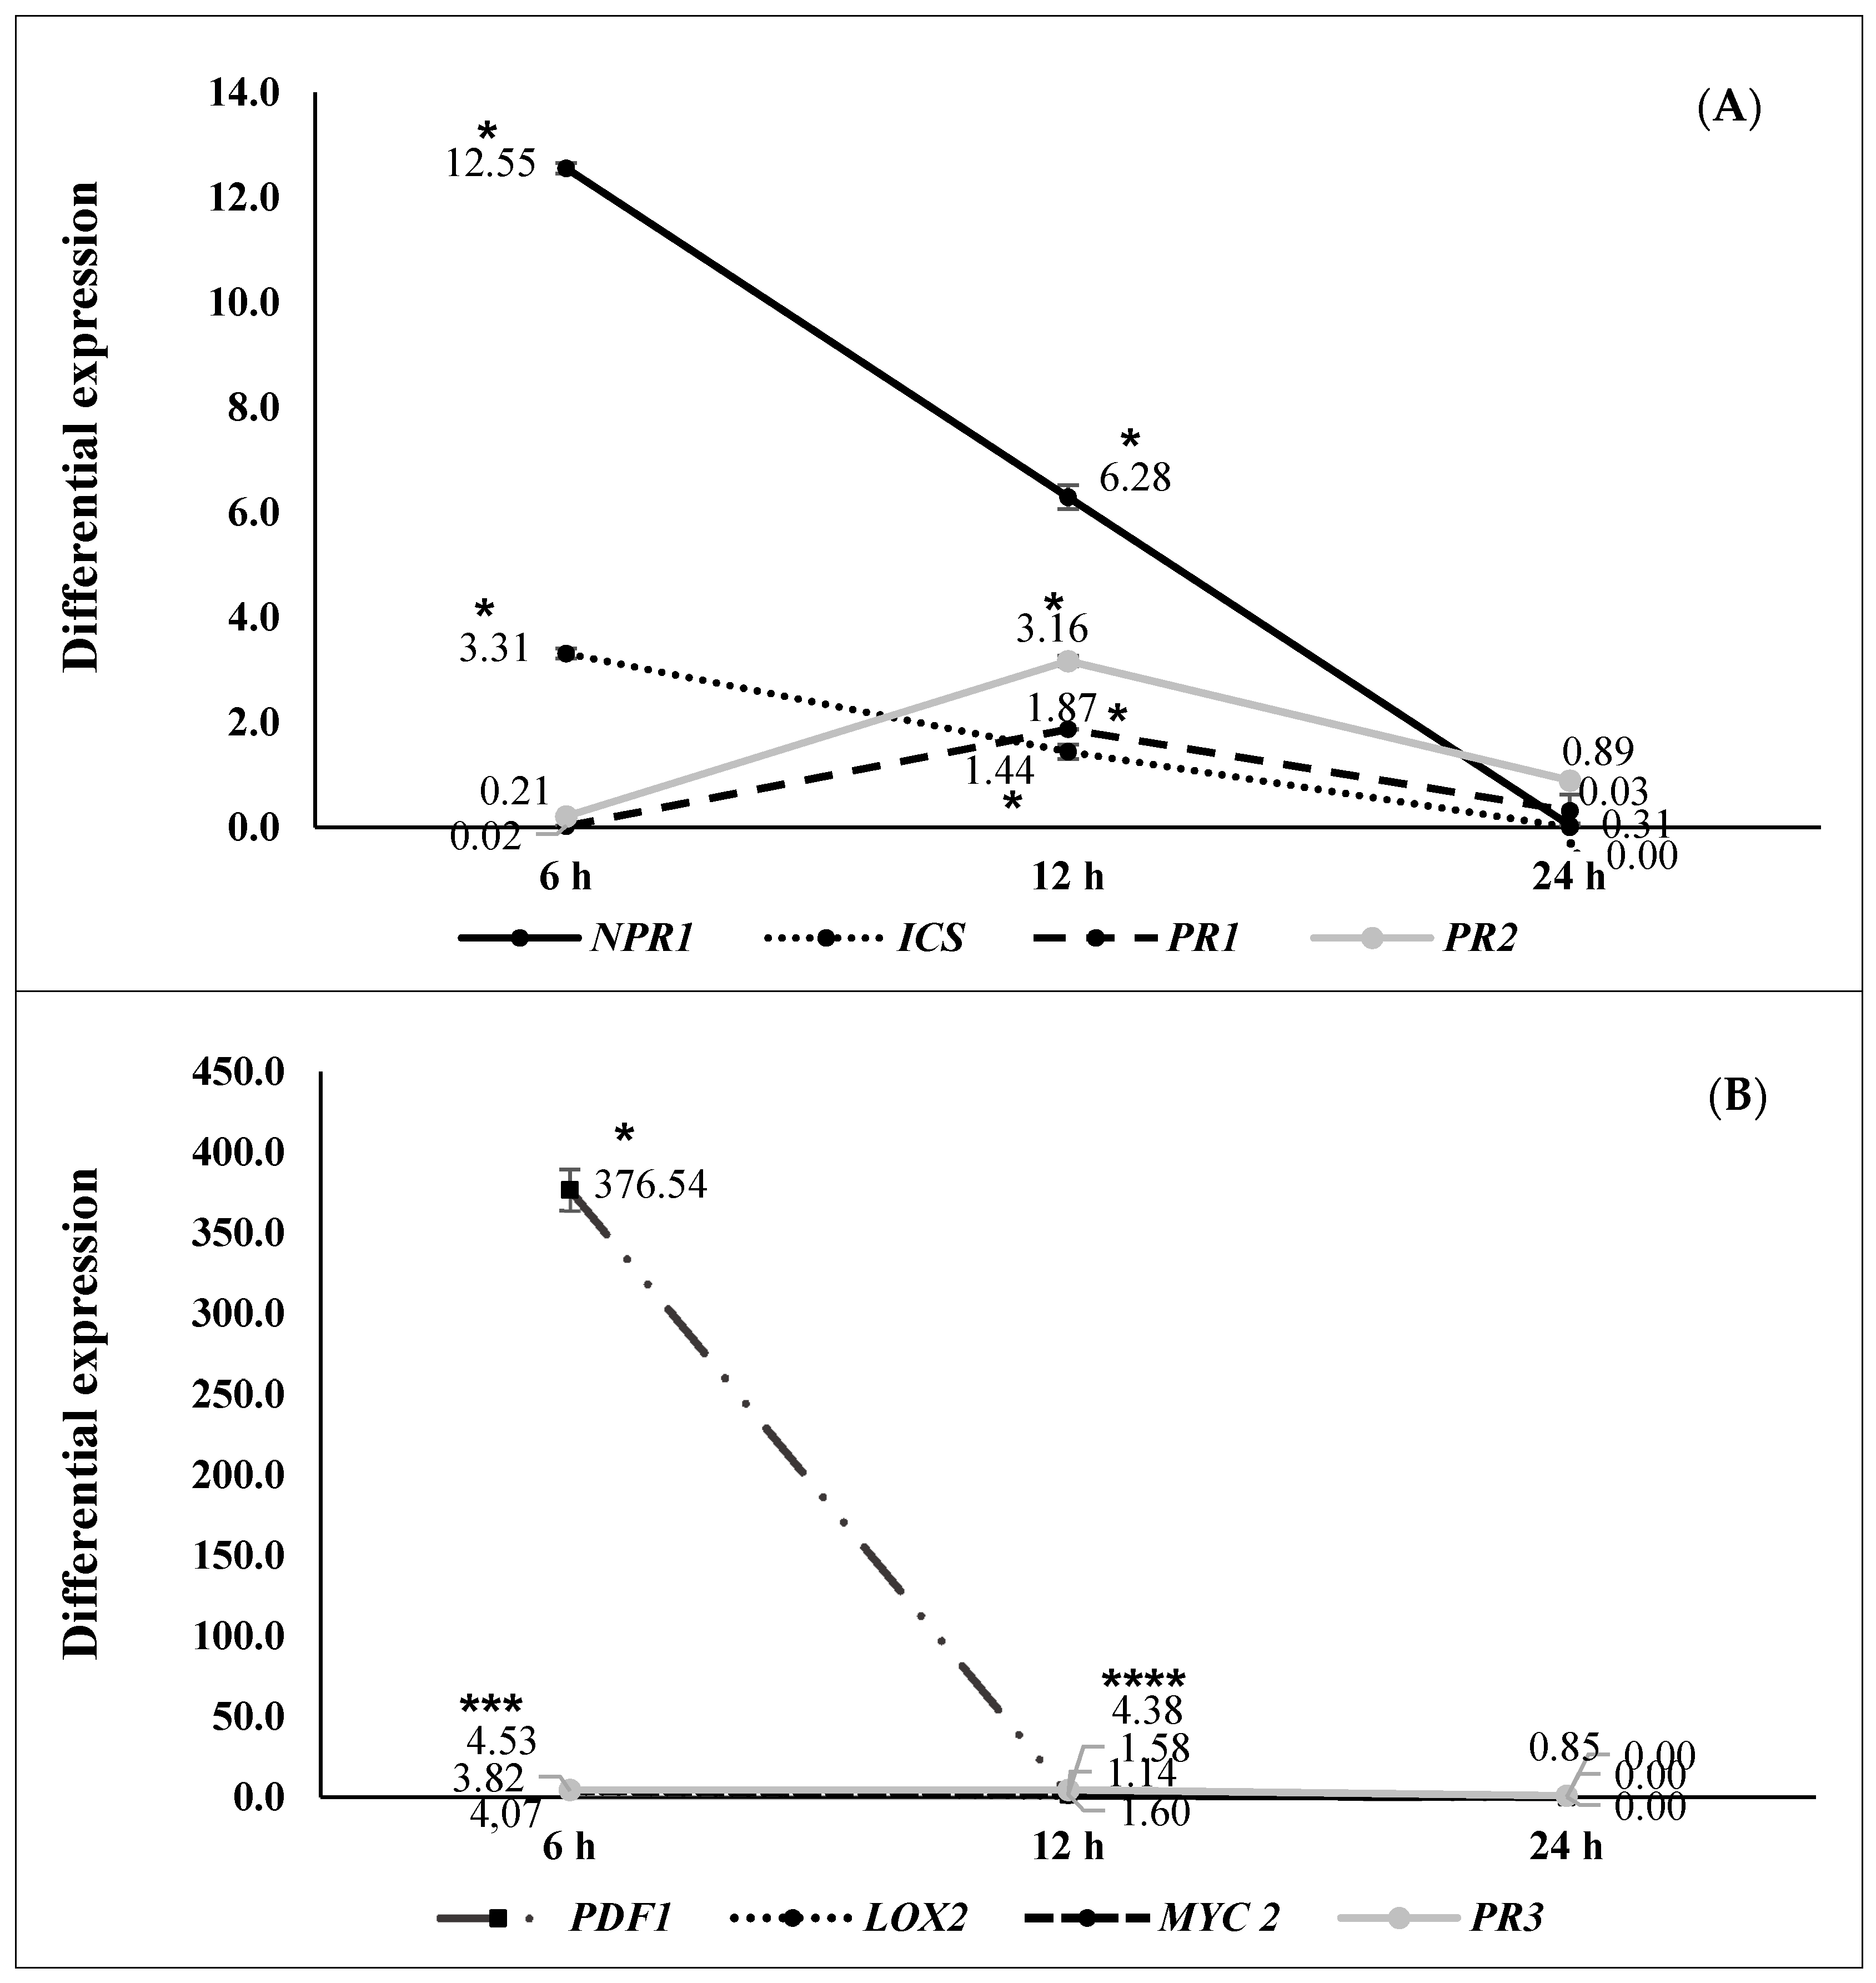
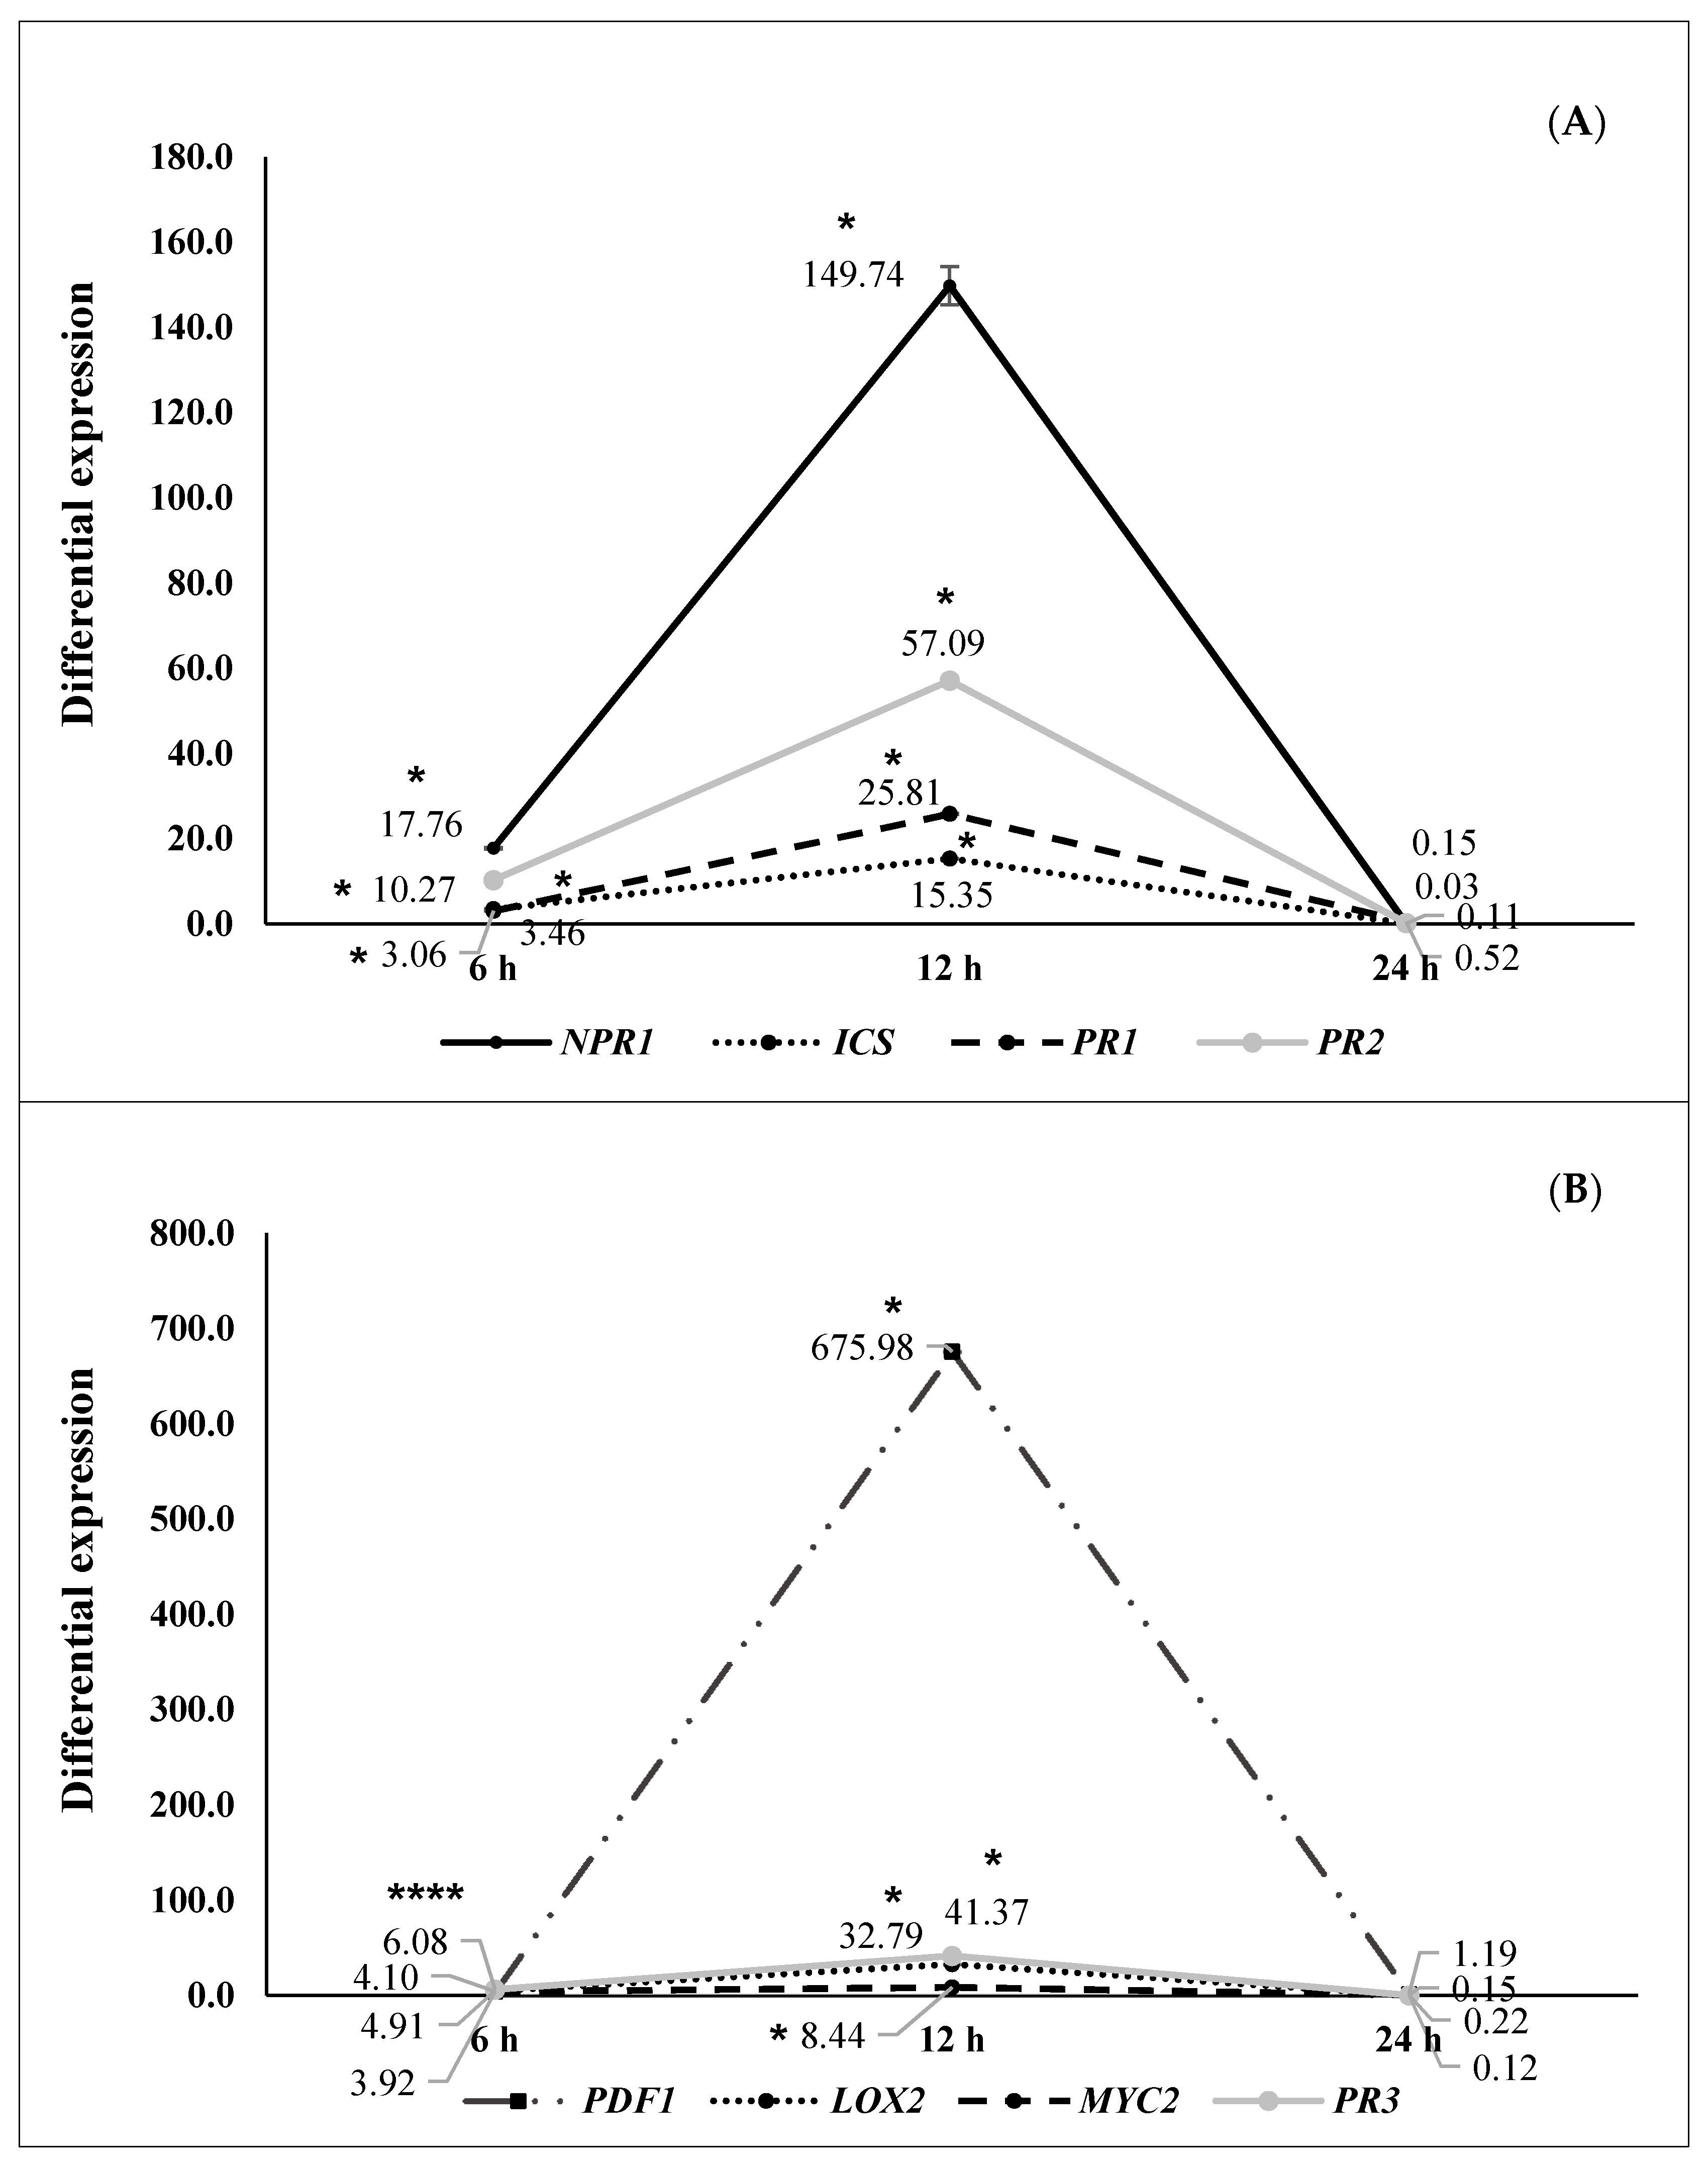
4.6. Second ISR Experiment. Study of the Signal Transduction Pathway Involved in Plant Protection

Based on results obtained from the first ISR experiment, the most protective strains (five) were selected to perform a second experiment to analyze the signal transduction pathways involved in plant protection triggered by the bioeffectors. The expression of some marker genes after pathogen challenge were assessed by qPCR. Genes analyzed were NPR1 (Nonexpressor of Pathogenesis Related Genes1), PR1 (Pathogenesis-Related Gene 1) and ICS (Isochorismate Synthase 1) as markers of the SA signaling pathway [5,48,64,65,66,67,68,69,70]; PDF1 (Plant Defensin 1), LOX2 (Lipoxygenase 2) and the transcriptional factor MYC2 as markers of the JA-ET signaling pathway [39,48,66,68,71,72,73]; and two pathogenesis-related proteins genes, PR2 (encoding β-1,3-glucanase) and PR3 (encoding chitinase), as SA and JA/ET markers, respectively [17,50,74,75,76,77,78].
A. thaliana was handled as described in the first ISR assay (Figure 8). Instead of recording disease severity 72 hapc, all the leaves of sixteen plants (treated with each bacteria (five)) were harvested at 6, 12 and 24 hapc, powdered in liquid nitrogen and stored at −80 °C. These plant samples were used for gene expression analysis by qPCR.

4.7. RNA Extraction and RT-qPCR Analysis (Second ISR Experiment)

Prior to RNA extraction, samples were grounded to a fine powder with liquid nitrogen. Total RNA was isolated from each replicate with PureLink RNA Micro Kit (Invitrogen), DNAase treatment included. RNA purity was confirmed using NanodropTM. A retrotranscription followed by RT-qPCR was performed.
The retrotranscription was performed using iScript tm cDNA Synthesis Kit (Bio-Rad). All retrotranscriptions were carried out using a GeneAmp PCR System 2700 (Applied Biosystems): 5 min 25 °C, 30 min 42 °C, 5 min 85 °C, and hold at 4 °C. Amplification was carried out with a MiniOpticon Real Time PCR System (Bio-Rad): 3 min at 95 °C and then 39 cycles consisting of 15 s at 95 °C, 30 s at 55 °C and 30 s at 72 °C, followed by melting curve to check results. To describe the expression obtained in the analysis, cycle threshold (Ct) was used. Standard curves were calculated for each gene, and the efficiency values ranged between 90 and 110%. Results for gene expression were expressed as differential expression by the 2−ΔΔCt method. Sand gene (AT2G28390) was used as reference gen [79]. Gene primers used are shown in Table 5.

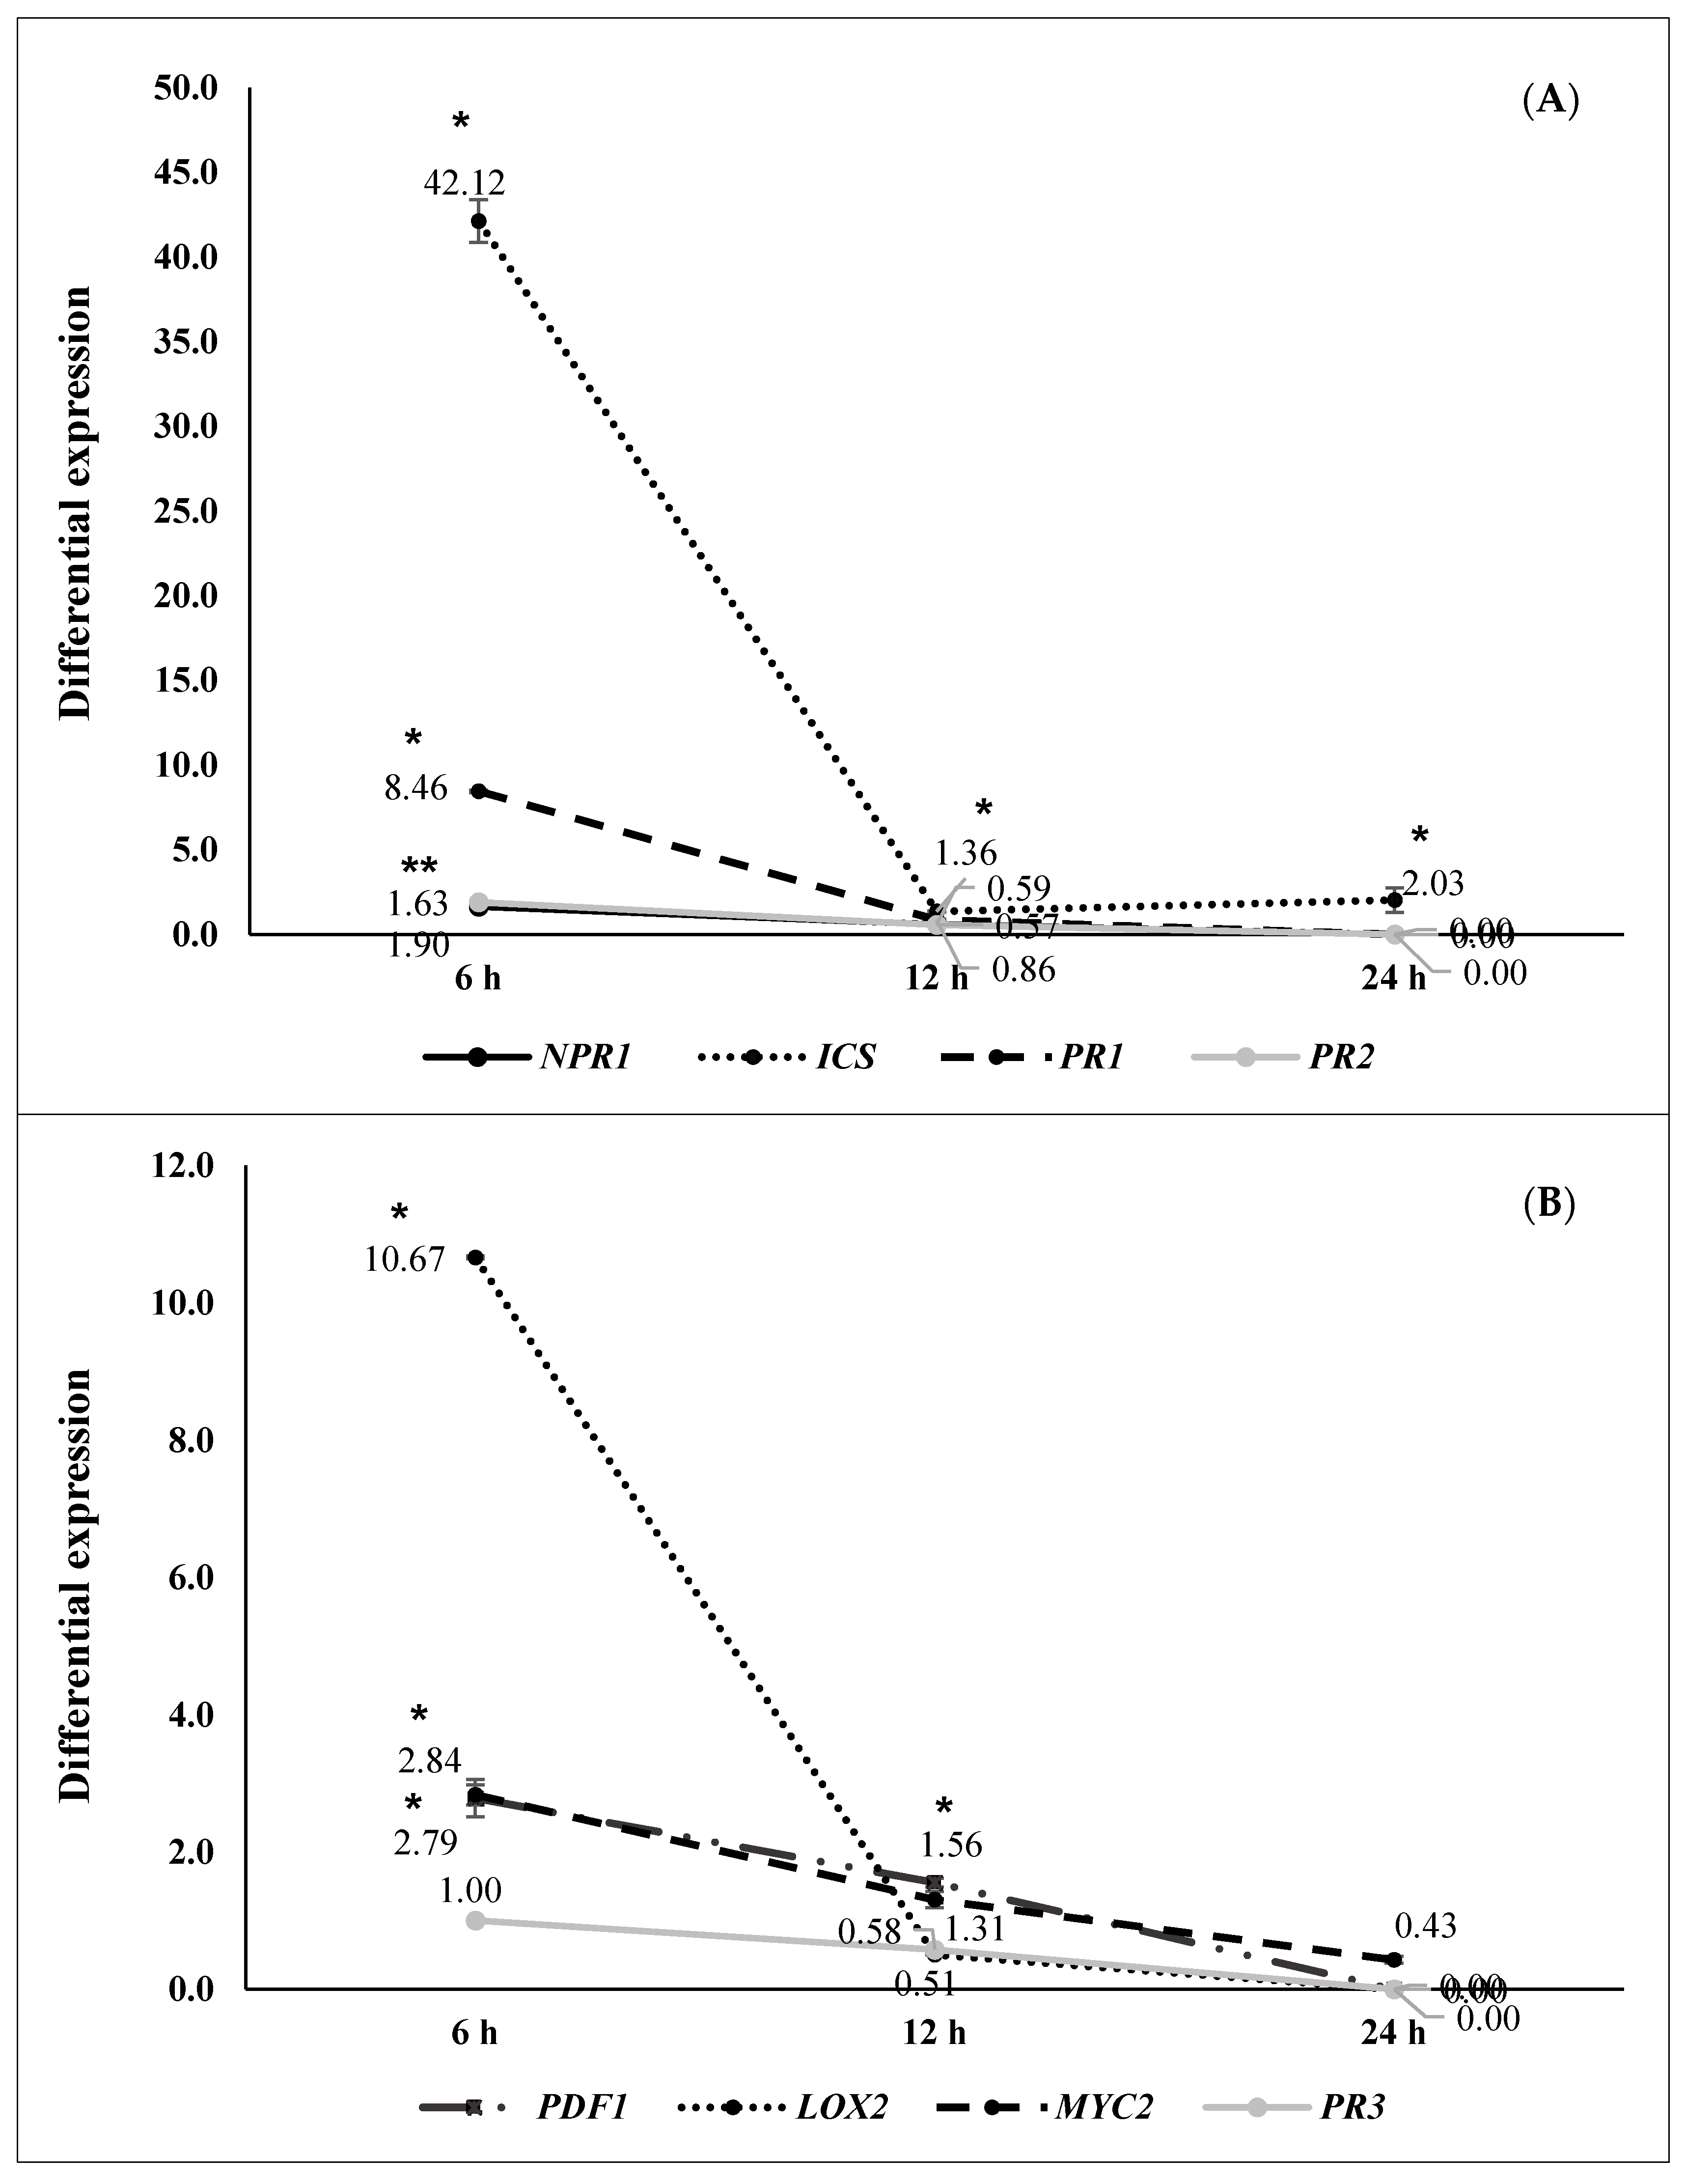
4.8. Metabolic Elicitors’ Extraction and Its Capacity to Induce Systemic Resistance. Third ISR Experiment

Based on data from qPCRs (second ISR experiment), and protection from the first ISR experiment, two strains were chosen to isolate their metabolic elicitors and check their capacity to mimic bacterial protection: S. rubidaea N 12.34 because it was the one with best differential expression results (Figure 4) and B. cereus N 4.1 because it was the Gram-positive one with best protection against disease results (Table 3).
Metabolic elicitors were extracted according to Sumayo et al. [28] protocol until obtaining n-hexane, ethyl acetate and n-butanol fractions. Briefly, strains were grown in nutrient broth (CONDA) on a rotary shaker (180 rpm) at 28 °C for 24 h. Cells were eliminated by centrifugation at 8000× g for 15 min. Five hundred mL of the obtained supernatant was filtrated by a 0.2 µm nitrocellulose filter. This filtrate was used to extract metabolic elicitors. First, a double extraction 1:1 (v/v) with n-hexane was made. The remaining aqueous phase was extracted twice with ethyl acetate (1:1 v/v), and finally, the aqueous phase was extracted twice with n-butanol (1:1 v/v). The organic phases (n-hexane, ethyl acetate and n-butanol) were pooled and evaporated to dryness in a rotary evaporator at 50 °C. The dry residues obtained were dissolved in 25 mL of 10% Dimethyl sulfoxide (DMSO).
A third ISR assay on A. thaliana plants to evaluate the ability of the three metabolic elicitor fractions extracted from N 12.34 and N 4.1 strains was carried out. Four treatments per strain were defined: (a) Metabolic elicitors in the n-hexane fraction, (b) metabolic elicitors in the ethyl acetate fraction, (c) metabolic elicitors in the n-butanol fraction, and (e) positive control (BTH [28]). Additional controls (negative control) with the fractions extracted with n-hexane, ethyl acetate and n-butanol from nutrient broth (without bacteria) and dissolved in 10% DMSO were also included to ensure that elicitor effects were due to bacterial components and not to the nutrient broth or the DMSO. All were pathogen challenged.
A. thaliana was handled as described in the first ISR assay (Figure 8). Treatments were delivered to seedlings by soil drench (50 µL of the three metabolic elicitor fractions, 10 µL of BTH (positive control), and 50 µL of each negative control fraction). The pathogen was also inoculated as described in the first ISR assay. Seventy-two hours after pathogen inoculation, disease severity was recorded and relativized as in the first ISR experiment (Figure 8).

4.9. RT-qPCR Analysis of the Genes Triggered by Metabolic Elicitor Fractions (Fourth ISR Experiment)

Based on data from the third ISR experiment, another ISR assay was carried out using the protocol explained above. The two most effective metabolic elicitor fractions against pathogen attack from each bacteria (n-hexane and ethyl acetate) were used. Differential gene expression of NPR1, PR2 and PDF1 for strain N 12.34 and NPR1, PR3, and PDF1 for strain N 4.1 were analyzed. In the case of strain N 12.34, analysis was performed at 6 and 12 hapc, and in that of strain N 4.1, at 12 and 24 hapc. Genes and sampling moments were selected according to previous results of the first qPCR experiment.
A. thaliana was handled as described in the first ISR assay (Figure 8). Treatments were n-hexane metabolic elicitor fraction from N 12.34, ethyl acetate metabolic elicitor fraction from N 12.34, n-hexane metabolic elicitor fraction from N 4.1, ethyl acetate metabolic elicitor fraction from N 4.1 and controls with n-hexane and ethyl acetate (sterile nutrient broth was used to obtain control n-hexane and control ethyl-acetate fractions). Plants were inoculated by soil drench (50 µL), and challenge inoculation with P. syringae DC3000 was performed as explained above.

4.10. Statistical Analysis

One-way ANOVA with replicates was used to check the statistical differences in all data obtained. Prior to ANOVA analysis, homoscedasticity and normality of the variance was checked with Statgraphics plus 5.1 for Windows, meeting requirements for analysis. When significant differences appeared (p < 0.05) a Fisher test was used [80].

5. Conclusions

The enormous biotechnological potential of the rhizosphere as a source of bacterial strains capable of establishing a beneficial relationship with plants and of modifying their defensive metabolism, improving their ability to defend themselves from pathogen attacks, has been evidenced.
In addition, triggering SA and/or JA/ET defensive pathways by bacteria seem to be more complex than current description in the literature and the concept of simultaneous elicitation of different pathways of plant immune system has been reinforced.
Each bacterium had a different effect in the genes studied, even within the same bacterial genus. In addition, the metabolic elicitors of the two studied strains had different effects to that produced by the bacteria, confirming the presence of many different bacterial molecules able to trigger plant metabolism. This is very interesting since it opens a huge amount of biotechnological possibilities to develop biological products for agriculture in different situations and plant species

Author Contributions

The results are part of the doctoral thesis of H.M.-R. whose directors are: J.A.L. and F.J.G.-M. All authors designed the experiments described in the manuscript. H.M.-R., B.R.-S., and A.G.-V. carried out all the analyses of the strains present in the phylogenetic tree. H.M.-R. and J.A.L. carried out the ISR experiments in Arabidopsis, the collection of samples and subsequent analyses. H.M.-R., J.A.L., and B.R.-S. wrote the main manuscript, and all authors reviewed the manuscript. All authors have read and agreed to the published version of the manuscript.

Funding

This work was supported by Ministerio de Economía y Competitividad of Spain through the project AGL-2013-45189-R.

Conflicts of Interest

The authors declare no competing interests.

Availability of Materials and Data

All related data are available within the manuscript and its additional files.

Abbreviations

BTHBenzothiadiazole
DMSODimethyl sulfoxide
ETEthylene
ETIEffector-triggered immunity
hapcHours after pathogen challenge
IAAIndole acetic acid
ICSIsochorismate synthase
ISRInduced systemic resistance
JAJasmonic acid
LOX 2Lipoxygenase 2
MAMPMicrobe-associated molecular pattern
NPR1Nonexpressor of pathogenesis-related protein 1
PAMPPathogen-associated molecular pattern
PDF1Plant defensin 1
PR1Pathogenesis-related gene 1
PRRPattern recognition receptor
PTIPattern-triggered immunity
SASalicylic acid
SARSystemic acquired resistance

References

  1. Pechanova, O.; Pechan, T. Maize-pathogen interactions: An ongoing combat from a proteomics perspective. Int. J. Mol. Sci. 2015, 16, 28429–28448. [Google Scholar] [CrossRef] [PubMed] [Green Version]
  2. Miller, R.N.G.; Alves, G.S.C.; Van Sluys, M.-A. Plant immunity: Unravelling the complexity of plant responses to biotic stresses. Ann. Bot. 2017, 119, 681–687. [Google Scholar] [CrossRef] [PubMed] [Green Version]
  3. Jones, J.D.G.; Dangl, J.L. The plant immune system. Nature 2006, 444, 323–329. [Google Scholar] [CrossRef] [PubMed] [Green Version]
  4. Pel, M.J.; Pieterse, C.M. Microbial recognition and evasion of host immunity. J. Exp. Bot. 2013, 64, 1237–1248. [Google Scholar] [CrossRef] [Green Version]
  5. Pieterse, C.M.J.; Pel, M.J.C. Induced Systemic Resistance by Beneficial Microbes. Annu. Rev. Phytopathol. 2014, 52, 347–375. [Google Scholar] [CrossRef] [Green Version]
  6. Glazebrook, J. Contrasting mechanisms of defense against biotrophic and necrotrophic pathogens. Annu. Rev. Phytopathol. 2005, 43, 205–227. [Google Scholar] [CrossRef]
  7. Hammerschmidt, R. Systemic acquired resistance. Adv. Bot. Res. 2009, 51, 173–222. [Google Scholar] [CrossRef]
  8. Pieterse, C.M.J.; Van Pelt, J.A.; Tona, J.; Parchmannb, S.; Mueller, M.J.; Buchala, A.J.; Métrauxc, J.-P.; Van Loon, L.C. Rhizobacteria-mediated induced systemic resistance (ISR) in Arabidopsis requires sensitivity to jasmonate and ethylene but is not accompanied by an increase in their production. Physiol. Mol. Plant. Pathol. 2000, 57, 123–134. [Google Scholar] [CrossRef] [Green Version]
  9. Gozzo, F.; Faoro, F. Systemic Acquired Resistance (50 Years after Discovery): Moving from the Lab to the Field. J. Agric. Food Chem. 2013, 61, 12473–12491. [Google Scholar] [CrossRef]
  10. Pieterse, C.M.J.; Van Loon, L.C. NPR1: The spider in the web of induced resistance signalling pathways. Curr. Opin. Plant. Biol. 2004, 7, 456–464. [Google Scholar] [CrossRef] [Green Version]
  11. Pieterse, C.M.J.; Van Loon, L.C. Signalling Cascades Involved in Induced Resistance. In Induced Resistance for Plant Defence; Walters, D., Newton, A.C., Lyon, G., Eds.; Blackwell: London, UK, 2007; pp. 65–88. [Google Scholar]
  12. Berrocal-Lobo, M.; Molina, A.; Solano, R. Constitutive expression of Ethylene-Response-Factor1 in Arabidopsis confers resistance to several necrotrophic fungi. Plant J. 2002, 29, 23–32. [Google Scholar] [CrossRef]
  13. Lorenzo, O.; Piqueras, R.; Sánchez-Serrano, J.J.; Solano, R. Ethylene response factor integrates signals from ethylene and jasmonate pathways in plant defense. Plant Cell 2003, 15, 165–178. [Google Scholar] [CrossRef] [PubMed] [Green Version]
  14. Pozo, M.J.; Van Der Ent, S.; Van Loon, L.C.; Pieterse, C.M.J. Transcription factor MYC2 is involved in priming for enhanced defense during rhizobacteria-induced systemic resistance in Arabidopsis thaliana. New Phytol. 2008, 180, 511–523. [Google Scholar] [CrossRef] [PubMed]
  15. Conrath, U.; Pieterse, C.M.J.; Mauch-Mani, B. Priming in plant-pathogen interactions. Trends Plant Sci. 2002, 7, 210–216. [Google Scholar] [CrossRef] [Green Version]
  16. Conrath, U.; Beckers, G.J.; Flors, V.; García-Agustín, P.; Jakab, G.; Mauch, F.; Newman, M.-A.; Pieterse, C.M.J.; Poinssot, B.; Pozo, M.J.; et al. Priming: Getting ready for battle. Mol. Plant Microbe Interact. 2006, 19, 1062–1071. [Google Scholar] [CrossRef] [PubMed] [Green Version]
  17. Wu, G.; Liu, Y.; Xu, Y.; Zhang, G.; Shetn, Q.-R.; Zhalng, R. Exploring elicitors of the beneficial rhizobacterium Bacillus amyloliquefaciens SQR9 to induce plant systemic resistance and their interactions with plant signaling pathways. Mol. Plant Microbe Interact. 2018, 31, 560–567. [Google Scholar] [CrossRef] [Green Version]
  18. Garcia, J.A.L.; Probanza, A.; Ramos, B.; Mañero, F.J.G. Genetic variability of rhizobacteria from wild populations of four Lupinus species based on PCR-RAPDs. J. Plant Nutr. Soil Sci. 2001, 164, 1–7. [Google Scholar] [CrossRef]
  19. Berendsen, R.L.; Pieterse, C.M.J.; Bakker, P.A.H.M. The rhizosphere microbiome and plant health. Trends Plant Sci. 2012, 17, 478–486. [Google Scholar] [CrossRef]
  20. Stringlis, I.A.; Kirstin Feussner, K.Y.; Sietske Van Bentum, R.; Van Verk, M.C.; Berendsen, R.L.; Bakker, P.A.H.; Feussner, I.; Pieterse, C.M.J. MYB72-dependent coumarin exudation shapes root microbiome assembly to promote plant health. Proc. Natl. Acad. Sci. USA 2018, 115, E5213–E5222. [Google Scholar] [CrossRef] [Green Version]
  21. Ramos-Solano, B.; Lucas, J.A.; Garcia-Villaraco, A.; Algar, E.; Garcia-Cristobal, J.; Gutiérrez-Mañero, F.J. Siderophore and chitinase producing isolates from the rhizosphere of Nicotiana glauca Graham enhance growth and induce systemic resistance in Solanum lycopersicum L. Plant Soil 2010, 334, 189–197. [Google Scholar] [CrossRef]
  22. Cui, H.; Tsuda, K.; Parker, J.E. Effector-triggered immunity: From pathogen perception to robust defence. Ann. Rev. Plant Biol. 2014, 66, 487–511. [Google Scholar] [CrossRef]
  23. Sergeeva, E.; Danielle Hirkala, L.M.; Louise, N.M. Production of indole-3-acetic acid, aromatic amino acid aminotransferase activities and plant growth promotion by Pantoea agglomerans rhizosphere isolates. Plant Soil 2007, 297, 1–13. [Google Scholar] [CrossRef]
  24. Alexander, D.B.; Zuberer, D.A. Use of chrome azurol S reagents to evaluate siderophore production by rhizo- sphere bacteria. Biol. Fertil. Soils 1991, 12, 39–45. [Google Scholar] [CrossRef]
  25. De Freitas, J.; Banerjee, M.; Germida, J. Phosphate-solubilizing rhizobacteria enhance the growth and yield but not phosphorus uptake of canola (Brassica napus L.). Biol. Fertil. Soils 1997, 24, 358–364. [Google Scholar] [CrossRef]
  26. Rodríguez-Kábana, R.; Godoy, G.; Morgan-Jones, G.; Shelby, R.A. The determination of soil chitinase activity: Conditions for assay and ecological studies. Plant Soil 1983, 75, 95–106. [Google Scholar] [CrossRef]
  27. Frändberg, E.; Shnurer, J. Antifungal activity of chitino- lytic bacteria isolated from airtight stored cereal grain. Can. J. Microbiol. 1998, 44, 121–127. [Google Scholar] [CrossRef]
  28. Sumayo, M.; Hahm, M.-S.; Ghim, S.-Y. Determinants of Plant Growth-promoting Ochrobactrum lupini KUDC1013 Involved in Induction of Systemic Resistance against Pectobacterium carotovorum subsp. carotovorum in Tobacco Leaves. Plant Pathol. J. 2013, 29, 174–181. [Google Scholar] [CrossRef]
  29. Lucas, J.A.; Garcia-Villaraco, A.; Ramos, B.; Garcia-Cristobal, J.; Algar, E.; Gutierrez-Mañero, J. Structural and functional study in the rhizosphere of Oryza sativa L. plants growing under biotic and abiotic stress. J. Appl. Microbiol. 2013, 115, 218–235. [Google Scholar] [CrossRef]
  30. Aarab, S.; Ollero, F.J.; Megías, M.; Laglaoiu, A.; Bakkali, M.; Arakrak, A. Isolation and screening of bacteria from rhizospheric soils of rice fields in Northwestern Morocco for different plant growth promotion (PGP) activities: An in vitro study. Int. J. Curr. Microbiol. App. Sci. 2015, 4, 260–269. [Google Scholar]
  31. Anwar, S.; Ali, B.; Sajid, I. Screening of Rhizospheric Actinomycetes for Various In-vitro and In-vivo Plant Growth Promoting (PGP) Traits and for Agroactive Compounds. Front. Microbiol. 2016, 7, 82. [Google Scholar] [CrossRef] [Green Version]
  32. Yang, Y.; Wang, N.; Guo, X.; Zhang, Y.; Ye, B. Comparative analysis of bacterial community structure in the rhizosphere of maize by high throughput pyrosequencing. PLoS ONE 2017, 12, e178425. [Google Scholar] [CrossRef]
  33. Zhang, X.; Zhang, R.; Gao, J.; Wang, X.; Fan, F.; Ma, X.; Yin, H.; Zhang, C.; Feng, K.; Deng, Y. Thirty-one years of rice-rice-green manure rotations shape the rhizosphere microbial community and enrich beneficial bacteria. Soil Biol. Biochem. 2017, 104, 208–217. [Google Scholar] [CrossRef]
  34. Raymond, K.; Muller, G.; Matzanke, B. Complexation of iron by siderophores a review of their solution and structural chemistry and biological function. Top. Curr Chem. 1984, 123, 49–102. [Google Scholar] [CrossRef]
  35. Jin, C.W.; He, Y.F.; Tang, C.X.; Wu, P.; Zheng, S.J. Mechanisms of microbially enhanced Fe acquisition in red clover (Trifolium pratense L.). Plant. Cell Environ. 2006, 29, 888–897. [Google Scholar] [CrossRef] [PubMed] [Green Version]
  36. Sinclair, S.J.; Johnson, R.; Hamill, J.D. Analysis of would- induced gene expression in Nicotiana species with contrasting alkaloid profiles. Functional Plant Biol. 2004, 31, 721–729. [Google Scholar] [CrossRef] [PubMed]
  37. Barriuso, J.; Ramos Solano, B.; Fray, R.G.; Cámara, M.; Hartmann, A.; Gutiérrez Mañero, F.J. Transgenic tomato plants alter quorum sensing in Plant Growth Promoting Rhizo- bacteria. Plant Biotechnol J. 2008, 6, 442–452. [Google Scholar] [CrossRef]
  38. Sid, A.; Ezziyyani, M.; Egea-Gilabert, C.; Candela, M.E. Selecting bacterial strains for use in the biocontrol of diseases caused by Phytophthora capsici and Alternaria alteranata in sweet pepper plants. Biol. Plant 2003, 47, 569–574. [Google Scholar] [CrossRef]
  39. Adesina, M.F.; Lembke, A.; Costa, R.; Speksnijder, A.; Smalla, K. Screening of bacterial isolates from various European soils for in vitro antagonistic activity towards Rhizoctonia solani and Fusarium oxysporum: Site-dependent composition and diversity revealed. Soil Biol. Biochem. 2007, 39, 2818–2828. [Google Scholar] [CrossRef]
  40. Van Loon, L.C.; Bakker, P.; Pieterse, C.M.J. Systemic resistance induced by rhizosphere bacteria. Annu. Rev. Phytopathol. 1998, 36, 453–483. [Google Scholar] [CrossRef] [Green Version]
  41. Ramamoorthy, V.; Viswanathan, R.; Raguchander, T.; Prakasam, V.; Samiyappan, R. Induction of systemic resistance by plant growth promoting rhizobacteria in crop plants against pests and diseases. Crop. Prot. 2001, 20, 1–11. [Google Scholar] [CrossRef]
  42. Solano, B.R.; Barriuso, J.; Pereyra, M.T.; Domenech, J.; Mañero, F.J.G. Systemic disease protection elicited by plant growth promoting rhizobacteria strains: Relationship between metabolic responses, systemic disease protection and biotic elicitors. Phytopathoogy 2008, 98, 451–457. [Google Scholar] [CrossRef] [PubMed] [Green Version]
  43. Petti, C.; Reiber, K.; Ali, S.S.; Berney, M.; Doohan, F.M. Auxin as a player in the biocontrol of Fusarium head blight disease of barley and its potential as a disease control agent. BMC Plant Biol. 2012, 12, 224. [Google Scholar] [CrossRef] [PubMed] [Green Version]
  44. Akram, W.; Anjum, T.; Ali, B. Phenylacetic acid is ISR determinant produced by Bacillus fortis IAGS162, which involves extensive re-modulation in metabolomics of tomato to protect against Fusarium Wilt. Front. Plant Sci. 2016, 7, 498. [Google Scholar] [CrossRef] [Green Version]
  45. Martin-Rivilla, H.; Gutierrez-Mañero, F.J.; Gradillas, A.P.; Navarro, M.O.; Andrade, G.; Lucas, J.A. Identifying the compounds of the metabolic elicitors of Pseudomonas fluorescens N 21.4 responsible for their ability to induce plant resistance. Plants 2020, 9, 1020. [Google Scholar] [CrossRef]
  46. Kannojia, P.; Choudhary, K.K.; Srivastava, A.K.; Singh, A.K. Chapter Four. PGPR Bioelicitors: Induced Systemic Resistance (ISR) and proteomic perspective on biocontrol. In PGPR Amelioration in Sustainable Agriculture; Elsevier Inc.: Amsterdam, The Netherlands, 2018; pp. 67–84. [Google Scholar]
  47. Gutierrez Albanchez, E.; Garcia-Villaraco, A.; Lucas, J.A.; Gutierrez, F.J.; Ramos-Solano, B. Priming fingerprint induced by Bacillus amyloliquefaciensQV15, a common pattern in Arabidopsis thaliana and in field-grown blackberry. J. Plant Interact. 2018, 13, 398–408. [Google Scholar] [CrossRef]
  48. Caarls, L.; Pieterse, C.M.J.; Van Wees, S.C.M. How salicylic acid takes transcriptional control over jasmonic acid signaling. Front. Plant Sci. 2015, 6, 170. [Google Scholar] [CrossRef] [PubMed]
  49. Leon-Reyes, A.; Spoel, S.H.; De Lange, E.S.; Abe, H.; Kobayashi, M.; Tsuda, S.; Millenaar, F.F.; Welschen, R.A.M.; Ritsema, T.; Pieterse, C.M.J. Ethylene modulates the role of nonexpressor of pathogenesis-related genes1 in cross talk between salicylate and jasmonate signalling. Plant Physiol. 2009, 149, 1797–1809. [Google Scholar] [CrossRef] [Green Version]
  50. Spoel, S.H.; Dong, X. How do plants achieve immunity? Defence without specialized immune cells. Nat. Rev. Immunol. 2012, 12, 89–100. [Google Scholar] [CrossRef]
  51. Liu, L.; Huang, N.; Wang, L.; Ling, H.; Sun, T.; Ahmad, W.; Muhammad, K.; Guo, J.; Xu, L.; Gao, S.; et al. Salicylic acid receptors activate jasmonic acid signalling through a non-canonical pathway to promote effector-triggered immunity. Nat. Commun. 2016, 7, 13099. [Google Scholar] [CrossRef] [Green Version]
  52. Betsuyaku, S.; Katou, S.; Takebayashi, Y.; Sakakibara, H.; Nomura, N.; Fukuda, H. Salicylic acid and Jasmonic acid pathways are activated in spatially different domains around the infection site during Effector-Triggered Immunity in Arabidopsis thaliana. Plant Cell Physiol. 2017, 59, 8–16. [Google Scholar] [CrossRef]
  53. Ramirez-Prado, J.S.; Abulfaraj, A.A.; Rayapuram, N.; Benhamed, M.; Hirt, H. Plant Immunity: From signalling to epigenetic control of defense. Trends Plant Sci. 2018, 9, 833–844. [Google Scholar] [CrossRef] [PubMed]
  54. Munhoz, L.D.; Fonteque, J.P.; Santos, I.M.O.; Navarro, M.O.P.; Simionato, A.S.; Goya Rezende, M.I.; Balbi-Peña, M.I.; de Oliveira, A.G.; Andrade, G. Control of bacterial stem rot on tomato by extracellular bioactive compounds produced by Pseudomonas aeruginosa LV strain. Cogent Food Agric. 2017, 35, 1282592. [Google Scholar] [CrossRef]
  55. Martin-Rivilla, H.; Garcia-Villaraco, A.; Ramos-Solano, B.; Gutierrez-Manero, F.J.; Lucas, J.A. Extracts from cultures of Pseudomonas fluorescens induce defensive patterns of gene expression and enzyme activity while depressing visible injury and reactive oxygen species in Arabidopsis thaliana challenged with pathogenic Pseudomonas syringae. AoB Plants 2019, 11, plz049. [Google Scholar] [CrossRef] [PubMed]
  56. Martin-Rivilla, H.; Garcia-Villaraco, A.; Ramos-Solano, B.; Gutierrez-Manero, F.J.; Lucas, J.A. Improving flavonoid metabolismin blackberry leaves and plant fitness by using the bioeffector Pseudomonas fluorescens N 21.4 and its metabolic elicitors: A biotechnological approach for a more sustainable crop. J. Agric. Food Chem. 2020, 68, 6170–6180. [Google Scholar] [CrossRef]
  57. Martin-Rivilla, H.; Garcia-Villaraco, A.; Ramos-Solano, B.; Gutierrez-Manero, F.J.; Lucas, J.A. Metabolic elicitors of Pseudomonas fluorescens N 21.4 elicit flavonoid metabolism in blackberry fruit. J. Sci. Food Agric. 2020, 101, 205–214. [Google Scholar] [CrossRef]
  58. Fatima, S.; Anjum, T. Identification of a potential ISR determinant from Pseudomonas aeruginosa PM12 against Fusarium Wilt in Tomato. Front. Plant Sci. 2017, 8, 69. [Google Scholar] [CrossRef]
  59. Van Hulten, M.; Pelser, M.; van Loon, L.C.; Pieterse, C.M.J.; Ton, J. Costs and benefits of priming for defense in Arabidopsis. Proc. Natl. Acad. Sci. USA 2006, 103, 5602–5607. [Google Scholar] [CrossRef] [Green Version]
  60. Lucas, J.A.; Garcia-Cristobal, J.; Bonilla, A.; Ramos, B.; Gutiérrez-Mañero, J. Beneficial rhizobacteria from rice rhizosphere confers high protection against biotic and abiotic stress inducing systemic resistance in rice seedlings. Plant Physiol. Biochem. 2014, 82, 44–53. [Google Scholar] [CrossRef]
  61. Tang, D.; Wang, G.; Zhou, J.-M. Receptor kinases in plant-pathogen interactions: More than pattern recognition. Plant Cell 2017, 29, 618–637. [Google Scholar] [CrossRef] [Green Version]
  62. Timmusk, S.; Behers, L.; Muthoni, J.; Muraya, A.; Aronsson, A.-C. Perspectives and challenges of microbial application for crop improvement. Front. Plant Sci. 2017, 8, 49. [Google Scholar] [CrossRef] [Green Version]
  63. Rosier, A.; Medeiros, F.H.V.; Bais, H.P. Defining plant growth promoting rhizobacteria molecular and biochemical networks in beneficial plant-microbe interactions. Plant Soil 2018, 428, 35–55. [Google Scholar] [CrossRef] [Green Version]
  64. Wildermuth, M.C.; Dewdney, J.; Wu, G.; Ausubel, F.M. corrigendum: Isochorismate synthase is required to synthesize salicylic acid for plant defence. Nature 2002, 417, 571. [Google Scholar] [CrossRef]
  65. Vlot, A.C.; Dempsey, D.A.; Klessig, D.F. Salicylic Acid, a multifaceted hormone to combat disease. Annu. Rev. Phytopathol. 2009, 47, 177–206. [Google Scholar] [CrossRef] [PubMed] [Green Version]
  66. Niu, D.D.; Liu, H.X.; Jiang, C.H.; Wang, Y.P.; Wang, Q.Y.; Jin, H.L.; Guo, J.H. The plant growth-promoting rhizobacterium Bacillus cereus AR156 induces systemic resistance in Arabidopsis thaliana by simultaneously activating salicylate and jasmonate/ethylene-dependent signaling pathways. Mol. Plant Microbe Interact. 2011, 24, 533–542. [Google Scholar] [CrossRef] [Green Version]
  67. Seyfferth, C.; Tsuda, K. Salicylic acid signal transduction: The initiation of biosynthesis, perception and transcriptional reprogramming. Front. Plant Sci. 2014, 5, 697. [Google Scholar] [CrossRef] [Green Version]
  68. Nie, P.; Li, X.; Wang, S.; Guo, J.; Zhao, H.; Niu, D. Induced Systemic Resistance against Botrytis cinerea by Bacillus cereus AR156 through a JA/ET- and NPR1-Dependent Signalling Pathway and Activates PAMP-Triggered Immunity in Arabidopsis. Front. Plant Sci. 2017, 8, 238. [Google Scholar] [CrossRef]
  69. Ding, Y.; Sun, T.; Ao, K.; Peng, Y.; Zhang, Y.; Li, X.; Zhang, Y. Opposite Roles of Salicylic Acid Receptors NPR1 and NPR3/NPR4 in Transcriptional Regulation of Plant Immunity. Cell 2018, 173, 1454–1467. [Google Scholar] [CrossRef]
  70. Kazan, K. A new twist in SA signalling. Nature Plants 2018, 4, 327–328. [Google Scholar] [CrossRef]
  71. Lorenzo, O.; Solano, R. Molecular players regulating the jasmonate signalling network. Curr. Opin. Plant Biol. 2005, 8, 532–540. [Google Scholar] [CrossRef] [PubMed]
  72. Pangesti, N.; Pineda, A.; Dicke, M.; Van Loon, J.J.A. Variation in plant-mediated interactions between rhizobacteria and caterpillars: Potential role of soil composition. Plant Biol. 2014, 17, 474–483. [Google Scholar] [CrossRef]
  73. Du, M.; Zhao, J.; Tzeng, D.T.W.; Liu, Y.; Deng, L.; Yang, T.; Zhai, Q.; Wu, F.; Huang, Z.; Zhou, M.; et al. MYC2 orchestrates a hierarchical transcriptional cascade that regulates jasmonate-mediated plant immunity in tomato. Plant Cell 2017, 29, 1883–1906. [Google Scholar] [CrossRef] [Green Version]
  74. Van Loon, L.C.; Van Strien, E.A. The families of pathogenesis-related proteins, their activities, and comparative analysis of PR-1 type proteins. Physiol. Mol. Plant Pathol. 1999, 55, 85–97. [Google Scholar] [CrossRef]
  75. Jeandet, P.; Clément, C.; Courot, E.; Cordelier, S. Modulation of Phytoalexin Biosynthesis in Engineered Plants for Disease Resistance. Int. J. Mol. Sci. 2013, 14, 14136–14170. [Google Scholar] [CrossRef] [PubMed] [Green Version]
  76. Lemarié, S. Both the Jasmonic Acid and the Salicylic Acid Pathways Contribute to Resistance to the Biotrophic Clubroot Agent Plasmodiophora brassicae in Arabidopsis. Plant Cell Physiol. 2015, 56, 2158–2168. [Google Scholar] [PubMed] [Green Version]
  77. Jiang, C.-H.; Fan, Z.-H.; Xie, P.; Guo, J.-H. Bacillus cereus AR156 extracellular polysaccharides served as a novel micro-associated molecular pattern to induced systemic immunity to Pst DC3000 in Arabidopsis. Front. Microbiol. 2016, 7, 977. [Google Scholar] [CrossRef] [PubMed] [Green Version]
  78. Silva, M.S.; Arraes, F.B.M.; Campos, M.A.; Grossi-de-Sa, M.; Fernandez, D.; Candido, E.S.; Cardoso, M.H.; Franco, O.L.; Grossi-de-Sa, M.F. Review: Potential biotechnological assets related to plant immunity modulation applicable in engineering disease-resistant crops. Plant Sci. 2018, 270, 72–84. [Google Scholar] [CrossRef] [PubMed]
  79. Remans, T.; Smeets, K.; Opdenakker, K.; Mathijsen, D.; Vangronsveld, J.; Cuypers, A. Normalisation of real-time RT-PCR gene expression measurements in Arabidopsis thaliana exposed to increased metal concentrations. Planta 2008, 227, 1343–1349. [Google Scholar] [CrossRef] [Green Version]
  80. Sokal, R.R.; Rohlf, F.J. Introducción a la Bioestadística; Editorial Reverte, S.A., Ed.; Editorial Reverte: Barcelona, Spain, 1980; p. 362. [Google Scholar]
Figure 1. Phylogenetic tree performed with the 16S rRNA sequences. The evolutionary distances were inferred using the Neighbor-Joining method. The bootstrap consensus tree inferred from 1000 replicates was taken to represent the evolutionary history of the taxa analyzed. Annotation of bacteria included in the tree, were obtained from the NCBI (http://0-www-ncbi-nlm-nih-gov.brum.beds.ac.uk/). The number in brackets indicates number of species within each phylogenetic group.
Plants 09 01731 g001
Figure 2. Differential gene expression (seedlings inoculated with N 5.12 (Pseudomonas putida) vs negative control) at 6 (n = 16), 12 (n = 16) and 24 (n = 16) hapc; (A) NPR1, ICS, PR1, and PR2 genes (as SA signaling pathway markers) and (B) PDF1, LOX2, MYC2, and PR3 (as JA/ET signaling pathway markers). Asterisks represent statistically significant differences (p < 0.05) with respect to negative control (differential expression of 1).
Plants 09 01731 g002
Figure 3. Differential gene expression (seedlings inoculated with N 8.17 (Stenotrophomonas maltophilia) vs negative control) at 6 (n = 16), 12 (n = 16), and 24 (n = 16) hapc; (A) NPR1, ICS, PR1, and PR2 genes (as SA signaling pathway markers) and (B) PDF1, LOX2, MYC2, and PR3 (as JA/ET signaling pathway markers). Asterisks represent statistically significant differences (p < 0.05) with respect to negative control (differential expression of 1).
Plants 09 01731 g003
Figure 4. Differential gene expression (seedlings inoculated with N 12.34 (Serratia rubidaea) vs negative control) at 6 (n = 16), 12 (n = 16), and 24 (n = 16) hapc; (A) NPR1, ICS, PR1, and PR2 genes (as SA signaling pathway markers) and (B) PDF1, LOX2, MYC2, and PR3 (as JA/ET signaling pathway markers). Asterisks represent statistically significant differences (p < 0.05) with respect to negative control (differential expression of 1).
Plants 09 01731 g004
Figure 5. Differential gene expression (seedlings inoculated with N 21.24 (Pseudomonas fluorescens) vs negative control) at 6 (n = 16), 12 (n = 16) and 24 (n = 16) hapc; (A) NPR1, ICS, PR1, and PR2 genes (as SA signaling pathway markers) and (B) PDF1, LOX2, MYC2, and PR3 (as JA/ET signaling pathway markers). Asterisks represent statistically significant differences (p < 0.05) with respect to negative control (differential expression of 1).
Plants 09 01731 g005
Figure 6. Differential gene expression (seedlings inoculated with N 4.1 (Bacillus cereus) vs negative control) at 6 (n = 16), 12 (n = 16) and 24 (n = 16) hapc; (A) NPR1, ICS, PR1, and PR2 genes (as SA signaling pathway markers) and (B) PDF1, LOX2, MYC2, and PR3 (as JA/ET signaling pathway markers). Asterisks represent statistically significant differences (p < 0.05) with respect to negative control (differential expression of 1).
Plants 09 01731 g006
Figure 7. Differential gene expression in plants under the following treatments: (A) N 12.34 elicitors from the n-hexane fraction; (B) N 12.34 elicitors from the ethyl-acetate fraction; (C) N 4.1 elicitors from the n-hexane fraction; and (D) N 4.1 elicitors from the ethyl-acetate fraction vs negative control, at 6 (n = 16) and 12 (n = 16) hapc in N 12.34 (A,B), and at 12 (n = 16) and 24 (n = 16) hapc in N 4.1 (C,D). NPR1 and PR2 genes as markers of the SA signaling pathway and PDF1 as marker of the JA/ET signaling pathway in N 12.34; NPR1 as marker of the SA signaling pathway, and PDF1 and PR3 as markers of the JA/ET signaling pathway in N 4.1. Asterisks represent statistically significant differences (p < 0.05) within each sampling time. Genes and sampling times were chosen based on results obtained by bacterial strains (Figure 4 and Figure 6).
Plants 09 01731 g007
Figure 8. Induced systemic resistance (ISR) experiments represented as a timeline. The black continuous line represents the part of the experimental design common to all ISR experiments; the black dashed line represents the last part of ISR experiments to assess protection against the pathogen (first and third experiments) and the grey continuous line represents the last part of ISR experiments to carry out differential gene expression analyses by qPCR (second and fourth experiments).
Plants 09 01731 g008
Table 1. Percentage of bacteria within each genera or species (in Gram-positive group), positive for biochemical traits.
Gram-Negative Group
Biochemical TraitsSerratiaEnterobacterPantoeaErwiniaCronobacterAcinetobacterPseudomonasStenotrophomonas
Indole acetic acid (IAA) production0.0037.50.000.000.000.000.000.00
Siderophores production100.0087.5100.00100.00100.0083.33100.00100.00
Phosphate solubilization0.0075.0045.4550.000.00100.0091.670.00
Chitinases production0.000.000.000.000,000.002.08100.00
Siderophores production and phosphate solubilization0.0062.5045.4550.000.0083.3385.420.00
Siderophores and chitinases production0.000.000.000.000.000.002.08100.00
Siderophores and IAA production and phosphate solubilization0.0025.000.000.000.000.000.000.00
Gram-Positive Group
Biochemical TraitsBacillus cereusBacillus pumillusBacillus subtilisBrevibacterium sp.Bacillus endophyticusBacillus megaterium
IAA production0.000.000.000.000.000.00
Siderophores production100.00100.00100.00100.00100.00100.00
Phosphate solubilization23.080.000.0011.760.0036.84
Chitinases production46.150.0020.000.000.000.00
Siderophores production and phosphate solubilization23.080.000.0011.760.0036.84
Siderophores and chitinases production15.380.0020.000.000.000.00
Siderophores and chitinases production and phosphate solubilization7.690.000.000.000.000.00
Biochemical traits are indole acetic acid (IAA) production, siderophores production, phosphate solubilization, chitinases production and the combination of these traits.
Table 2. Twenty-five selected strains and its biochemical traits.
Biochemical Traits
Bacterial StrainIAA ProductionSiderophores ProductionChitinases ProductionPhosphate Solubilization
GRAM−N 5.12Pseudomonas putida + +
N 8.17Stenotrophomonas maltophilia ++
N 8.22Stenotrophomonas sp. ++
N 9.11Pseudomonas reinekei + +
N 10.6Pseudomonas putida + +
N 10.7Serratia odorifera +
N 10.21Pseudomonas putida + +
N 12.34Serratia rubidaea +
N 15.23Pseudomonas brassicacearum + +
N 16.3Pantoea sp. + +
N 16.15Enterobacter sp.+ +
N 16.23Pantoea agglomerans + +
N 16.24Enterobacter sp.++ +
N 18.10Pseudomonas fragi + +
N 21.24Pseudomonas fluorescens + +
GRAM+N 4.1Bacillus cereus ++
N 5.20Bacillus cereus +++
N 8.10Bacillus sp. + +
N 11.5Brevibacterium sp. + +
N 11.14Bacillus endophyticus +
N 11.20Bacillus atrophaeus ++
N 11.22Bacillus megaterium + +
N 11.36Bacillus megaterium + +
N 11.40Bacillus megaterium + +
N 20.15Bacillus simplex + +
Biochemical traits are indole acetic acid (IAA) production, siderophores production, phosphate solubilization and chitinases production. A positive biochemical trait of each bacteria is indicated by a + symbol.
Table 3. Percentage of protection (%) induced in A. thaliana seedlings inoculated with chosen strains against DC3000.
Treatment% of Protection
ControlsNegative ControlNutrient Broth0
Positive ControlBenzothiadiazole (BTH)54.21 ± 4.03 *
GRAM− StrainsN 5.12Pseudomonas putida57.69 ± 1.76 *
N 8.17Stenotrophomonas maltophilia64.87 ± 1.79 *
N 8.22Stenotrophomonas sp.0
N 9.11
N 10.6
Pseudomonas reinekei
Pseudomonas putida
51.44 ± 6.88 *
0
N 10.7
N 10.21
Serratia odorífera
Pseudomonas putida
33.76 ± 3.22 *
0
N 12.34Serratia rubidaea56.64 ± 2.15 *
N 15.23Pseudomonas brassicacearum0
N 16.3Pantoea sp.14.91 ± 2.45 *
N 16.15Enterobacter sp.24.18 ± 1.96 *
N 16.23Pantoea agglomerans21.21 ± 7.32 *
N 16.24Enterobacter sp.6.93 ± 2.31
N 18.10Pseudomonas fragi0
N 21.24Pseudomonas fluorescens82.08 ± 2.46 *
GRAM+ StrainsN 4.1Bacillus cereus69.45 ± 0.38 *
N 5.20Bacillus cereus49.75 ± 0.82 *
N 8.10Bacillus sp.22.93 ± 2.93 *
N 11.5Brevibacterium sp.29.82 ± 1.82 *
N 11.14Bacillus endophyticus0
N 11.20Bacillus atrophaeus42.72 ± 3.51 *
N 11.22Bacillus megaterium0
N 11.36Bacillus megaterium0
N 11.40Bacillus megaterium23.98 ± 0.18 *
N 20.15Bacillus simplex30.83 ± 4.92 *
The percentage of protection was calculated based on the number of leaves with disease symptoms to the total of leaves (n = 12 seedlings per replicate). Data were relativized to negative control (seedlings inoculated only with nutrient broth and pathogen challenged), which was considered as 0% protection. A positive control (BTH) was also used [28]. Strains in bold are those whose percentage of protection against the pathogen P. syringae DC3000 exceeded that of the positive control and therefore, those that were selected for further analyses. Asterisks represent statistically significant differences (p < 0.05) with regard to negative control.
Table 4. Percentage of protection (%) induced in A. thaliana seedlings inoculated with the elicitor fractions against the pathogen P. syringae DC3000.
Treatment% of Protection
ControlsNegative control0
Positive control (BTH)52.09 ± 1.75 *
N 12.34n-Hexane61.26 ± 2.23 *
Ethyl acetate54.64 ± 1.48 *
n-Butanol35.42 ± 2.77 *
N 4.1n-Hexane68.11 ± 0.76 *
Ethyl acetate67.30 ± 3.76 *
n-Butanol52.31 ± 1.91 *
A. thaliana seedlings were elicited with the n-hexane, ethyl acetate and n-butanol fractions extracted from strains N 12.34 and N 4.1. Percentages were estimated according to the number of leaves with pathogen infection symptoms with respect to the total of leaves (n = 16 seedlings per replicate). Negative control was considered as 0% of protection and then data were relativized with respect to it. A positive control (BTH) was also used [28]. Fractions in bold are those whose percentage of protection against the pathogen exceeded that of the positive control and therefore, those that were selected for further analyses. Asterisks indicate statistically significant differences (p < 0.05) with respect to negative control.
Table 5. Forward and reverse primers used in qPCR analysis.
Forward PrimerReverse Primer
AtNPR15′-TATTGTCAARTCTRATGTAGAT5′-TATTGTCAARTCTRATGTAGAT
AtPR15′-AGTTGTTTGGAGAAAGTCAG5′-GTTCACATAATTCCCACGA
AtICS5′-GCAAGAATCATGTTCCTACC5′AATTATCCTGCTGTTACGAG
AtPdf15′-TTGTTCTCTTTGCTGCTTTCGA5′-TTGGCTTCTCGCACAACTTCT
AtLOX25′-ACTTGCTCGTCCGGTAATTGG5′-GTACGGCCTTGCCTGTGAATG
AtMYC25′GATGAGGAGGTGACGGATACGGAA5′-CGCTTTACCAGCTAATCCCGCA
AtPR25′-TCGTCTCGATTATGCTCTCTTC5′-GCAGAATACACAGCATCCAAAA
AtPR35′-AAATCAACCTAGCAGGCCACT5′-GAGGGAGAGGAACACCTTGACT
Sand5′ -CTGTCTTCTCATCTCTTGTC5′-TCTTGCAATATGGTTCCTG
At = A. thaliana.
Publisher’s Note: MDPI stays neutral with regard to jurisdictional claims in published maps and institutional affiliations.

