3.1. Gel Permeation Chromatography (GPC)
In order to investigate the influence of the successive recycling process on the molecular structure of the polymers, GPC analysis was performed and the weight average molecular weight (
Mw), the number average of molecular weight (
Mn), and the molecular weight distribution (
Mw/
Mn) are all reported in
Table 3. It can be seen that for all polymers with a thermo-mechanical history of the successive recycling process,
Mw and
Mn values decreased. These observations indicate that chain scission occurs especially in long chains, as a result of high shear and high temperature during the extrusion process. Scaffaro et al. reported similar observations in PLA with increasing number of recycling processes [
3]. The higher decline in
Mw was observed in PHBV by 82% reduction, followed by PLA by 78%, suggesting the structure of PHBV and PLA are more susceptible to high shear and temperature in comparison with Bioflex and Solanyl. Indeed, chain scission mainly occurs in polymers with higher
Mw (PHBV and PLA) to form polymer chains of medium size. However, Bioflex and Solanyl with relatively lower
Mw as compared to PLA and PHBV exhibited a negligible reduction in
Mw (5% and 2%) after five reprocessing cycles. PLA and PHBV experienced a noticeable reduction in the molecular weight distribution (
Mw/
Mn) by about 15% and 31%, respectively (see
Table 3), indicating that recycled PLA and PHBV have a more homogenous composition than virgin polymers. An increase in molecular weight distribution indicates that recycled Bioflex and Solanyl are more polydisperse than the corresponding virgin polymers. Martin et al. reported that polymeric materials consisting of a blend of two or more polymers possess a wider range of molecular weight after the recycling process [
4].
As expected, one can observe that PLA and PHBV exhibited higher values for the average number of random chain scission per unit mass (
nt) after five times of reprocessing cycles (
Table 3). In fact, higher values for
nt indicates that the polymer chains are more sensitive to thermomechanical degradation. On the contrary, the lower values for
nt in Bioflex and Solanyl can be probably attributed to the lower rate of polymer chain scissoring due to the cross-linking phenomenon which occurs in polymers above the melting temperature [
5]. Moreover, the most probable reaction involved in the thermal degradation of polymers with a considerable reduction in molecular weight is random scission occurring as a result of high temperature and high shear force.
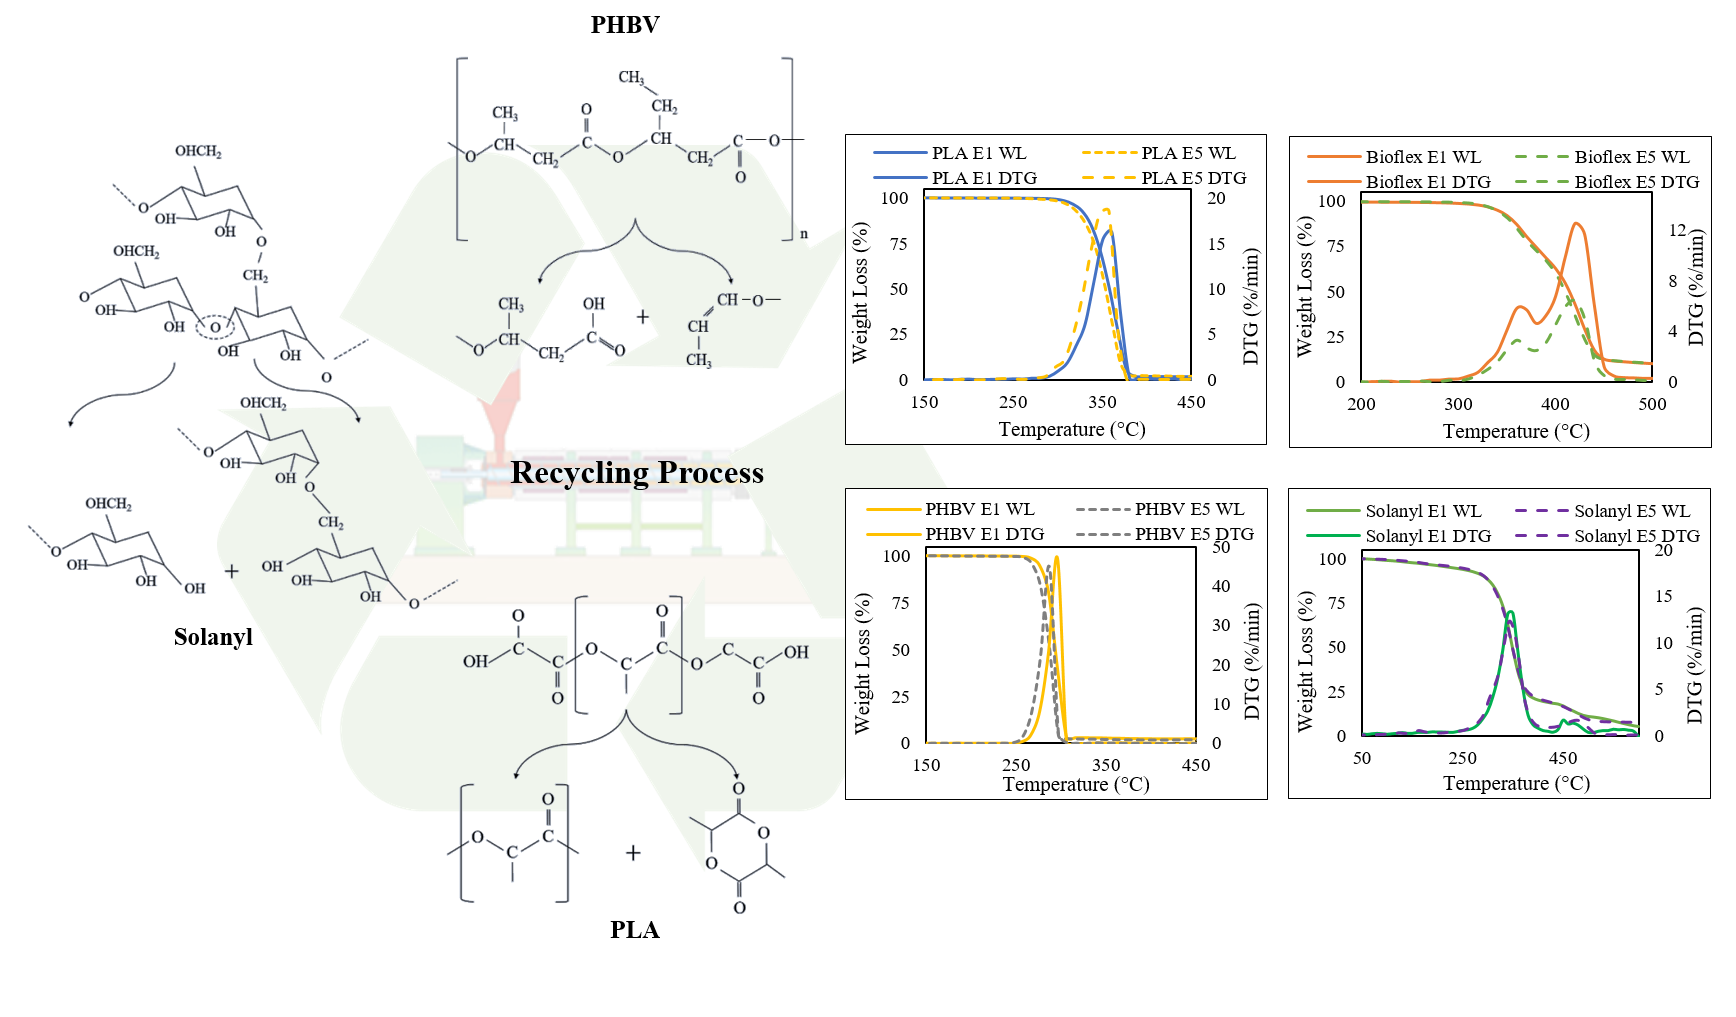
In PHBV polymer, the significant reduction in molecular weight of the polymer can be attributed to the unzipping reaction in PHBV through cis-elimination mechanism (Mclafferty arrangement) just above its melting temperature [
6]. The formation of a variety of oligomers after degradation is illustrated in
Figure 1 [
7].
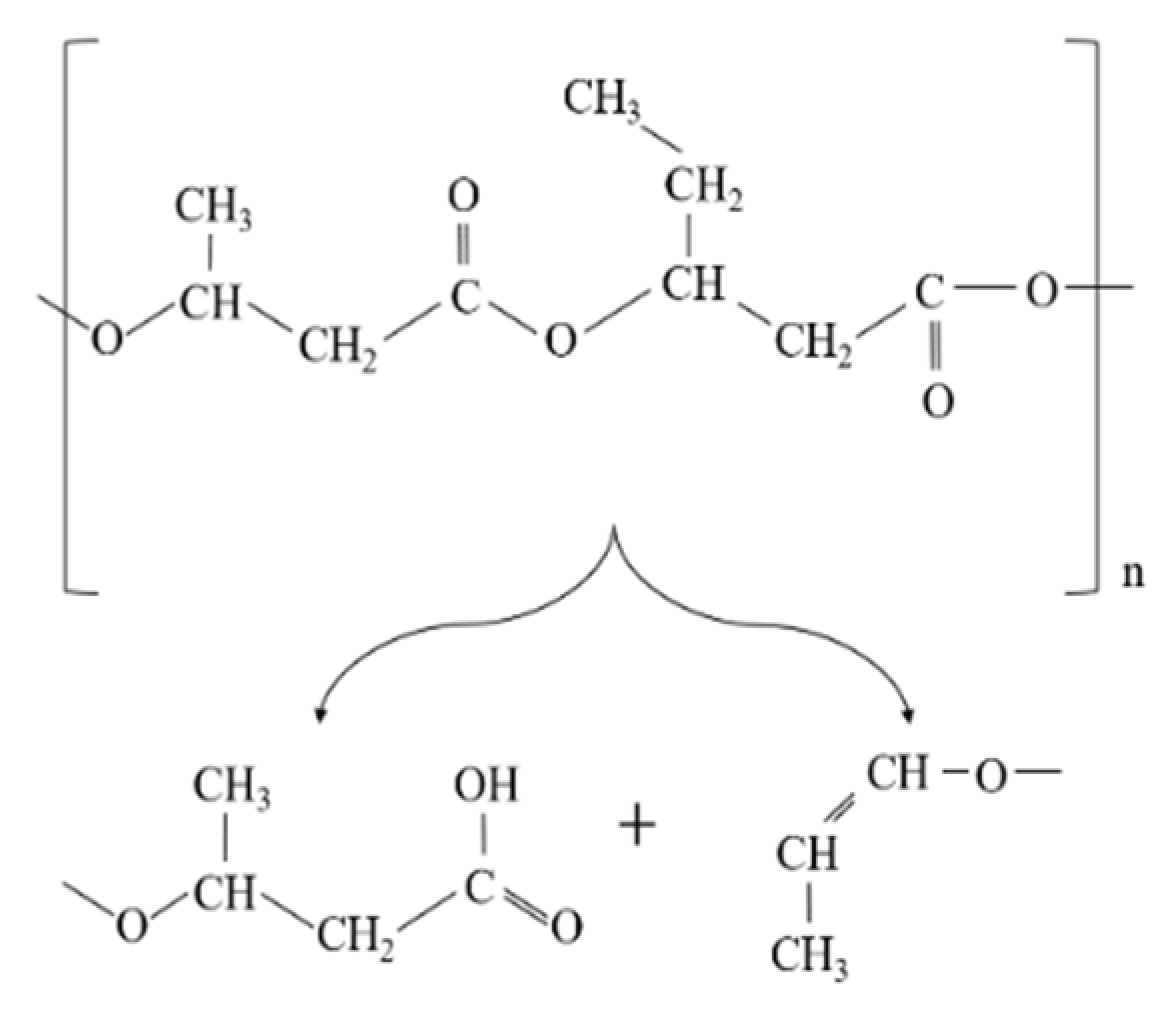
Similarly, the degradation of PLA is because the generation of acidic molecules act as catalyst to accelerate the degradation. The considerable reduction in the molecular weight of PLA was more likely associated with the thermal degradation caused by polymer chain scissions into linear and cyclic oligomers [
8] (
Figure 2).
In addition, changes in the molecular weight of PLA can be linked to the cleavage of the long chains to shorter ones due to hydrolysis and intermolecular transesterification. The small value of the activation energy for the thermal degradation of PLA (21–23 kJ/mol) in comparison to other polymers indicates that PLA is highly sensitive to thermal treatment [
9].
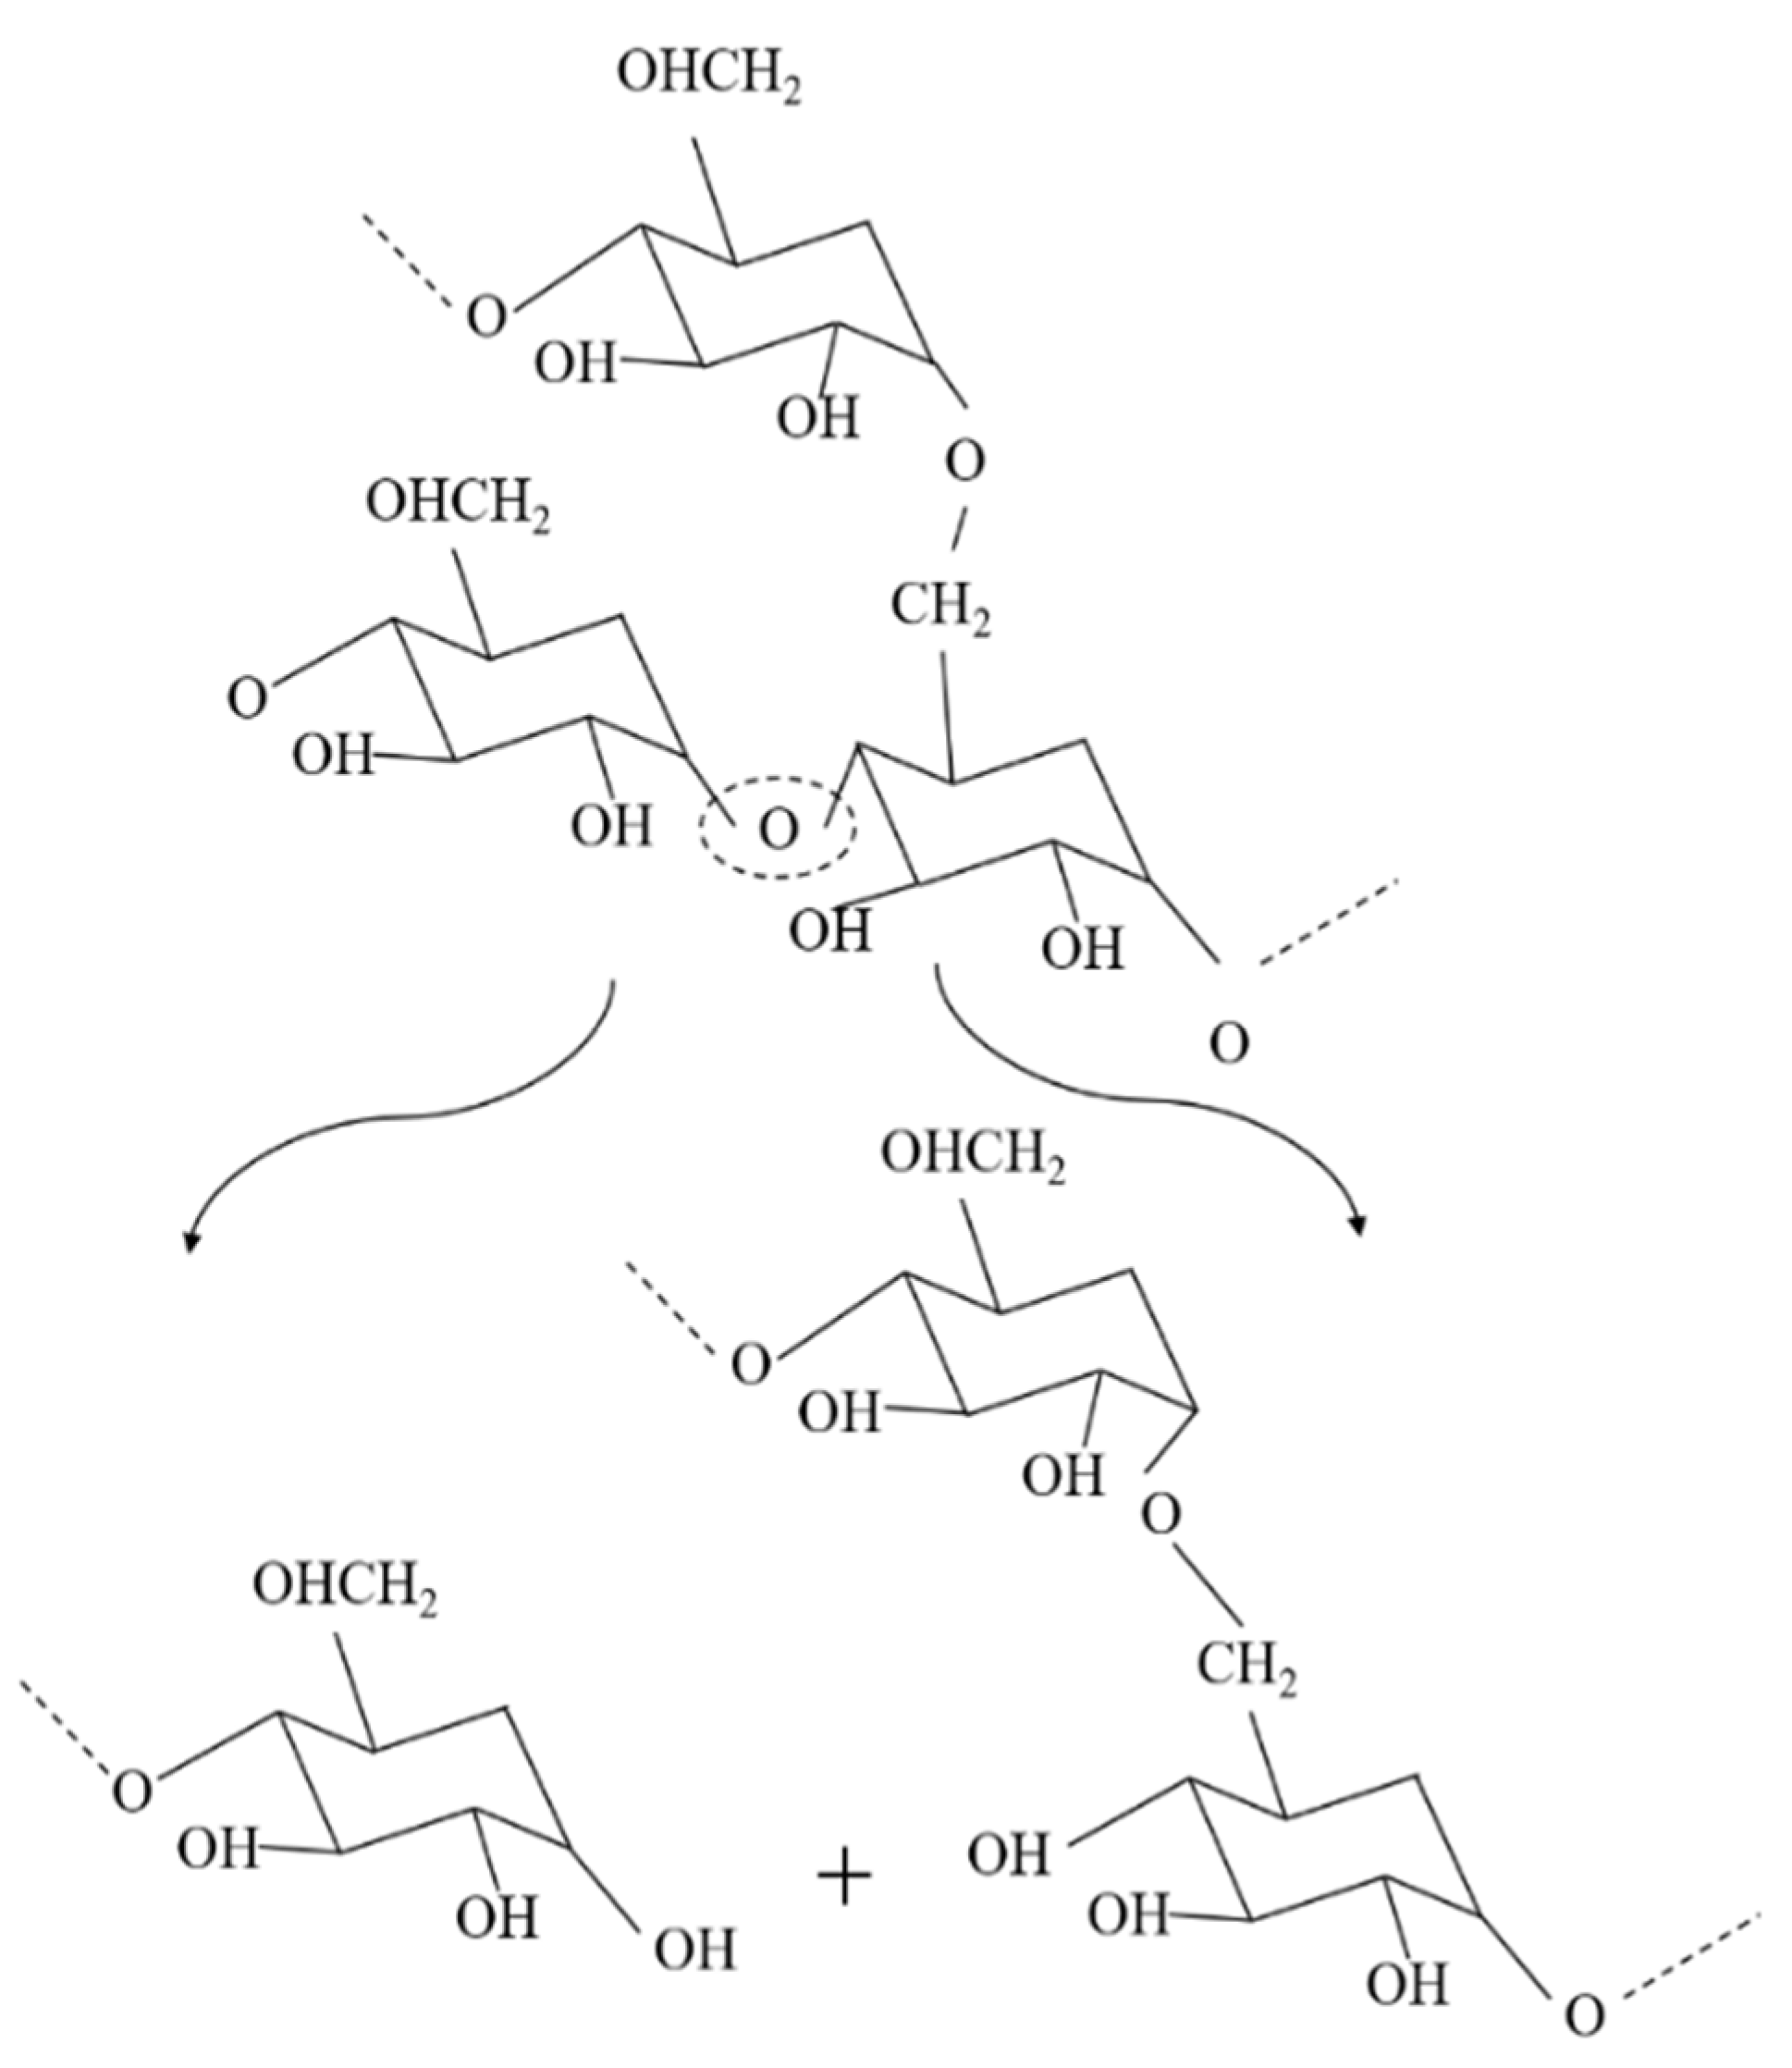
The molecular weight of the recycled Solanyl exhibited a limited reduction by 2% after five times of the recycling process. This observation can probably be attributed to either a less sensitive structure to the recycling process or the crosslinking phenomenon which occurs in recycled polymers as a result of subsequent recombination in the molecular chain cleavage as evidenced by Kale et al. They claimed the formation of new crosslinking in the structure of polymers under high temperature [
10]. Solanyl is a starch-based polymer, having a similar chemical structure to starch; the probable thermal decomposition for Solanyl could be as illustrated in
Figure 3. The starch-based polymers have a complex thermal degradation [
11] and the chemical structure of the polymer ruptures to release the constituent molecules.
The complex nature of starch contains amylose and amylopectin homopolymer blends. Starch is reported to undergo thermal reactions around 300 °C [
11] anda lower processing temperature was used in this study (
Table 2). It has been reported that degradation of these components leads to the formation of interpenetrating structures or helical structures which crystallize. Generally, starch thermal degradation leads to the formation of hydroxyl, ether links, as well as de-hydration of hydroxyl groups present on the glucose ring which we did not observe in FTIR results (not included in this study).
In Bioflex, which is a PLA-starch blend, 5% reduction in the Mw was observed. To improve the compatibility, interfacial adhesion, and enhance the dispersion between the two polymers, glycerol, formamide, and water are used as plasticizers. In the presence of heat and moisture, the strong intermolecular and intramolecular hydrogen bonding between polymers and plasticizers weakens which results in degradation of polymer. In Bioflex, degradation primarily occurs through the chain scission reaction of PLA. Bioflex is a USDA certified bio-based product. It is a polymer blend with PLA as the main component and it is certified as compostable material according to European standard (EN 13432). There is no information regarding its chemical structure, however, the molecular weight, flow rate, mechanical properties, and thermal properties of this polymer are reported in this work.
3.6. Effect of Recycling on Mechanical Properties
The mechanical properties of virgin and recycled polymers were studied through flexural and impact tests and the results are summarized in
Table 6. PLA, Bioflex, and PHBV exhibited a slight reduction of 3.5%, 8.7%, and 1.7% in flexural strength on increasing the number of reprocessing cycles. These observations can probably be attributed to the lower molecular weight in the recycled polymers because of the deterioration of the polymer chains during successive extrusion cycles. In general, the mechanical properties of biopolymers are strongly dependent on
Mw. Therefore, any changes in the polymer chain as a result of degradation due to high temperature and shear in the extrusion process are likely to influence the mechanical properties.
Flexural strength was significantly lower for recycled PLA and PHBV as compared to their corresponding virgin counterparts, however, no significant change was observed in Bioflex and Solanyl after the reprocessing cycle, which is more likely due to the reduction trend in the molecular weight in the recycled polymers (see
Table 3).
The flexural modulus for all polymers shows a decreasing trend as the number of recycling processes was increased. A higher decline in flexural modulus was observed in PHBV E5 as compared to PHBV E1 by 11% followed by PLA by 9% decrease. These observations can be attributed to the fact that the recycling procedure includes polymer crushing and melting, which leads to polymer chain degradation. In addition, thermal degradation in the melting process contributes to the failing of intermolecular bonding between the polymer chains and the flexural strength in polymers tends to decrease as the number of recycling processes increased [
34,
35].
The impact strength of the polymers is shown in
Table 6. It can be seen that all recycled polymers exhibit lower impact strength as compared with their corresponding virgin polymer. These results are consistent with another work which reported lower impact strength for PBT/PC/ABS after five times of the reprocessing cycle [
36]. This may be explained by the lower molecular weight of recycled polymers due to the degradation phenomenon caused by heating and shear stress through the recycling process. PHBV with the higher reduction in molecular weight (
Table 3) showed more reduction in impact strength after five times of reprocessing cycles (30%). Although Solanyl exhibited lower impact strength as compared with other polymers, the results showed that the effect of the recycling process on the impact strength was not significant and the impact strength remained constant after the recycling process.

 and
and 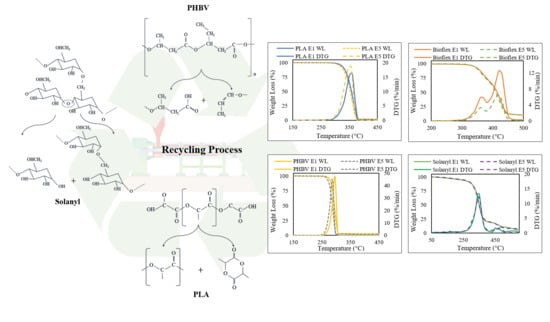


