A Modified Aging Kinetics Model for Aging Condition Prediction of Transformer Polymer Insulation by Employing the Frequency Domain Spectroscopy


Abstract
:
1. Introduction
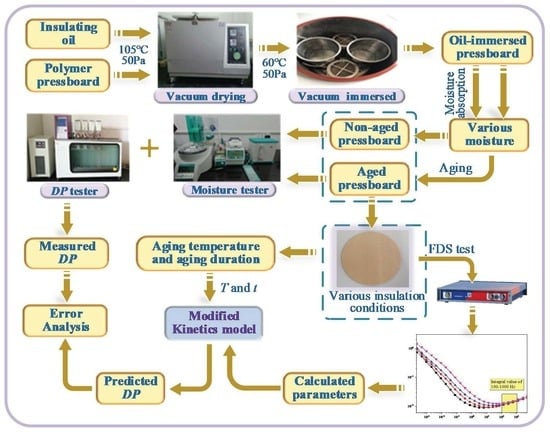
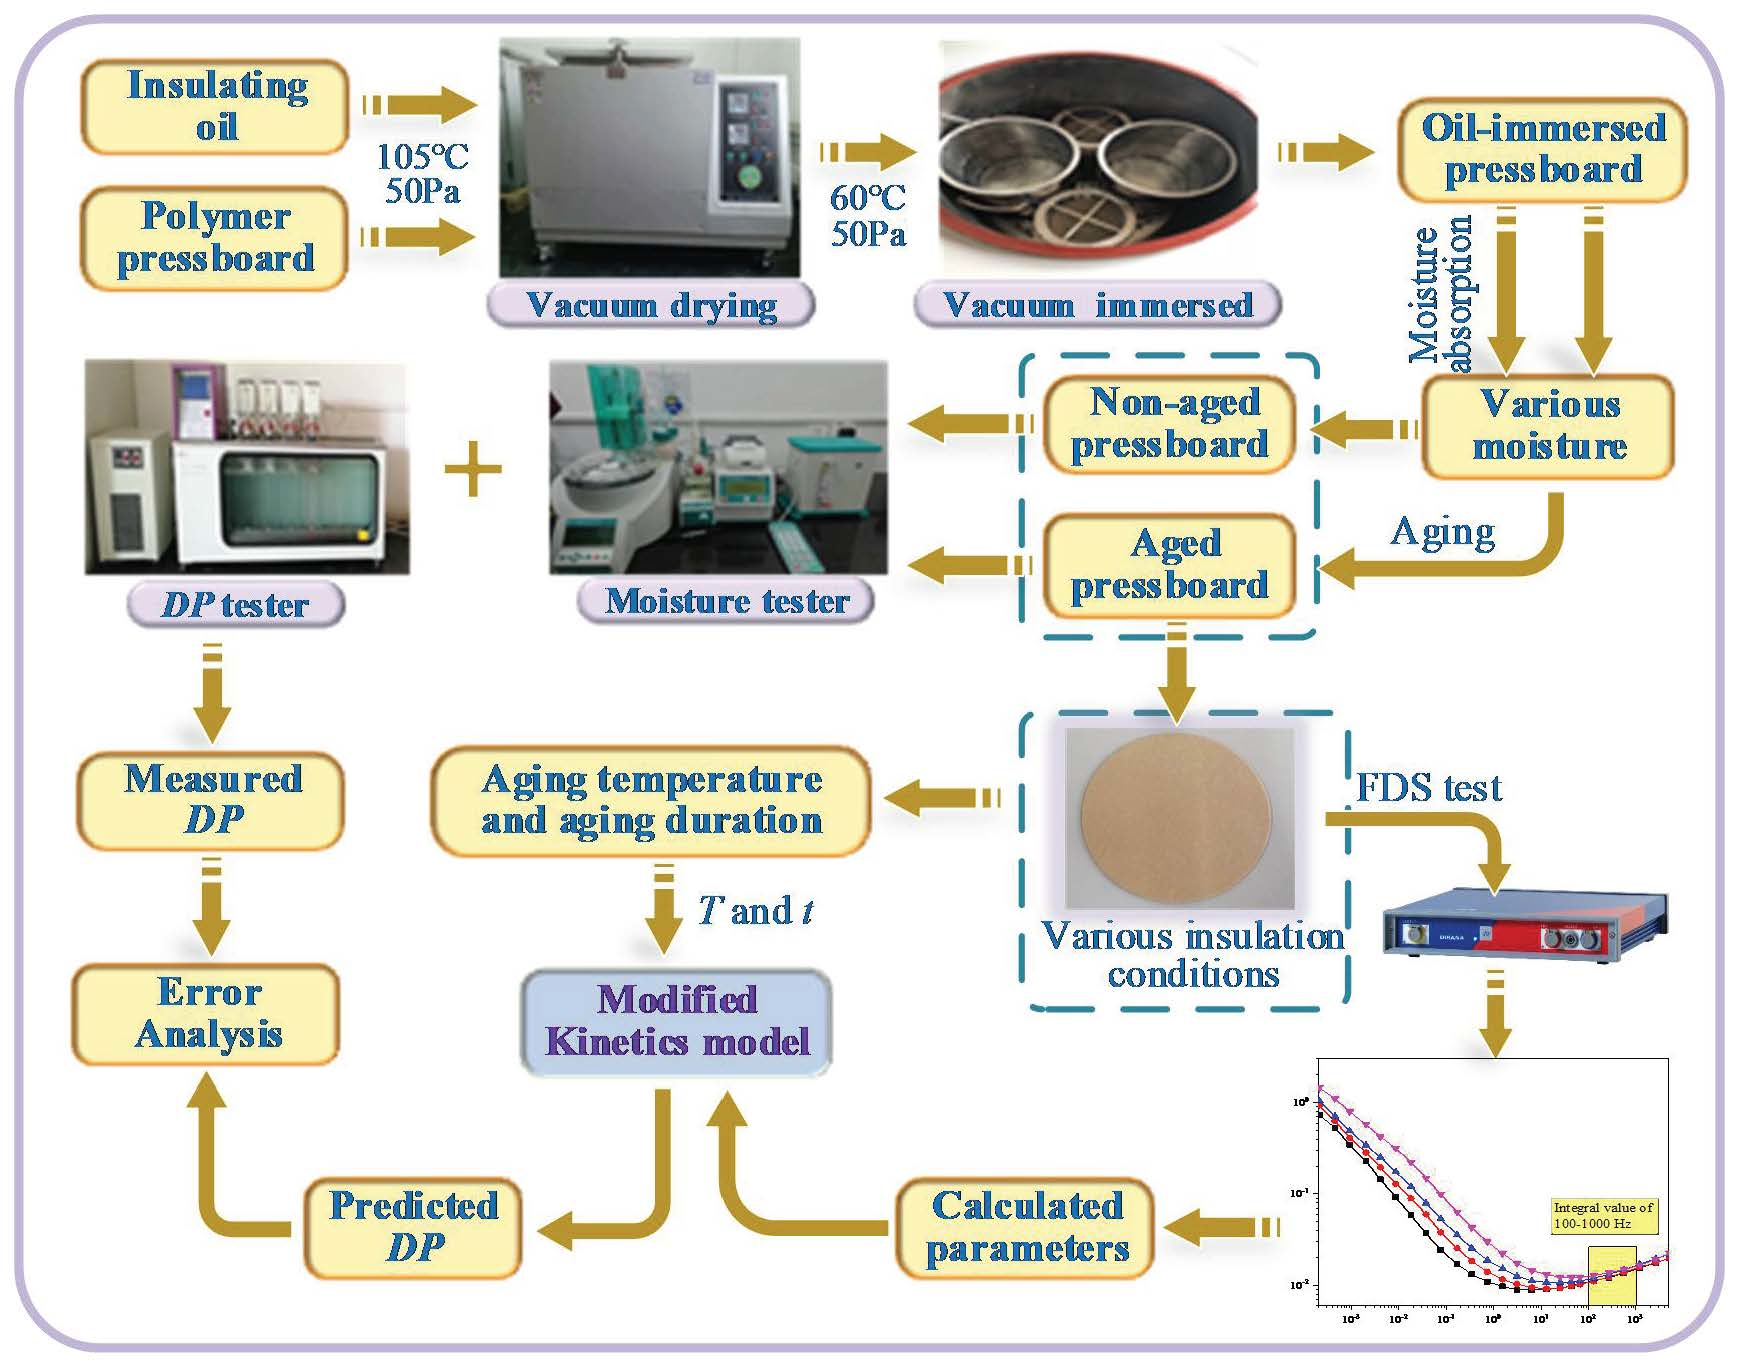
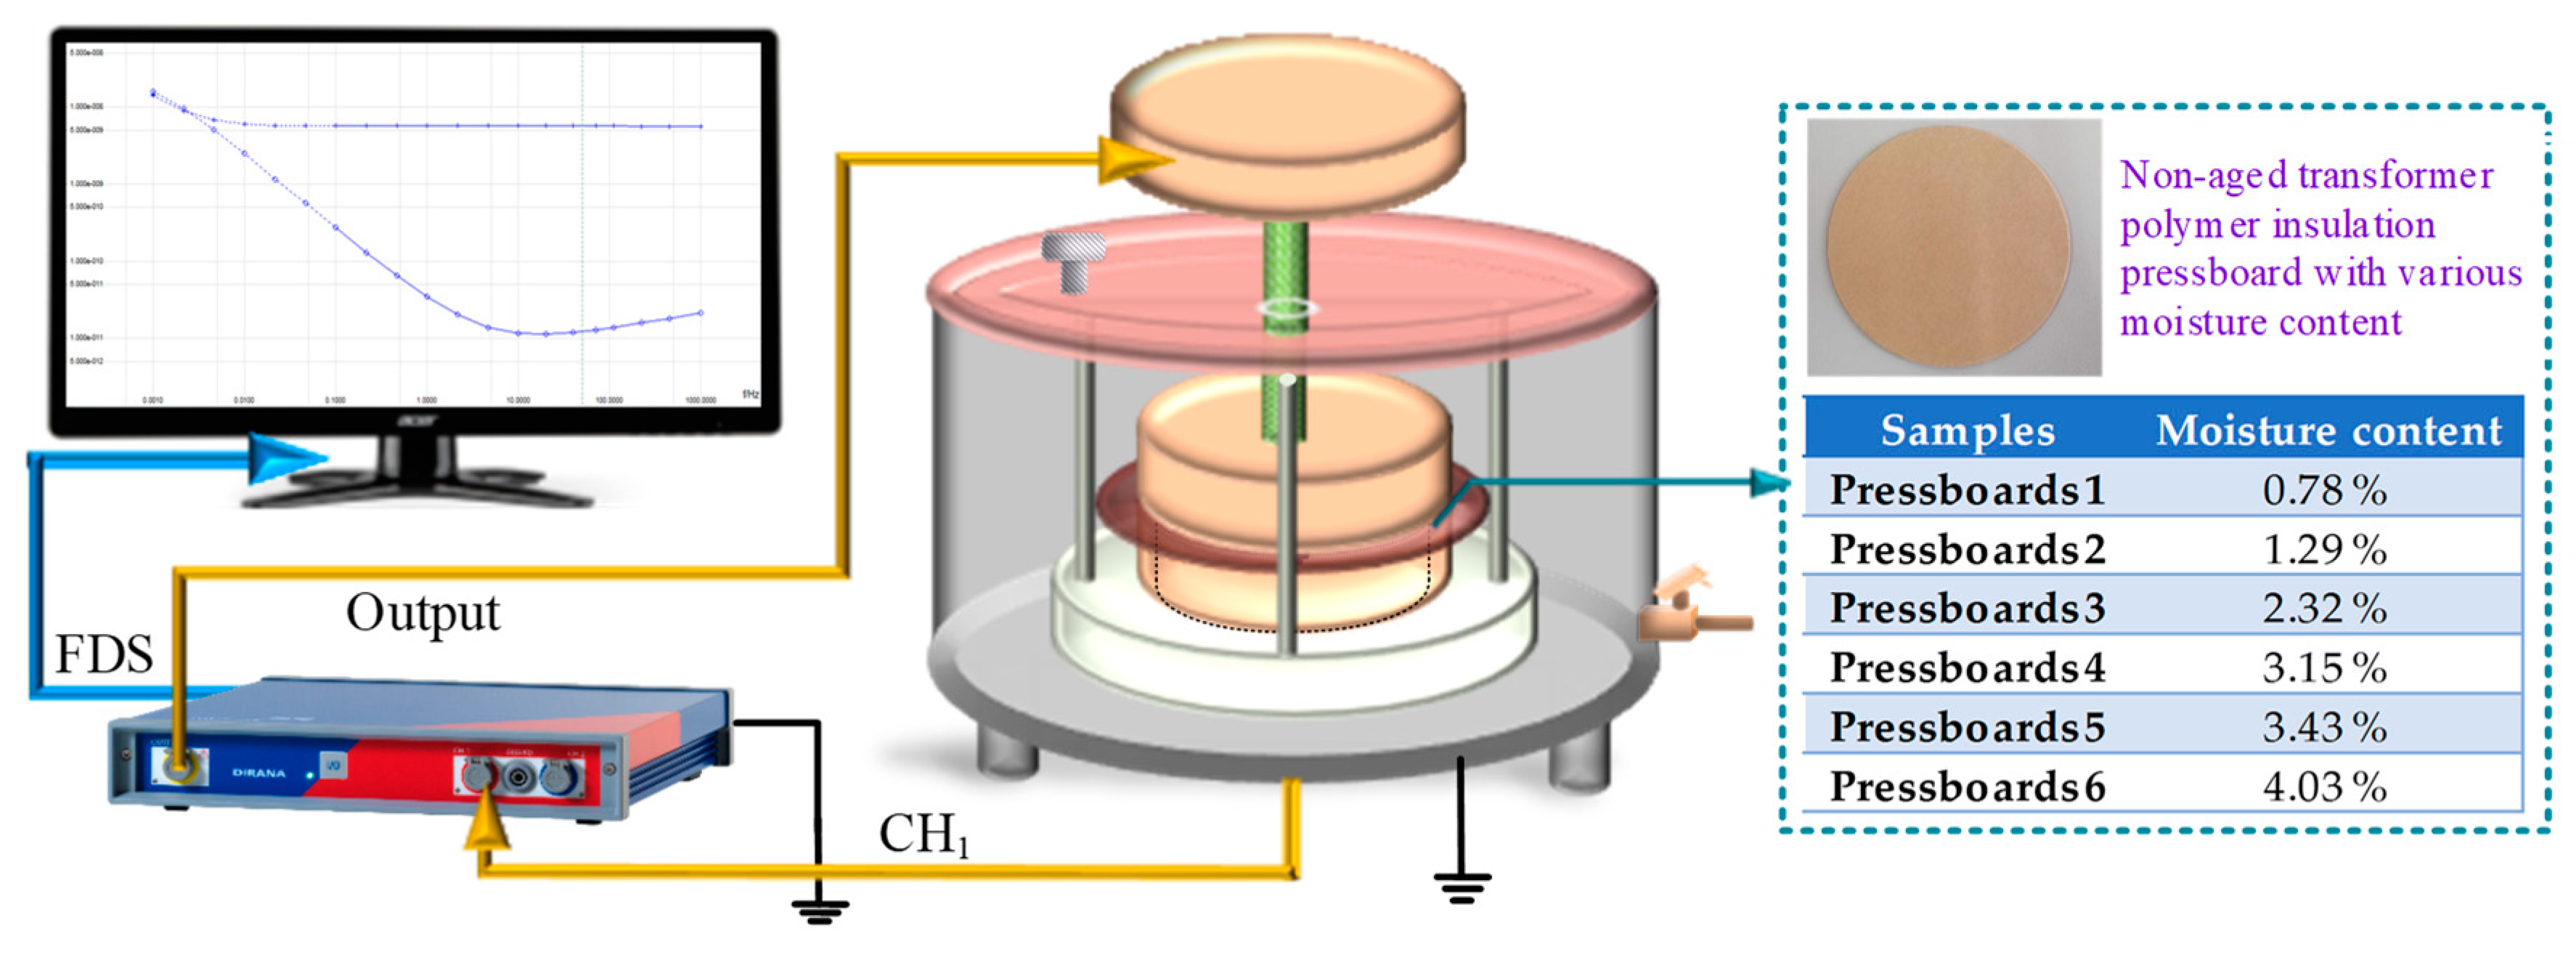
2. Sample Construction
3. The Establishment of the Traditional Aging Kinetics Model of Transformer Polymer Insulation.
3.1. The Derivation of the Traditional Aging Kinetics Model
3.2. The Aging Kinetics Model for Aging Condition Analysis
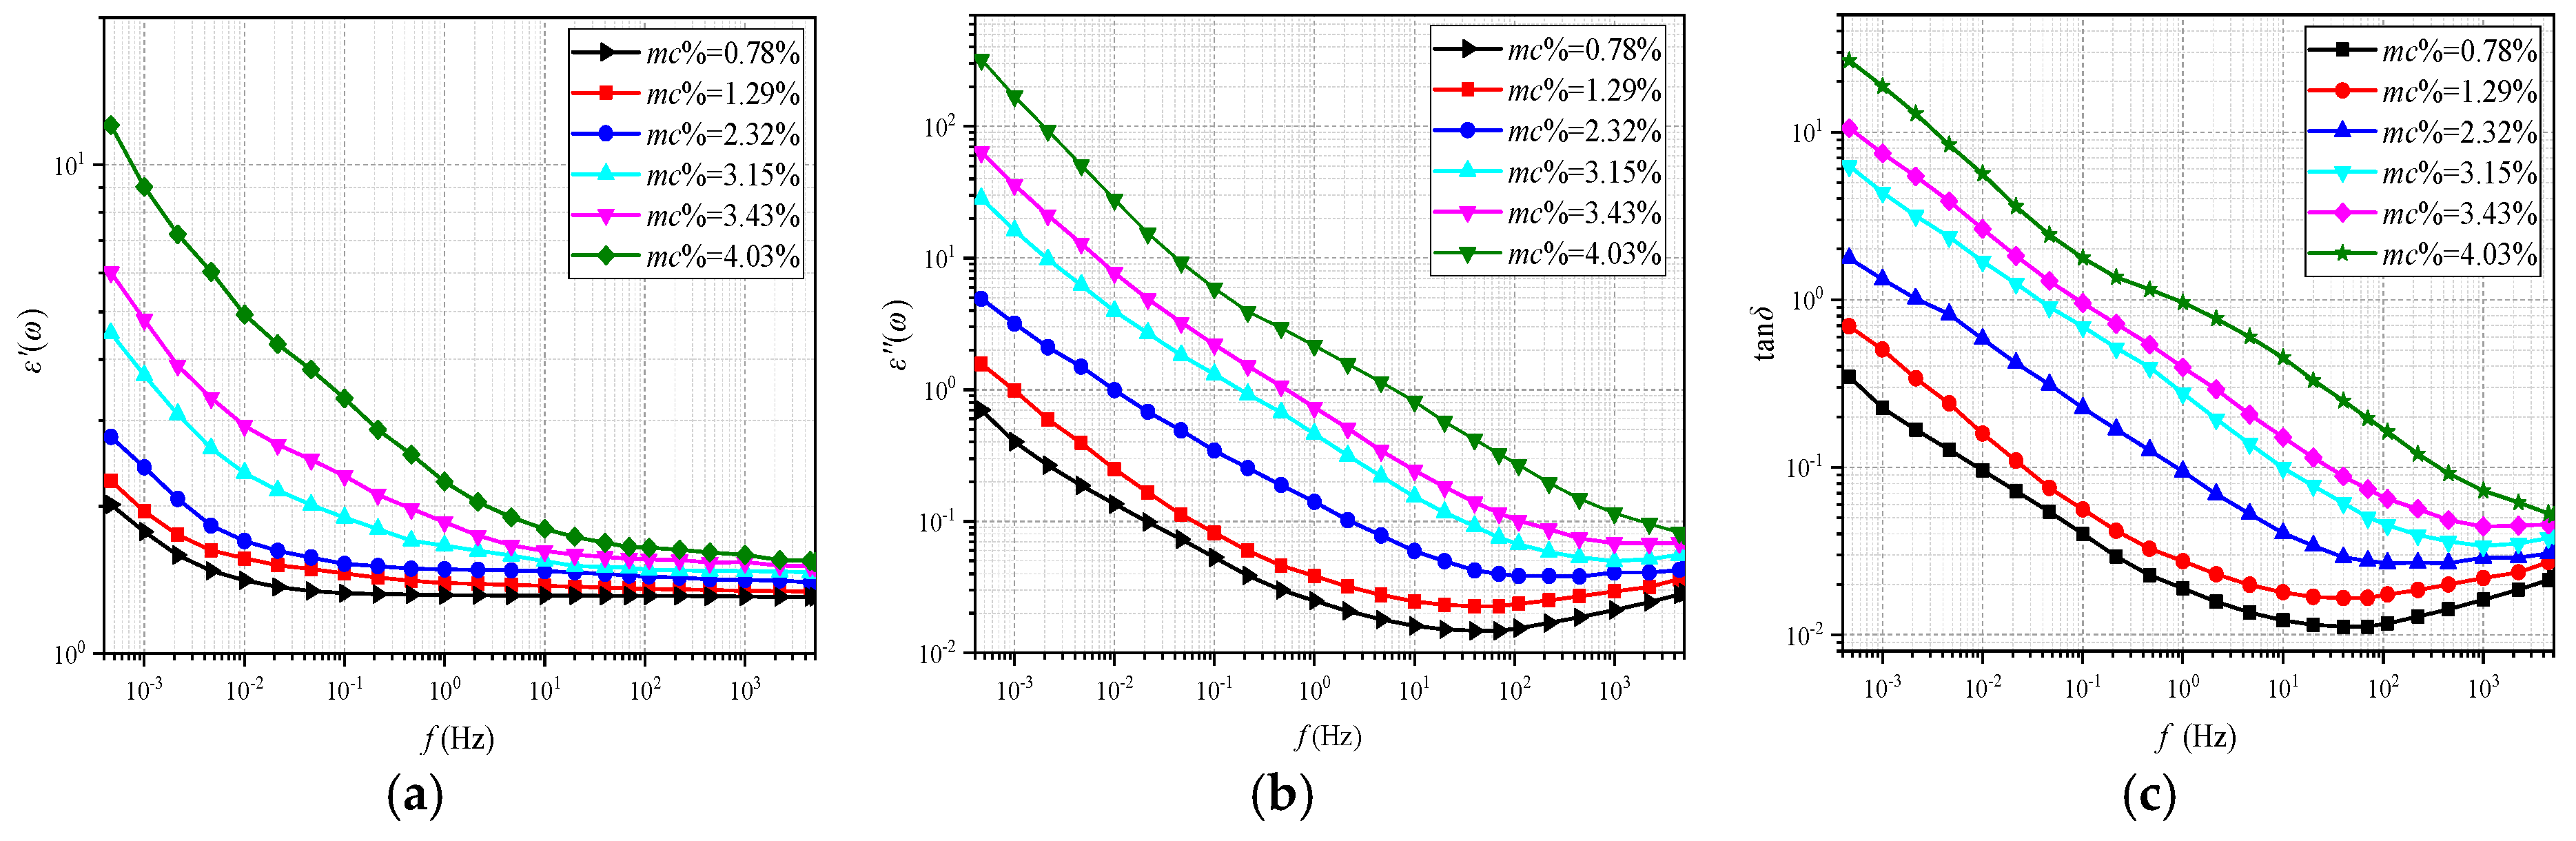
4. The Improved Aging Kinetics Model by Employing Frequency Dielectric Spectrum
5. A Modified Aging Kinetics Model for Aging Condition Prediction Including the Temperature Effect
6. Feasibility Investigation of the Proposed Modified Aging Kinetics Model
7. Conclusions
Author Contributions
Funding
Conflicts of Interest
References
- Feng, D.W.; Yang, L.J.; Zhou, L.W.; Liao, R.J.; Chen, X. Effect of Oil–Paper–Pressboard Mass Ratio on Furfural Content in Transformer Oil. IEEE Trans. Dielectr. Electr. Insul. 2019, 26, 1289–1296. [Google Scholar] [CrossRef]
- Feng, D.W.; Yang, L.J.; Liao, R.J.; Zhou, L.W. Effect of Moisture Content on the Production and Partitioning of Furfural in Oil–Paper Insulation. IEEE Trans. Dielectr. Electr. Insul. 2018, 25, 2389–2397. [Google Scholar] [CrossRef]
- Zhang, Y.Y.; Li, X.; Zheng, H.B.; Yao, H.L.; Liu, J.F.; Zhang, C.H.; Peng, H.B.; Jiao, J. A Fault Diagnosis Model of Power Transformers Based on Dissolved Gas Analysis Features Selection and Improved Krill Herd Algorithm Optimized Support Vector Machine. IEEE Access 2019, 7, 102803–102811. [Google Scholar] [CrossRef]
- International Electrotechnical Commission. Amendment 1-Measurement of the Average Viscometric Degree of Polymerization of New and Aged Cellulosic Electrically Insulating Materials; International Electrotechnical Commission: Geneva, Switzerland, 2007. [Google Scholar]
- Koch, M.; Prevost, T. Analysis of Dielectric Response Measurements for Condition Assessment of Oil-Paper Transformer Insulation. IEEE Trans. Dielectr. Electr. Insul. 2012, 19, 1908–1915. [Google Scholar] [CrossRef]
- Liu, J.F.; Fan, X.H.; Zhang, Y.Y.; Zheng, H.B.; Jiao, J. Temperature Correction to Frequency Dielectric Modulus and Activation Energy Prediction of Immersed Cellulose Insulation. IEEE Trans. Dielectr. Electr. Insul. 2019. [Google Scholar] [CrossRef]
- Zhang, Y.Y.; Liu, J.F.; Zheng, H.B.; Wang, K. Feasibility of a universal approach for temperature correction in frequency domain spectroscopy of transformer insulation. IEEE Trans. Dielectr. Electr. Insul. 2018, 25, 1766–1773. [Google Scholar] [CrossRef]
- Liu, J.F.; Fan, X.H.; Zhang, Y.Y.; Zheng, H.B.; Zhu, M.Z. Quantitative evaluation for moisture content of cellulose insulation material in paper/oil system based on frequency dielectric modulus technique. Cellulose 2019. [Google Scholar] [CrossRef]
- Liu, J.F.; Fan, X.H.; Zhang, Y.Y.; Zheng, H.B.; Yao, H.L.; Zhang, C.H.; Zhang, Y.B.; Li, D.J. A Novel Universal Approach for Temperature Correction on Frequency Domain Spectroscopy Curveof Transformer Polymer Insulation. Polymers 2019, 11, 1126. [Google Scholar] [CrossRef] [Green Version]
- Lelekakis, N.; Martin, D.; Wijaya, J. Ageing rate of paper insulation used in power transformers Part 1: Oil/paper system with low oxygen concentration. IEEE Trans. Dielectr. Electr. Insul. 2012, 19, 1999–2008. [Google Scholar] [CrossRef]
- Lelekakis, N.; Martin, D.; Wijaya, J. Ageing rate of paper insulation used in power transformers Part 2: Oil/paper system with medium and high oxygen concentration. IEEE Trans. Dielectr. Electr. Insul. 2012, 19, 2009–2018. [Google Scholar] [CrossRef]
- Emsley, A.M.; Xiao, X.; Heywood, R. Degradation of cellulosic insulation in power transformers. Part 2: Formation of furan products in insulating oil. IEE Proc. Sci. Meas. Technol. 2000, 147, 110–114. [Google Scholar] [CrossRef]
- Jadav, R.B.; Ekanayake, C.; Saha, T.K. Understanding the Impact of Moisture and Ageing of Transformer Insulation on Frequency Domain Spectroscopy. IEEE Trans. Dielectr. Electr. Insul. 2014, 21, 369–379. [Google Scholar] [CrossRef]
- Liao, R.J.; Liu, J.F.; Yang, L.J.; Wang, K.; Hao, J.; Ma, Z.Q.; Gao, J.; Lv, Y.D. Quantitative analysis of insulation condition of oil-paper insulation based on frequency domain spectroscopy. IEEE Trans. Dielectr. Elect. Insul. 2015, 22, 322–334. [Google Scholar] [CrossRef]
- Liu, J.F.; Fan, X.H.; Zhang, Y.Y.; Zhang, C.H. Condition Prediction for Oil-immersed Cellulose Insulation in Field Transformer Using Fitting Fingerprint Database. IEEE Trans. Dielectr. Electr. Insul. 2019. [Google Scholar] [CrossRef]
- Ojha, S.K.; Purkait, P.; Chatterjee, B.; Chakravorti, S. Application of Cole–Cole model to transformer oil-paper insulation considering distributed dielectric relaxation. High Volt. 2019, 4, 72–79. [Google Scholar] [CrossRef]
- Zheng, Y.M.; Wang, Z.J. Study on Broadband Loss Characteristics of Oil-immersed Papers for Fast Transient Modeling of Power Transformer. IEEE Trans. Dielectr. Electr. Insul. 2012, 20, 564–570. [Google Scholar] [CrossRef]
- Morsalin, S.; Phung, B.T. Modeling of dielectric dissipation factor measurement for XLPE cable based on Davidson-Cole model. IEEE Trans. Dielectr. Electr. Insul. 2019, 26, 1018–1026. [Google Scholar] [CrossRef]
- Dissado, L.A.; Hill, R.M. A cluster approach to the structure of imperfect materials and their relaxation spectroscopy Proceedings of the Royal Society A: Mathematical. Phys. Eng. Sci. 1983, 390, 131–180. [Google Scholar] [CrossRef]
- Emsley, A.M. Kinetics and mechanisms of the low-temperature degradation of cellulose. Cellulose 1994, 1, 26–56. [Google Scholar] [CrossRef]
- Emsley, A.M. On the kinetics of degradation of cellulose. Cellulose 1997, 4, 1–5. [Google Scholar] [CrossRef]
- Calvini, P.; Gorassini, A.; Merlani, A.L. On the kinetics of cellulose degradation: Looking beyond the pseudo zero order rate equation. Cellulose 2007, 15, 193–203. [Google Scholar] [CrossRef]
- Calvini, P. The influence of levelling-off degree of polymerization on the kinetics of cellulose degradation. Cellulose 2005, 12, 445–447. [Google Scholar] [CrossRef]
- Ekenstam, A. The behavior of cellulose in mineral acid solutions: Kinetics study of the decomposition of cellulose in acid solutions. BER 1936, 69, 540–553. [Google Scholar]
- Ding, H.Z.; Wang, Z.D. On the degradation evolution equations of cellulose. Cellulose 2008, 15, 205–224. [Google Scholar] [CrossRef]
- Heywood, R.J.; Stevens, G.C.; Ferguson, C.; Emsley, A.M. Life assessment of cable paper using slow thermal ramp methods. Thermochim. Acta 1999, 332, 189–195. [Google Scholar] [CrossRef]
- Verma, H.C.; Baral, A.; Pradhan, A.K.; Chakravorti, S. A Method to Estimate Activation Energy of Power Transformer Insulation Using Time Domain Spectroscopy Data. IEEE Trans. Dielectr. Electr. Insul. 2017, 24, 3245–3253. [Google Scholar] [CrossRef]
- Martin, D.; Cui, Y.; Ekanayake, C.; Ma, H. An Updated Model to Determine the Life Remaining of Transformer Insulation. IEEE Trans. Power Deliv. 2015, 30, 395–402. [Google Scholar] [CrossRef]
- Gillen, K.T.; Celina, M. The wear-out approach for predicting the remaining lifetime of materials. Polym. Degrad. Stab. 2000, 71, 15–30. [Google Scholar] [CrossRef] [Green Version]
- Urzhumtsev, Y.S. Time-temperature superposition. Rev. Mech. Compos. Mater. 1975, 11, 57–72. [Google Scholar]


| Transformer Polymer Pressboard | Transformer Insulating Oil | ||
|---|---|---|---|
| Brand | T4 Weidmann transformer pressboard | Brand | Karamay No.25 naphthenic mineral oil |
| Thickness | 0.5 mm | Dielectric loss | 4 × 10⁻⁴ |
| Tensile strength | MD: 98 MPa, CMD: 47 MPa | Pour point | ≤−45 °C |
| Density | 0.96 g/cm3 | Flash point | 135 °C |
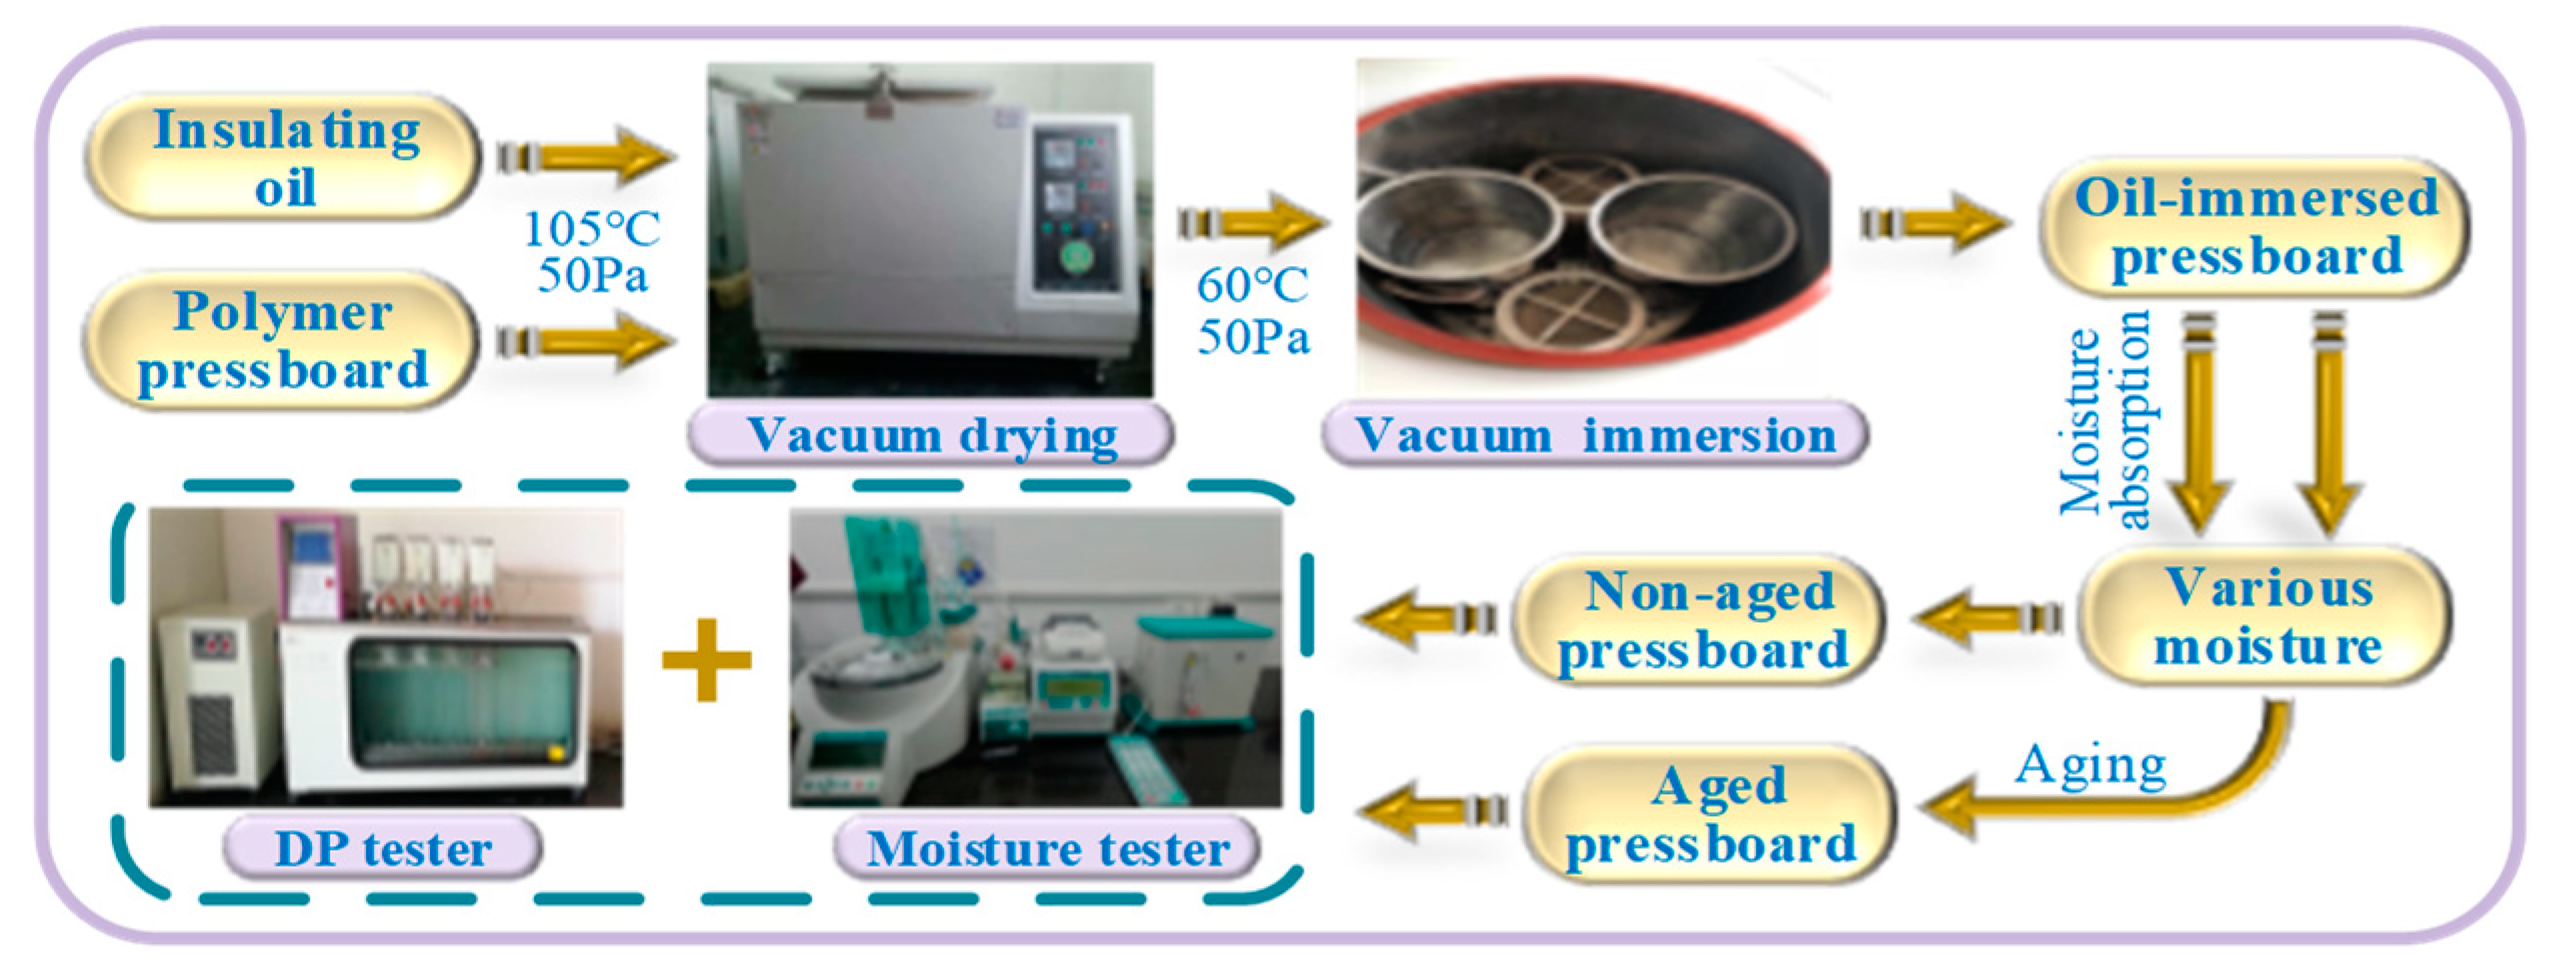
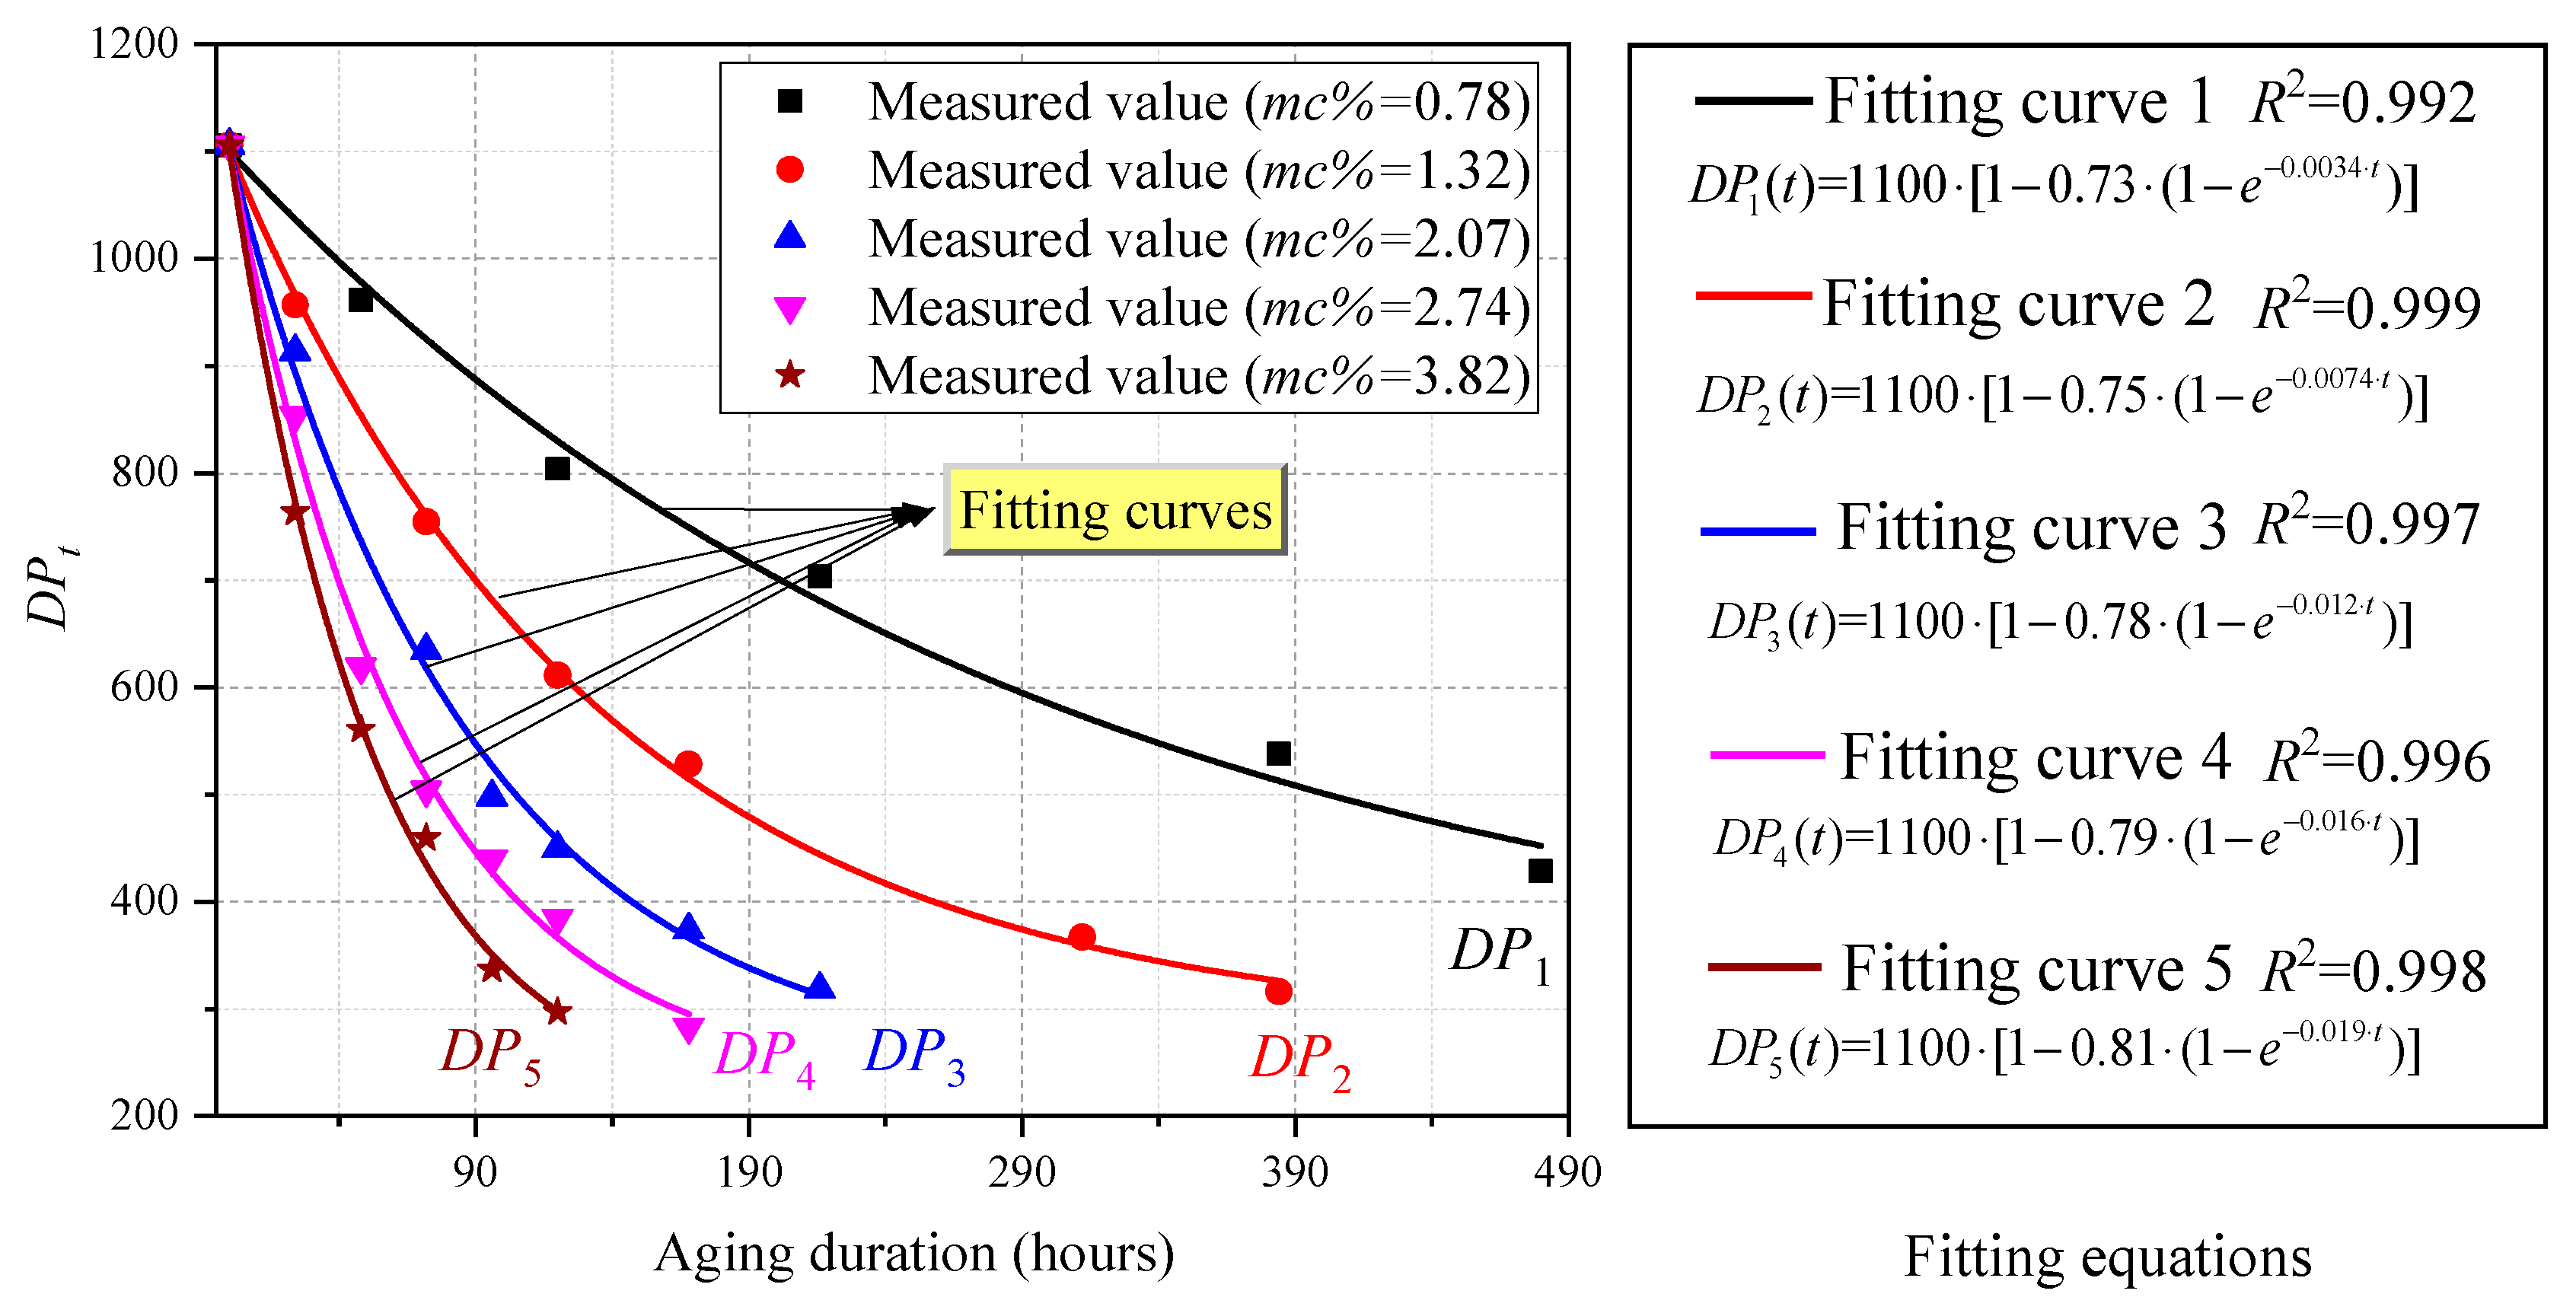
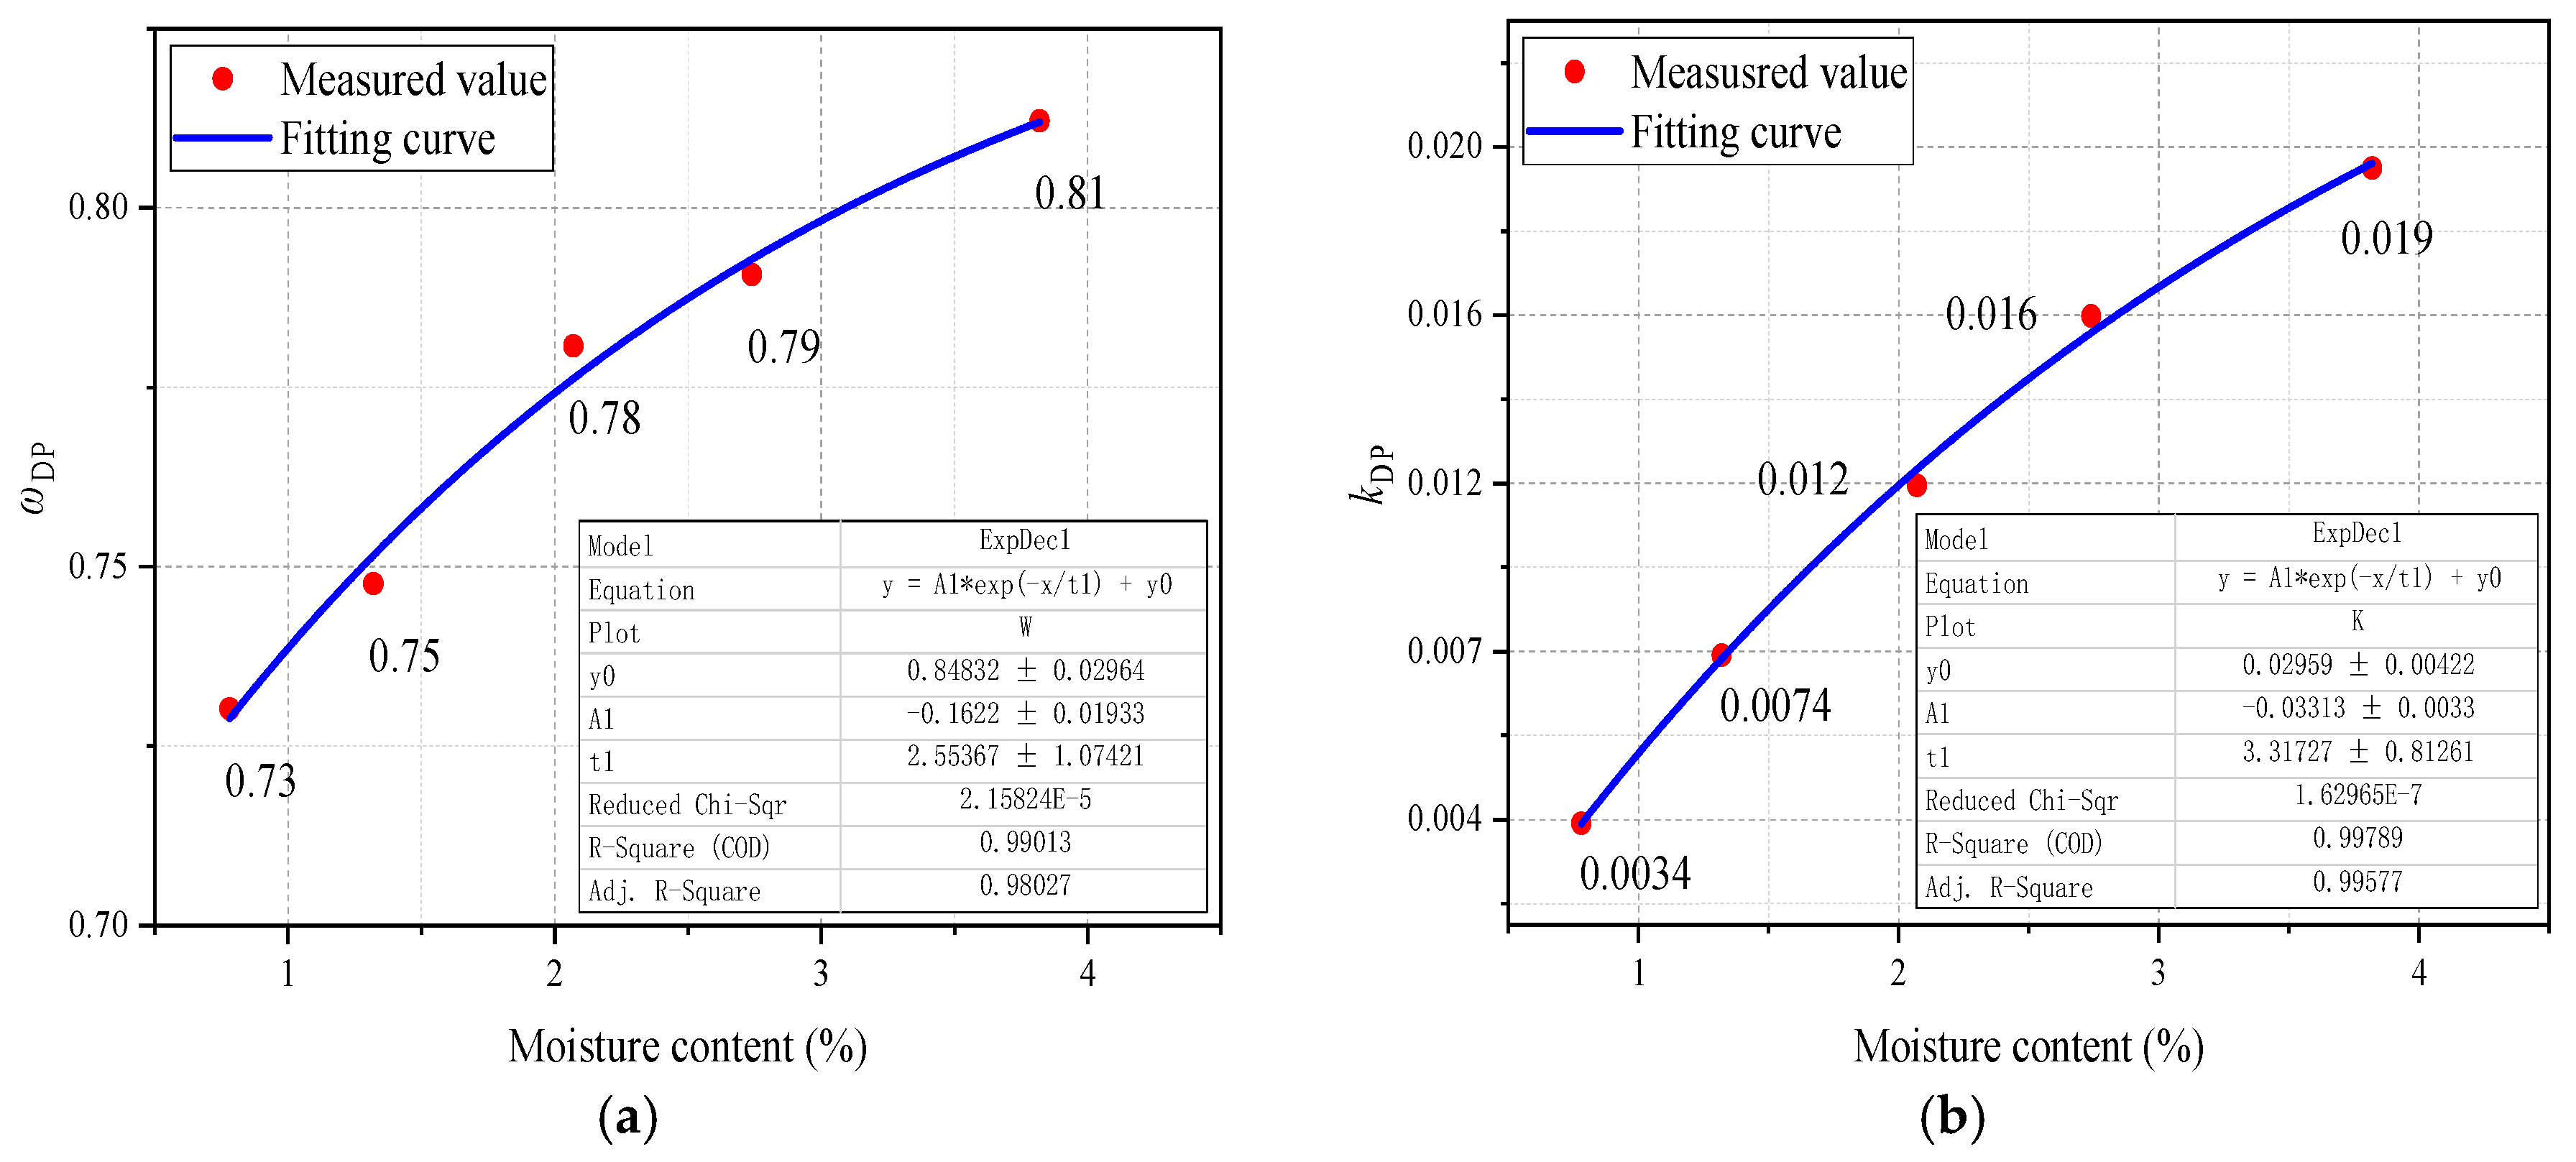
| mc% | 0.78% | 1.32% | 2.07% | 2.74% | 3.82% | |||||
|---|---|---|---|---|---|---|---|---|---|---|
| value | EB (±) | value | EB (±) | value | EB(±) | value | EB (±) | value | EB (±) | |
| ωDP | 0.73 | 2.36 × 10⁻⁴ | 0.75 | 1.38 × 10⁻⁴ | 0.78 | 4.45 × 10⁻⁴ | 0.79 | 6.13 × 10⁻⁴ | 0.81 | 6.99 × 10⁻⁴ |
| kDP | 0.0034 | 6.34 × 10⁻⁴ | 0.0074 | 2.76 × 10⁻⁴ | 0.012 | 1.25 × 10⁻³ | 0.016 | 2.36 × 10⁻⁴ | 0.019 | 1.41 × 10⁻³ |
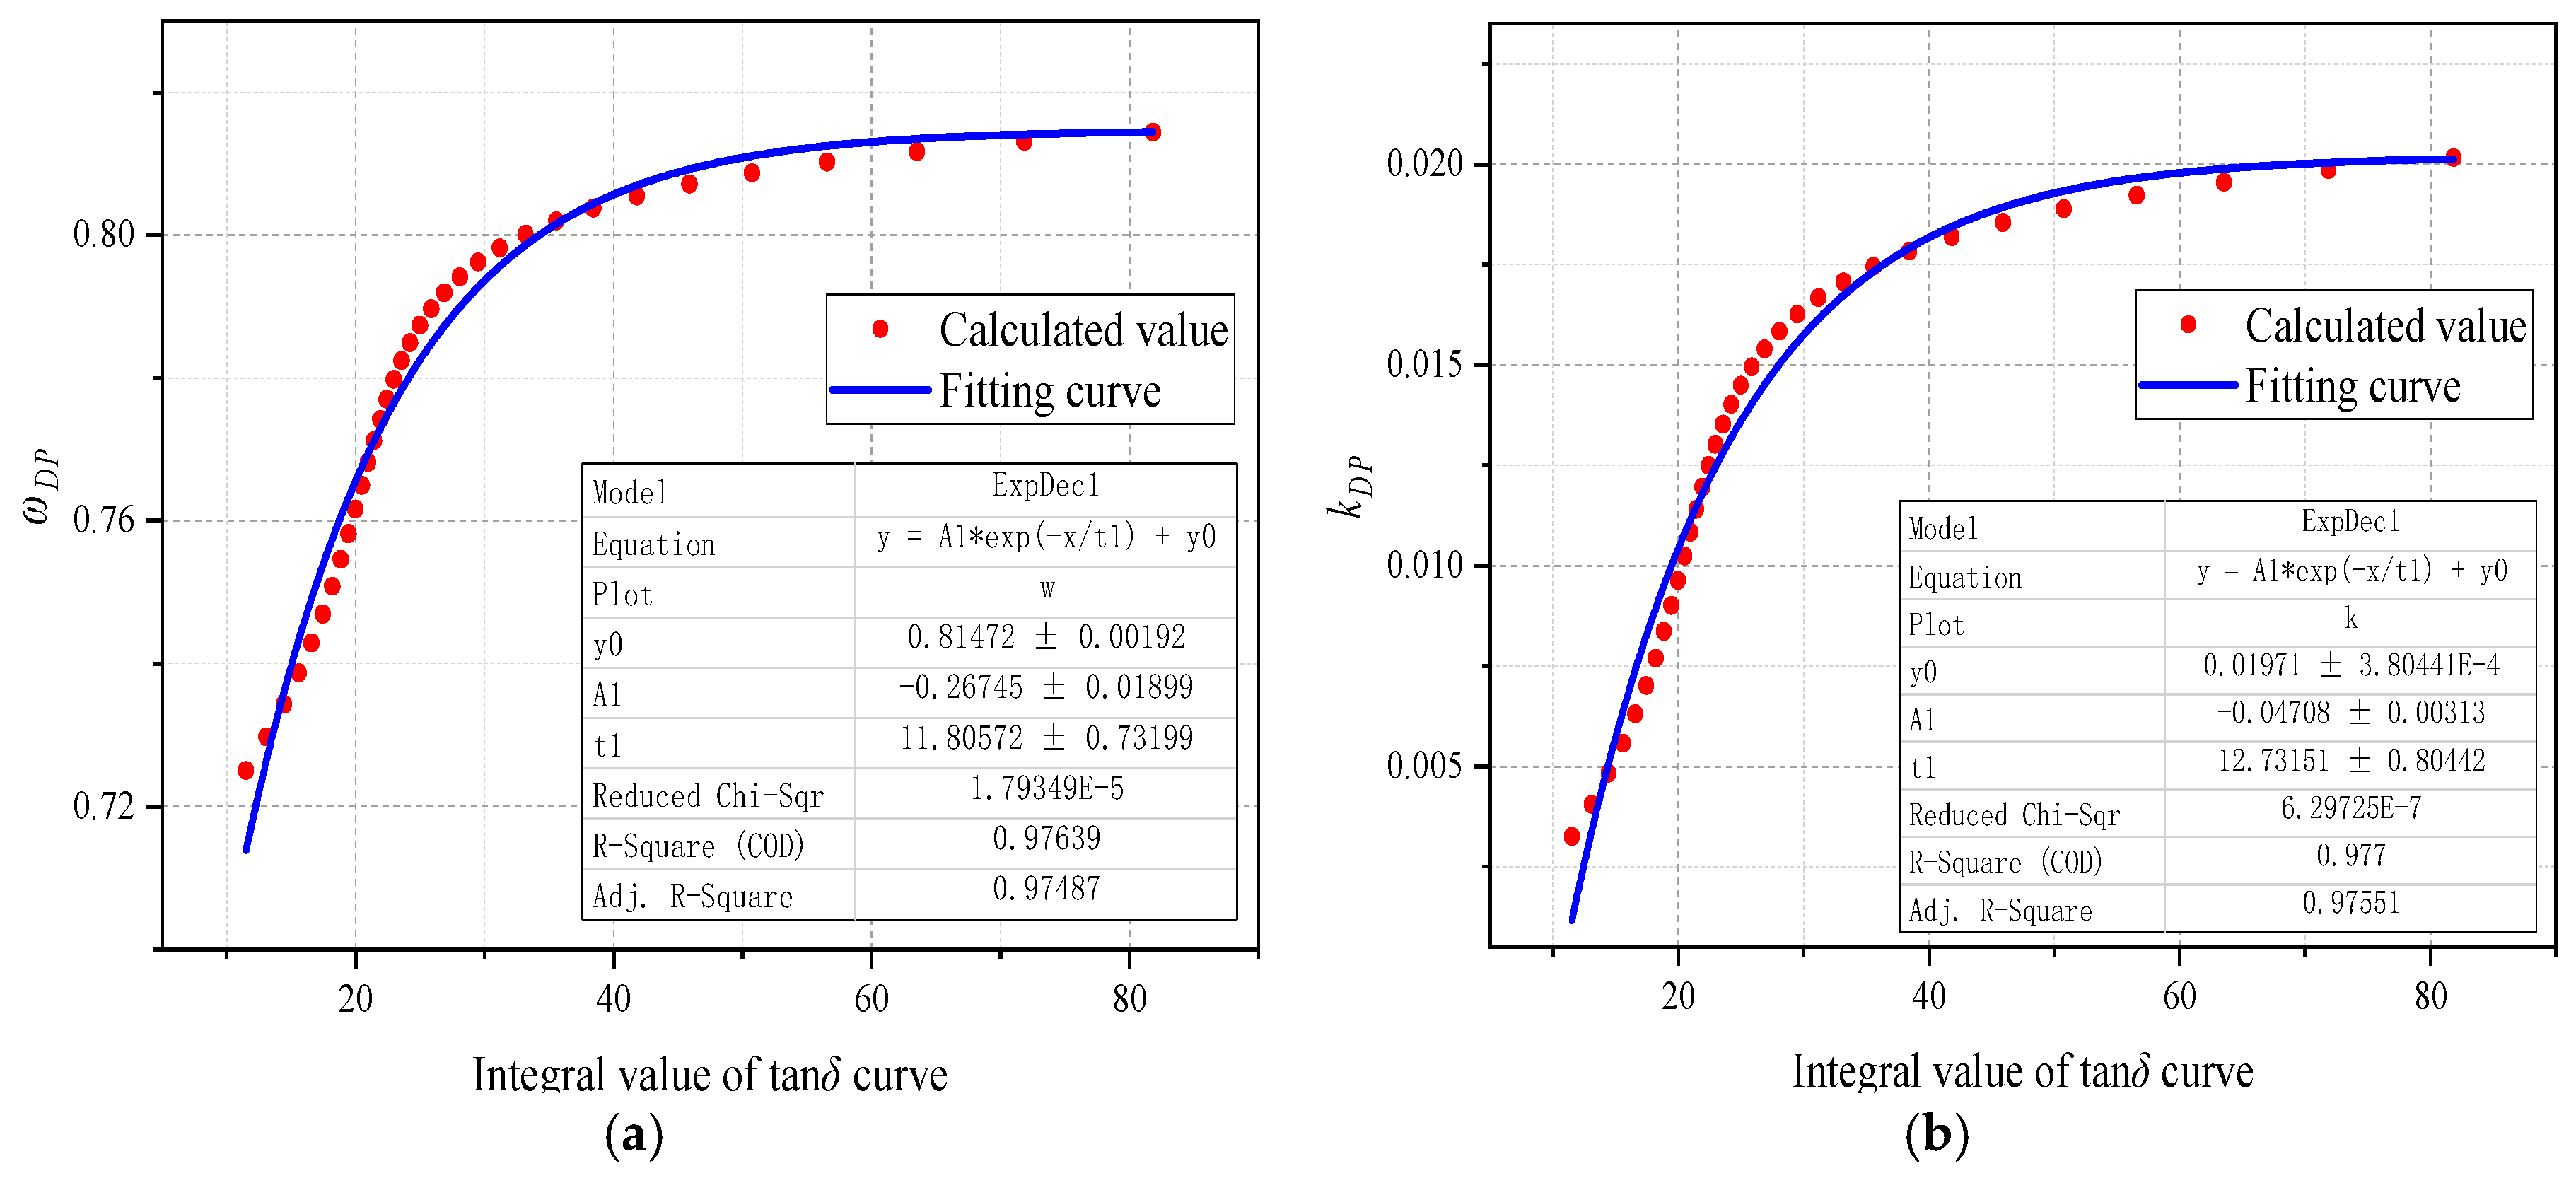
| Fitting Equation |
|---|
| Parameters | Measured Value | |||||
|---|---|---|---|---|---|---|
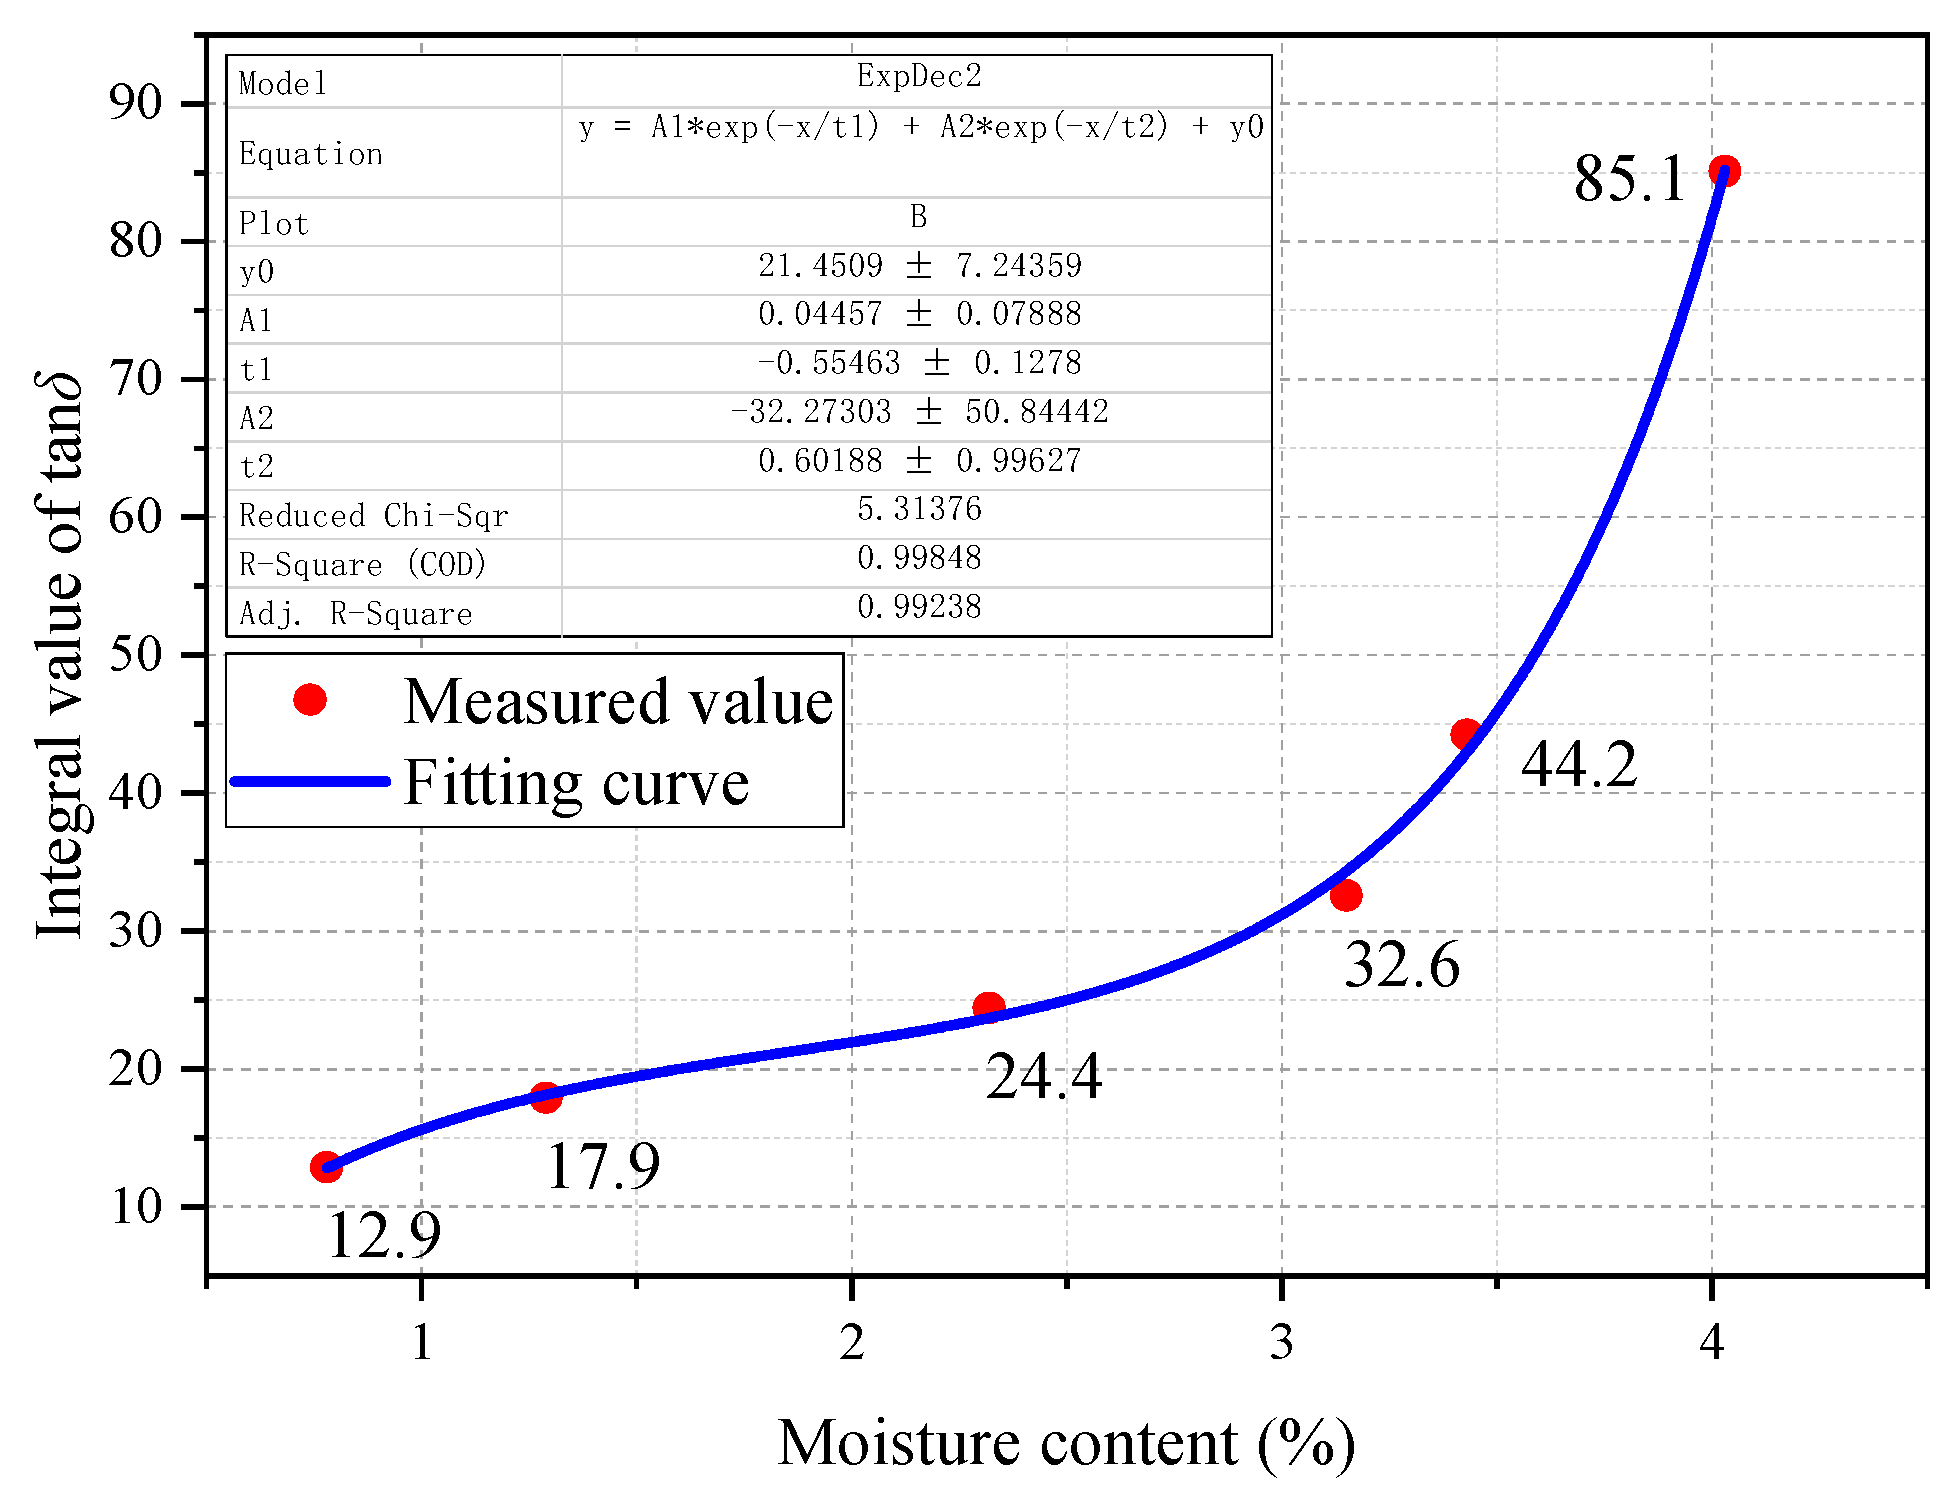
| mc% | 0.78% | 1.29% | 2.32% | 3.15% | 3.43% | 4.03% |
| IV | 12.9 | 17.9 | 24.4 | 32.6 | 44.2 | 85.1 |
| Fitting Equation of IV |
|---|
| Fitting Equation |
|---|
| Pressboard | Dry Pressboard | Wet Pressboard | |||||||
|---|---|---|---|---|---|---|---|---|---|
| Parameters | 1 | 2 | 3 | 4 | 5 | 6 | 7 | 8 | |
| Measured mc% | 0.98% | 1.02% | 1.12% | 1.15% | 2.31% | 2.93% | 3.87% | 4.12% | |
| Measured DPm | 1093 | 897 | 751 | 548 | 832 | 644 | 472 | 394 | |
| Aging temperature (T)/K | 423.15 | 423.15 | 423.15 | 423.15 | 403.15 | 403.15 | 403.15 | 403.15 | |
| Aging duration (t)/h | 24 | 72 | 96 | 168 | 96 | 168 | 264 | 336 | |
| Integral value (IV) | 14.7 | 15.0 | 16.1 | 16.2 | 22.8 | 42.1 | 60.1 | 82.0 | |
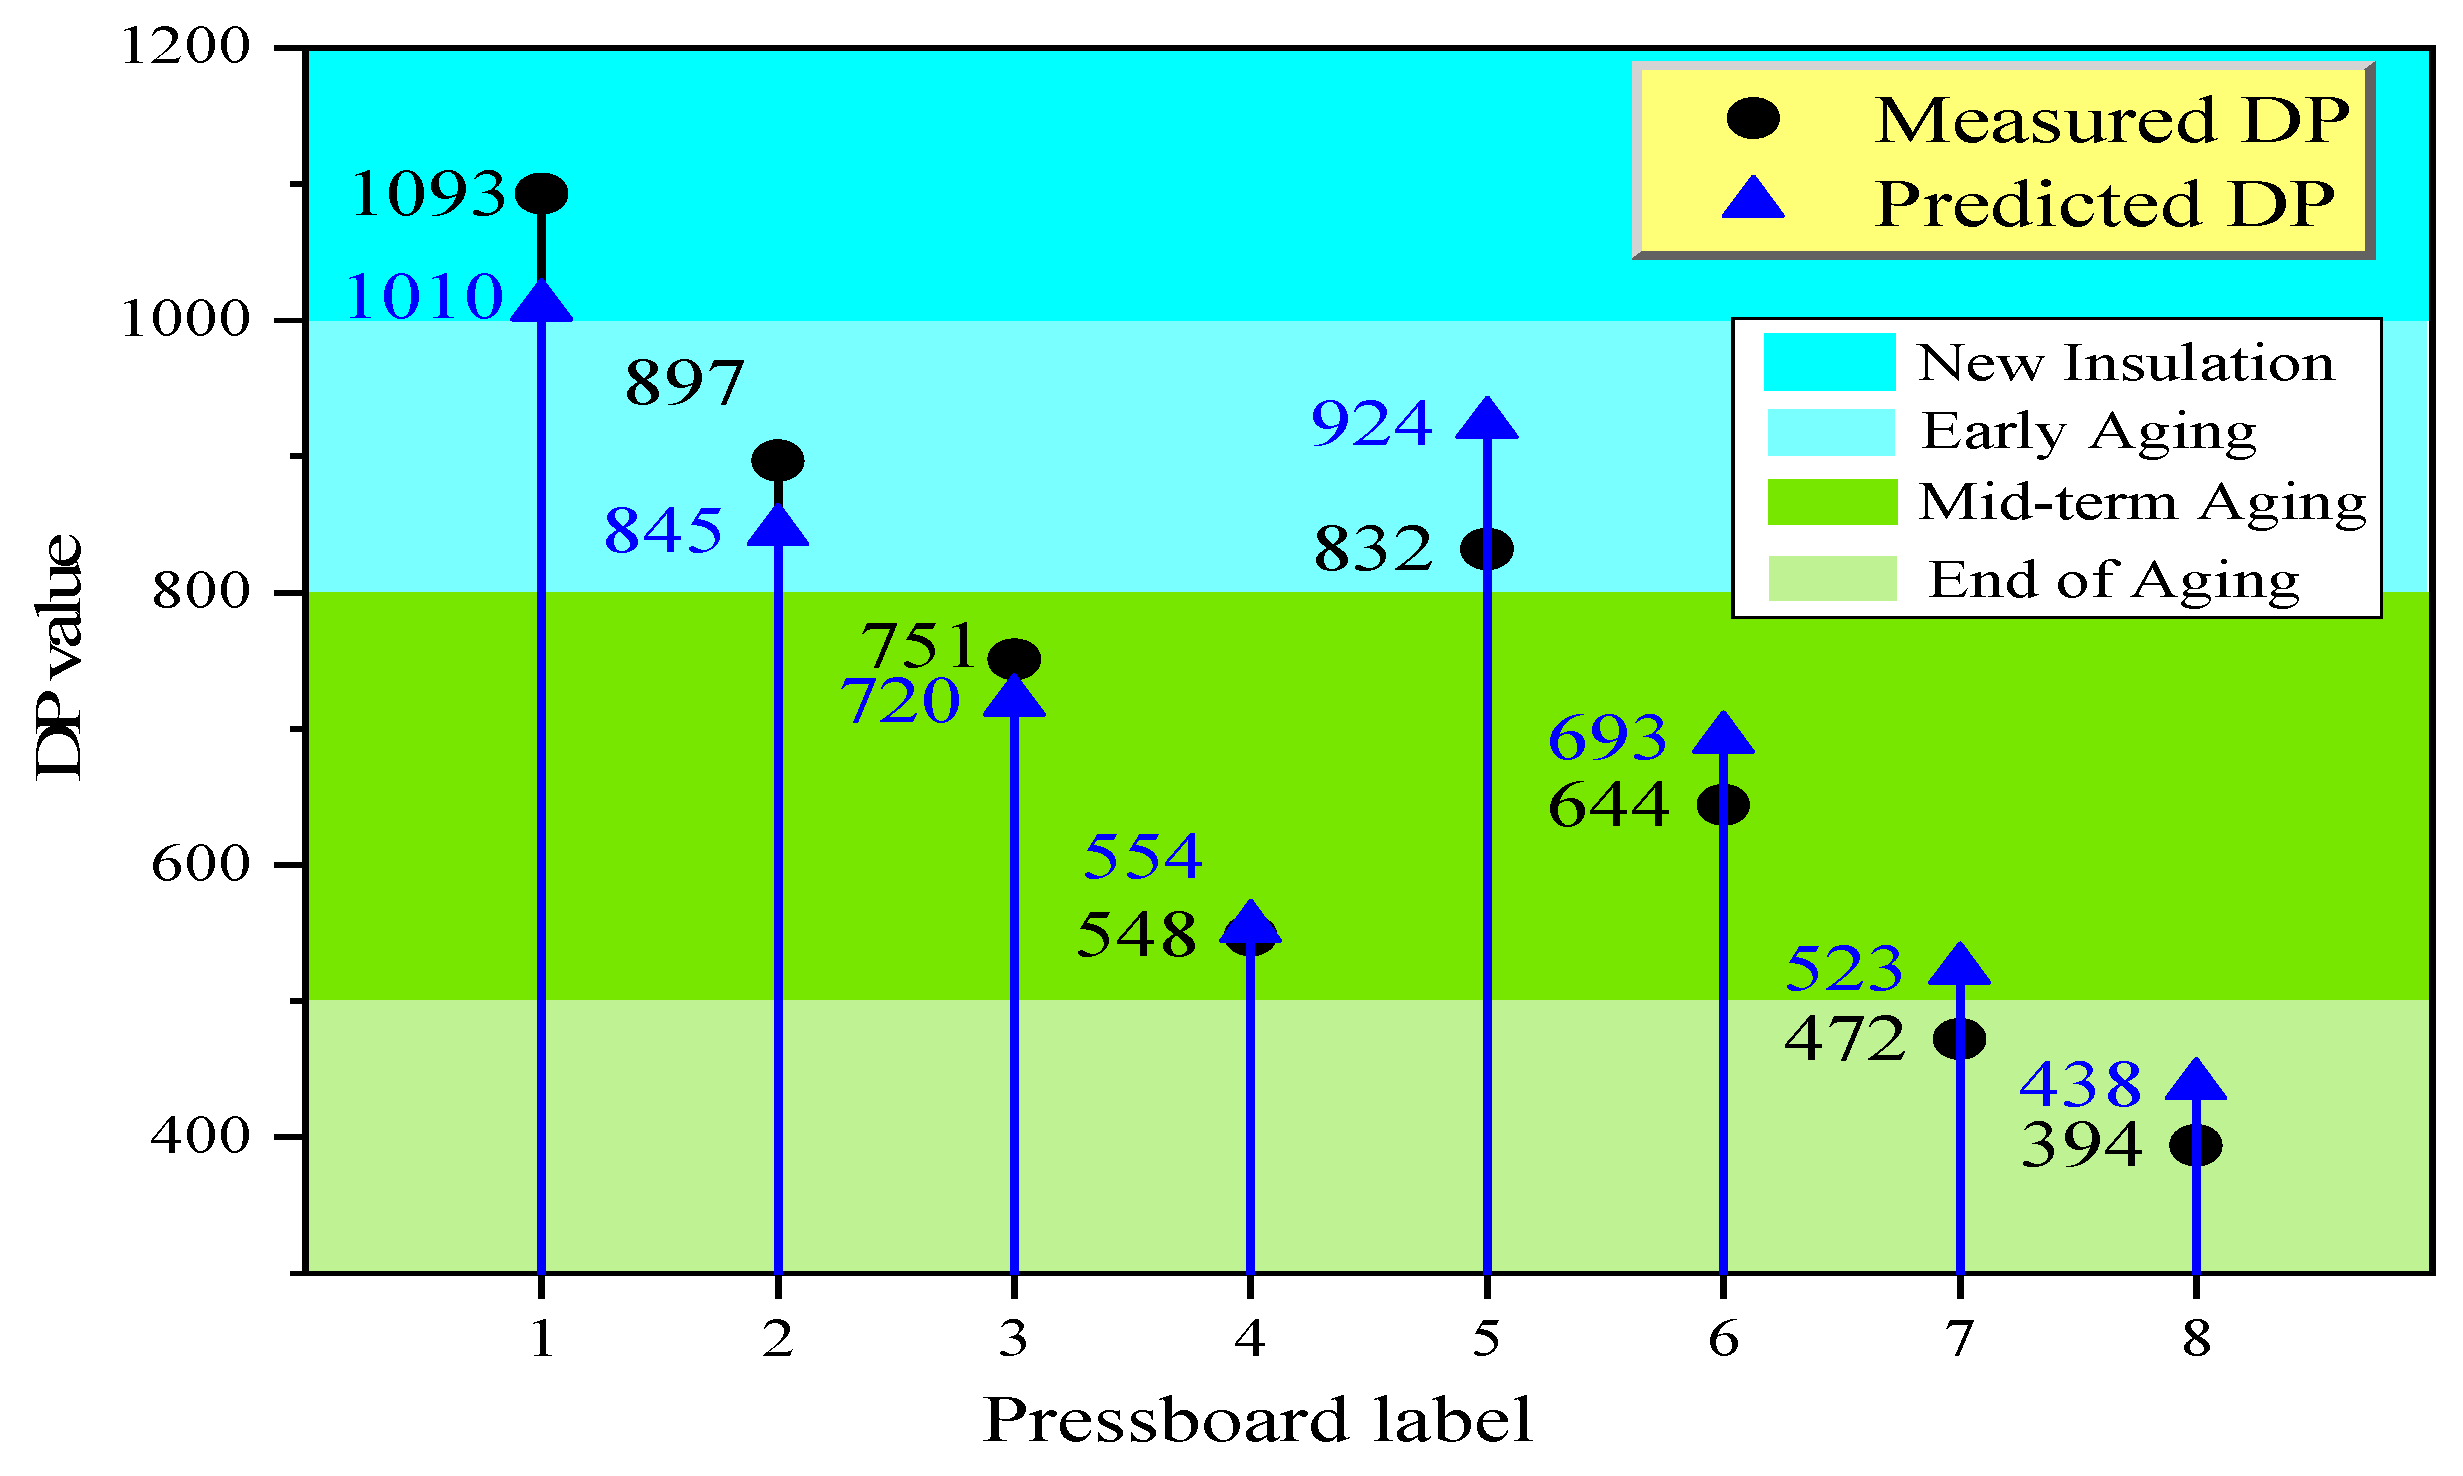
| Pressboard | Dry Pressboard | Wet Pressboard | |||||||
|---|---|---|---|---|---|---|---|---|---|
| Parameters | 1 | 2 | 3 | 4 | 5 | 6 | 7 | 8 | |
| Parameters ωDP | 0.738 | 0.740 | 0.747 | 0.747 | 0.776 | 0.807 | 0.813 | 0.815 | |
| Parameters kDP | 0.0049 | 0.0052 | 0.0064 | 0.0065 | 0.012 | 0.018 | 0.019 | 0.020 | |
| Parameters αT | 1.0 | 1.0 | 1.0 | 1.0 | 0.20 | 0.20 | 0.20 | 0.20 | |
| Measured DPm | 1093 | 897 | 751 | 548 | 832 | 644 | 472 | 394 | |
| Predicted DPp | 1010 | 845 | 720 | 554 | 924 | 693 | 523 | 438 | |
| Relative error | 7.59% | 5.80% | 4.13% | 1.09% | 11.06% | 7.61% | 10.81% | 11.17% | |
© 2019 by the authors. Licensee MDPI, Basel, Switzerland. This article is an open access article distributed under the terms and conditions of the Creative Commons Attribution (CC BY) license (http://creativecommons.org/licenses/by/4.0/).
Share and Cite
Liu, J.; Fan, X.; Zhang, Y.; Zheng, H.; Wang, Z.; Zhao, X. A Modified Aging Kinetics Model for Aging Condition Prediction of Transformer Polymer Insulation by Employing the Frequency Domain Spectroscopy. Polymers 2019, 11, 2082. https://0-doi-org.brum.beds.ac.uk/10.3390/polym11122082
Liu J, Fan X, Zhang Y, Zheng H, Wang Z, Zhao X. A Modified Aging Kinetics Model for Aging Condition Prediction of Transformer Polymer Insulation by Employing the Frequency Domain Spectroscopy. Polymers. 2019; 11(12):2082. https://0-doi-org.brum.beds.ac.uk/10.3390/polym11122082
Chicago/Turabian StyleLiu, Jiefeng, Xianhao Fan, Yiyi Zhang, Hanbo Zheng, Zixiao Wang, and Xixi Zhao. 2019. "A Modified Aging Kinetics Model for Aging Condition Prediction of Transformer Polymer Insulation by Employing the Frequency Domain Spectroscopy" Polymers 11, no. 12: 2082. https://0-doi-org.brum.beds.ac.uk/10.3390/polym11122082