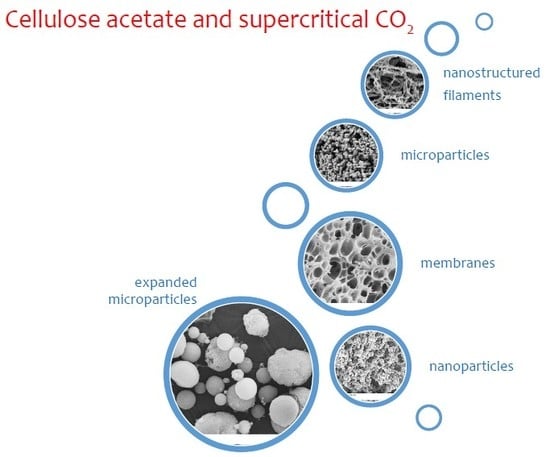
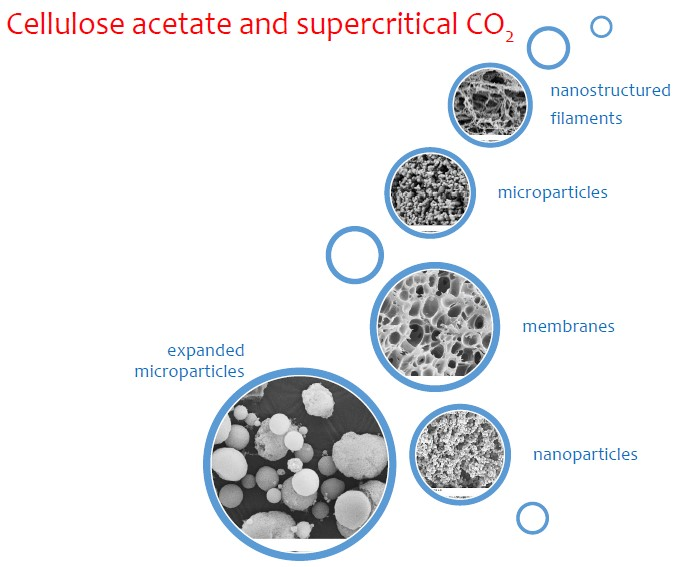
Cellulose Acetate and Supercritical Carbon Dioxide: Membranes, Nanoparticles, Microparticles and Nanostructured Filaments


Department of Industrial Engineering, University of Salerno, Via Giovanni Paolo II, 132, 84084 Fisciano (SA), Italy
*
Author to whom correspondence should be addressed.
Polymers 2020, 12(1), 162; https://0-doi-org.brum.beds.ac.uk/10.3390/polym12010162
Submission received: 20 December 2019
/
Revised: 5 January 2020
/
Accepted: 6 January 2020
/
Published: 8 January 2020
(This article belongs to the Section Polymer Applications)
Abstract
:Cellulose acetate (CA) is a very versatile biocompatible polymer used in various industrial sectors. Therefore, depending on the application, different morphologies are required. Different processes at industrial scale are commonly employed to obtain CA micro or nanoparticles (discontinuous structures) or CA membranes (continuous structures with discontinuities). In this work, two supercritical carbon dioxide (scCO2) based techniques, such as the semi-continuous supercritical antisolvent process (SAS) and the supercritical fluid phase inversion process, in which scCO2 plays the role of antisolvent, were employed. Varying the kind of organic solvent used to prepare the polymeric solution, the polymer concentration, and operating pressure and temperature, it was possible to tune the characteristics of the obtained material. In particular, using acetone as the organic solvent, filaments constituted by nanoparticles, expanded microparticles, nanoparticles with a mean diameter lower than 80 nm, and microporous membranes were obtained, varying the operating conditions. The attainment of spherical micron-sized particles was instead achieved using a mixture of acetone and DMSO as the organic solvent. Therefore, the versatility of the supercritical carbon dioxide-based techniques has been confirmed, and it was possible to obtain, using a single experimental plant, various morphologies of cellulose acetate (with controllable particles’ or pores’ diameters) by varying the operating conditions.
1. Introduction
Different techniques have been developed to obtain polymeric materials in form of micro and nanoparticles, fibers, foams, scaffolds and membranes to be used in several industrial applications (food industry, tissue engineering, mechanical engineering, biomedical field, pharmaceuticals, chemical engineering, etc.). Among them, spray drying [1], electrospinning [2], chemical foaming [3], gel drying [4], and phase inversion [5] are some of the most studied and diffused processes, but they are also characterized by some crucial limitations. For example:
- the spray drying process is characterized by variations in particle shape and particle size distribution, high process temperatures, and high drying speeds that normally do not allow the encapsulation of temperature-sensitive bioactive substances [6];
- the electrospinning process is characterized by the use of organic solvents that can be toxic, difficulty in obtaining 3-D structures as well as sufficient size of pores needed for biomedical applications and suitable mechanical behavior; moreover, the process depends on a high number of variables and their combination (humidity, temperatures, collector distance, high voltage, etc.) [7];
- the chemical foaming process is simple, but high mold manufacturing precision is required (the mold cost is high), and a second clamping pressure device is needed during high-pressure foaming process [8];
- the gel drying process is characterized by a high cost of the raw materials (the chemicals) and there is often a large volume shrinkage and cracking during the drying step (the removing of the “organics” can cause the collapse of the structure due to their surface tension); moreover, long processing times can be necessary [9];
- the phase inversion process is characterized by the use of organic solvents and necessity of post-treatments on the generated material, low versatility (once the system polymer-solvent-nonsolvent is selected, only one kind of morphology is possible), long processing times (from several hours to days), etc. [5].
For these reasons, in the last thirty years, the supercritical fluids have been tested to overcome some of the limitations reported above, obtaining successful results [10,11,12]. Indeed, supercritical fluids have some peculiar characteristics, such as liquid-like densities and gas-like diffusivities, which allow to largely improve the performances of the above-mentioned processes. Furthermore, low residual solvents are present in the final structures due to the high affinity between scCO2 and most of the organic solvents normally used in the processes. Then, it is possible to recover the solvents at the end of the processes, simply depressurizing the plant, thus minimizing the pollution due to the processes.
The most used substance at supercritical conditions is carbon dioxide (scCO2), for its readily accessible critical pressure and temperature, its non-toxicity, non-flammability, and for its cheapness [13,14,15,16].
The scCO2 based processes applied to polymeric materials may be classified into two main subsets:
- attainment of a discontinuous structure (micro and nanoparticles, for example);
- attainment of a continuous structure with discontinuities (such as fibers, membranes, foams, and scaffolds).
In the case of a discontinuous structure, different processes have been developed which can be classified according to the different roles played by scCO2. In particular, scCO2 can solubilize the polymer (RESS, rapid expansion of supercritical solution) [17], it can play the role of antisolvent (SAS, supercritical antisolvent [18] and GAS, gas antisolvent [19]), the role of co-solute (SAA, supercritical assisted atomization [20] and PGSS, particles from gas-saturated solutions [21]) or it can extract the oily phase from oil-in-water emulsions [22]. Among them, one of the most used is the SAS process that, compared to the traditional micro and nanoparticles formation processes (i.e., spray drying, etc.), allows to obtain better results in terms of particle shape and size distribution, using low processing temperatures (i.e., 35–45 °C). Moreover, thanks to the scCO2 peculiarities, a high encapsulation rate of active substances in polymeric particles can also be achieved.
When the structure is continuous and shows some discontinuities, SAS process has been used to produce fibers [23], supercritical CO2 assisted phase inversion method has been used to obtain membranes [24], supercritical foaming to produce foams [25], and supercritical gel drying to produce scaffolds [26]. With respect to the traditional processes for the generation of continuous structures (gel drying, phase inversion, foaming, etc.), the scCO2 assisted processes allow to obtain better results in terms of versatility. Indeed, it is possible to control the final morphology of the structures simply varying the process parameters, such as temperature, pressure and processing times. Finally, the absence of surface tension at supercritical state allows to eliminate the solvents without collapsing the porous structures.
In this work, two scCO2 based techniques will be used (SAS and scCO2 assisted phase inversion). The two techniques have many points in common and a significant difference:
- in both of them, the carbon dioxide acts as an antisolvent and flows continuously into the vessel;
- the techniques are both in a batch mode with respect to the solid phase (a depressurization is necessary to recover the solute after the process);
- the SAS process is continuous with respect to the polymeric solution that is injected through a nozzle in the supercritical medium, whereas, the scCO2 assisted phase inversion is batch, considering that the polymeric solution is charged at atmospheric pressure at the beginning of the experiment.
Cellulose acetate (CA), the acetate ester of cellulose, is a biocompatible polymer widely used for many industrial products, like textiles, filters, foils, photographic and motion pictures, films, moldings, coatings, membranes, LCD-displays, and controlled drug delivery systems [27,28,29,30]. This polymer is often used in the preparation of semipermeable membranes for dialysis, ultrafiltration, and reverse osmosis [28,31]. CA membranes have very low absorption characteristics (high throughput) and thermal stability with high flow rates. CA is also used as the carrier for the delivery of vitamins or pharmaceutical products both in the form of nanofibers [23,32,33,34] and microparticles [35,36]. Moreover, CA nanoparticles are used in novel applications to modify bulk materials, because, if compared to bulk material, cellulose acetate nanoparticles offer a huge surface area which is useful to trigger selectively surface interactions, and hence design materials with novel properties [37].
Considering the multiplicity of morphologies for which cellulose acetate can be used for different applications, their attainment using a single technique or similar techniques that share a single plant would be interesting. Indeed, it is clear from the literature analysis that the different CA morphologies were obtained using very disparate techniques ranging from electrospinning to nanoprecipitation to phase inversion [32,33,34,35,36,37].
Therefore, the purpose of this work is to obtain, using the aforementioned supercritical carbon dioxide-based techniques, different CA morphologies, simply by changing the operating conditions, such as pressure, temperature, and concentration of the polymeric solution. The SAS process will be applied in correspondence of concentrations of the polymer in the organic solvent which allows the jet break-up of the liquid solution. At high concentrations of the polymeric solution, in correspondence of which high viscosities prevent the liquid jet break-up, the scCO2 assisted phase inversion will be used.
Cellulose acetate is freely soluble in acetone, which is classified as a low-risk solvent to human health (class 3) [38] and, therefore, it will be the preferred solvent for the majority of the experiments. For some SAS experiments, a mixture of acetone and dimethylsulfoxide (DMSO) will be used as the organic solvent, because the jet fluid dynamics of acetone and DMSO is very different.
2. Apparatus, Materials and Methods
2.1. Materials
Cellulose acetate (CA, degree of substitution = 2.5, average Mn ≈ 50,000), dimethylsulfoxide (DMSO, purity 99.5%) and acetone (AC, purity 99.8%) were supplied by Sigma–Aldrich (Milan, Italy). Carbon dioxide (purity 99%) was purchased from Morlando Group (Sant’Antimo—NA, Italy). All materials were used as received. CA solubilities in the organic solvents were measured by stirring the solutions at 40 °C; they are equal to 25 mg/mL in DMSO and 320 mg/mL in AC.
2.2. Apparatus and Procedures
2.2.1. Apparatus
The bench-scale plant used for all the experiments is a home-made apparatus equipped with a 316 stainless steel cylindrical high-pressure vessel with an internal volume of 500 mL (I.D. 5 cm). In the case of the SAS semi-continuous process, two pumps are used to deliver the liquid solution and the carbon dioxide, whereas, in the case of membrane preparation, only the pump for the carbon dioxide is used. scCO2 is pumped through an inlet port located on the top of the chamber. CO2 is heated to the process temperature before entering the precipitator. The precipitator is electrically heated using thin band heaters. The pressure in the chamber is measured using a test gauge manometer and regulated by a micrometric valve located at the exit (bottom) of the chamber. In the case of the SAS process, the liquid mixture is sprayed in the precipitator through a 200 μm thin wall stainless steel nozzle. A second vessel located downstream of the micrometric valve is used to recover the liquid solvent. At the exit of the second vessel, a rotameter and a dry test meter are used to measure the CO2 flow rate and the total quantity of antisolvent delivered, respectively.
2.2.2. Procedure for SAS Experiments
The SAS experiments were performed at pressures ranging between 9 and 15 MPa, concentrations between 10 and 30 mg/mL, and temperatures in the range 35–60 °C. A SAS experiment started by delivering carbon dioxide at a constant flow rate to the precipitation chamber until the desired pressure was reached. The antisolvent steady flow was established, opening the micrometric valve. Then, the pure solvent was sent through the injector to the pressurized chamber, with the aim of obtaining steady-state composition conditions during the solute precipitation. At this point, the flow of the organic solvent was stopped and the liquid solution, formed by the organic solvent and the polymer, was delivered through the nozzle, at the same flow rate of the pure solvent. At the end of the precipitation process, scCO2 continued to flow to wash the chamber from the residual content of liquid solubilized in the supercritical antisolvent. A stainless-steel frit is put at the bottom of the chamber to collect the solid product, allowing the CO2–organic solvent solution to pass through. At the end of the washing step, CO2 flow was stopped, and the precipitator was slowly depressurized down to atmospheric pressure.
2.2.3. Procedure for Membranes’ Preparation
Homogenous solutions of cellulose acetate in acetone were prepared in the range of polymer concentrations between 40 and 320 mg/mL by stirring at 40 °C. The solution was placed in a formation cell (steel caps with a diameter of 2.5 cm and heights ranging from 300 to 600 μm) spreading it with a glass stick to control the thickness of the film. The cell was rapidly put inside the vessel to avoid the evaporation of acetone. The vessel was then filled with scCO2 up to the desired pressure. In the first part of the process, CO2 penetrates in the solution operating in batch mode for 1 h. After this period of time, a micrometric valve is opened and we operated in continuous mode; i.e., with a constant CO2 flow rate set at 1.2 kg/h, holding pressure and temperature constant to dry the phase-separated membrane for 2 h. Then, the vessel was slowly depressurized for 2 h.
2.3. Characterization
Samples of the precipitated powder were collected at different points inside the precipitation chamber and examined using a Field Emission Scanning Electron Microscope (FESEM, mod. LEO 1525, Carl Zeiss SMT AG, Oberkochen, Germany). FESEM samples were covered with 250 A of gold using a sputter coater (mod. 108A, Agar Scientific, Stansted, UK).
Particle size (PS) and particle size distribution (PSD) were measured using an image processing software (SigmaScan Pro, Jandel Scientific, Bangalore, India) that counts, measures, and analyzes digital images.
Thermograms of CA were obtained using a Differential Scanning Calorimeter (DSC, mod. TC11, Mettler-Toledo, Inc., Columbus, OH, USA) using Mettler STARe system. Fusion temperature and enthalpy were previously calibrated with indium standard materials (melting point 156.6 °C, enthalpy of fusion 28.52 J/g). CA powder samples (5 ± 0.5 mg), prepared in duplicates, were accurately weighed, crimped into an aluminum pan and heated from 25 to 250 °C at 10 °C/min under a nitrogen purge (50 mL/min).
3. Results and Discussion
3.1. Supercritical Antisolvent Precipitation
The operating conditions of the experimental plan were chosen on the basis of our expertise in the SAS process. In particular, the pressure was varied between 9 and 15 MPa and the temperature between 35 and 60 °C. As regards the choice of pressure, it is well-known that at pressures in the proximity of the mixture critical point (MCP) of the solvent-carbon dioxide system, microparticles are generally obtained, while, at pressures quite higher than MCP, nanoparticles precipitate. Therefore, the minimum pressure value was set at 9 MPa. This value is about 1.5 MPa above the MCP of the binary system to be sure to locate the operating point above the MCP of the ternary system formed by the polymer, the solvent and the antisolvent; i.e., to take into account that the addition of the polymer can shift the MCP towards higher pressures [39,40]. The upper end of the range (15 MPa) is well above the MCP; in correspondence of this region, fully developed supercritical conditions are realized, the surface tension of the liquid in contact with the scCO2 disappears before the liquid jet break-up in droplets and the solute precipitation occurs from a gas plume. As regards the temperature, the minimum value (35 °C) was chosen just above the carbon dioxide critical temperature, which is equal to 31.1 °C, while the maximum one was fixed at 60 °C. Higher temperatures would cause an unnecessary increase in process costs, without a gain in terms of performance of the process itself. The liquid solution flow rate was fixed at 1 mL/min, the ratio between CO2 flow rate and liquid flow rate (R) was set equal to 30 on a mass basis and the CO2 molar fraction was equal to 0.98.
A list of all the performed experiments with the operating conditions and the obtained morphologies is reported in Table 1. The mean diameter (m.d.) and the standard deviation (s.d.) are related to the nanoelements constituting the filaments in the case of nanostructured filaments (NF), and to the particles in the case of nanoparticles (NP), microparticles (MP), and expanded microparticles (EMP).
3.1.1. AC as the Liquid Solvent
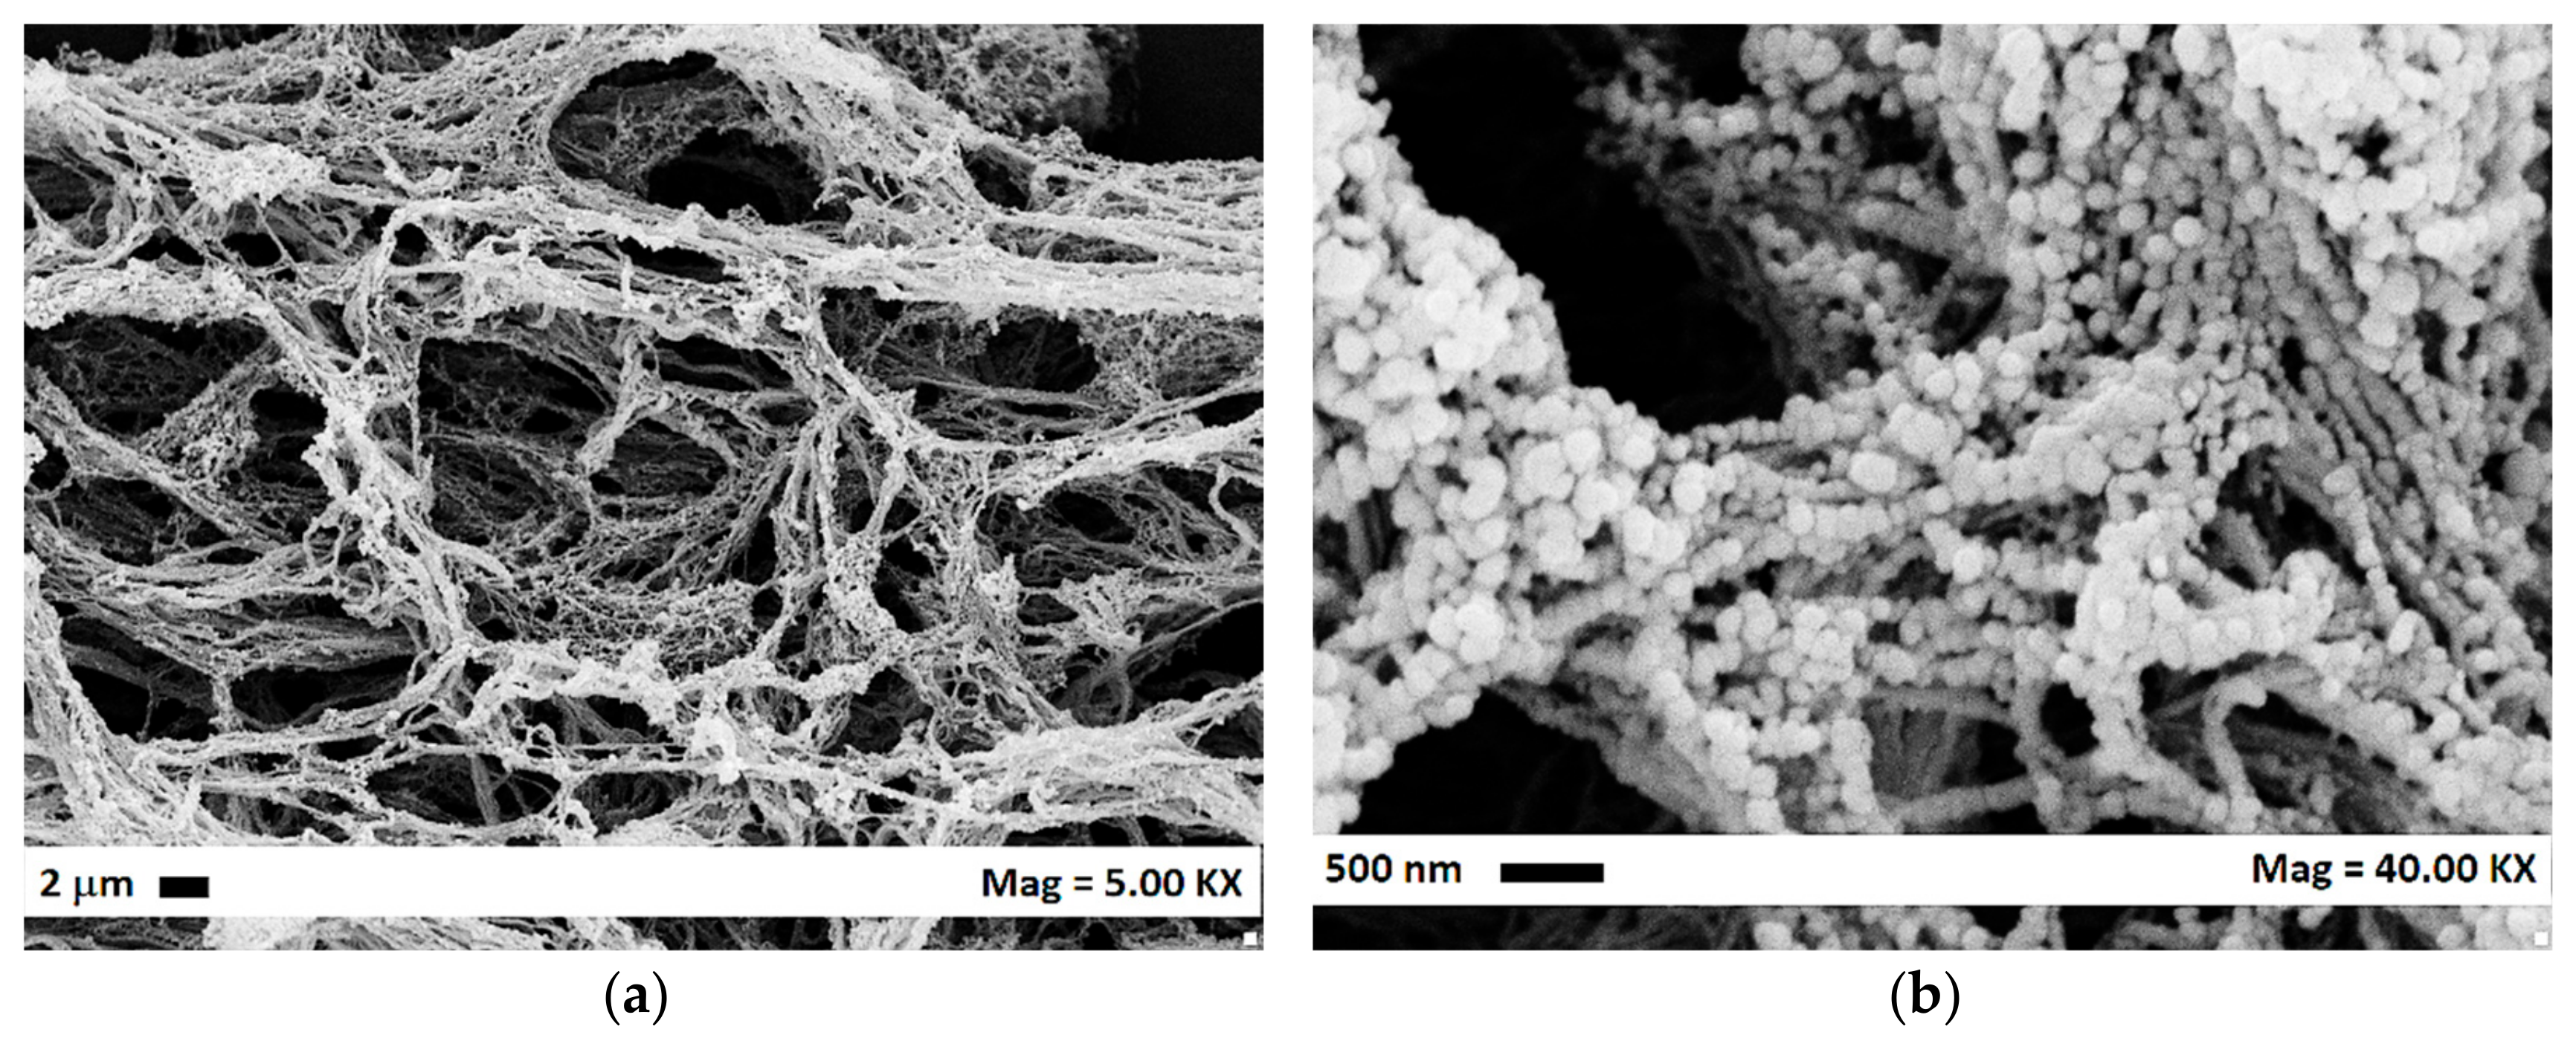
Using AC as the liquid solvent, the effect of the operating pressure and temperature on the morphology of the precipitated polymer was studied at different concentrations. The first set of experiments (#1–7) was performed at 10 mg/mL, varying the temperature from 35 to 50 °C and the pressure from 9 to 15 MPa. We observed that, at 9 and 12 MPa, for all the temperatures, nanostructured filaments were recovered in correspondence of the nozzle. It is possible to observe from Figure 1a,b, in which exemplificative FESEM images were reported, that the filaments are constituted by nanometric elements. It is possible to deduce that the viscous forces are predominant, and the jet break-up did not occur.
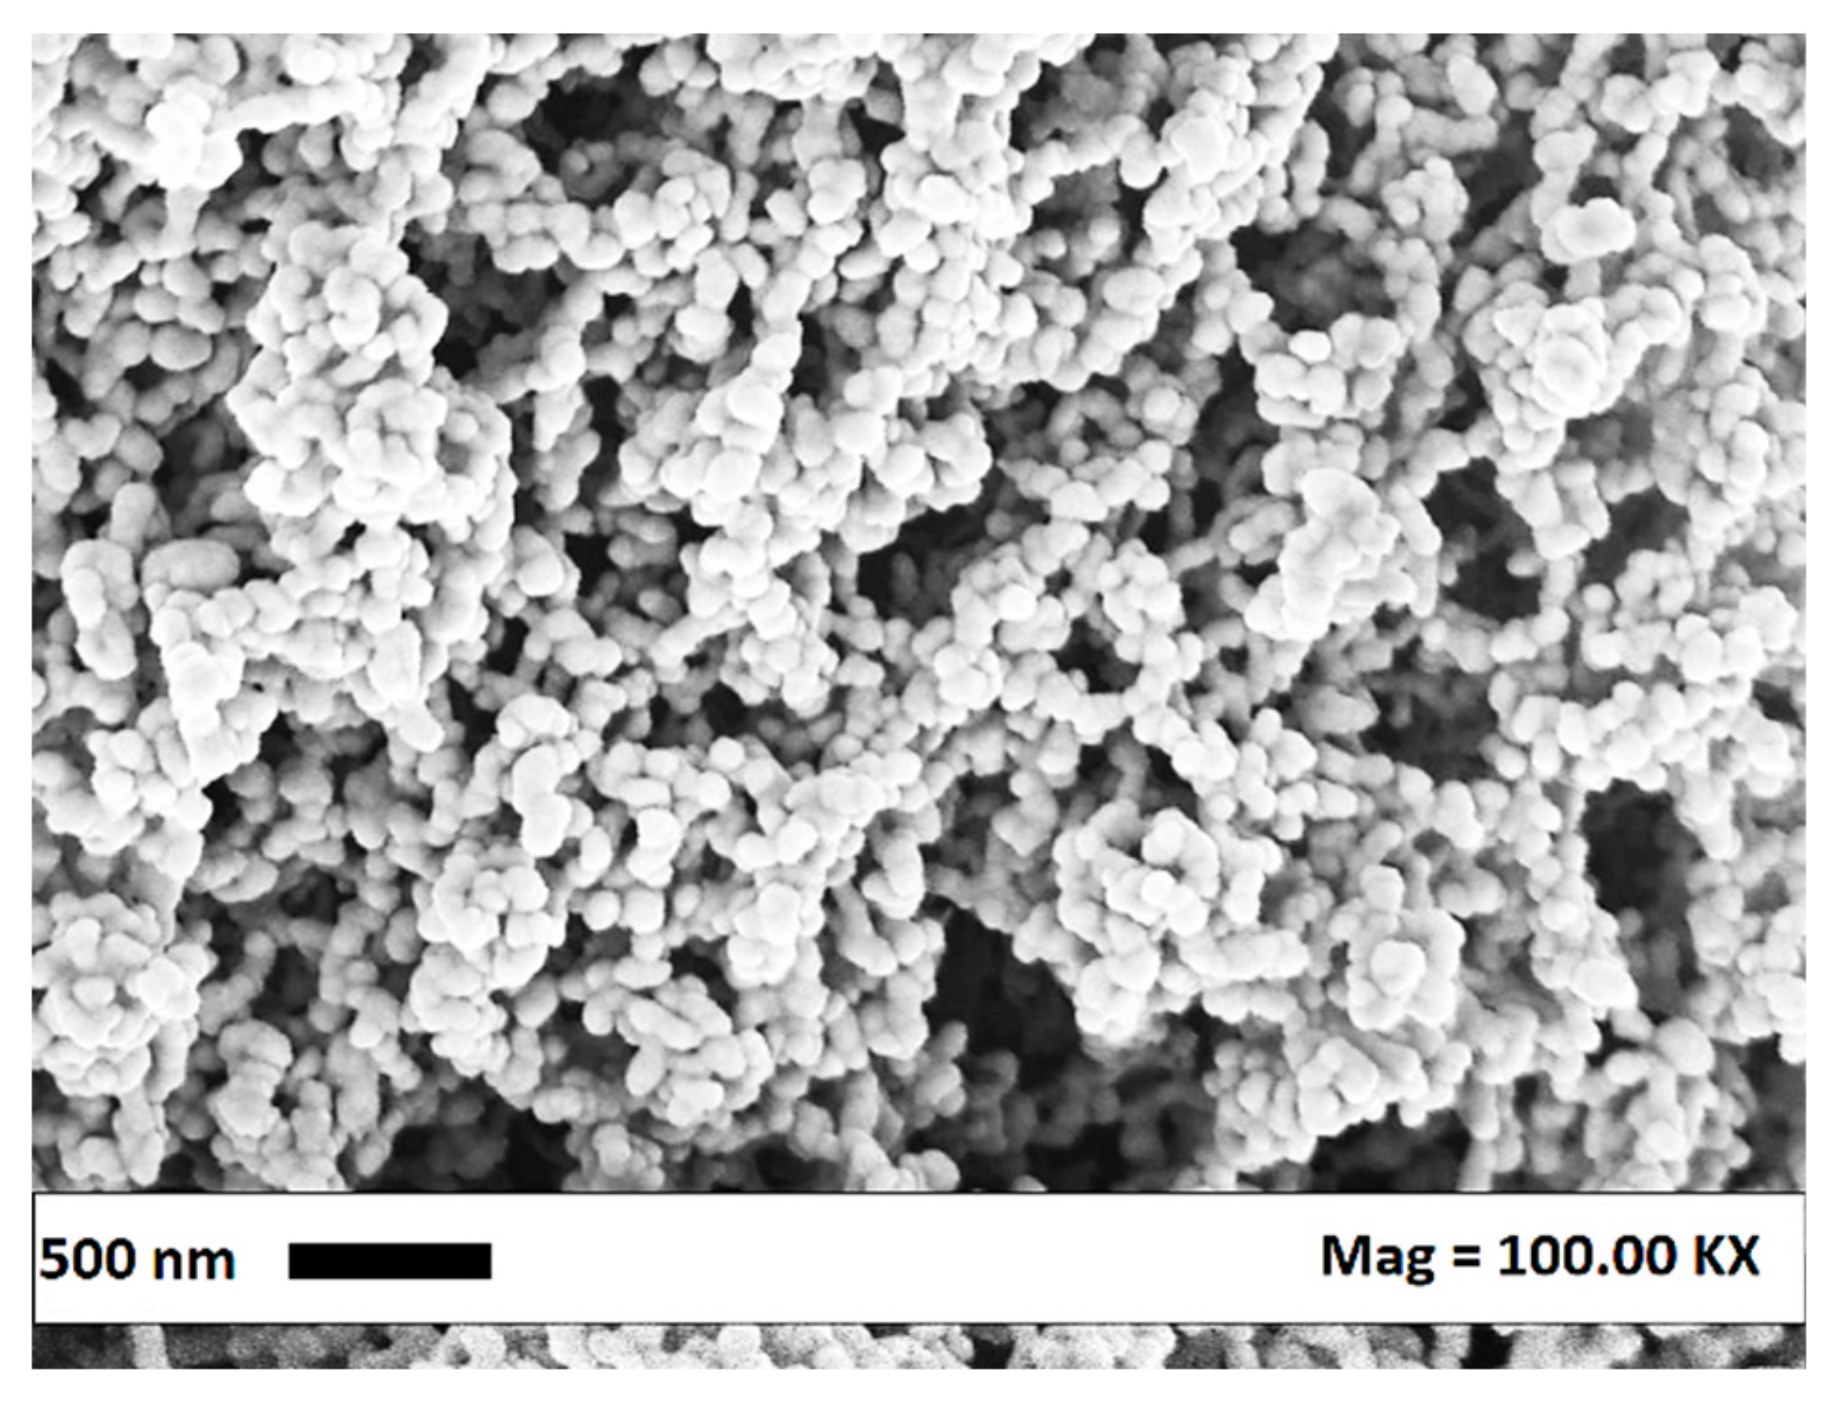
Increasing the pressure at 15 MPa (#5–7), in correspondence of all the tested temperatures, nanoparticles with mean diameters lower than 80 nm were precipitated. From the values of mean particle diameters and standard deviations reported in Table 1, it is possible to observe that increasing the temperature a slight increase in the mean diameter occurred.
The subsequent set of experiments (#8–15) was performed fixing the CA concentration in AC at 15 mg/mL. The observed trend is analogous to the one obtained at 10 mg/mL. At 12 MPa, nanostructured filaments were obtained, whereas at 15 MPa nanoparticles were obtained (see Figure 2 for an exemplificative FESEM image). In correspondence of the lower pressure and the higher temperature (9 MPa and 60 °C), the polymer precipitated in form of expanded microparticles with a mean diameter equal to about 16 µm. This morphology can be ascribed to the solute precipitation from a subcritical phase at high carbon dioxide molar fractions. In this case, the operating point is, in a pressure vs carbon dioxide molar fraction diagram, located on the right of the miscibility hole at pressures lower than the MCP pressure. Indeed, as stated in the first part of the Section 3.1, the presence of the polymer can shift the MCP towards higher pressures. This means that the operating point at 9 MPa can lie in the subcritical region.
A further increase of concentration at 20 and 30 mg/mL (#16–21) confirmed the results obtained at lower concentrations: EMP were precipitated at 9 MPa and nanostructured filaments at higher pressures. An exemplificative FESEM image of the EMP constituted by nanometric elements is reported in Figure 3. It is possible to observe that nanoparticles were not precipitated at concentrations higher than 20 mg/mL, even fixing the pressure at 15 MPa. This is ascribable to the high quantity of polymer present in the solution. Indeed, the particles are obtained because, when the liquid at the exit of the nozzle enters in contact with the scCO2, the surface tension is quickly reduced to zero: droplets are not formed because the time required for the zeroing of the surface tension is less than the jet break-up time and nanoparticles precipitated from the gas plume through nucleation and growth mechanisms [41]. At higher concentrations (20 and 30 mg/mL), which means higher viscosities of the liquid solution, the precipitated nanoparticles are forced by the cohesive effect of the viscosity to form nanostructured filaments.
3.1.2. AC/DMSO as the Liquid Solvent
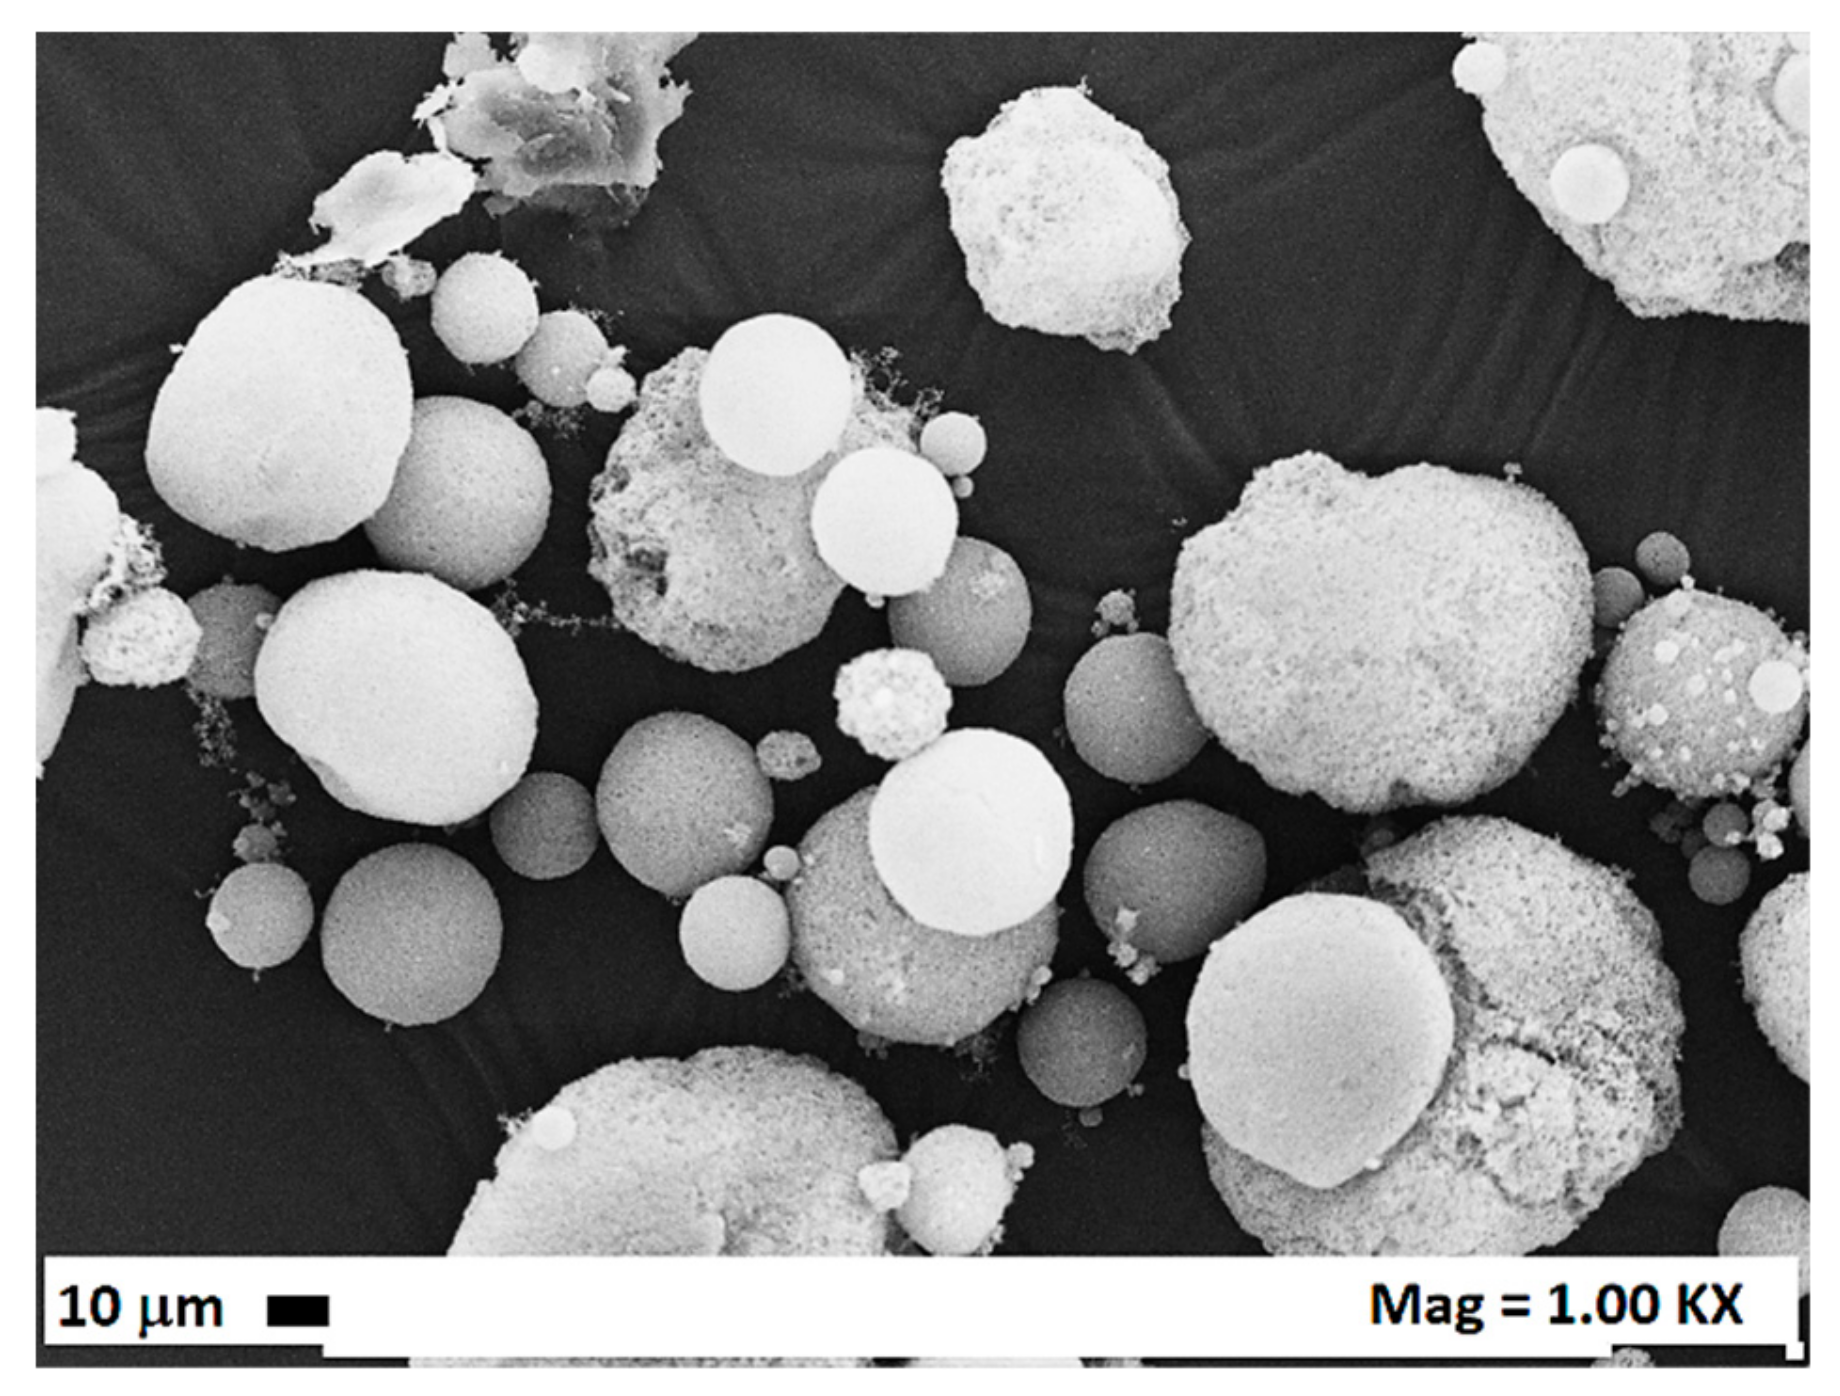
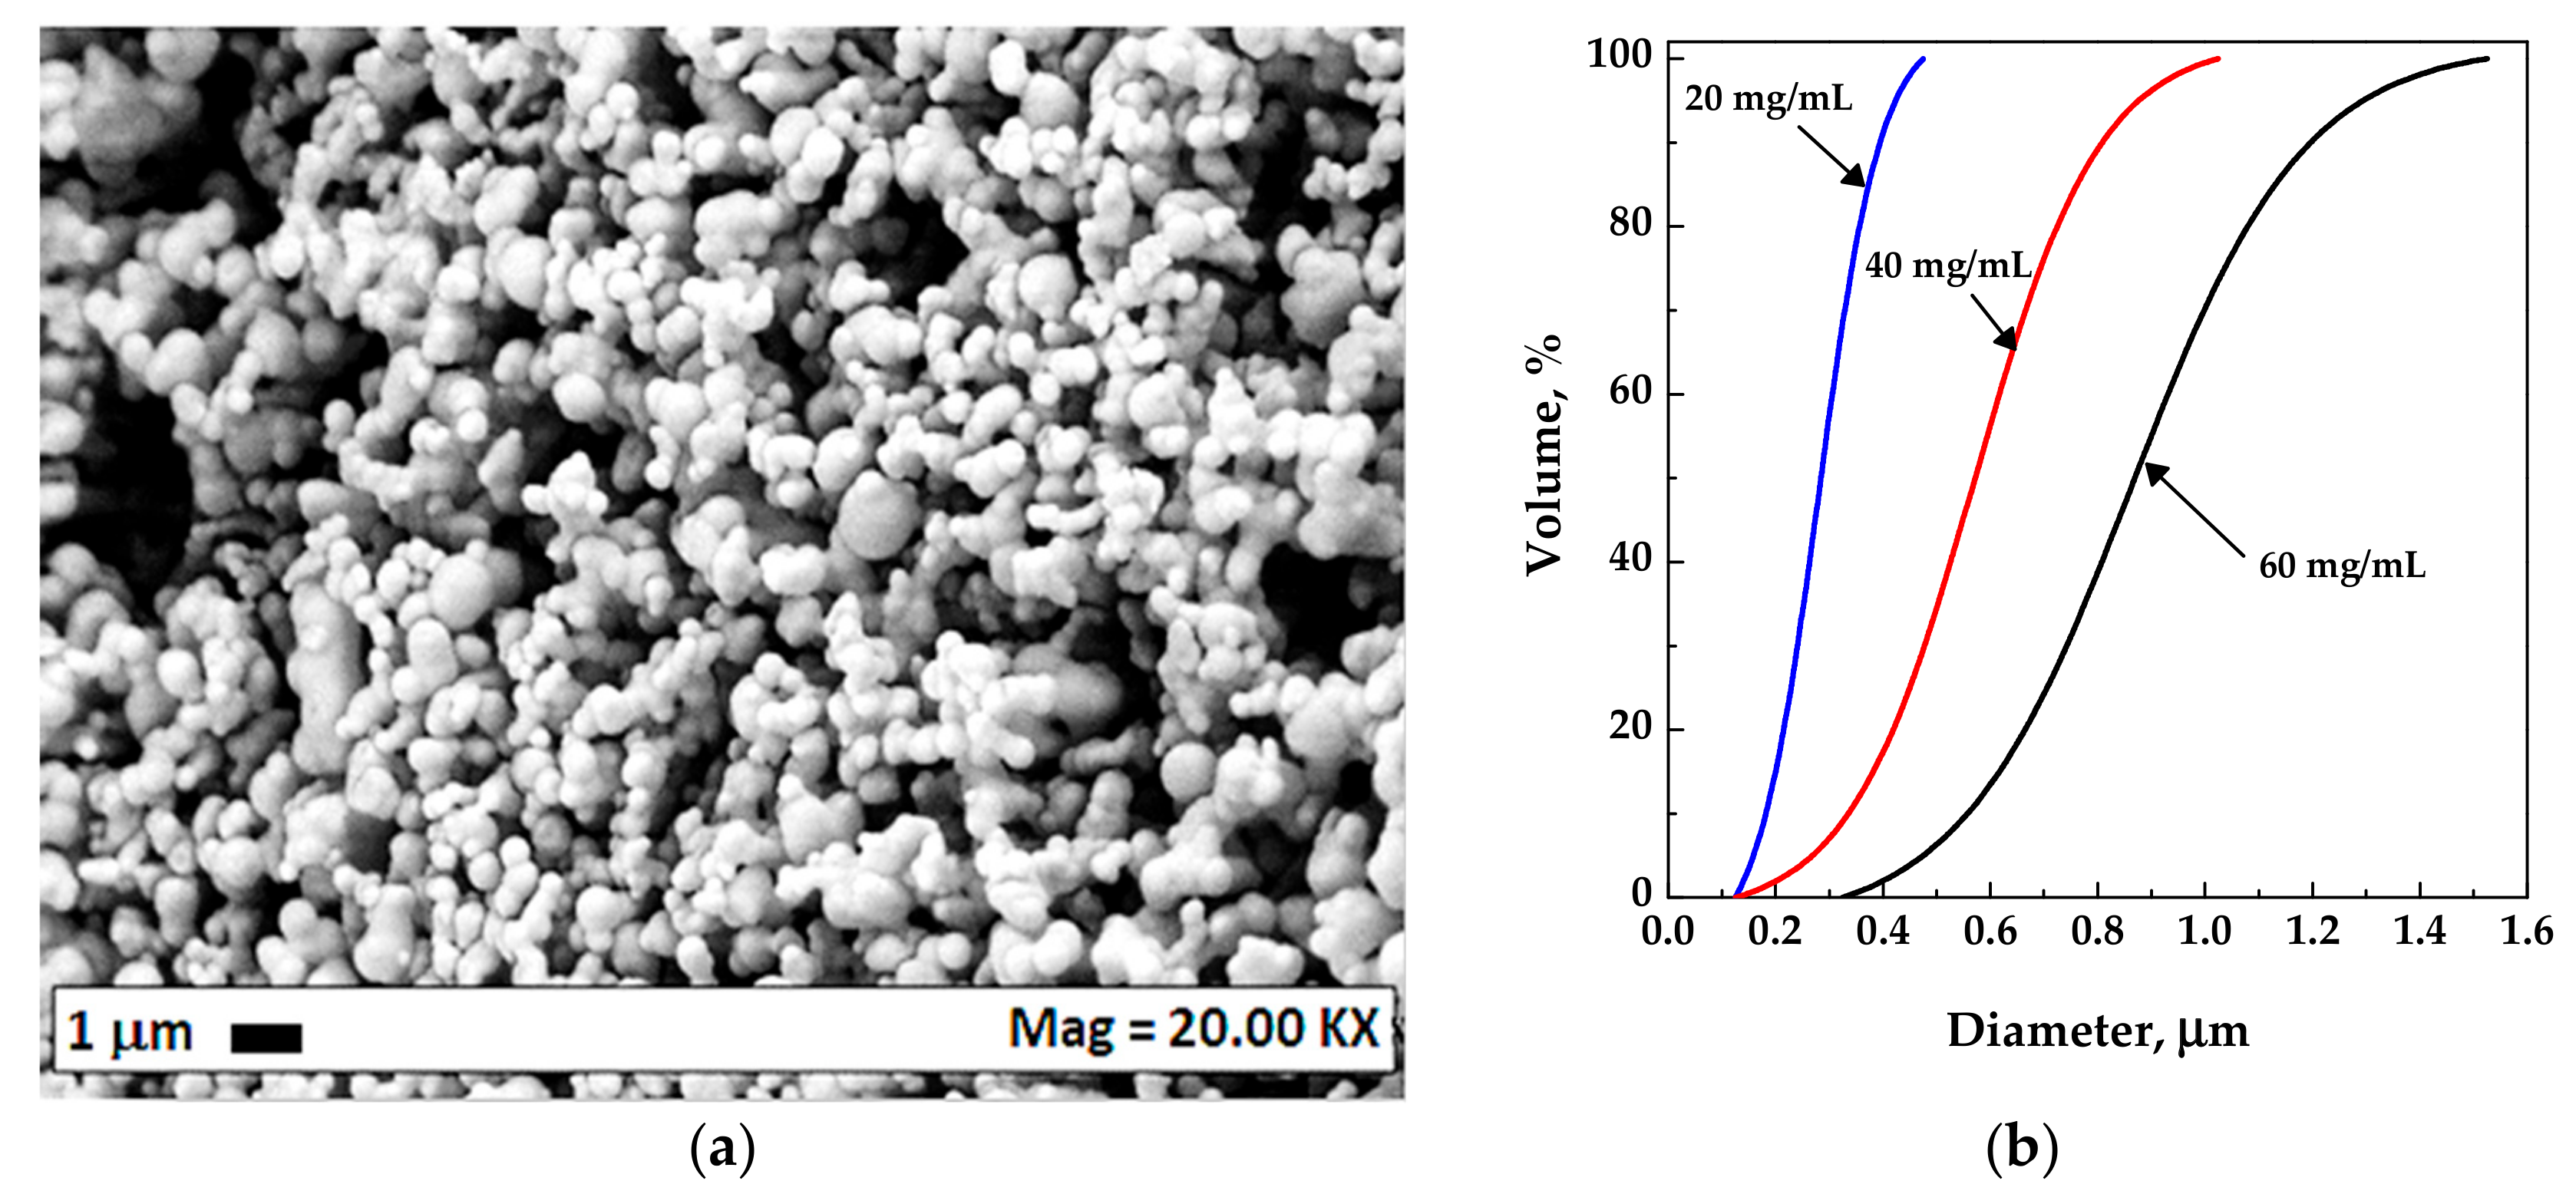
Considering that it is well known from the literature that microparticles are difficultly obtained using AC as the organic solvent, because of the very sharp transition from two-phases to one-phase behavior [42], CA was precipitated from mixtures constituted by AC/DMSO 50/50 v/v, with the aim of obtaining microparticles. Indeed, differently from AC, DMSO is characterized by a wide transition from two-phases to one-phase behavior and is one of the preferred solvents for the attainment of microparticles using the SAS process. For this set of experiments (#22–24), the operating pressure and temperature were fixed at 9 MPa and 40 °C respectively and the effect of CA concentration in the liquid solvent mixture was investigated. As it is possible to observe from the mean diameters and from the standard deviation values reported in Table 1, by increasing the concentration, the mean particle size increased, and the particle size distribution enlarged. In Figure 4, an exemplificative FESEM image (microparticles obtained at 40 mg/mL) and the volumetric cumulative particle size distributions of the microparticles obtained from the experiments #22–24 are reported.
3.2. Supercritical Phase Inversion Experiments
At concentrations higher than 30 mg/mL, it was not possible to inject the liquid solution inside the pressurized vessel because the nozzle was blocked from the too high viscosity of the solution. Therefore, at polymer concentrations from 40 to 320 mg/mL, supercritical phase inversion experiments were performed fixing the temperature at 45 °C and varying the pressure from 8 to 20 MPa, as reported in Table 2. The experimental parameters were chosen in agreement on the results obtained using similar polymeric solutions [24]. In particular, polymer concentration is usually comprised between 30 and 350 mg/mL, processing temperature between 35 and 55 °C and processing pressure between 8 and 25 MPa. Analyzing previous results on the supercritical phase inversion process [24,30], we verified as polymer concentration is a crucial parameter of the process, whereas the increase of temperature and the decrease of pressure leads to similar trends in terms of membranes morphology modification. For this reason, in this work, a large range of polymer concentration was explored (i.e., from 40 to 320 mg/mL) and only one parameter among temperature and pressure was varied during the experiments: temperature was fixed at 45 °C, that is a good compromise between scCO2 solvent power and diffusivity, whereas processing pressure was varied between 8 and 20 MPa, that is a standard operative range of the supercritical phase inversion process. As expected, changing the process parameters, we verified that it was possible to obtain different membranes morphologies. Indeed, as reported in previous works [24,30], polymer concentration, pressure, and temperature can affect the phase inversion mechanisms.
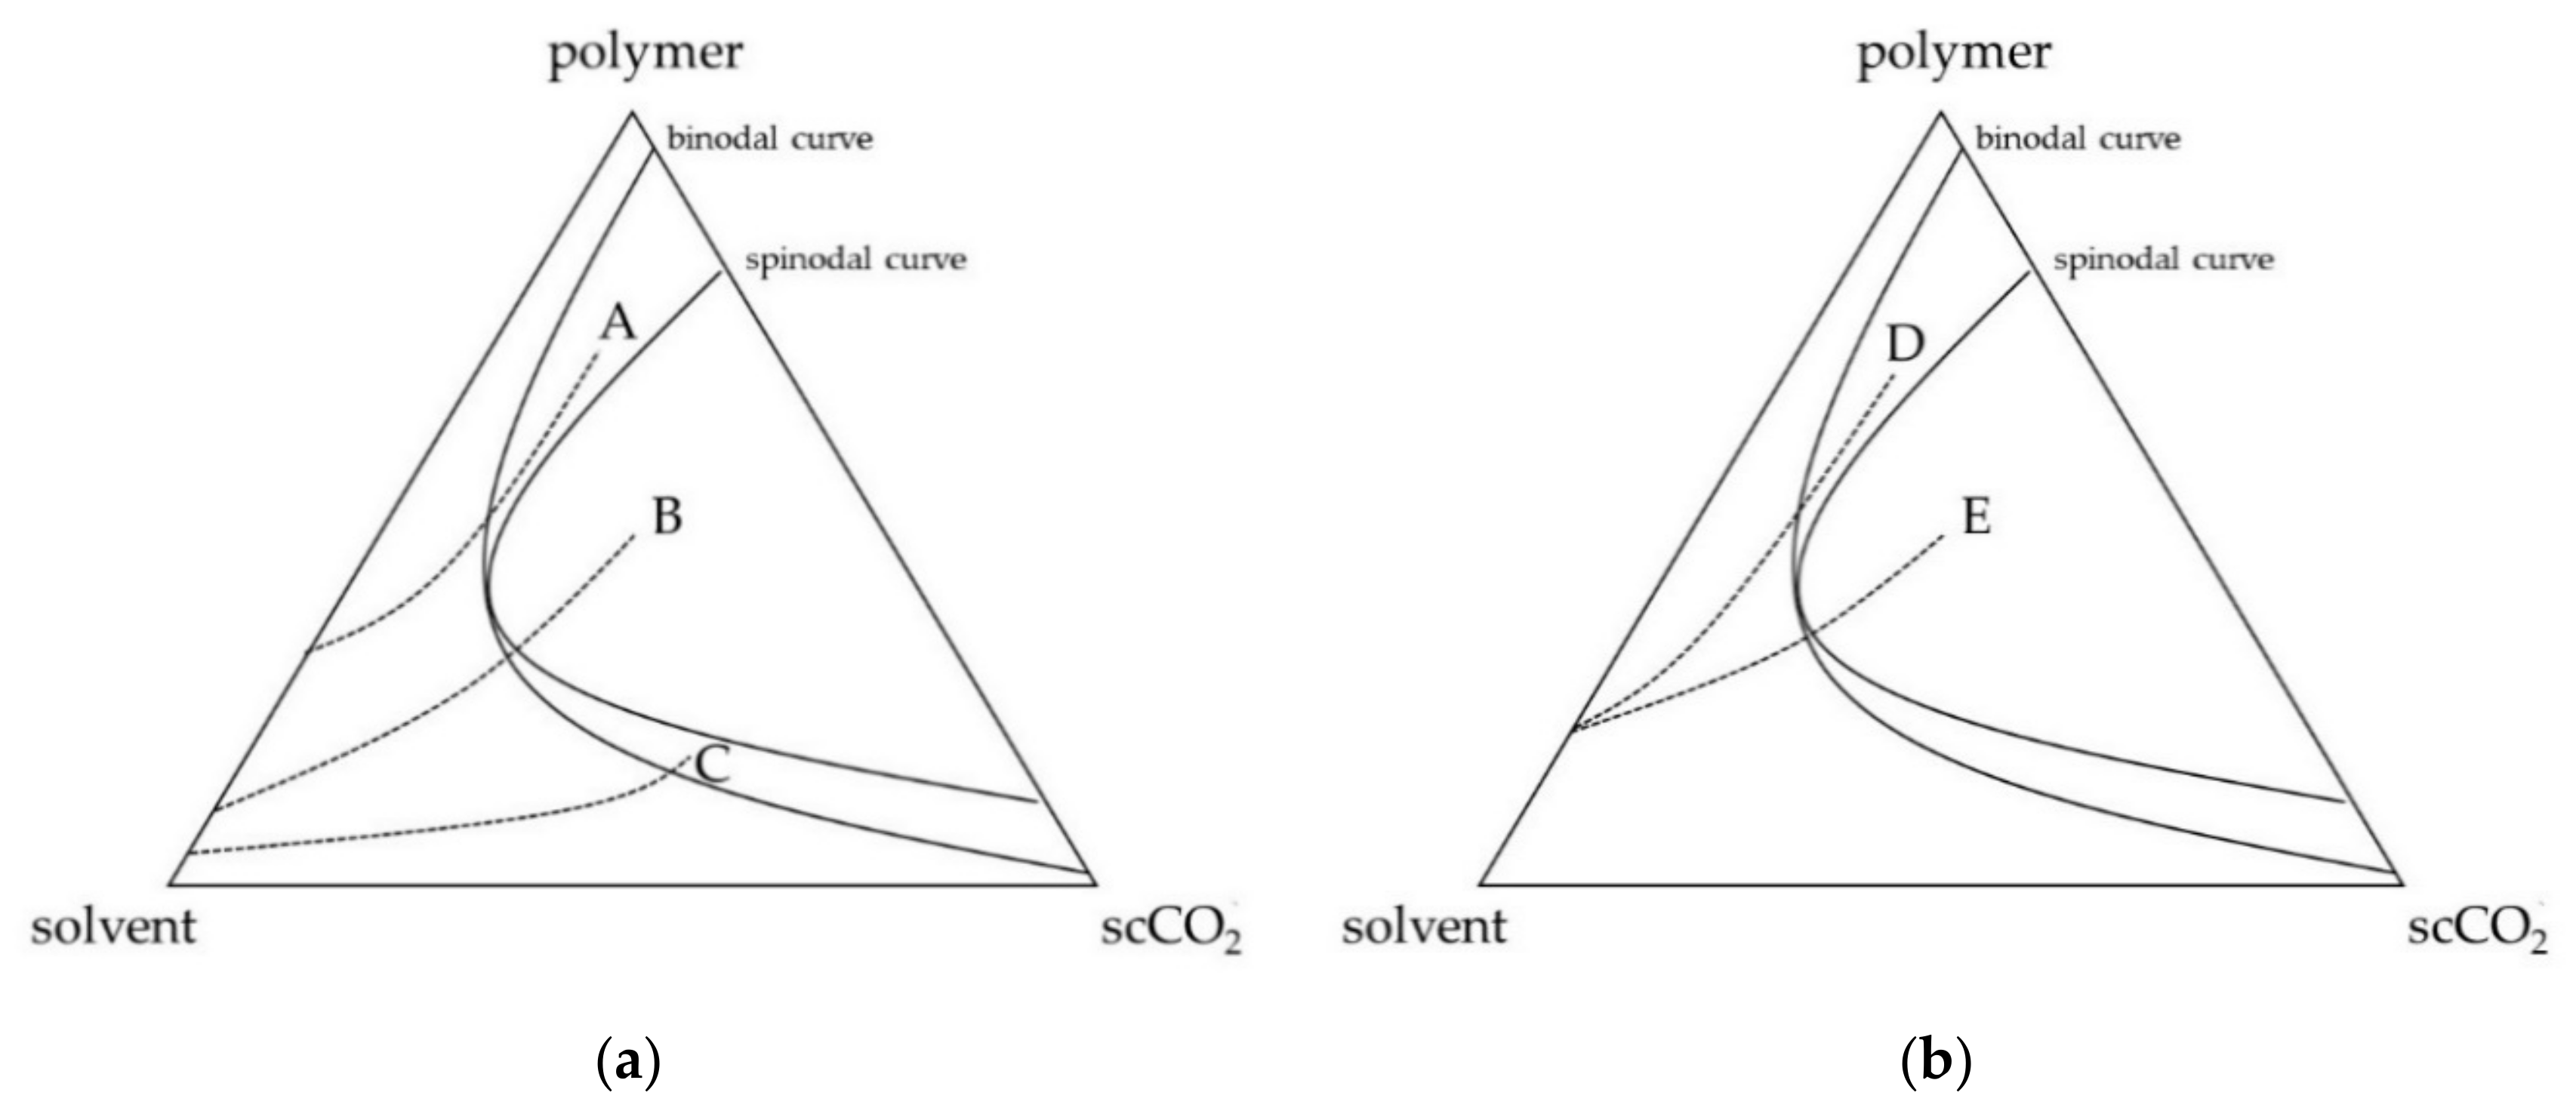
In particular, to understand the effect of the process parameters on the membranes’ morphologies, it is important to consider the ternary diagram formed by polymer, solvent and scCO2 and its miscibility hole, formed by an external binodal curve and an internal spinodal curve, as qualitatively represented in Figure 5a,b.
Indeed, depending on the demixing point, i.e., the point inside the miscibility hole in which the phase separation occurs, different morphologies can be obtained. The location of this point is related to process parameters:
- (a)
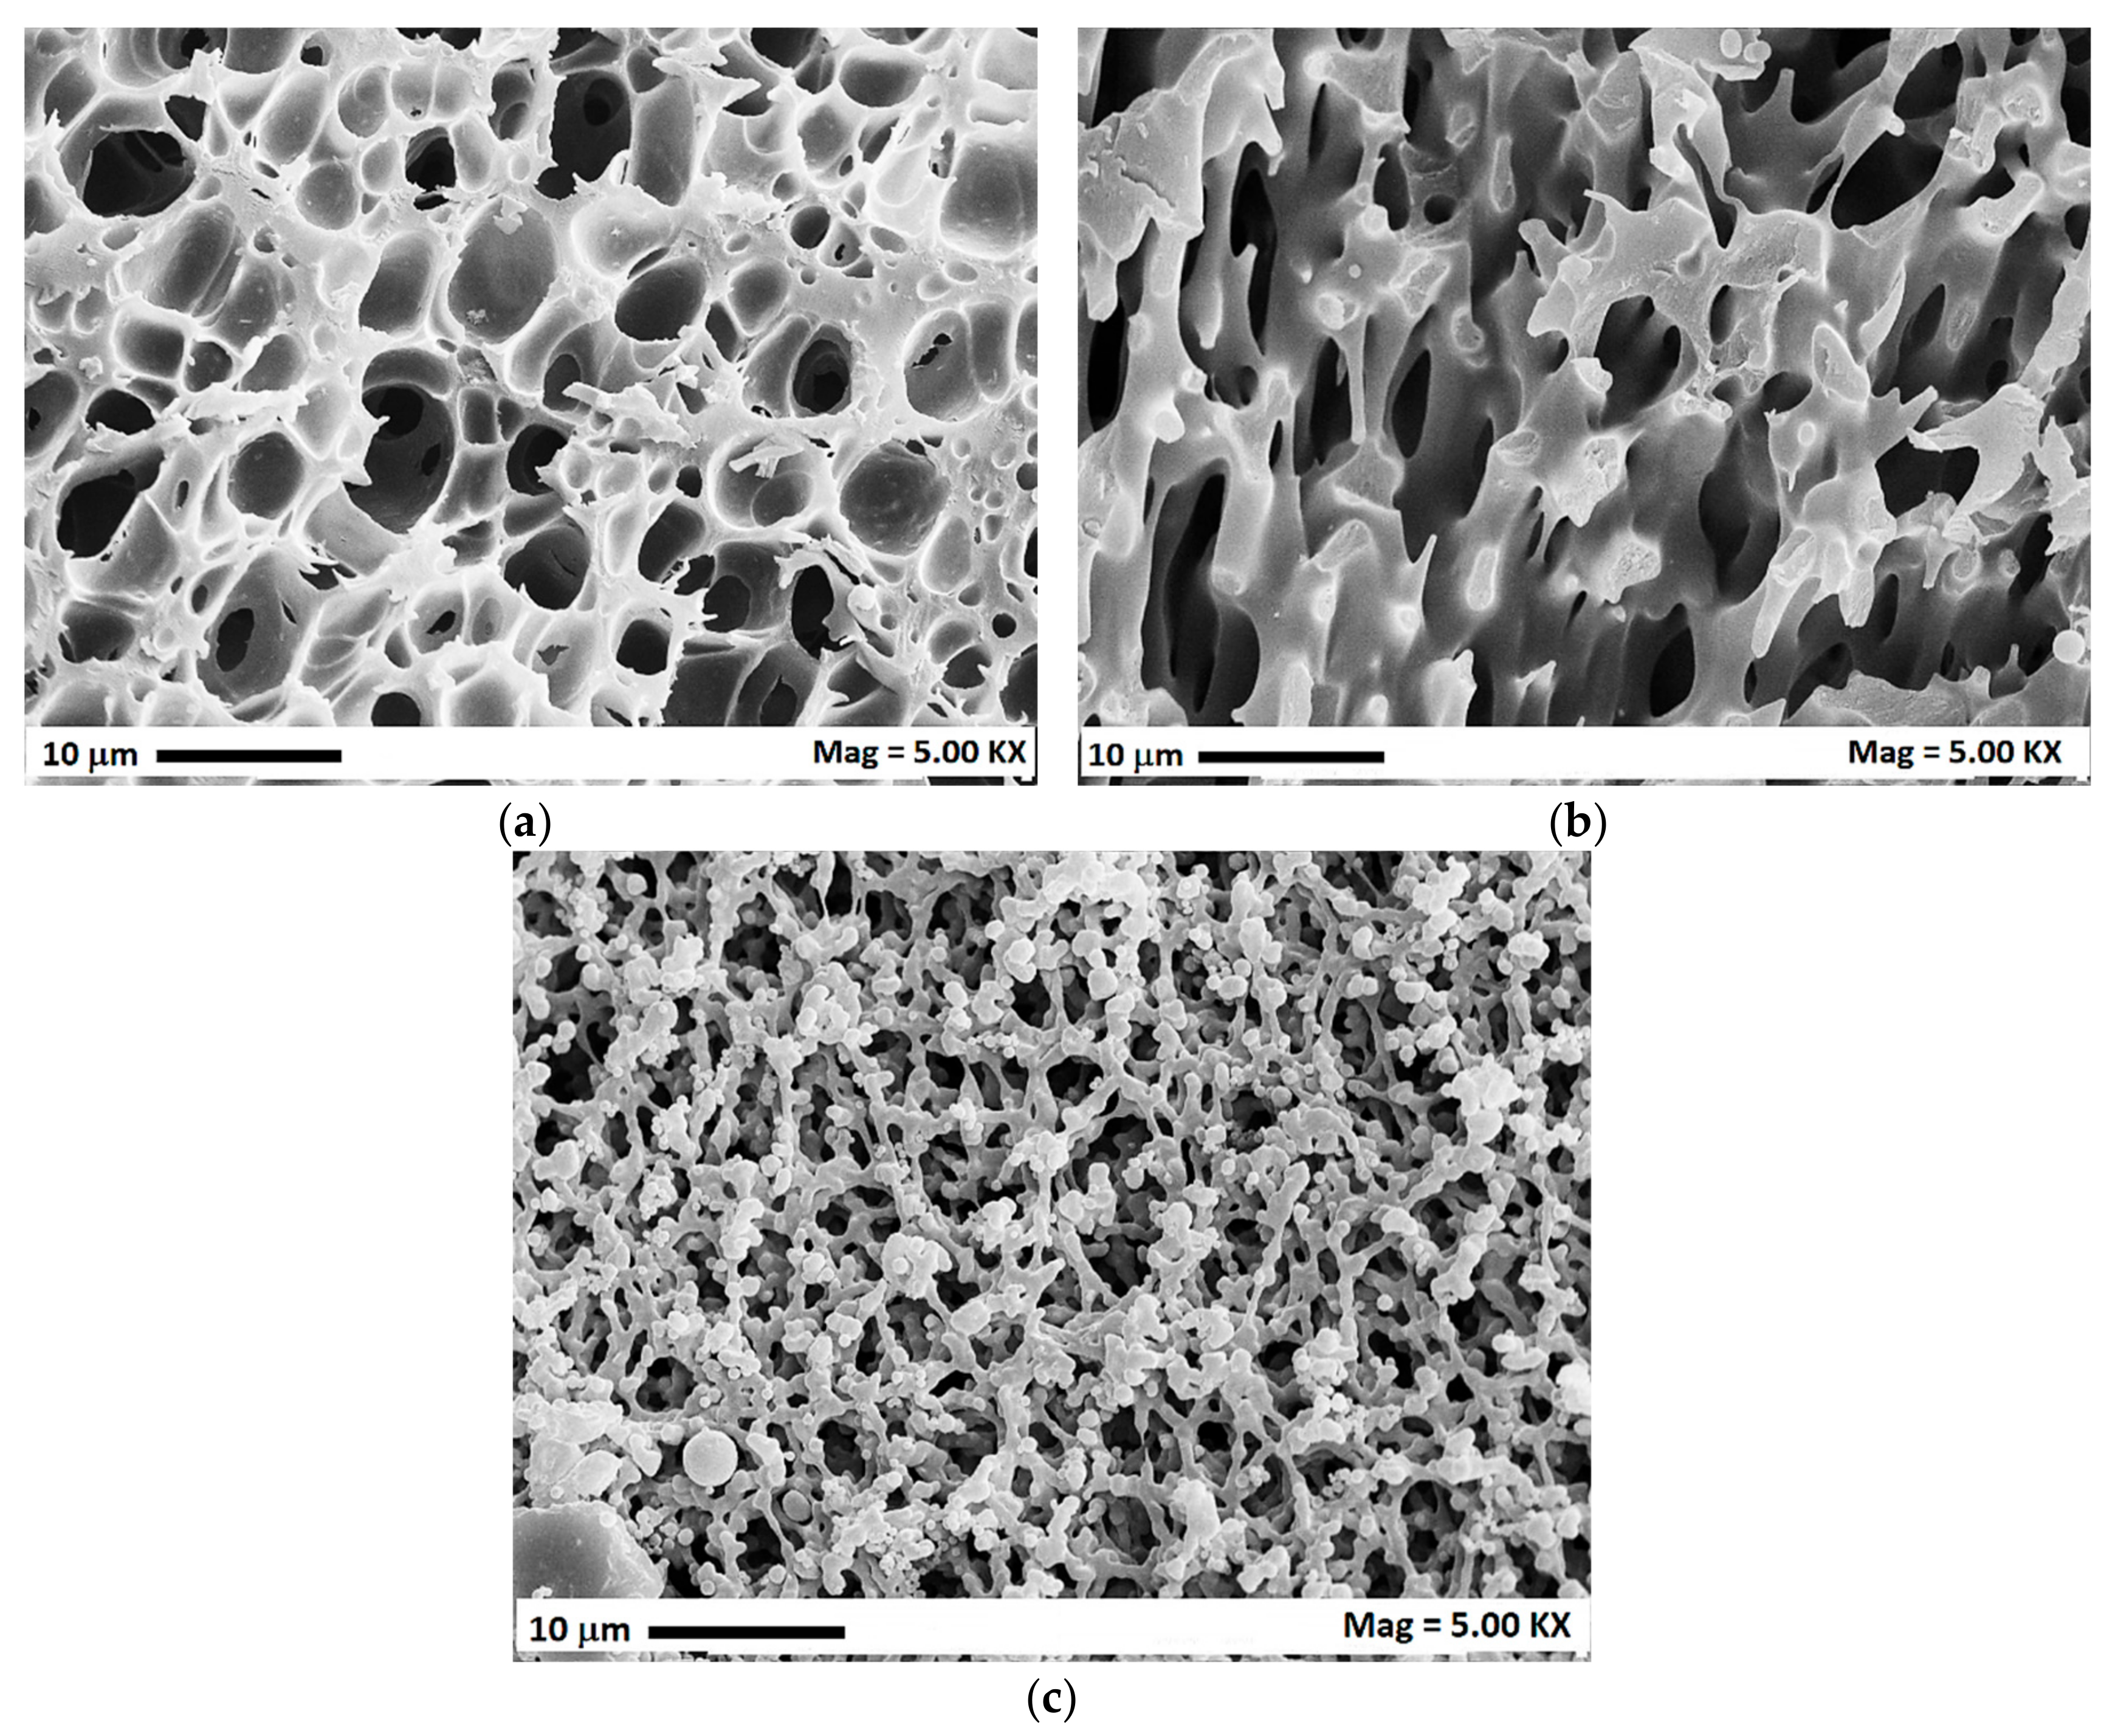
- starting from a high polymer concentration solution, the demixing point will be located in the upper part of the miscibility hole between the binodal and spinodal curves (point A in Figure 5a) and a liquid-liquid binodal demixing with nucleation and growth of the polymer-lean phase inside the polymer-rich phase occurs, generating a cellular structure membrane (CM). An examplificative FESEM image is reported in Figure 6a;
- (b)
- decreasing the polymer concentration of the starting solution, the phase inversion occurs in the central part of the demixing hole of the ternary diagram in which the demixing point is located inside the spinodal curve (point B in Figure 5a), where a spinodal demixing is favored, leading to the generation of a spinodal membrane morphology (SM). An example of this morphology is reported in Figure 6b;
- (c)
- starting from low polymer concentration solutions, the demixing point is located in the lower part of the miscibility hole, again between the binodal and spinodal curves (point C in Figure 5a); a liquid-liquid binodal demixing with nucleation and growth of the polymer-rich phase inside the polymer-lean phase is favored, leading to the formation of a bead-like membrane (BLM). An examplificative FESEM image is reported in Figure 6c.
It is possible to observe that also the variation of pressure (and temperature) can affect the final membranes’ morphology. Indeed, the pressure and temperature can act both on the miscibility hole area and shape inside the ternary diagram polymer-solvent-scCO2, and on the kinetics of the phase inversion; i.e., an increase of scCO2 solvent power (at higher pressure and lower temperature) can cause a modification of the ternary solution pathway inside the ternary diagram, leading to the formation of different morphologies. From Table 2, it is possible to observe that, starting from the same polymer concentration (for example 160 mg/mL), different morphologies can be obtained (CM and SM), simply varying the operating pressure from 10 to 20 MPa; a qualitative representation of this result is reported in Figure 5b. It is possible to suppose that, starting from the same polymer concentration, an increase of the pressure leads to a modification of the trajectory of the concentration pathway, and a consequent shift of the demixing point: operating at 10 MPa, the process is slower and the trajectory goes towards the polymer apex leading to the formation of a cellular structure (point D in Figure 5b); on the other hand, working at 20 MPa, the demixing process becomes faster and the trajectory tends to largely go towards the scCO2 apex, leading to the formation of a spinodal membrane (point E in Figure 5b). A further increase of the operating pressure could theoretically lead to the formation of microparticles, as already verified in previous works [24,30]. Then, in this experimentation, it is possible to suppose that the pressure affects the kinetics of the process, modifying the concentration pathways inside the ternary diagram of the system.
These results confirmed the high versatility of the scCO2 assisted phase inversion process, differently from what occurs with the traditional phase inversion methods.
4. Analyses
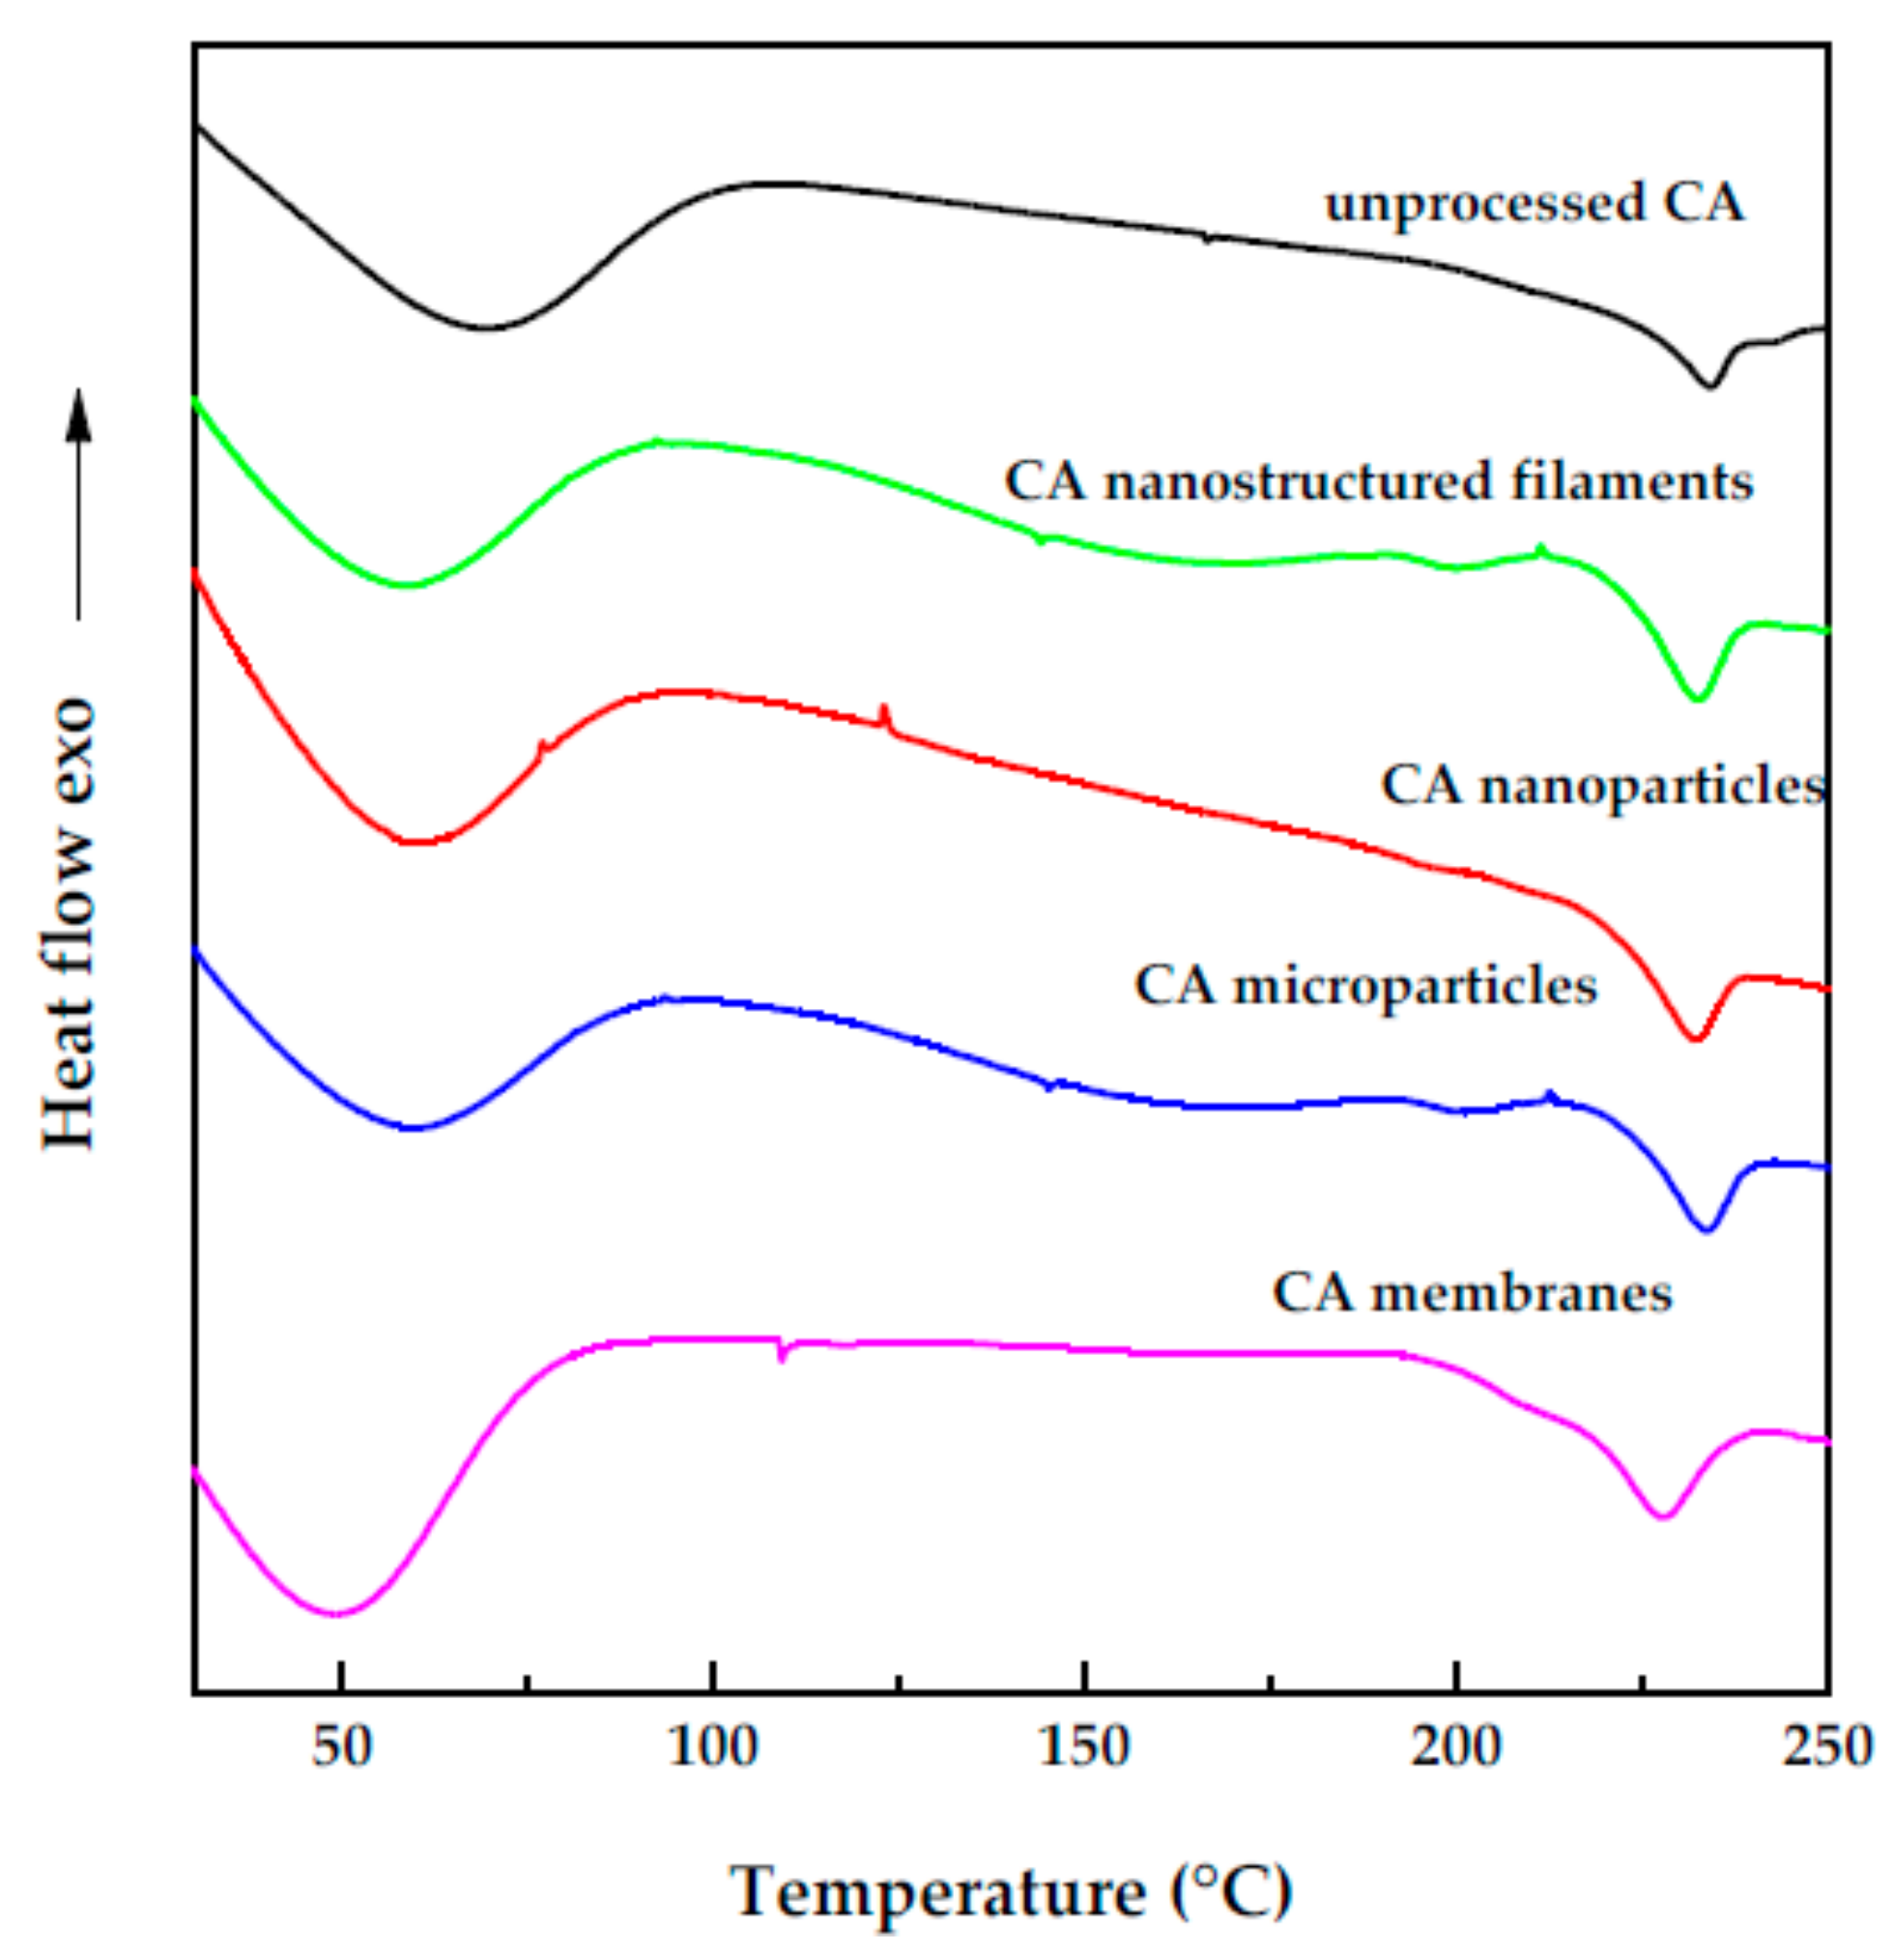
DSC thermograms of untreated cellulose acetate, SAS processed CA microparticles, nanoparticles and filaments, and phase inversion membranes are shown in Figure 7. A broad endothermic event between the ambient temperature and 100 °C is evident in all the DSC traces and is ascribable to the water desorption from the polymer. A second endothermic peak at about 230 °C can be visualized for all the traces and is related to the melting of the polymer. The DSC analysis indicated that neither the SAS process nor the phase inversion method altered the product structure.
5. Conclusions
Supercritical carbon dioxide-based techniques were applied to obtain different morphologies of cellulose acetate, using acetone or a mixture of acetone and DMSO as the liquid solvent. The versatility of the supercritical antisolvent based processes was confirmed. Indeed, nanoparticles, microparticles, nanostructured filaments, and membranes with different morphologies and pore structures were obtained with a unique plant simply varying the operating pressure, temperature, and concentration of the liquid solution.
Author Contributions
Both the authors designed and performed the experiments and analyzed the data; S.C. wrote the draft of the paper; I.D.M. reviewed and edited the paper. All authors have read and agreed to the published version of the manuscript.
Funding
This research received no external funding.
Conflicts of Interest
The authors declare no conflict of interest.
References
- Beck-Broichsitter, M.; Schweiger, C.; Schmehl, T.; Gessler, T.; Seeger, W.; Kissel, T. Characterization of novel spray-dried polymeric particles for controlled pulmonary drug delivery. J. Control. Release 2012, 158, 329–335. [Google Scholar] [CrossRef] [PubMed]
- Huang, C.; Thomas, N.L. Fabrication of porous fibers via electrospinning: Strategies and applications. Polym. Rev. 2019. [Google Scholar] [CrossRef]
- Gong, W.; Fu, H.; Zhang, C.; Ban, D.; Yin, X.; He, Y.; He, L.; Pei, X. Study on Foaming Quality and Impact Property of Foamed Polypropylene Composites. Polymers 2018, 10, 1375. [Google Scholar] [CrossRef] [PubMed] [Green Version]
- Long, L.-Y.; Weng, Y.-X.; Wang, Y.-Z. Cellulose aerogels: Synthesis, applications, and prospects. Polymers 2018, 10, 623. [Google Scholar] [CrossRef] [Green Version]
- Van de Witte, P.; Dijkstra, P.; Van den Berg, J.; Feijen, J. Phase separation processes in polymer solutions in relation to membrane formation. J. Membr. Sci. 1996, 117, 1–31. [Google Scholar] [CrossRef] [Green Version]
- Zhang, D.; Zhang, M.; Gu, X. Seaweed-Derived Hydrocolloids as Food Coating and Encapsulation Agents. In Bioactive Seaweeds for Food Applications; Qin, Y., Ed.; Elsevier: Amsterdam, The Netherlands, 2018; pp. 153–175. [Google Scholar]
- Kalluri, S.; Seng, K.H.; Guo, Z.; Liu, H.K.; Dou, S.X. Electrospun lithium metal oxide cathode materials for lithium-ion batteries. RSC Adv. 2013, 3, 25576–25601. [Google Scholar] [CrossRef]
- Jin, F.-L.; Zhao, M.; Park, M.; Park, S.-J. Recent Trends of Foaming in Polymer Processing: A Review. Polymers 2019, 11, 953. [Google Scholar] [CrossRef] [Green Version]
- Carter, C.B.; Norton, M.G. Sols, gels, and Organic Chemistry. In Ceramic Materials; Springer: New York, NY, USA, 2013; pp. 411–422. [Google Scholar]
- Yeo, S.-D.; Kiran, E. Formation of polymer particles with supercritical fluids: A review. J. Supercrit. Fluids 2005, 34, 287–308. [Google Scholar] [CrossRef]
- Garay, I.; Pocheville, A.; Madariaga, L. Polymeric microparticles prepared by supercritical antisolvent precipitation. Powder Technol. 2010, 197, 211–217. [Google Scholar] [CrossRef]
- Cardea, S.; Baldino, L.; Pisanti, P.; Reverchon, E. 3-D PLLA scaffolds formation by a supercritical freeze extraction assisted process. J. Mater. Sci. Mater. 2014, 25, 355–362. [Google Scholar] [CrossRef]
- Baldino, L.; Concilio, S.; Cardea, S.; Reverchon, E. Interpenetration of natural polymer aerogels by supercritical drying. Polymers 2016, 8, 106. [Google Scholar] [CrossRef] [PubMed]
- Yang, C.; Zhao, Q.; Xing, Z.; Zhang, W.; Zhang, M.; Tan, H.; Wang, J.; Wu, G. Improving the supercritical CO2 foaming of polypropylene by the addition of fluoroelastomer as a nucleation agent. Polymers 2019, 11, 226. [Google Scholar] [CrossRef] [PubMed] [Green Version]
- Montes, A.; Gordillo, M.D.; Pereyra, C.; Martínez de la Ossa, E.J. Polymer and ampicillin co-precipitation by supercritical antisolvent process. J. Supercrit. Fluids 2012, 63, 92–98. [Google Scholar] [CrossRef]
- De Marco, I.; Reverchon, E. Starch aerogel loaded with poorly water-soluble vitamins through supercritical CO2 adsorption. Chem. Eng. Res. Des. 2017, 119, 221–230. [Google Scholar] [CrossRef]
- Montes, A.; Merino, R.; De Los Santos, D.M.; Pereyra, C.; Martínez De La Ossa, E.J. Micronization of vanillin by rapid expansion of supercritical solutions process. J. CO2 Util. 2017, 21, 169–176. [Google Scholar] [CrossRef]
- Franco, P.; Reverchon, E.; De Marco, I. Zein/diclofenac sodium coprecipitation at micrometric and nanometric range by supercritical antisolvent processing. J. CO2 Util. 2018, 27, 366–373. [Google Scholar] [CrossRef]
- Barrett, A.M.; Dehghani, F.; Foster, N.R. Increasing the Dissolution Rate of Itraconazole Processed by Gas Antisolvent Techniques using Polyethylene Glycol as a Carrier. Pharm. Res. 2007, 25, 1274–1289. [Google Scholar] [CrossRef]
- Reverchon, E.; Antonacci, A. Polymer microparticles production by supercritical assisted atomization. J. Supercrit. Fluids 2007, 39, 444–452. [Google Scholar] [CrossRef]
- Martín, Á.; Pham, H.M.; Kilzer, A.; Kareth, S.; Weidner, E. Micronization of polyethylene glycol by PGSS (Particles from Gas Saturated Solutions)-drying of aqueous solutions. Chem. Eng. Process. 2010, 49, 1259–1266. [Google Scholar] [CrossRef]
- Della Porta, G.; Campardelli, R.; Falco, N.; Reverchon, E. PLGA microdevices for retinoids sustained release produced by supercritical emulsion extraction: Continuous versus batch operation layouts. J. Pharm. Sci. 2011, 100, 4357–4367. [Google Scholar] [CrossRef]
- De Marco, I.; Reverchon, E. Nanostructured cellulose acetate filaments produced by supercritical antisolvent precipitation. J. Supercrit. Fluids 2011, 55, 1095–1103. [Google Scholar] [CrossRef]
- Reverchon, E.; Cardea, S.; Rapuano, C. Formation of poly-vinyl-alcohol structures by supercritical CO2. J. Appl. Pol. Sci. 2007, 104, 3151–3160. [Google Scholar] [CrossRef]
- Di Maio, E.; Kiran, E. Foaming of polymers with supercritical fluids and perspectives on the current knowledge gaps and challenges. J. Supercrit. Fluids 2018, 134, 157–166. [Google Scholar] [CrossRef]
- Mallepally, R.R.; Marin, M.A.; Surampudi, V.; Subia, B.; Rao, R.R.; Kundu, S.C.; McHugh, M.A. Silk fibroin aerogels: Potential scaffolds for tissue engineering applications. Biomed. Mater. 2015, 10, 035002. [Google Scholar] [CrossRef] [PubMed]
- Edgar, K.J. Cellulose esters in drug delivery. Cellulose 2007, 14, 49–64. [Google Scholar] [CrossRef]
- Edgar, K.J.; Buchanan, C.M.; Debenham, J.S.; Rundquist, P.A.; Seiler, B.D.; Shelton, M.C.; Tindall, D. Advances in cellulose ester performance and application. Prog. Polym. Sci. 2001, 26, 1605–1688. [Google Scholar] [CrossRef]
- Des Rieux, A.; Fievez, V.; Garinot, M.; Schneider, Y.-J.; Préat, V. Nanoparticles as potential oral delivery systems of proteins and vaccines: A mechanistic approach. J. Control. Release 2006, 116, 1–27. [Google Scholar] [CrossRef]
- Reverchon, E.; Cardea, S. Formation of cellulose acetate membranes using a supercritical fluid assisted process. J. Membr. Sci. 2004, 240, 187–195. [Google Scholar] [CrossRef]
- Martson, M.; Viljanto, J.; Hurme, T.; Laippala, P.; Saukko, P. Is cellulose sponge degradable or stable as implantation material? An in vivo subcutaneous study in the rat. Biomaterials 1999, 20, 1989–1995. [Google Scholar]
- Son, W.K.; Youk, J.H.; Lee, T.S.; Park, W.H. Electrospinning of ultrafine cellulose acetate fibers: Studies of a new solvent system and deacetylation of ultrafine cellulose acetate fibers. J. Polym. Sci. Pol. Phys. 2004, 42, 5–11. [Google Scholar] [CrossRef]
- Son, W.K.; Youk, J.H.; Park, W.H. Antimicrobial cellulose acetate nanofibers containing silver nanoparticles. Carbohydr. Polym. 2006, 65, 430–434. [Google Scholar] [CrossRef]
- Taepaiboon, P.; Rungsardthong, U.; Supaphol, P. Vitamin-loaded electrospun cellulose acetate nanofiber mats as transdermal and dermal therapeutic agents of vitamin A acid and vitamin E. Eur. J. Pharm. Biopharm. 2007, 67, 387–397. [Google Scholar] [CrossRef] [PubMed]
- Kumar, B.P.; Chandiran, I.S.; Jayaveera, K.N. Formulation and evaluation of glimepiride loaded cellulose acetate microparticles. Int. J. Pharm. Pharm. Sci. 2014, 6, 511–515. [Google Scholar]
- De Marco, I.; Prosapio, V.; Cice, F.; Reverchon, E. Use of solvent mixtures in supercritical antisolvent process to modify precipitates morphology: Cellulose acetate microparticles. J. Supercrit. Fluids 2013, 83, 153–160. [Google Scholar] [CrossRef]
- Kulterer, M.R.; Reischl, M.; Reichel, V.E.; Hribernik, S.; Wu, M.; Kostler, S.; Kargl, R.; Ribitsch, V. Nanoprecipitation of cellulose acetate using solvent/nonsolvent mixtures as dispersive media. Colloids Surf. A Physicochem. Eng. Asp. 2011, 375, 23–29. [Google Scholar] [CrossRef]
- XXXI United States Pharmacopeia. General Chapter <467>, Organic Volatile Impurities; XXXI United States Pharmacopeia: Rockville, MD, USA, 2007. [Google Scholar]
- Campardelli, R.; Reverchon, E.; De Marco, I. Dependence of SAS particle morphologies on the ternary phase equilibria. J. Supercrit. Fluids 2017, 130 (Suppl. C), 273–281. [Google Scholar] [CrossRef]
- Campardelli, R.; Reverchon, E.; De Marco, I. PVP microparticles precipitation from acetone-ethanol mixtures using SAS process: Effect of phase behavior. J. Supercrit. Fluids 2019, 143, 321–329. [Google Scholar] [CrossRef]
- Reverchon, E.; De Marco, I. Mechanisms controlling supercritical antisolvent precipitate morphology. Chem. Eng. J. 2011, 169, 358–370. [Google Scholar] [CrossRef]
- De Marco, I.; Knauer, O.; Cice, F.; Braeuer, A.; Reverchon, E. Interactions of phase equilibria, jet fluid dynamics and mass transfer during supercritical antisolvent micronization: The influence of solvents. Chem. Eng. J. 2012, 203, 71–80. [Google Scholar] [CrossRef]
Figure 1.
CA filaments obtained at 12 MPa, 35 °C and 10 mg/mL; (a) FESEM image at 5 KX; (b) FESEM image at 40 KX.
Figure 1.
CA filaments obtained at 12 MPa, 35 °C and 10 mg/mL; (a) FESEM image at 5 KX; (b) FESEM image at 40 KX.

Figure 2.
CA nanoparticles obtained at 15 MPa, 60 °C and 15 mg/mL.

Figure 3.
Expanded microparticles obtained at 9 MPa, 60 °C and 20 mg/mL.

Figure 4.
Microparticles obtained at 9 MPa, 40 °C; (a) exemplificative FESEM image for the particles precipitated at 40 mg/mL; (b) particle size distributions with the effect of the concentration.
Figure 4.
Microparticles obtained at 9 MPa, 40 °C; (a) exemplificative FESEM image for the particles precipitated at 40 mg/mL; (b) particle size distributions with the effect of the concentration.

Figure 5.
Qualitative ternary diagrams; (a) paths at different starting polymer concentrations at 8 MPa and 45 °C; (b) paths at different operating pressures at 160 mg/mL and 45 °C.
Figure 5.
Qualitative ternary diagrams; (a) paths at different starting polymer concentrations at 8 MPa and 45 °C; (b) paths at different operating pressures at 160 mg/mL and 45 °C.

Figure 6.
Different membrane morphologies obtained at 8 MPa, 45 °C and different polymer concentrations (40, 80 e 240 mg/mL): (a) cellular membrane; (b) spinodal membrane; (c) beads-like membrane.
Figure 6.
Different membrane morphologies obtained at 8 MPa, 45 °C and different polymer concentrations (40, 80 e 240 mg/mL): (a) cellular membrane; (b) spinodal membrane; (c) beads-like membrane.

Figure 7.
DSC thermograms for unprocessed CA, SAS processed CA and CA membranes; exo indicates exothermic flow.
Figure 7.
DSC thermograms for unprocessed CA, SAS processed CA and CA membranes; exo indicates exothermic flow.


Table 1.
List of the performed experiments using supercritical antisolvent precipitation. NF: nanostructured filaments; NP: nanoparticles; MP: microparticles; EMP: expanded microparticles.
Table 1.
List of the performed experiments using supercritical antisolvent precipitation. NF: nanostructured filaments; NP: nanoparticles; MP: microparticles; EMP: expanded microparticles.
| # | c, mg/mL | P, MPa | T, °C | Morph. | m.d. ± s.d., nm | Figure |
|---|---|---|---|---|---|---|
| AC as the liquid solvent | ||||||
| 1 | 10 | 9 | 40 | NF | 92 ± 22 | |
| 2 | 12 | 35 | NF | 78 ± 18 | Figure 1a,b | |
| 3 | 40 | NF | 80 ± 20 | |||
| 4 | 50 | NF | 108 ± 21 | |||
| 5 | 15 | 35 | NP | 76 ± 14 | ||
| 6 | 40 | NP | 78 ± 15 | |||
| 7 | 50 | NP | 82 ± 19 | |||
| 8 | 15 | 9 | 60 | EMP | 16,070 ± 6170 | |
| 9 | 12 | 35 | NF | 100 ± 22 | ||
| 10 | 40 | NF | 108 ± 24 | |||
| 11 | 50 | NF | 110 ± 24 | |||
| 12 | 60 | NF | 114 ± 26 | |||
| 13 | 15 | 35 | NP | 78 ± 14 | ||
| 14 | 50 | NP | 80 ± 15 | |||
| 15 | 60 | NP | 83 ± 16 | Figure 2 | ||
| 16 | 20 | 9 | 60 | EMP | 30,600 ± 15,230 | Figure 3 |
| 17 | 12 | 40 | NF | 109 ± 25 | ||
| 18 | 15 | 40 | NF | 102 ± 22 | ||
| 19 | 30 | 9 | 60 | EMP | 31,300 ± 16,200 | |
| 20 | 12 | 40 | NF | 132 ± 28 | ||
| 21 | 15 | 40 | NF | 112 ± 23 | ||
| AC/DMSO 50/50 as the liquid solvent | ||||||
| 22 | 20 | 9 | 40 | MP | 232 ± 50 | |
| 23 | 40 | MP | 403 ± 160 | Figure 4 | ||
| 24 | 60 | MP | 670 ± 60 | |||
Table 2.
List of the performed experiments using supercritical phase inversion. CM: cellular membrane; SM: spinodal membrane; BLM: beads-like membrane.
Table 2.
List of the performed experiments using supercritical phase inversion. CM: cellular membrane; SM: spinodal membrane; BLM: beads-like membrane.
| # | c, mg/mL | P, MPa | T, °C | Morph. | Figure |
|---|---|---|---|---|---|
| 25 | 40 | 8 | 45 | BLM | Figure 6c |
| 26 | 10 | BLM | |||
| 27 | 20 | BLM | |||
| 28 | 80 | 8 | 45 | SM | Figure 6b |
| 29 | 10 | SM | |||
| 30 | 20 | SM | |||
| 31 | 160 | 8 | 45 | CM | |
| 32 | 10 | CM | |||
| 33 | 20 | SM | |||
| 34 | 240 | 8 | 45 | CM | Figure 6a |
| 35 | 10 | CM | |||
| 36 | 320 | 10 | 45 | CM |
© 2020 by the authors. Licensee MDPI, Basel, Switzerland. This article is an open access article distributed under the terms and conditions of the Creative Commons Attribution (CC BY) license (http://creativecommons.org/licenses/by/4.0/).
Share and Cite
MDPI and ACS Style
Cardea, S.; De Marco, I. Cellulose Acetate and Supercritical Carbon Dioxide: Membranes, Nanoparticles, Microparticles and Nanostructured Filaments. Polymers 2020, 12, 162. https://0-doi-org.brum.beds.ac.uk/10.3390/polym12010162
AMA Style
Cardea S, De Marco I. Cellulose Acetate and Supercritical Carbon Dioxide: Membranes, Nanoparticles, Microparticles and Nanostructured Filaments. Polymers. 2020; 12(1):162. https://0-doi-org.brum.beds.ac.uk/10.3390/polym12010162
Chicago/Turabian StyleCardea, Stefano, and Iolanda De Marco. 2020. "Cellulose Acetate and Supercritical Carbon Dioxide: Membranes, Nanoparticles, Microparticles and Nanostructured Filaments" Polymers 12, no. 1: 162. https://0-doi-org.brum.beds.ac.uk/10.3390/polym12010162
Note that from the first issue of 2016, this journal uses article numbers instead of page numbers. See further details here.