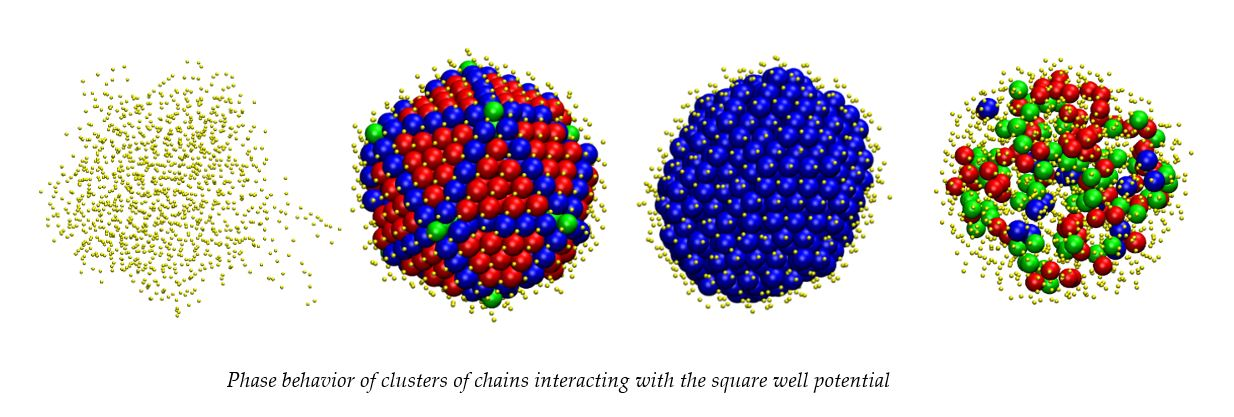
Crystal, Fivefold and Glass Formation in Clusters of Polymers Interacting with the Square Well Potential


Abstract
:
1. Introduction
2. Molecular Model, Simulation Algorithm and Systems Studied
3. Results
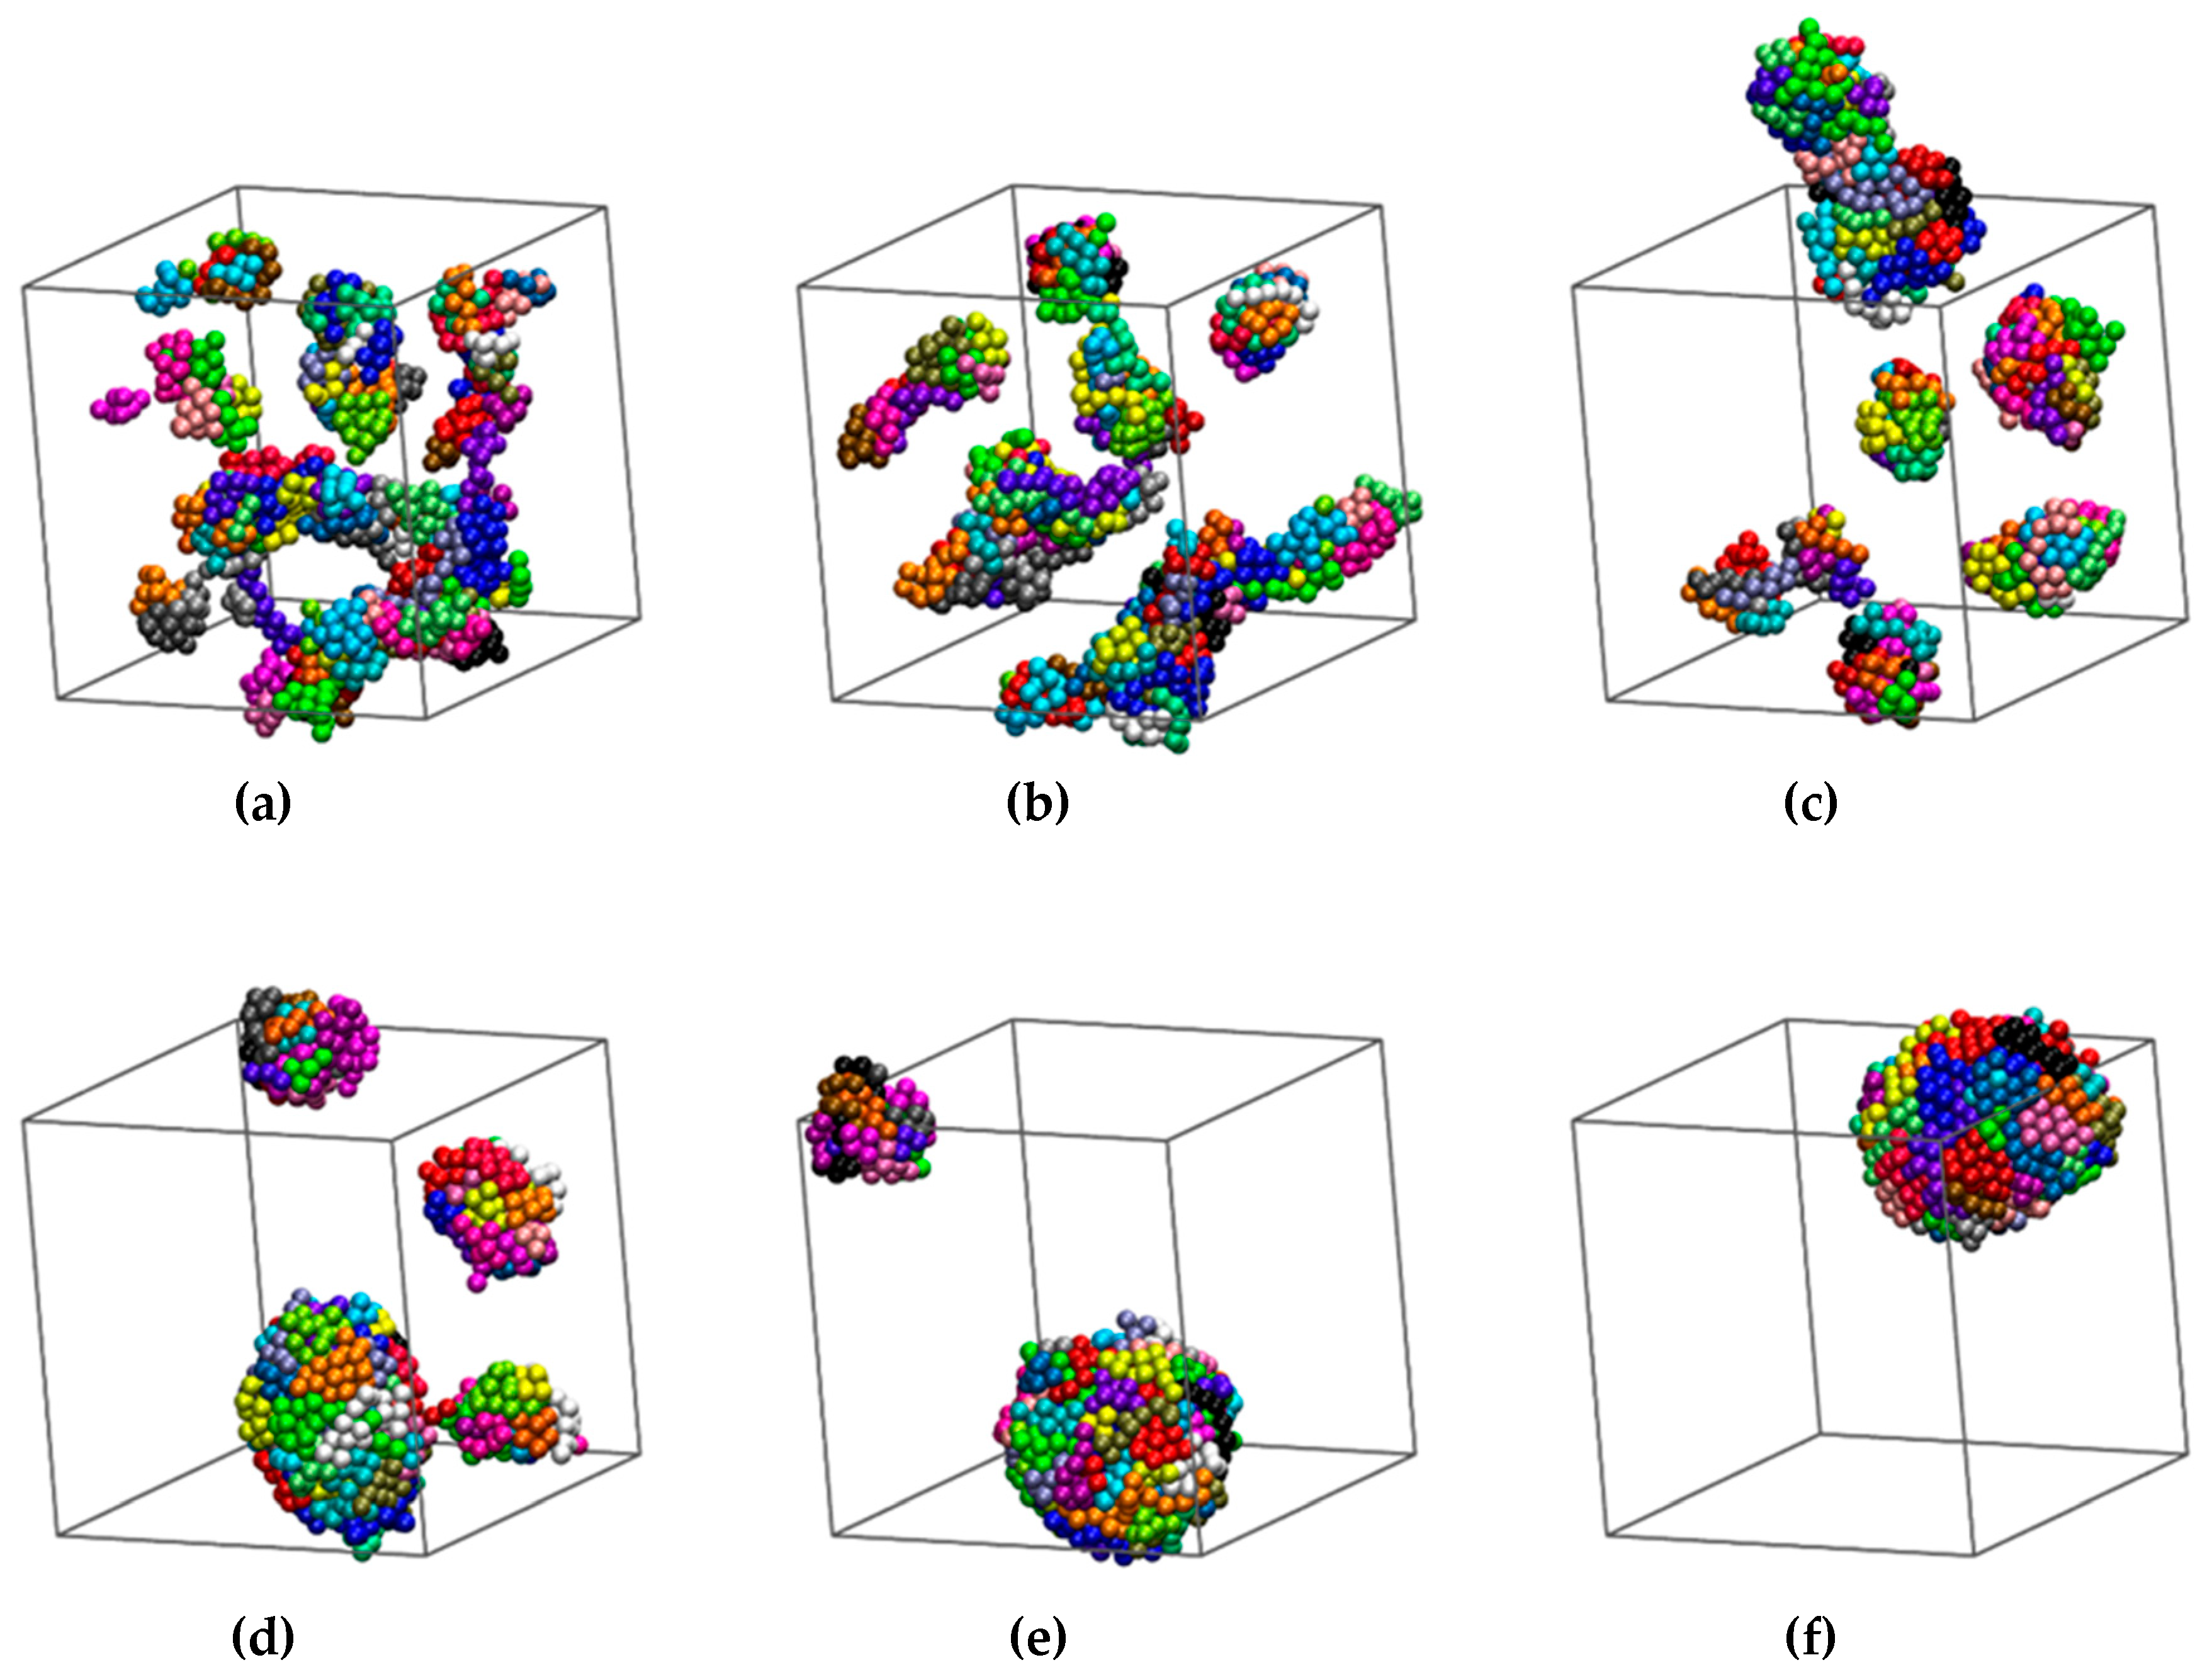
3.1. Computer-Generated System Configurations
3.2. Crystallization
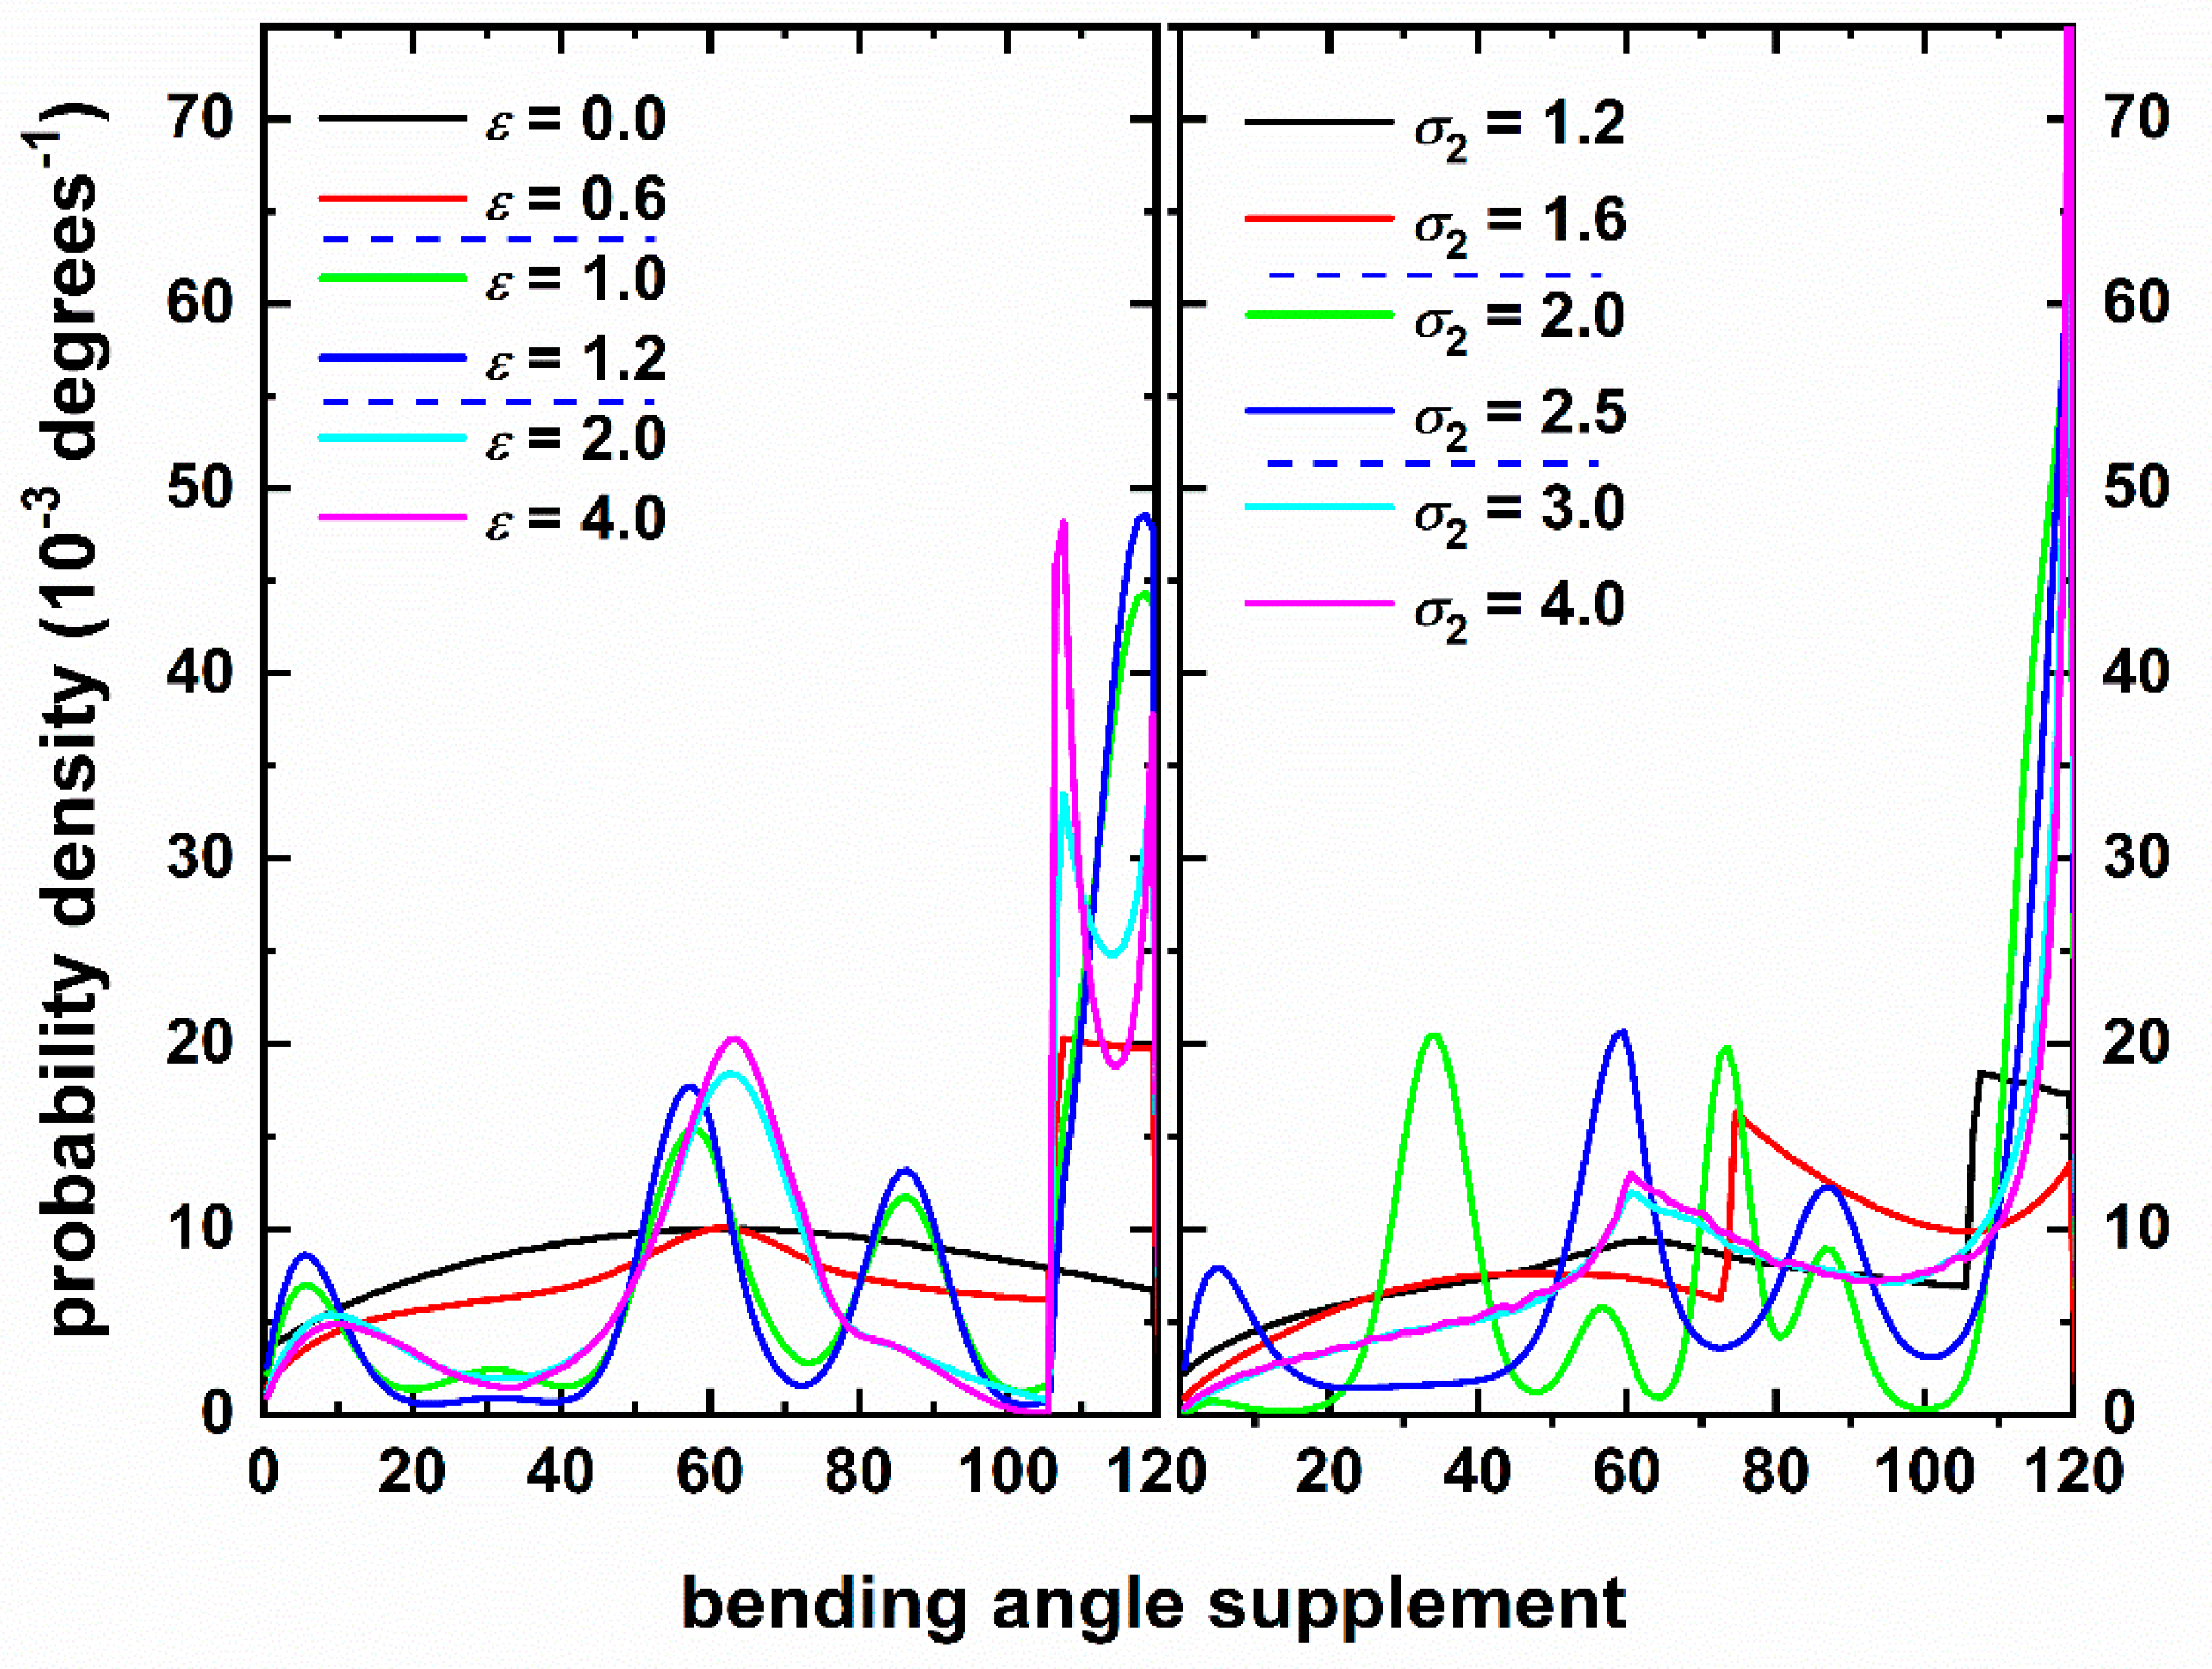
3.3. Local Chain Structure
3.4. Chain Size
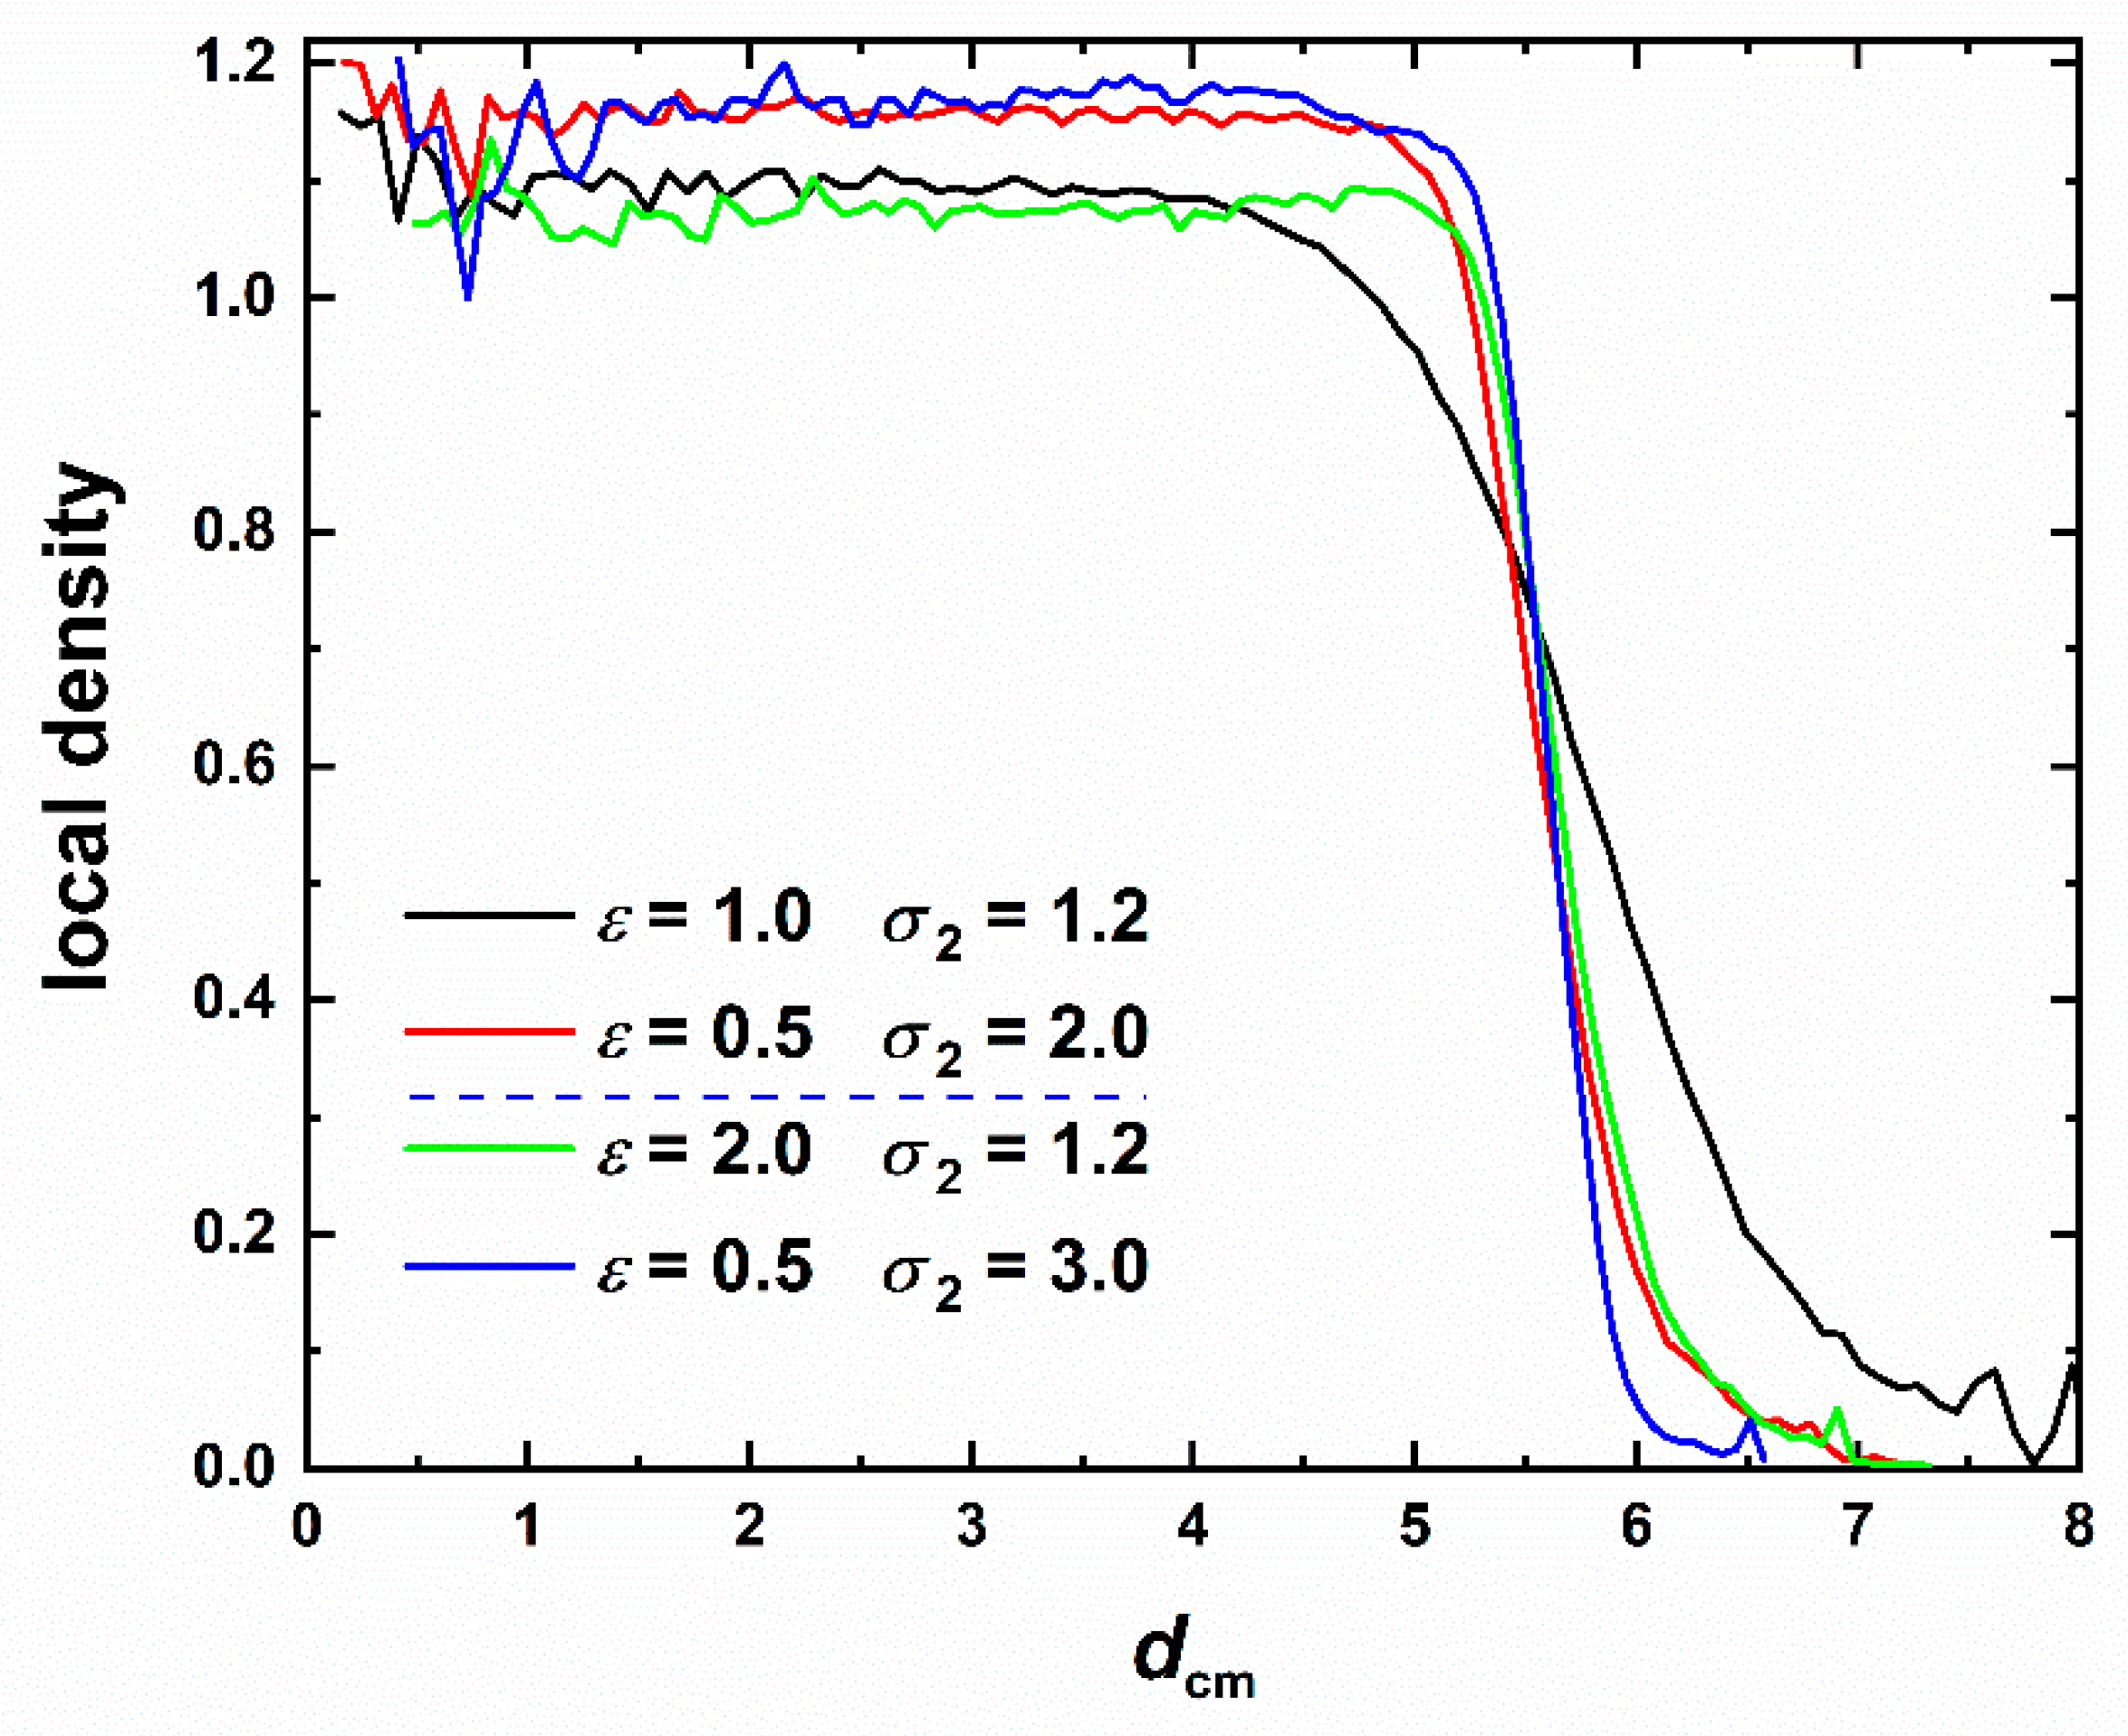
3.5. Local Density
3.6. Pair Radial Distribution Function
4. Conclusions
Supplementary Materials
Author Contributions
Funding
Acknowledgments
Conflicts of Interest
Abbreviations
| CCE | Characteristic Crystallographic Element (norm) |
| FCC | Face Center Cubic |
| FIV | Fivefold |
| HCP | Hexagonal Close Packed |
| RHCP | Random Hexagonal Close Packed |
| HS | Hard Sphere |
| MC | Monte Carlo |
| MD | Molecular Dynamics |
| SW | Square Well |
| SS | Square Shoulder |
| LJ | Lennard-Jones |
References
- Mullin, J.W. 8—Industrial techniques and equipment. In Crystallization, 4th ed.; Mullin, J.W., Ed.; Butterworth-Heinemann: Oxford, UK, 2001; pp. 315–402. [Google Scholar]
- Reiter, G.; Sommer, J.U. Polymer Crystallization: Obervations, Concepts and Interpretations; Springer: Berlin/Heidelberg, Germany, 2008. [Google Scholar]
- O’Malley, B.; Snook, I. Crystal nucleation in the hard sphere system. Phys. Rev. Lett. 2003, 90, 90. [Google Scholar] [CrossRef]
- Cheng, Z.D.; Russell, W.B.; Chaikin, P.M. Controlled growth of hard-sphere colloidal crystals. Nature 1999, 401, 893–895. [Google Scholar] [CrossRef]
- Mullin, J.W. 6—Crystal growth. In Crystallization, 4th ed.; Mullin, J.W., Ed.; Butterworth-Heinemann: Oxford, UK, 2001; pp. 216–288. [Google Scholar]
- Kawasaki, T.; Tanaka, H. Formation of a crystal nucleus from liquid. Proc. Natl. Acad. Sci. USA 2010, 107, 14036–14041. [Google Scholar] [CrossRef] [Green Version]
- Russo, J.; Tanaka, H. The microscopic pathway to crystallization in supercooled liquids. Sci. Rep. 2012, 2. [Google Scholar] [CrossRef] [Green Version]
- Alder, B.J.; Wainwright, T.E. Phase Transition for A Hard Sphere System. J. Chem. Phys. 1957, 27, 1208–1209. [Google Scholar] [CrossRef] [Green Version]
- Frenkel, D. Entropy-driven phase transitions. Phys. A 1999, 263, 26–38. [Google Scholar] [CrossRef] [Green Version]
- Allen, M.P.; Tildesley, D.J. Computer Simulation of Liquids; Oxford University Press: New York, NY, USA, 1987. [Google Scholar]
- Frenkel, D.; Smit, B. Understanding Molecular Simulation: From Algorithms to Applications, 2nd ed.; Academic Press: San Diego, CA, USA, 2002. [Google Scholar]
- DeGennes, P.G. Scaling Concepts in Polymer Physics; Cornell University Press: Ithaca, NY, USA, 1980. [Google Scholar]
- Doi, M.; Edwards, S.F. The Theory of Polymer Dynamics; Clarendon Press: Oxford, UK, 1988. [Google Scholar]
- Armitstead, K.; Goldbeck-Wood, G.; Keller, A. Polymer crystallization theories. Adv. Polym. Sci. 1992, 100, 219–312. [Google Scholar]
- Karak, N. Fundamentals of Polymers: Raw Materials to Finish Products; Prentice Hall India: New Delhi, India, 2009. [Google Scholar]
- Forrest, J.A.; Dalnoki-Veress, K. The glass transition in thin polymer films. Adv. Colloid Interface Sci. 2001, 94, 167–196. [Google Scholar] [CrossRef]
- Liu, Y.X.; Chen, E.Q. Polymer crystallization of ultrathin films on solid substrates. Coord. Chem. Rev. 2010, 254, 1011–1037. [Google Scholar] [CrossRef]
- Karayiannis, N.C.; Laso, M. Dense and nearly jammed random packings of freely jointed chains of tangent hard spheres. Phys. Rev. Lett. 2008, 100. [Google Scholar] [CrossRef] [PubMed]
- Karayiannis, N.C.; Foteinopoulou, K.; Laso, M. Contact network in nearly jammed disordered packings of hard-sphere chains. Phys. Rev. E 2009, 80. [Google Scholar] [CrossRef] [PubMed]
- Karayiannis, N.C.; Foteinopoulou, K.; Laso, M. The structure of random packings of freely jointed chains of tangent hard spheres. J. Chem. Phys. 2009, 130, 164908. [Google Scholar] [CrossRef] [PubMed]
- Laso, M.; Karayiannis, N.C.; Foteinopoulou, K.; Mansfield, M.L.; Kroger, M. Random packing of model polymers: Local structure, topological hindrance and universal scaling. Soft Matter 2009, 5, 1762–1770. [Google Scholar] [CrossRef]
- Karayiannis, N.C.; Foteinopoulou, K.; Laso, M. Entropy-Driven Crystallization in Dense Systems of Athermal Chain Molecules. Phys. Rev. Lett. 2009, 103. [Google Scholar] [CrossRef] [PubMed]
- Karayiannis, N.C.; Foteinopoulou, K.; Abrams, C.F.; Laso, M. Modeling of crystal nucleation and growth in athermal polymers: Self-assembly of layered nano-morphologies. Soft Matter 2010, 6, 2160–2173. [Google Scholar] [CrossRef]
- Karayiannis, N.C.; Foteinopoulou, K.; Laso, M. Spontaneous Crystallization in Athermal Polymer Packings. Int. J. Mol. Sci. 2013, 14, 332–358. [Google Scholar] [CrossRef] [PubMed]
- Karayiannis, N.C.; Foteinopoulou, K.; Laso, M. Jamming and crystallization in athermal polymer packings. Philos. Mag. 2013, 93, 4108–4131. [Google Scholar] [CrossRef]
- Karayiannis, N.C.; Foteinopoulou, K.; Laso, M. Twinning of Polymer Crystals Suppressed by Entropy. Symmetry (Basel) 2014, 6, 758–780. [Google Scholar] [CrossRef] [Green Version]
- Karayiannis, N.C.; Foteinopoulou, K.; Laso, M. The role of bond tangency and bond gap in hard sphere crystallization of chains. Soft Matter 2015, 11, 1688–1700. [Google Scholar] [CrossRef]
- Karayiannis, N.C.; Malshe, R.; de Pablo, J.J.; Laso, M. Fivefold symmetry as an inhibitor to hard-sphere crystallization. Phys. Rev. E 2011, 83. [Google Scholar] [CrossRef] [Green Version]
- Karayiannis, N.C.; Malshe, R.; Kroger, M.; de Pablo, J.J.; Laso, M. Evolution of fivefold local symmetry during crystal nucleation and growth in dense hard-sphere packings. Soft Matter 2012, 8, 844–858. [Google Scholar] [CrossRef]
- Foteinopoulou, K.; Karayiannis, N.C.; Laso, M. Monte Carlo simulations of densely-packed athermal polymers in the bulk and under confinement. Chem. Eng. Sci. 2015, 121, 118–132. [Google Scholar] [CrossRef] [Green Version]
- Benito, J.; Karayiannis, N.C.; Laso, M. Confined Polymers as Self-Avoiding Random Walks on Restricted Lattices. Polymers 2018, 10, 1394. [Google Scholar] [CrossRef] [PubMed] [Green Version]
- Ramos, P.M.; Karayiannis, N.C.; Laso, M. Off-lattice simulation algorithms for athermal chain molecules under extreme confinement. J. Comput. Phys. 2018, 375, 918–934. [Google Scholar] [CrossRef]
- Babu, S.; Gimel, J.C.; Nicolai, T. Crystallization and dynamical arrest of attractive hard spheres. J. Chem. Phys. 2009, 130, 064504. [Google Scholar] [CrossRef] [Green Version]
- Klotsa, D.; Jack, R.L. Predicting the self-assembly of a model colloidal crystal. Soft Matter 2011, 7, 6294–6303. [Google Scholar] [CrossRef] [Green Version]
- Takada, S.; Hayakawa, H. Rheology of dilute cohesive granular gases. Phys. Rev. E 2018, 97, 042902. [Google Scholar] [CrossRef] [Green Version]
- Sevick, E.M.; Monson, P.A. Cluster Integrals for Square-Well Particles—Application to Percolation. J. Chem. Phys. 1991, 94, 3070–3082. [Google Scholar] [CrossRef]
- Campos, L.Q.C.; Silva, C.C.D.; Apolinario, S.W.S. Structural phases of colloids interacting via a flat-well potential. Phys. Rev. E 2012, 86. [Google Scholar] [CrossRef]
- Campos, L.Q.C.; Apolinario, S.W.S. Structural orderings of anisotropically confined colloids interacting via a quasi-square-well potential. Phys. Rev. E 2015, 91. [Google Scholar] [CrossRef]
- Jungmann, R.M.; Pereira, P.C.N.; Apolinario, S.W.S. 2D melting of confined colloids with a mixture of square and triangular order. J. Phys. Condens. Matter 2018, 30. [Google Scholar] [CrossRef] [PubMed]
- Prestipino, S.; Malescio, G. Characterization of the structural collapse undergone by an unstable system of ultrasoft particles. Phys. A Stat. Mech. Its Appl. 2016, 457, 492–505. [Google Scholar] [CrossRef]
- Hoy, R.S.; O’Hern, C.S. Minimal Energy Packings and Collapse of Sticky Tangent Hard-Sphere Polymers. Phys. Rev. Lett. 2010, 105. [Google Scholar] [CrossRef] [PubMed] [Green Version]
- Rohrmann, R.D.; Santos, A. Equation of state of sticky-hard-sphere fluids in the chemical-potential route. Phys. Rev. E 2014, 89. [Google Scholar] [CrossRef] [Green Version]
- Pham, K.N.; Puertas, A.M.; Bergenholtz, J.; Egelhaaf, S.U.; Moussaid, A.; Pusey, P.N.; Schofield, A.B.; Cates, M.E.; Fuchs, M.; Poon, W.C.K. Multiple glassy states in a simple model system. Science 2002, 296, 104–106. [Google Scholar] [CrossRef] [PubMed] [Green Version]
- Gazzillo, D. On the impossibility of defining adhesive hard spheres as sticky limit of a hard-sphere-Yukawa potential. J. Chem. Phys. 2011, 134, 124504. [Google Scholar] [CrossRef]
- Rao, R.V.G.; Venkatesh, R. Computation of structure factors of liquid-metals by use of the sticky-hard-sphere potential. Phys. Rev. B 1990, 42, 1205–1208. [Google Scholar] [CrossRef]
- Munao, G.; O’Toole, P.; Hudson, T.S.; Costa, D.; Caccamo, C.; Giacometti, A.; Sciortino, F. Phase separation and self-assembly of colloidal dimers with tunable attractive strength: From symmetrical square-wells to Janus dumbbells. Soft Matter 2014, 10, 5269–5279. [Google Scholar] [CrossRef]
- O’Toole, P.; Munao, G.; Giacometti, A.; Hudson, T.S. Self-assembly behaviour of hetero-nuclear Janus dumbbells. Soft Matter 2017, 13, 7141–7153. [Google Scholar] [CrossRef]
- Kuriata, A.; Sikorski, A. Collapse Transition of Cyclic Homopolymers and Block Copolymers. Macromol. Theory Simul. 2018, 27. [Google Scholar] [CrossRef]
- Zierenberg, J.; Marenz, M.; Janke, W. Dilute Semiflexible Polymers with Attraction: Collapse, Folding and Aggregation. Polymers 2016, 8, 333. [Google Scholar] [CrossRef] [PubMed] [Green Version]
- Taylor, M.P.; Aung, P.P.; Paul, W. Partition function zeros and phase transitions for a square-well polymer chain. Phys. Rev. E 2013, 88. [Google Scholar] [CrossRef] [PubMed] [Green Version]
- Taylor, M.P.; Paul, W.; Binder, K. Phase transitions of a single polymer chain: A Wang–Landau simulation study. J. Chem. Phys. 2009, 131, 114907. [Google Scholar] [CrossRef] [PubMed]
- Zhou, Y.; Hall, C.K.; Karplus, M. First-Order Disorder-to-Order Transition in an Isolated Homopolymer Model. Phys. Rev. Lett. 1996, 77, 2822–2825. [Google Scholar] [CrossRef]
- Zhou, Y.; Karplus, M.; Wichert, J.M.; Hall, C.K. Equilibrium thermodynamics of homopolymers and clusters: Molecular dynamics and Monte Carlo simulations of systems with square-well interactions. J. Chem. Phys. 1997, 107, 10691–10708. [Google Scholar] [CrossRef] [Green Version]
- Schnabel, S.; Vogel, T.; Bachmann, M.; Janke, W. Surface effects in the crystallization process of elastic flexible polymers. Chem. Phys. Lett. 2009, 476, 201–204. [Google Scholar] [CrossRef] [Green Version]
- Schnabel, S.; Bachmann, M.; Janke, W. Elastic Lennard-Jones polymers meet clusters: Differences and similarities. J. Chem. Phys. 2009, 131. [Google Scholar] [CrossRef] [Green Version]
- Schnabel, S.; Janke, W.; Bachmann, M. Advanced multicanonical Monte Carlo methods for efficient simulations of nucleation processes of polymers. J. Comput. Phys. 2011, 230, 4454–4465. [Google Scholar] [CrossRef] [Green Version]
- Gross, J.; Neuhaus, T.; Vogel, T.; Bachmann, M. Effects of the interaction range on structural phases of flexible polymers. J. Chem. Phys. 2013, 138, 074905. [Google Scholar] [CrossRef] [Green Version]
- Braier, P.A.; Berry, R.S.; Wales, D.J. How the range of pair interactions governs features of multidimensional potentials. J. Chem. Phys. 1990, 93, 8745–8756. [Google Scholar] [CrossRef]
- Wales, D.J. Structural and topological consequences of anisotropic interactions in clusters. J. Chem. Soc. Faraday Trans. 1990, 86, 3505–3517. [Google Scholar] [CrossRef]
- Wales, D.J.; Berry, R.S. Melting and freezing of small argon clusters. J. Chem. Phys. 1990, 92, 4283–4295. [Google Scholar] [CrossRef]
- Prabhu, A.; Babu, S.B.; Dolado, J.S.; Gimel, J.C. Brownian cluster dynamics with short range patchy interactions: Its application to polymers and step-growth polymerization. J. Chem. Phys. 2014, 141, 16. [Google Scholar] [CrossRef] [PubMed] [Green Version]
- Hoy, R.S.; Karayiannis, N.C. Simple model for chain packing and crystallization of soft colloidal polymers. Phys. Rev. E 2013, 88. [Google Scholar] [CrossRef] [Green Version]
- Nguyen, H.T.; Smith, T.B.; Hoy, R.S.; Karayiannis, N.C. Effect of chain stiffness on the competition between crystallization and glass-formation in model unentangled polymers. J. Chem. Phys. 2015, 143, 144901. [Google Scholar] [CrossRef] [Green Version]
- Ni, R.; Dijkstra, M. Effect of bond length fluctuations on crystal nucleation of hard bead chains. Soft Matter 2013, 9, 365–369. [Google Scholar] [CrossRef] [Green Version]
- Hino, T.; Prausnitz, J.M. A perturbed hard-sphere-chain equation of state for normal fluids and polymers using the square-well potential of variable width. Fluid Phase Equilib. 1997, 138, 105–130. [Google Scholar] [CrossRef] [Green Version]
- Karayiannis, N.C.; Giannousaki, A.E.; Mavrantzas, V.G.; Theodorou, D.N. Atomistic Monte Carlo simulation of strictly monodisperse long polyethylene melts through a generalized chain bridging algorithm. J. Chem. Phys. 2002, 117, 5465–5479. [Google Scholar] [CrossRef]
- Karayiannis, N.C.; Mavrantzas, V.G.; Theodorou, D.N. A novel Monte Carlo scheme for the rapid equilibration of atomistic model polymer systems of precisely defined molecular architecture. Phys. Rev. Lett. 2002, 88. [Google Scholar] [CrossRef]
- Karayiannis, N.C.; Laso, M. Monte Carlo scheme for generation and relaxation of dense and nearly jammed random structures of freely jointed hard-sphere chains. Macromolecules 2008, 41, 1537–1551. [Google Scholar] [CrossRef]
- Hoy, R.S.; O’Hern, C.S. Glassy dynamics of crystallite formation: The role of covalent bonds. Soft Matter 2012, 8, 1215–1225. [Google Scholar] [CrossRef] [Green Version]
- Karayiannis, N.C.; Foteinopoulou, K.; Laso, M. The characteristic crystallographic element norm: A descriptor of local structure in atomistic and particulate systems. J. Chem. Phys. 2009, 130, 74704. [Google Scholar] [CrossRef] [PubMed]
- Giacovazzo, C.; Monaco, H.L.; Artioli, G.; Viterbo, D.; Ferraris, G.; Gilli, G.; Zanotti, G.; Gatti, M. Fundamentals of Crystallography; Oxford Science: Oxford, UK, 2005. [Google Scholar]
- Humphrey, W.; Dalke, A.; Schulten, K. VMD: Visual molecular dynamics. J. Mol. Graph. Model. 1996, 14, 33–38. [Google Scholar] [CrossRef]
- Koch, E. International Tables for Crystallography, Volume C: Mathematical, Physical and Chemical Tables, 3rd ed.; Prince, E., Ed.; Springer: New York, NY, USA, 2006. [Google Scholar]
- Anikeenko, A.V.; Medvedev, N.N.; Bezrukov, A.; Stoyan, D. Observation of fivefold symmetry structures in computer models of dense packing of hard spheres. J. Non-Cryst. Solids 2007, 353, 3545–3549. [Google Scholar] [CrossRef]
- Bagley, B.G. 5-Fold Pseudosymmetry. Nature 1970, 225, 1040–1041. [Google Scholar] [CrossRef]
- Anikeenko, A.V.; Medvedev, N.N. Polytetrahedral nature of the dense disordered packings of hard spheres. Phys. Rev. Lett. 2007, 98, 235504. [Google Scholar] [CrossRef] [Green Version]
- Anikeenko, A.V.; Medvedev, N.N.; Aste, T. Structural and entropic insights into the nature of the random-close-packing limit. Phys. Rev. E 2008, 77, 031101. [Google Scholar] [CrossRef] [Green Version]


| ε | |||||||||
|---|---|---|---|---|---|---|---|---|---|
| σ2 = 1.2 | 0.0 | 1 × 10⁻⁵ | 1 × 10⁻⁴ | 1 × 10⁻³ | 1 × 10⁻² | 0.1 | 0.2 | 0.3 | 0.4 |
| 0.5 | 0.6 | 0.7 | 0.8 | 0.9 | 1.0 | 1.1 | 1.2 | 1.3 | |
| 1.4 | 1.5 | 1.6 | 1.8 | 2.0 | 4.0 | 6.0 | 8.0 | 10.0 | |
| σ2 | |||||||||
| ε = 0.5 | 1.1 | 1.2 | 1.3 | 1.4 | 1.6 | 1.8 | 1.9 | 2.0 | 2.3 |
| 2.4 | 2.6 | 2.7 | 2.8 | 2.9 | 3.0 | 3.2 | 3.5 | 4.0 | |
| 5.0 | 6.0 |
© 2020 by the authors. Licensee MDPI, Basel, Switzerland. This article is an open access article distributed under the terms and conditions of the Creative Commons Attribution (CC BY) license (http://creativecommons.org/licenses/by/4.0/).
Share and Cite
Herranz, M.; Santiago, M.; Foteinopoulou, K.; Karayiannis, N.C.; Laso, M. Crystal, Fivefold and Glass Formation in Clusters of Polymers Interacting with the Square Well Potential. Polymers 2020, 12, 1111. https://0-doi-org.brum.beds.ac.uk/10.3390/polym12051111
Herranz M, Santiago M, Foteinopoulou K, Karayiannis NC, Laso M. Crystal, Fivefold and Glass Formation in Clusters of Polymers Interacting with the Square Well Potential. Polymers. 2020; 12(5):1111. https://0-doi-org.brum.beds.ac.uk/10.3390/polym12051111
Chicago/Turabian StyleHerranz, Miguel, Manuel Santiago, Katerina Foteinopoulou, Nikos Ch. Karayiannis, and Manuel Laso. 2020. "Crystal, Fivefold and Glass Formation in Clusters of Polymers Interacting with the Square Well Potential" Polymers 12, no. 5: 1111. https://0-doi-org.brum.beds.ac.uk/10.3390/polym12051111