Study on Viscoelastic Properties of Asphalt Mixtures Incorporating SBS Polymer and Basalt Fiber under Freeze–Thaw Cycles


Abstract
:
1. Introduction
2. Experimental Materials and Methods
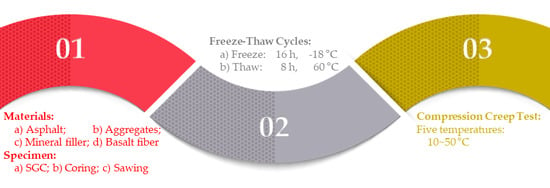
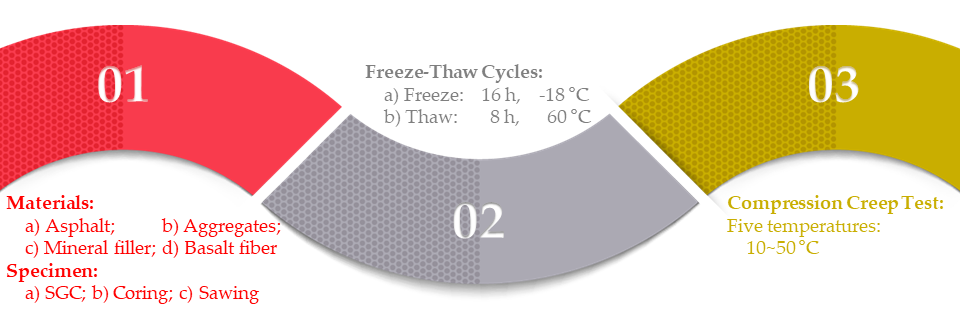
2.1. Raw Materials and Specimen Preparation
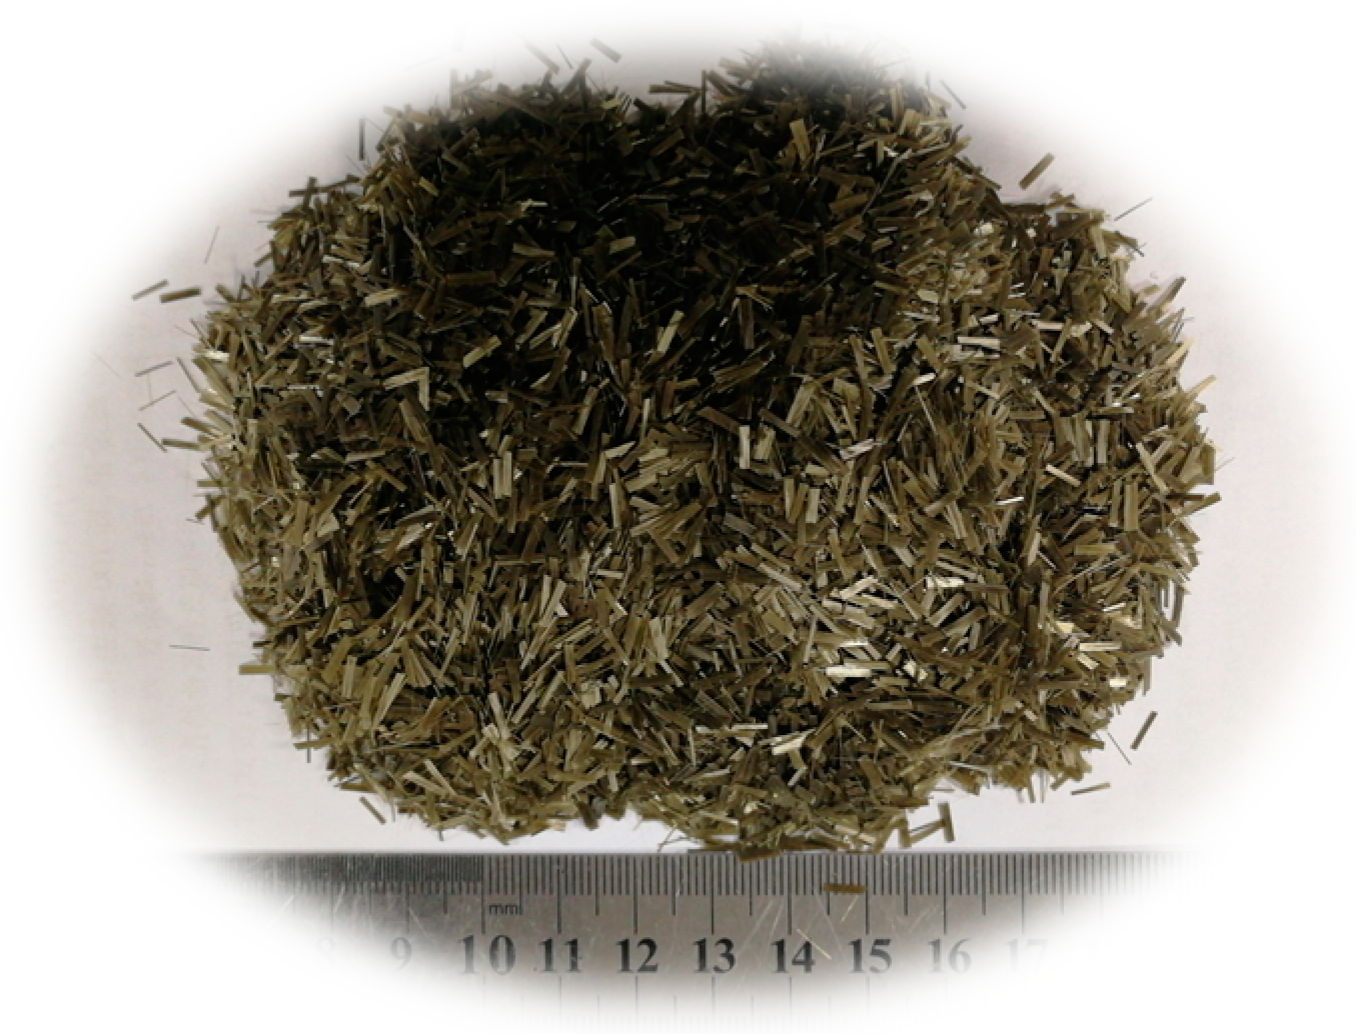
2.1.1. Experimental Materials
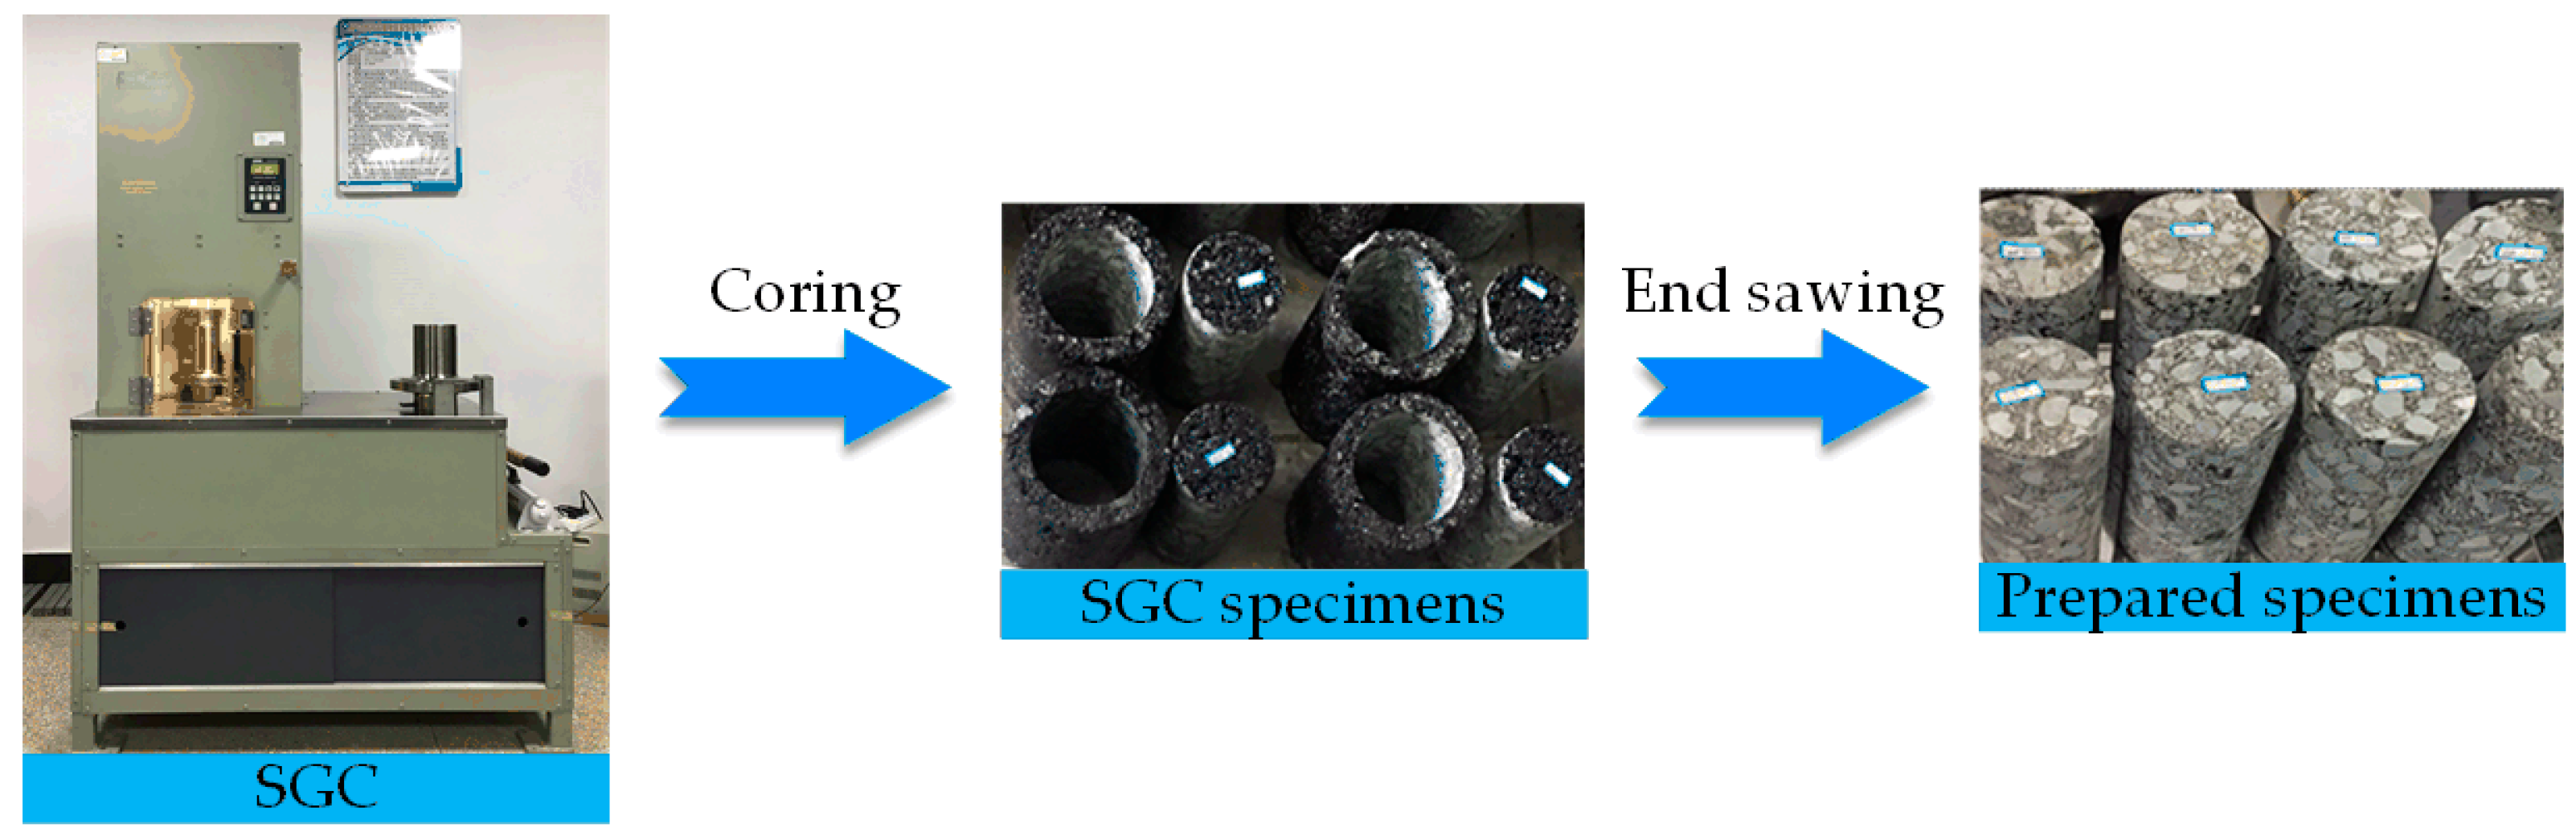
2.1.2. Specimen Preparation
2.2. Experimental Procedure and Test Configuration
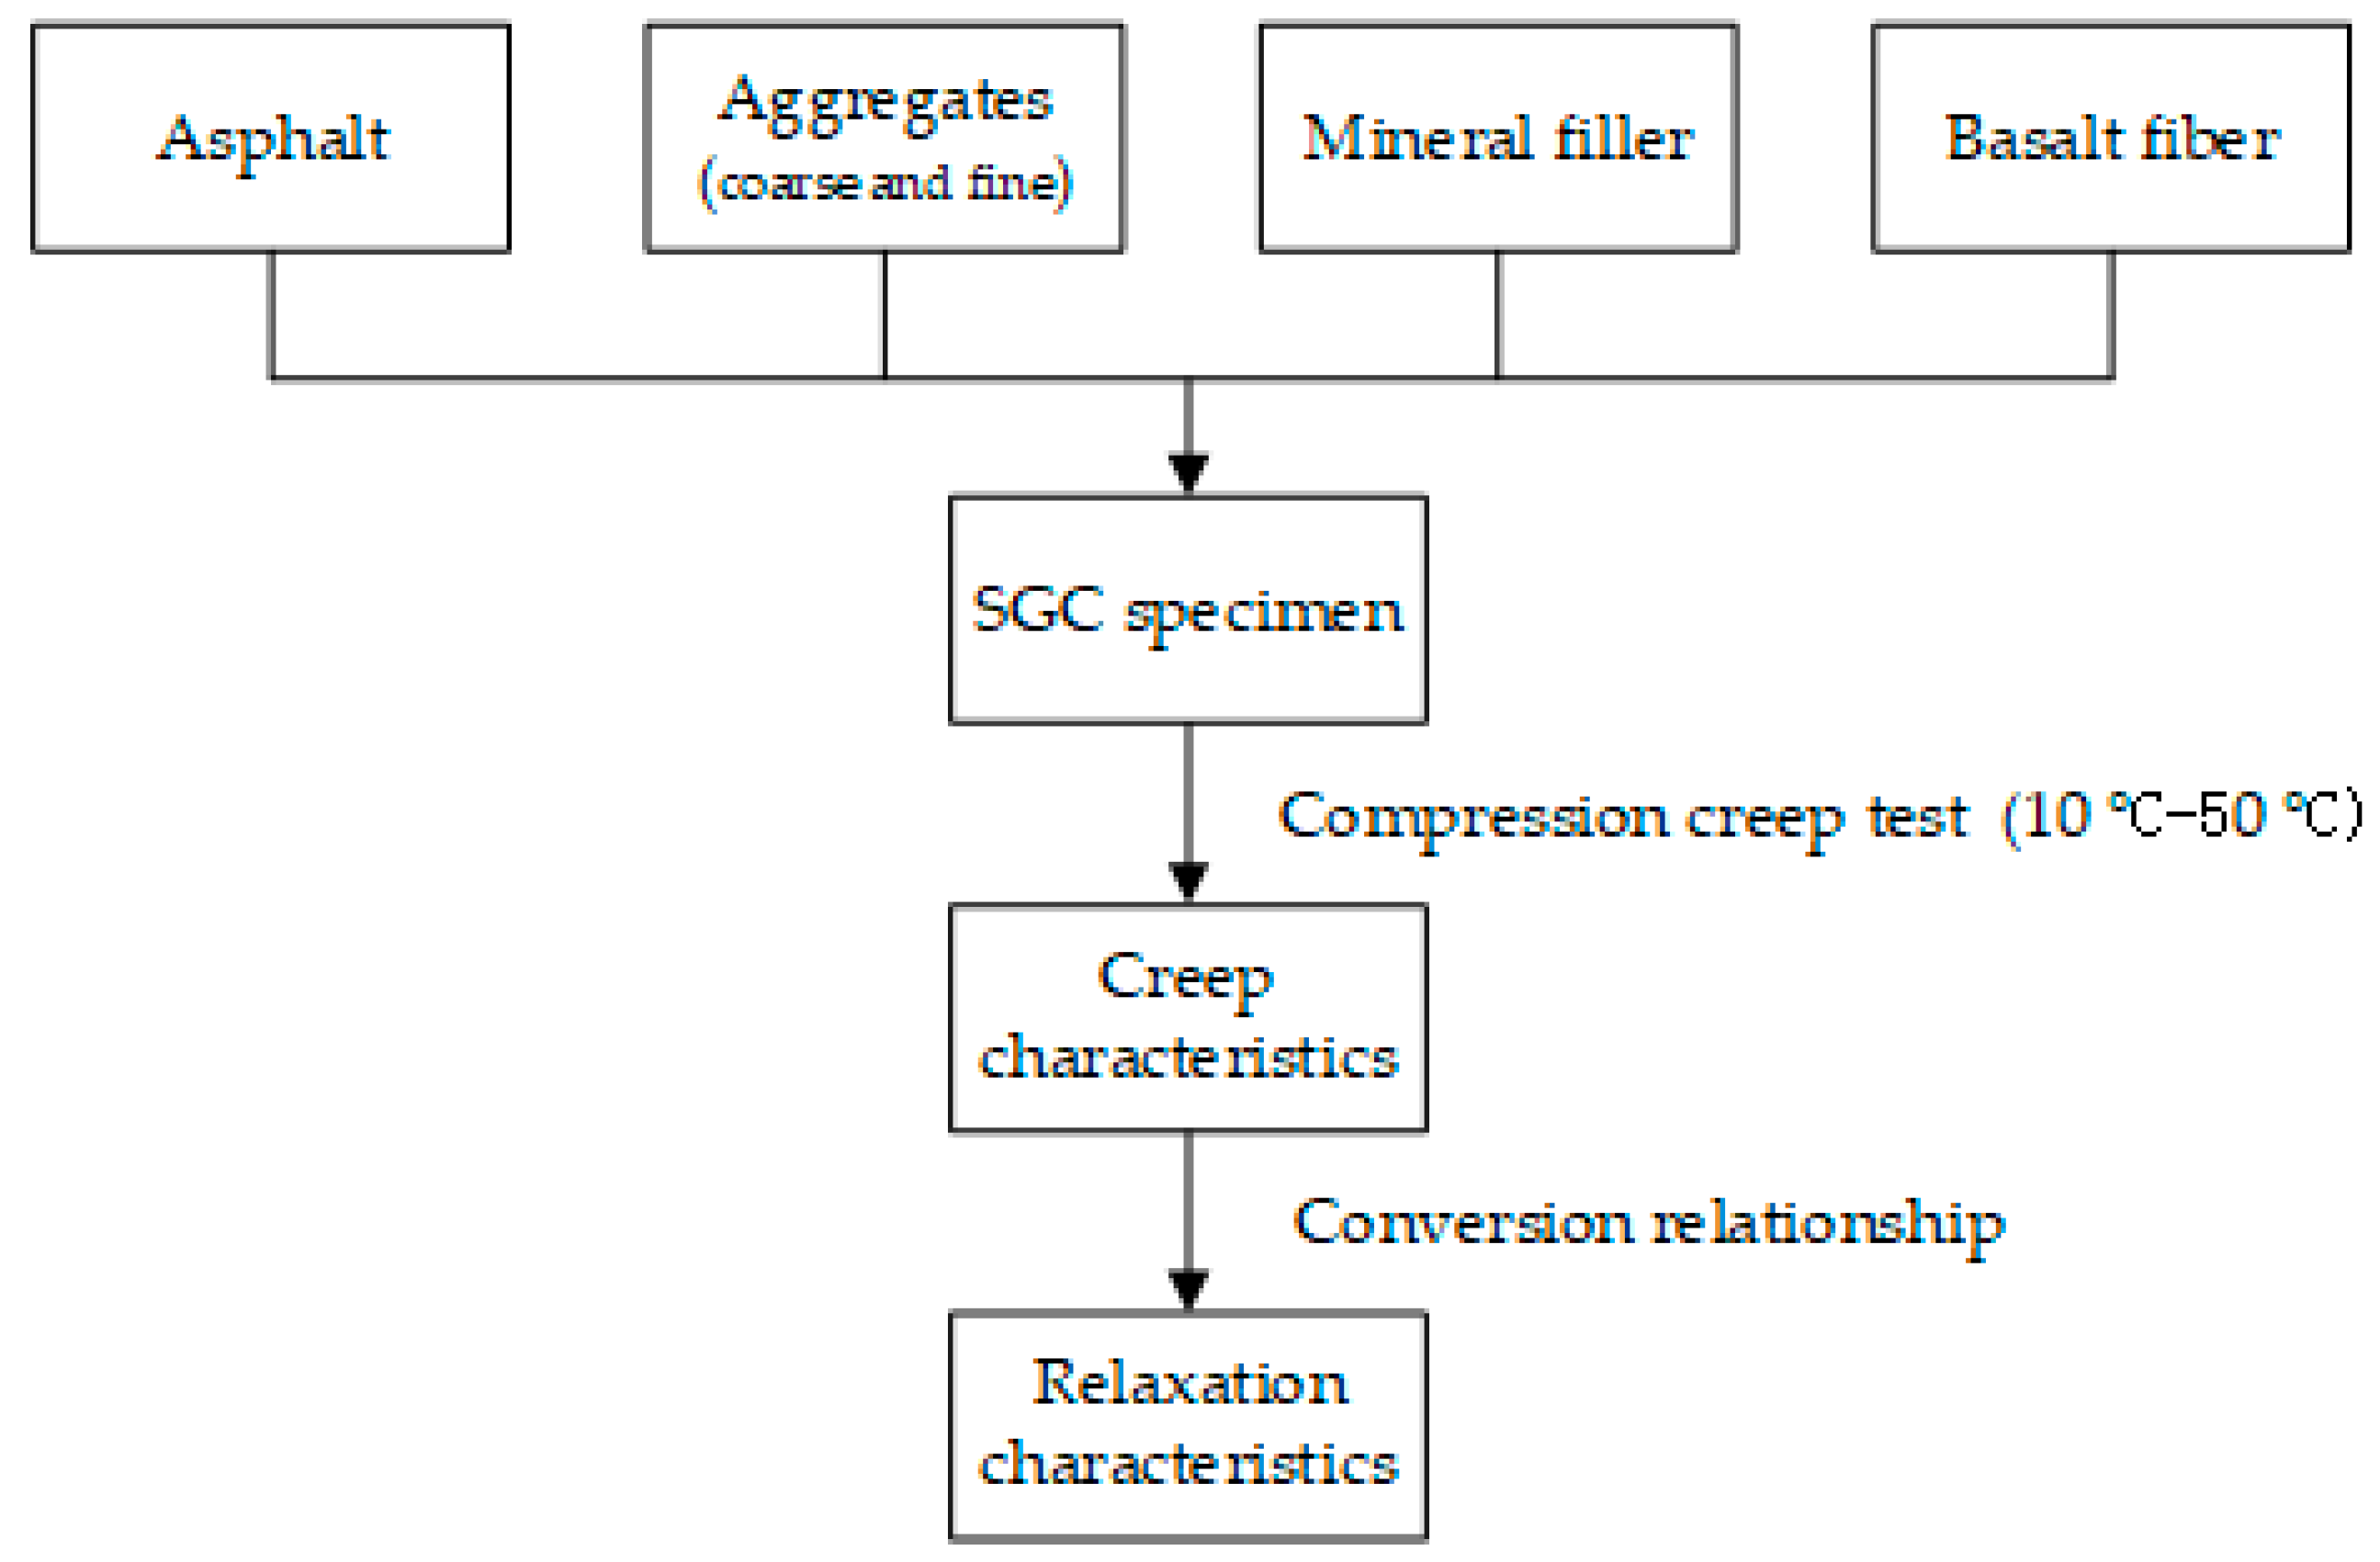
2.2.1. Experimental Process
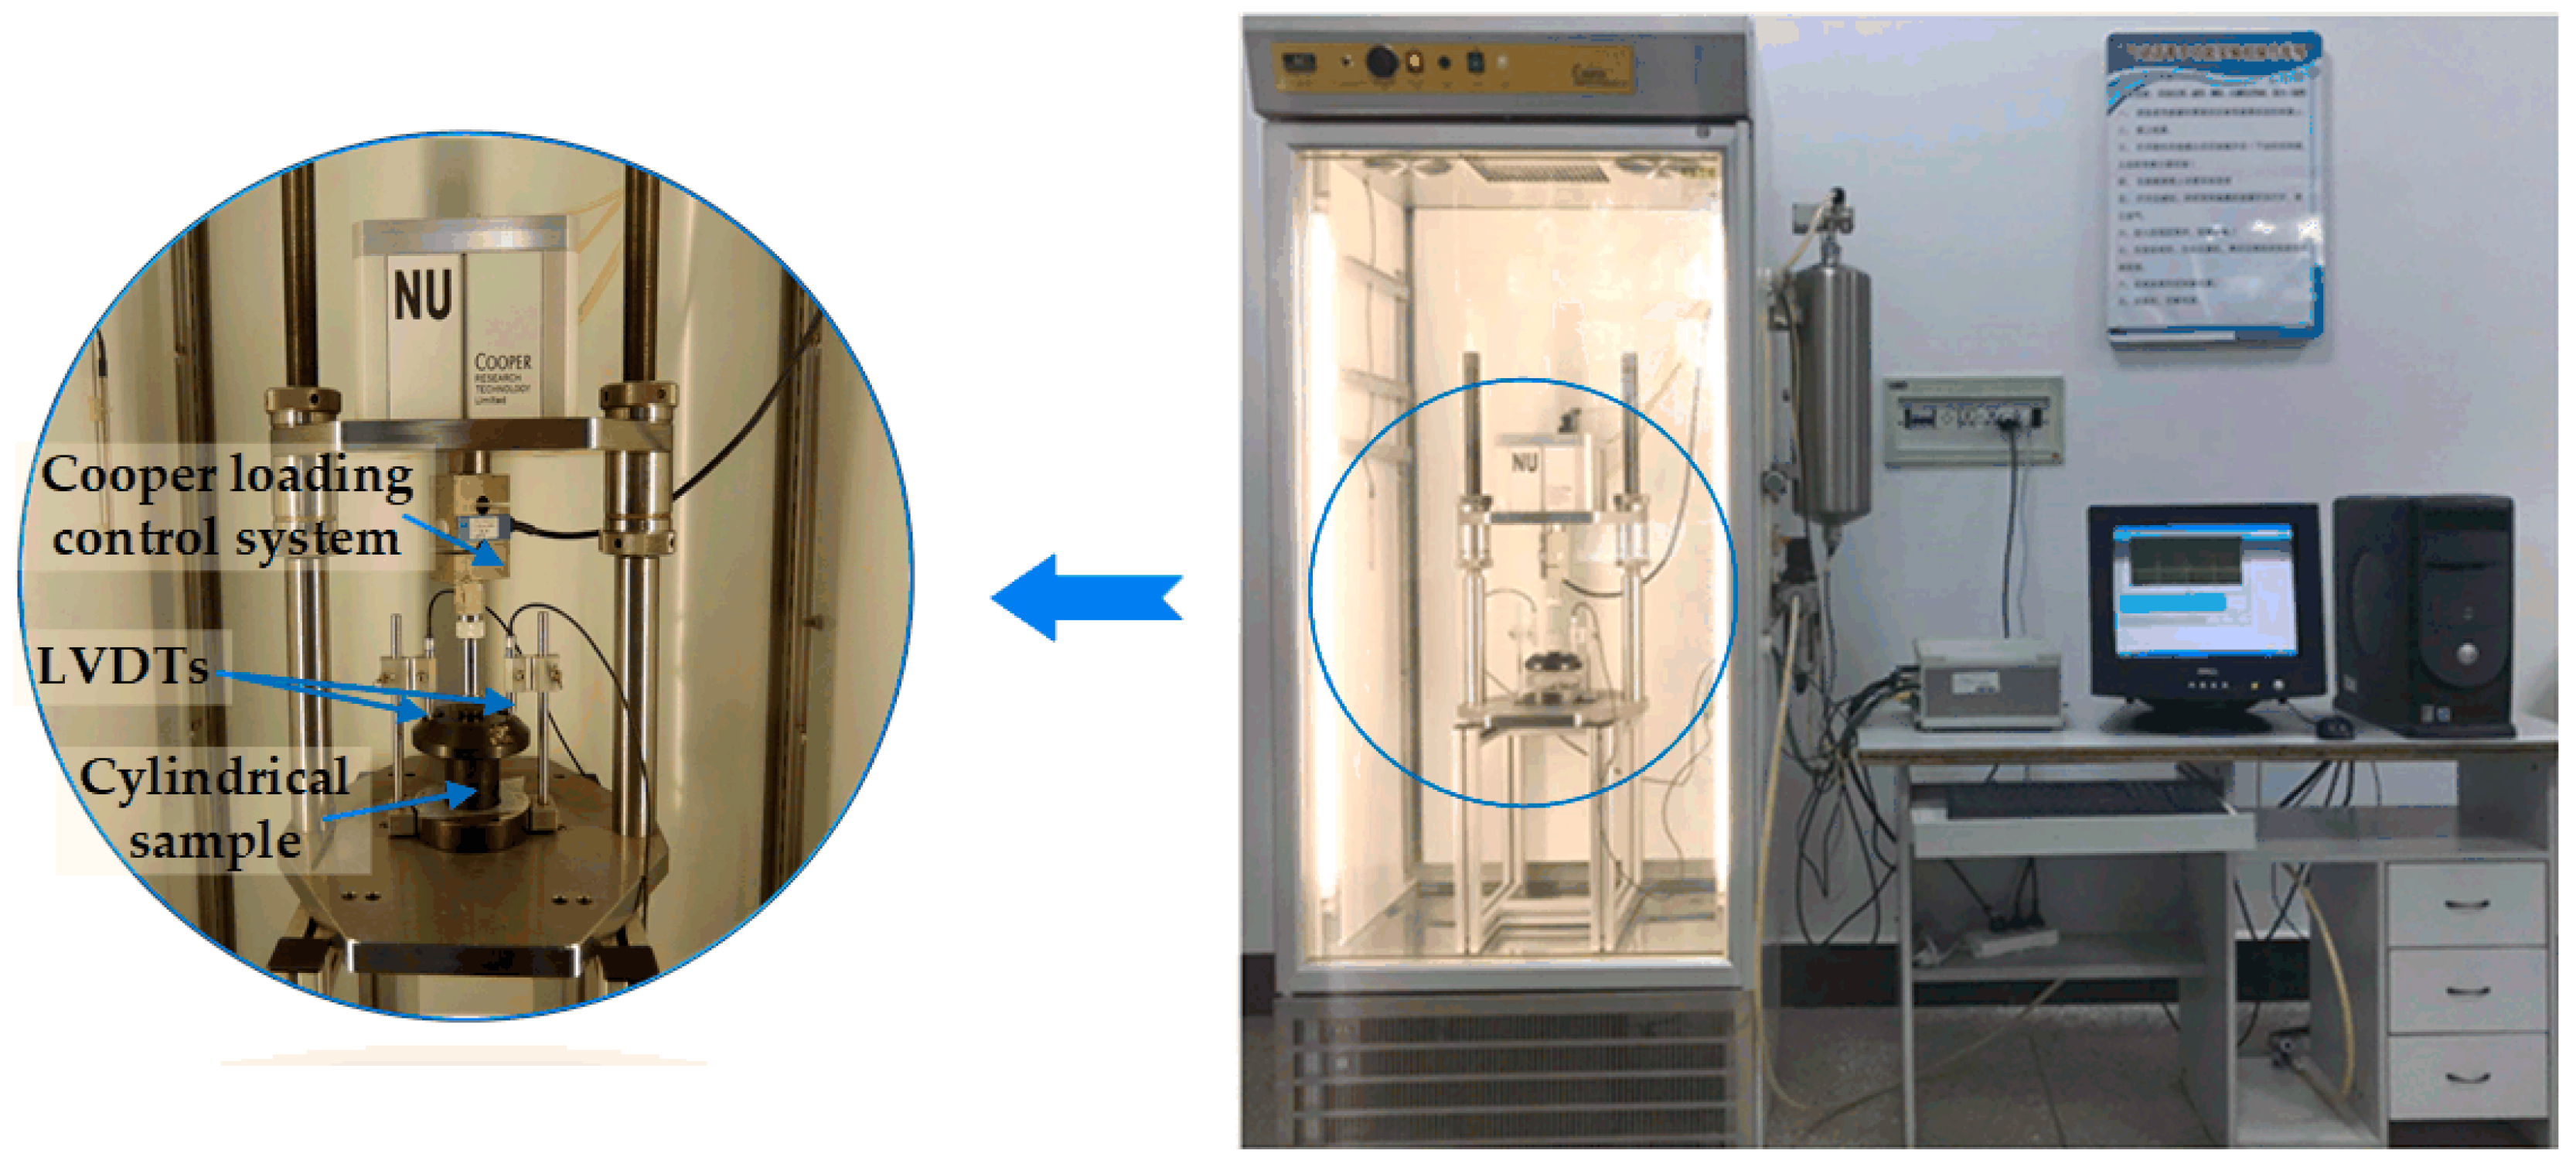
2.2.2. Protocol of Uniaxial Compression Creep Test
2.3. Theory of Viscoelastic Mechanics of Asphalt Mixture
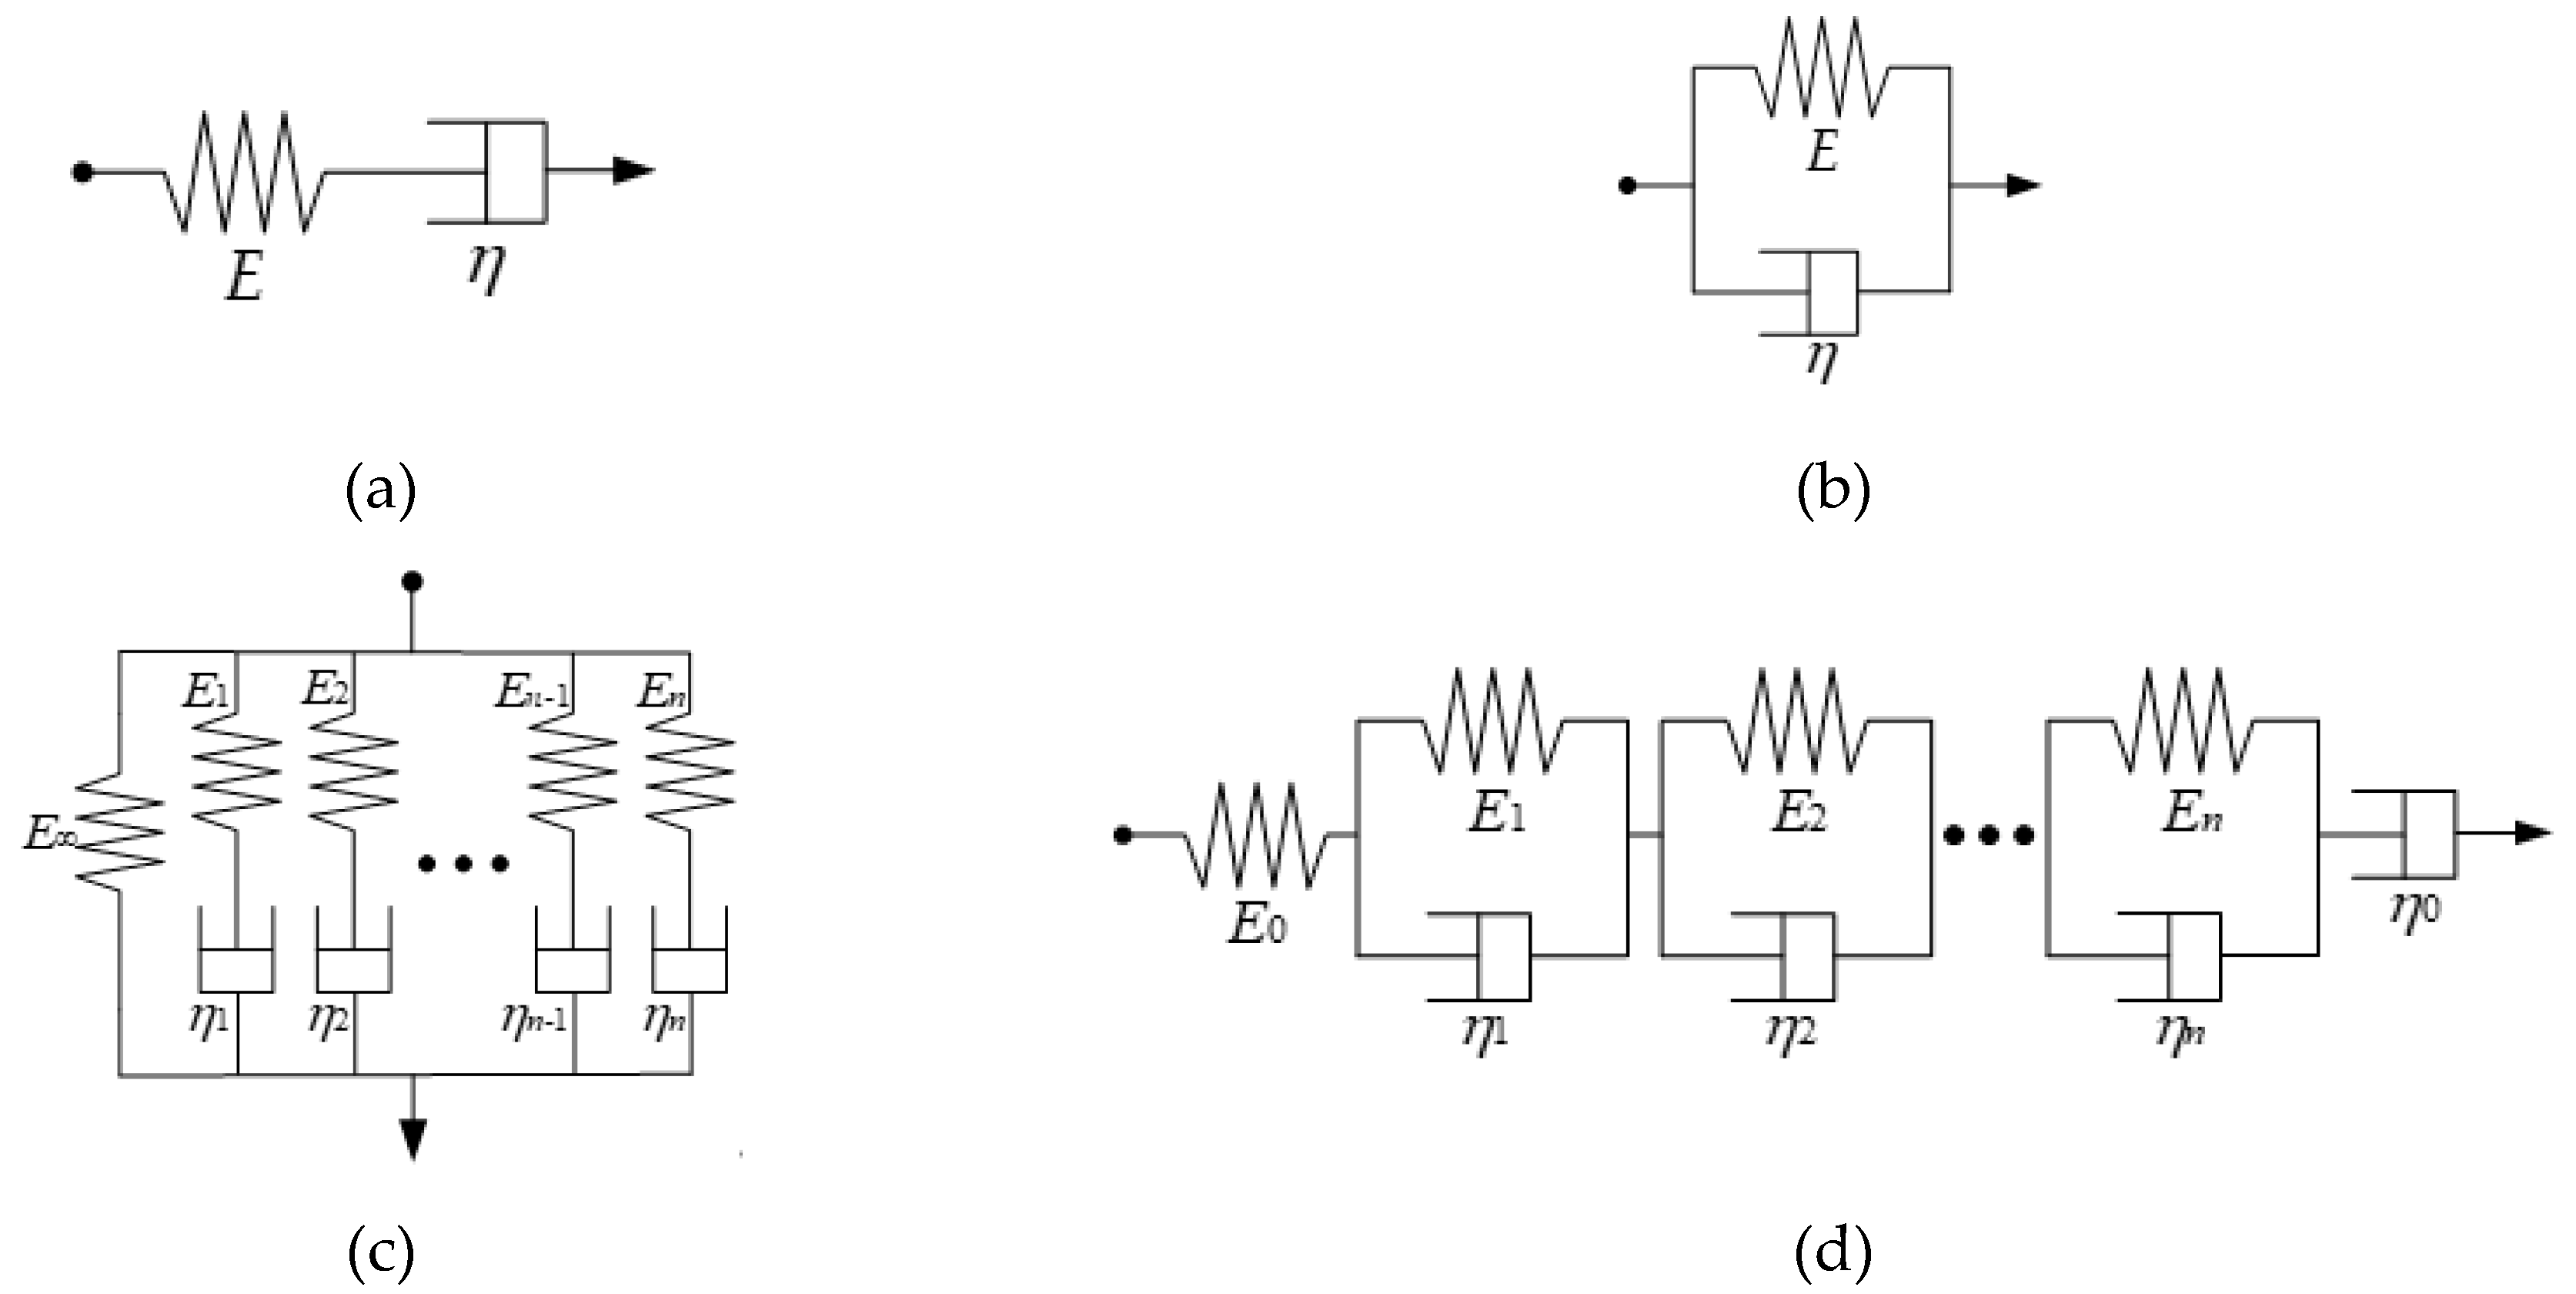
2.3.1. Basic Theory of Viscoelastic Model
2.3.2. Generalized Maxwell Model and Generalized Kelvin Model
2.3.3. Conversion between Relaxation Modulus and Creep Compliance
3. Results and Discussion
3.1. Creep Characteristics of Asphalt Mixtures Incorporating SBS Polymer and Basalt Fiber under F-T Cycles
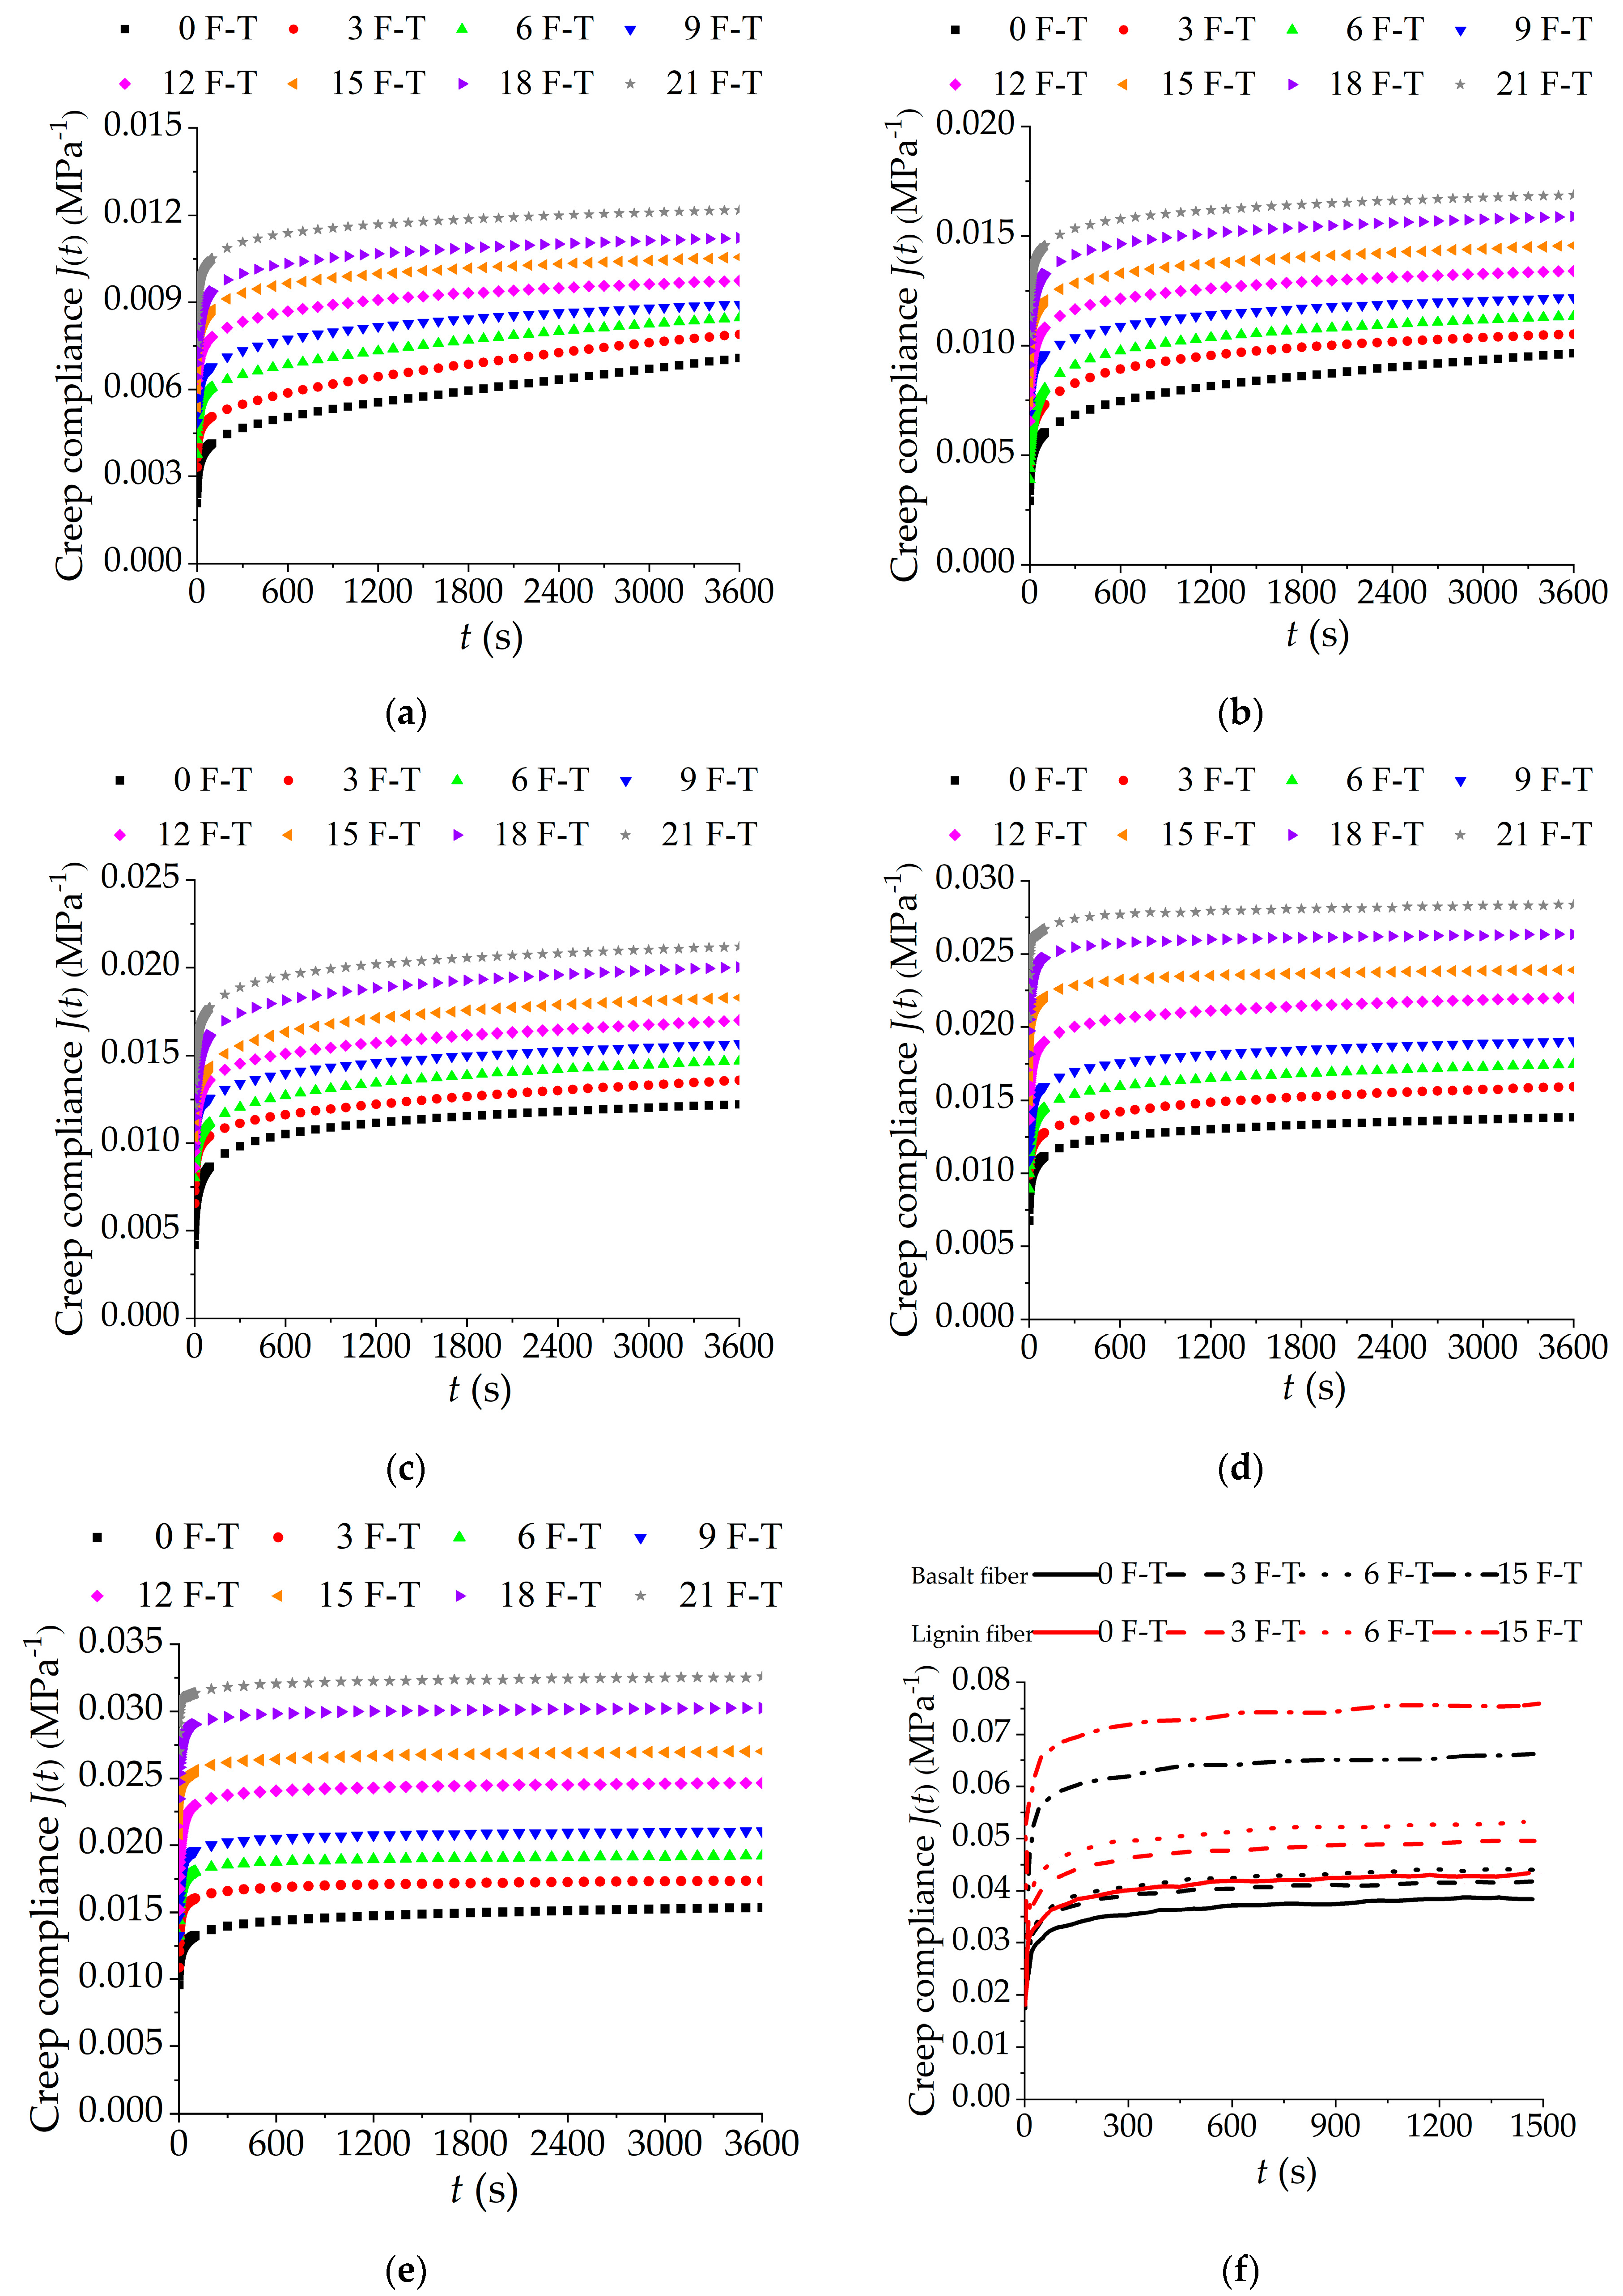
3.1.1. Creep Compliance Curve of Asphalt Mixtures Incorporating SBS Polymer and Basalt Fiber under F-T cycles
3.1.2. Influence Analysis of F-T Cycles on Creep Characteristics of Asphalt Mixtures Incorporating SBS Polymer and Basalt Fiber
- Analysis of Creep Behavior of Asphalt Mixtures Incorporating SBS Polymer and Basalt Fiber Based on Generalized Kelvin Model
- 2.
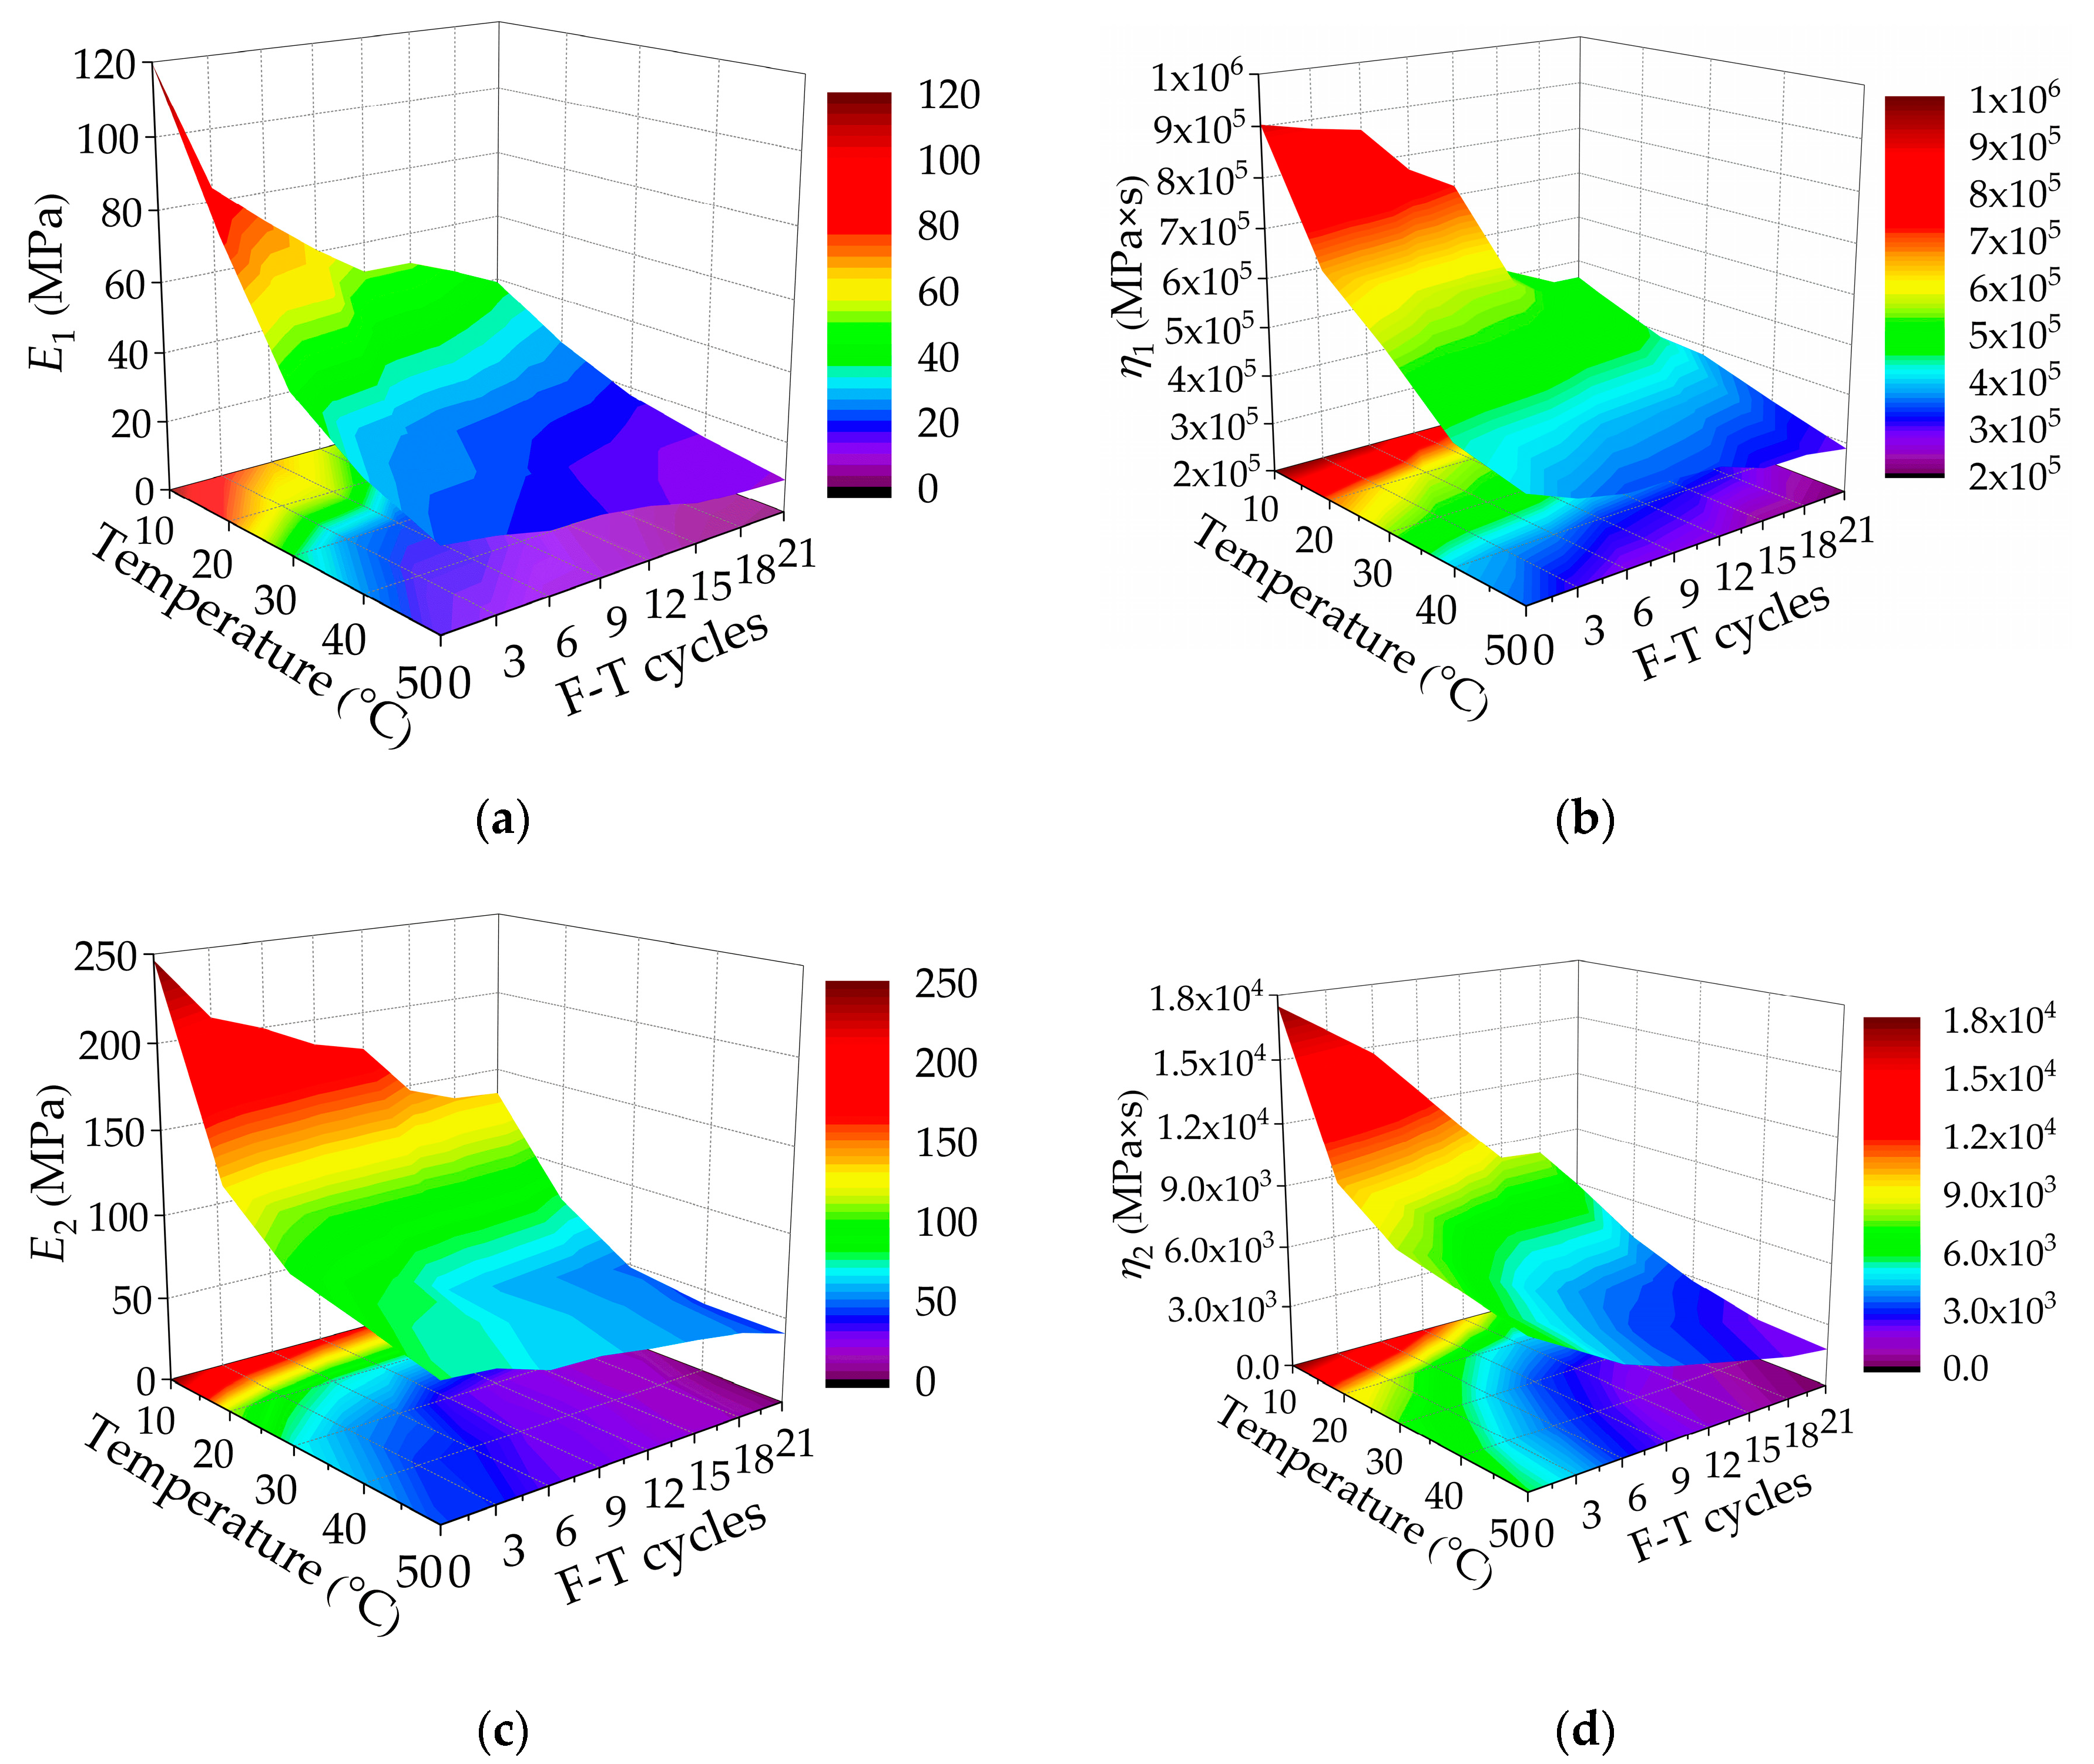
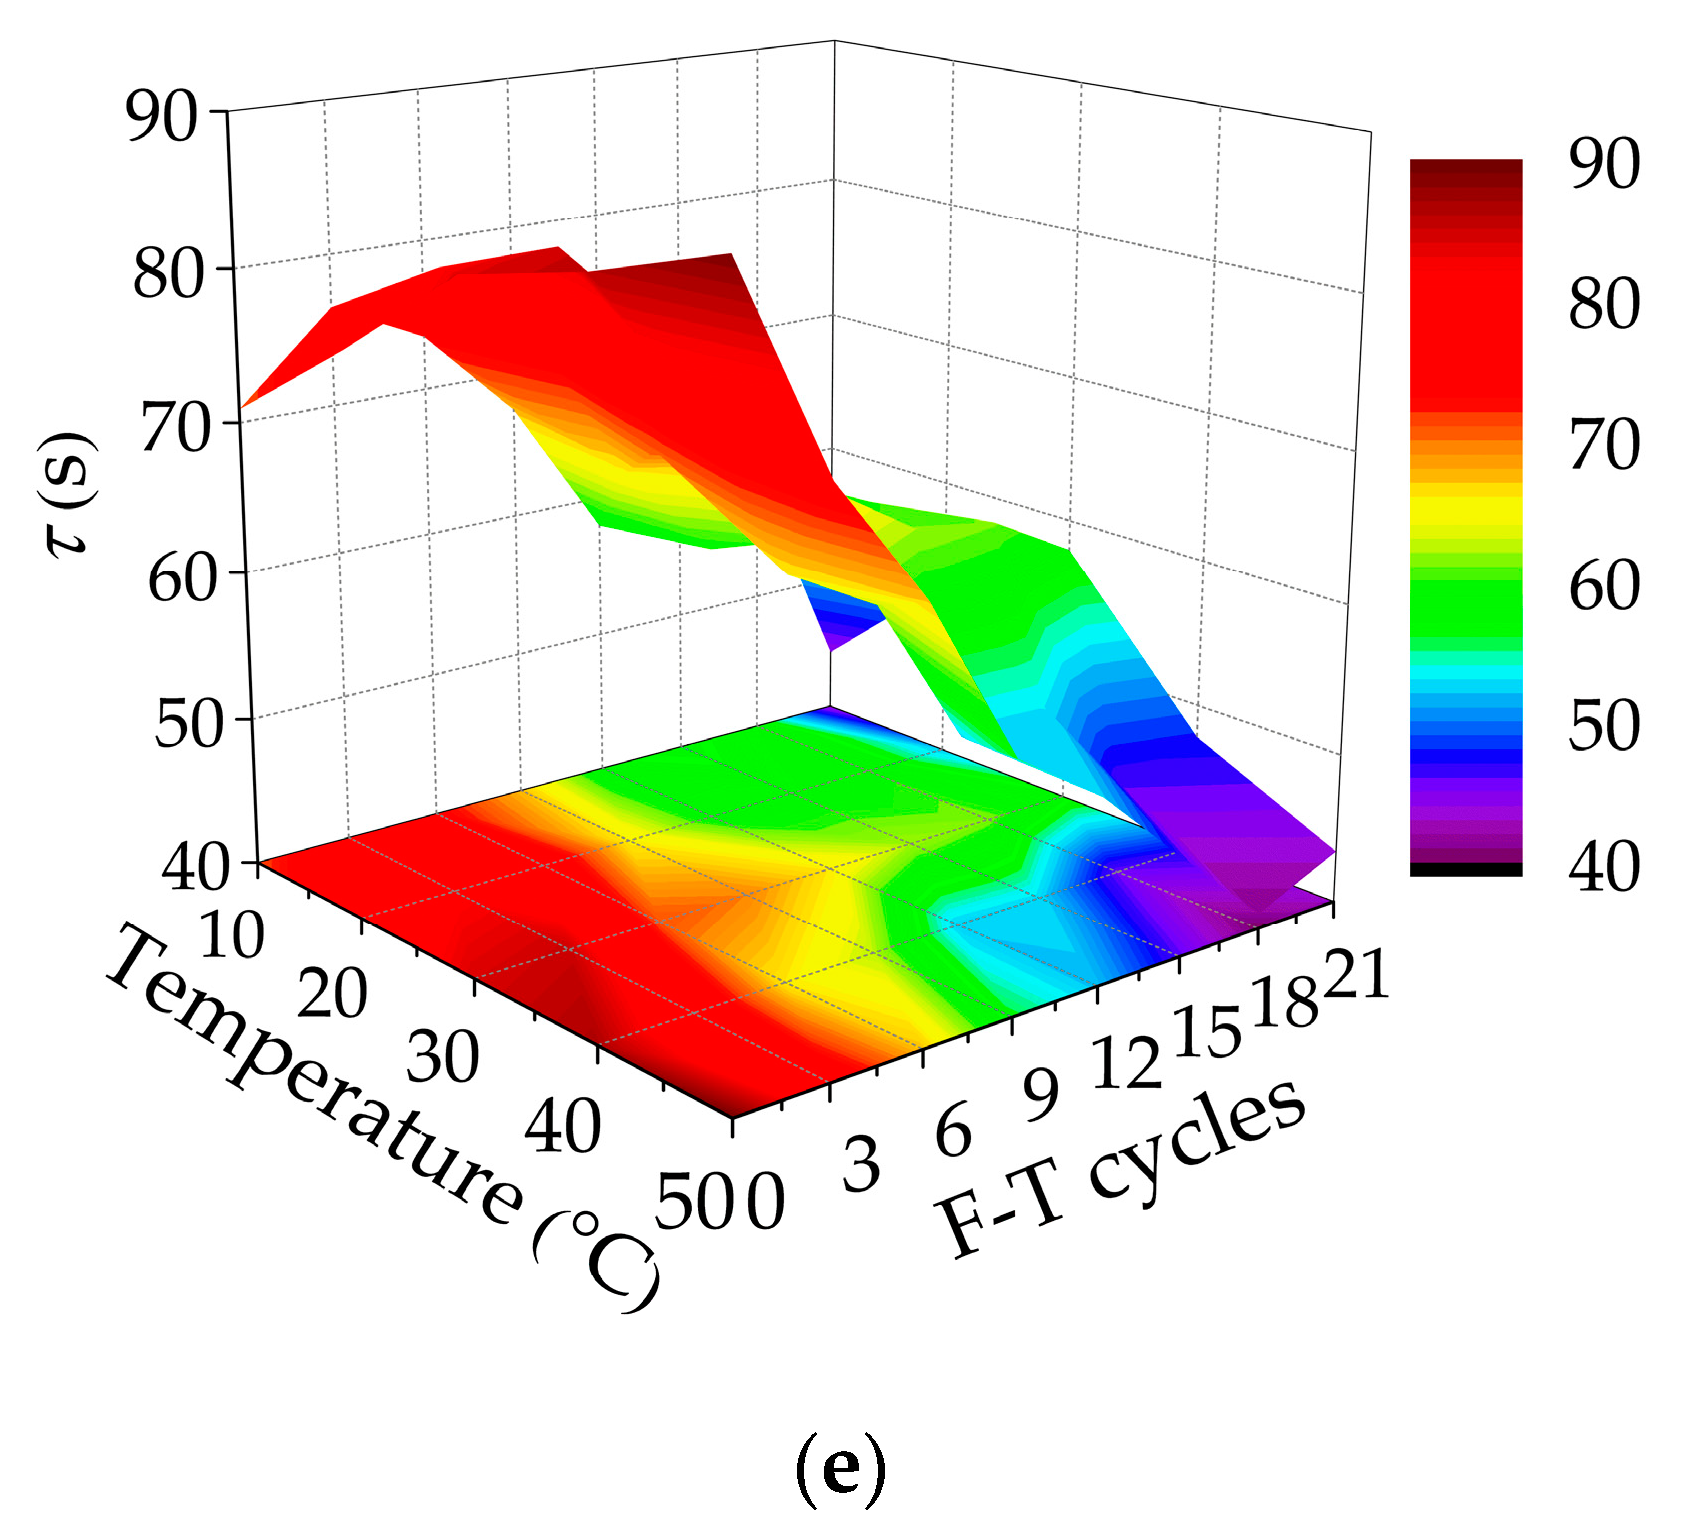
- Analysis of Creep Behavior of Asphalt Mixtures Incorporating SBS Polymer and Basalt Fiber Based on Burgers Model
3.2. Relaxation Characteristics of Asphalt Mixtures Incorporating SBS Polymer and Basalt Fiber under F-T Cycles
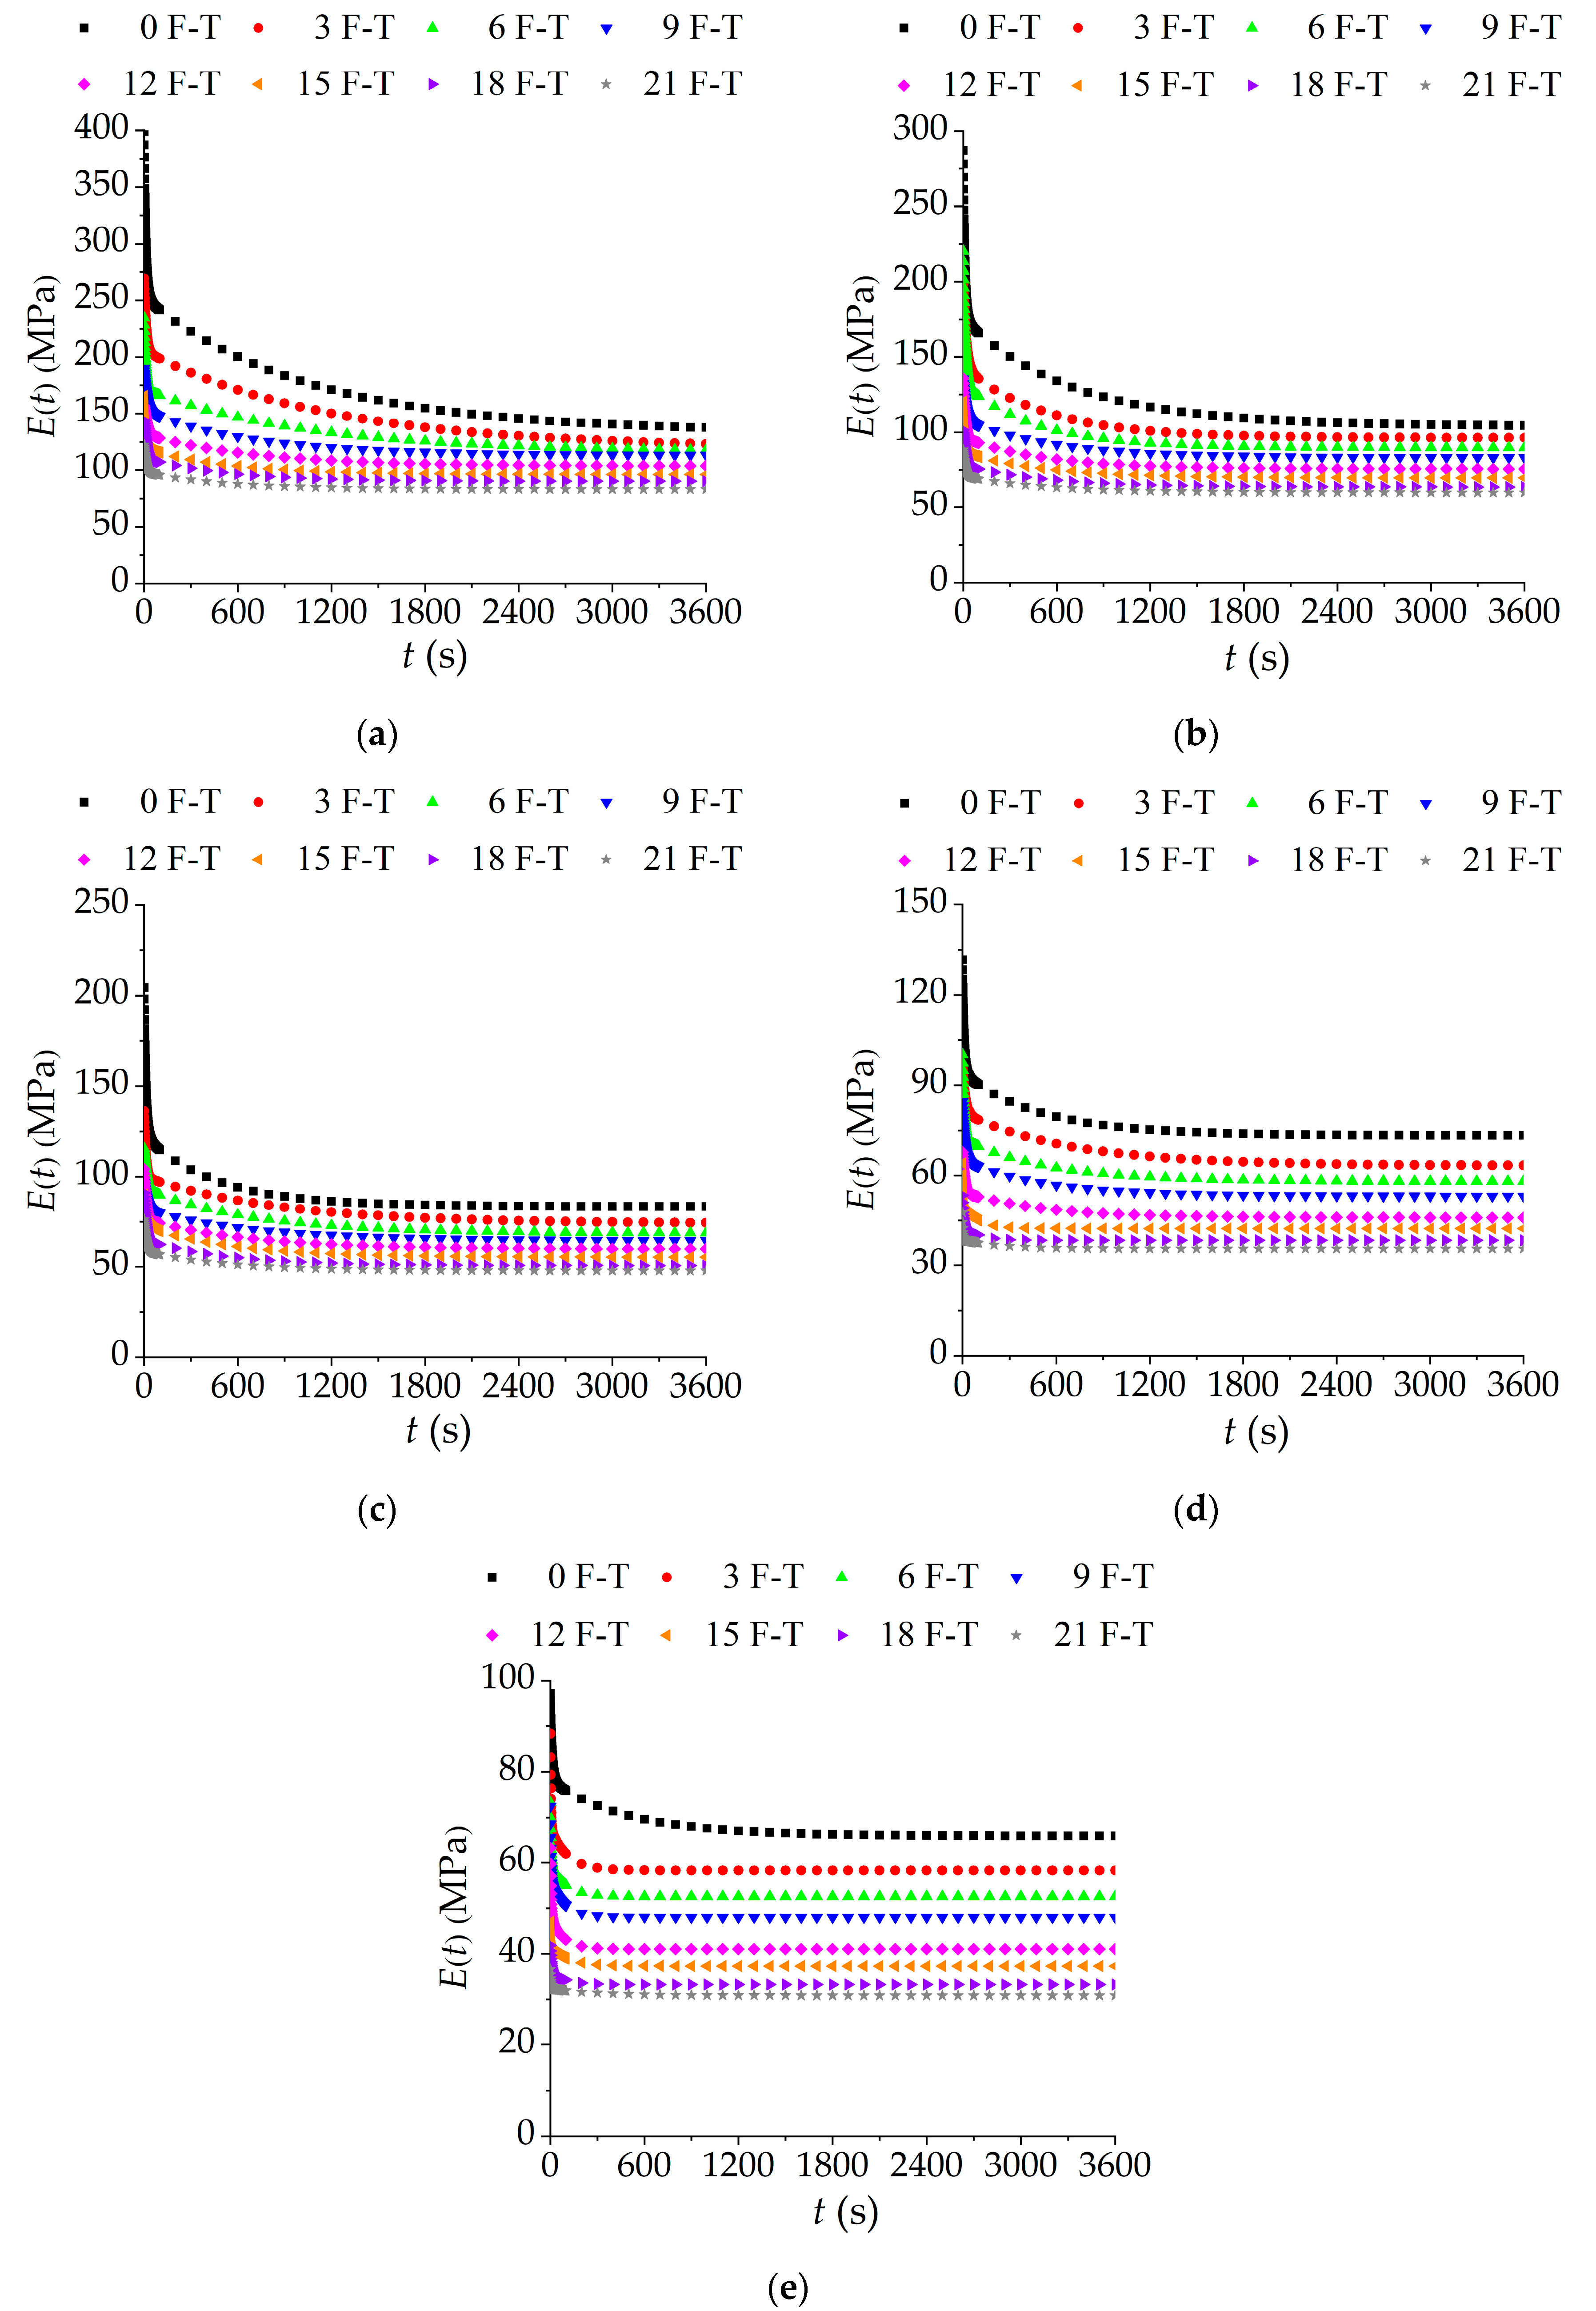
3.2.1. Relaxation Modulus Curve of Asphalt Mixtures Incorporating SBS Polymer and Basalt Fiber under F-T Cycles
3.2.2. Influence Analysis of F-T Cycles on Relaxation Characteristics of Asphalt Mixtures Incorporating SBS Polymer and Basalt Fiber
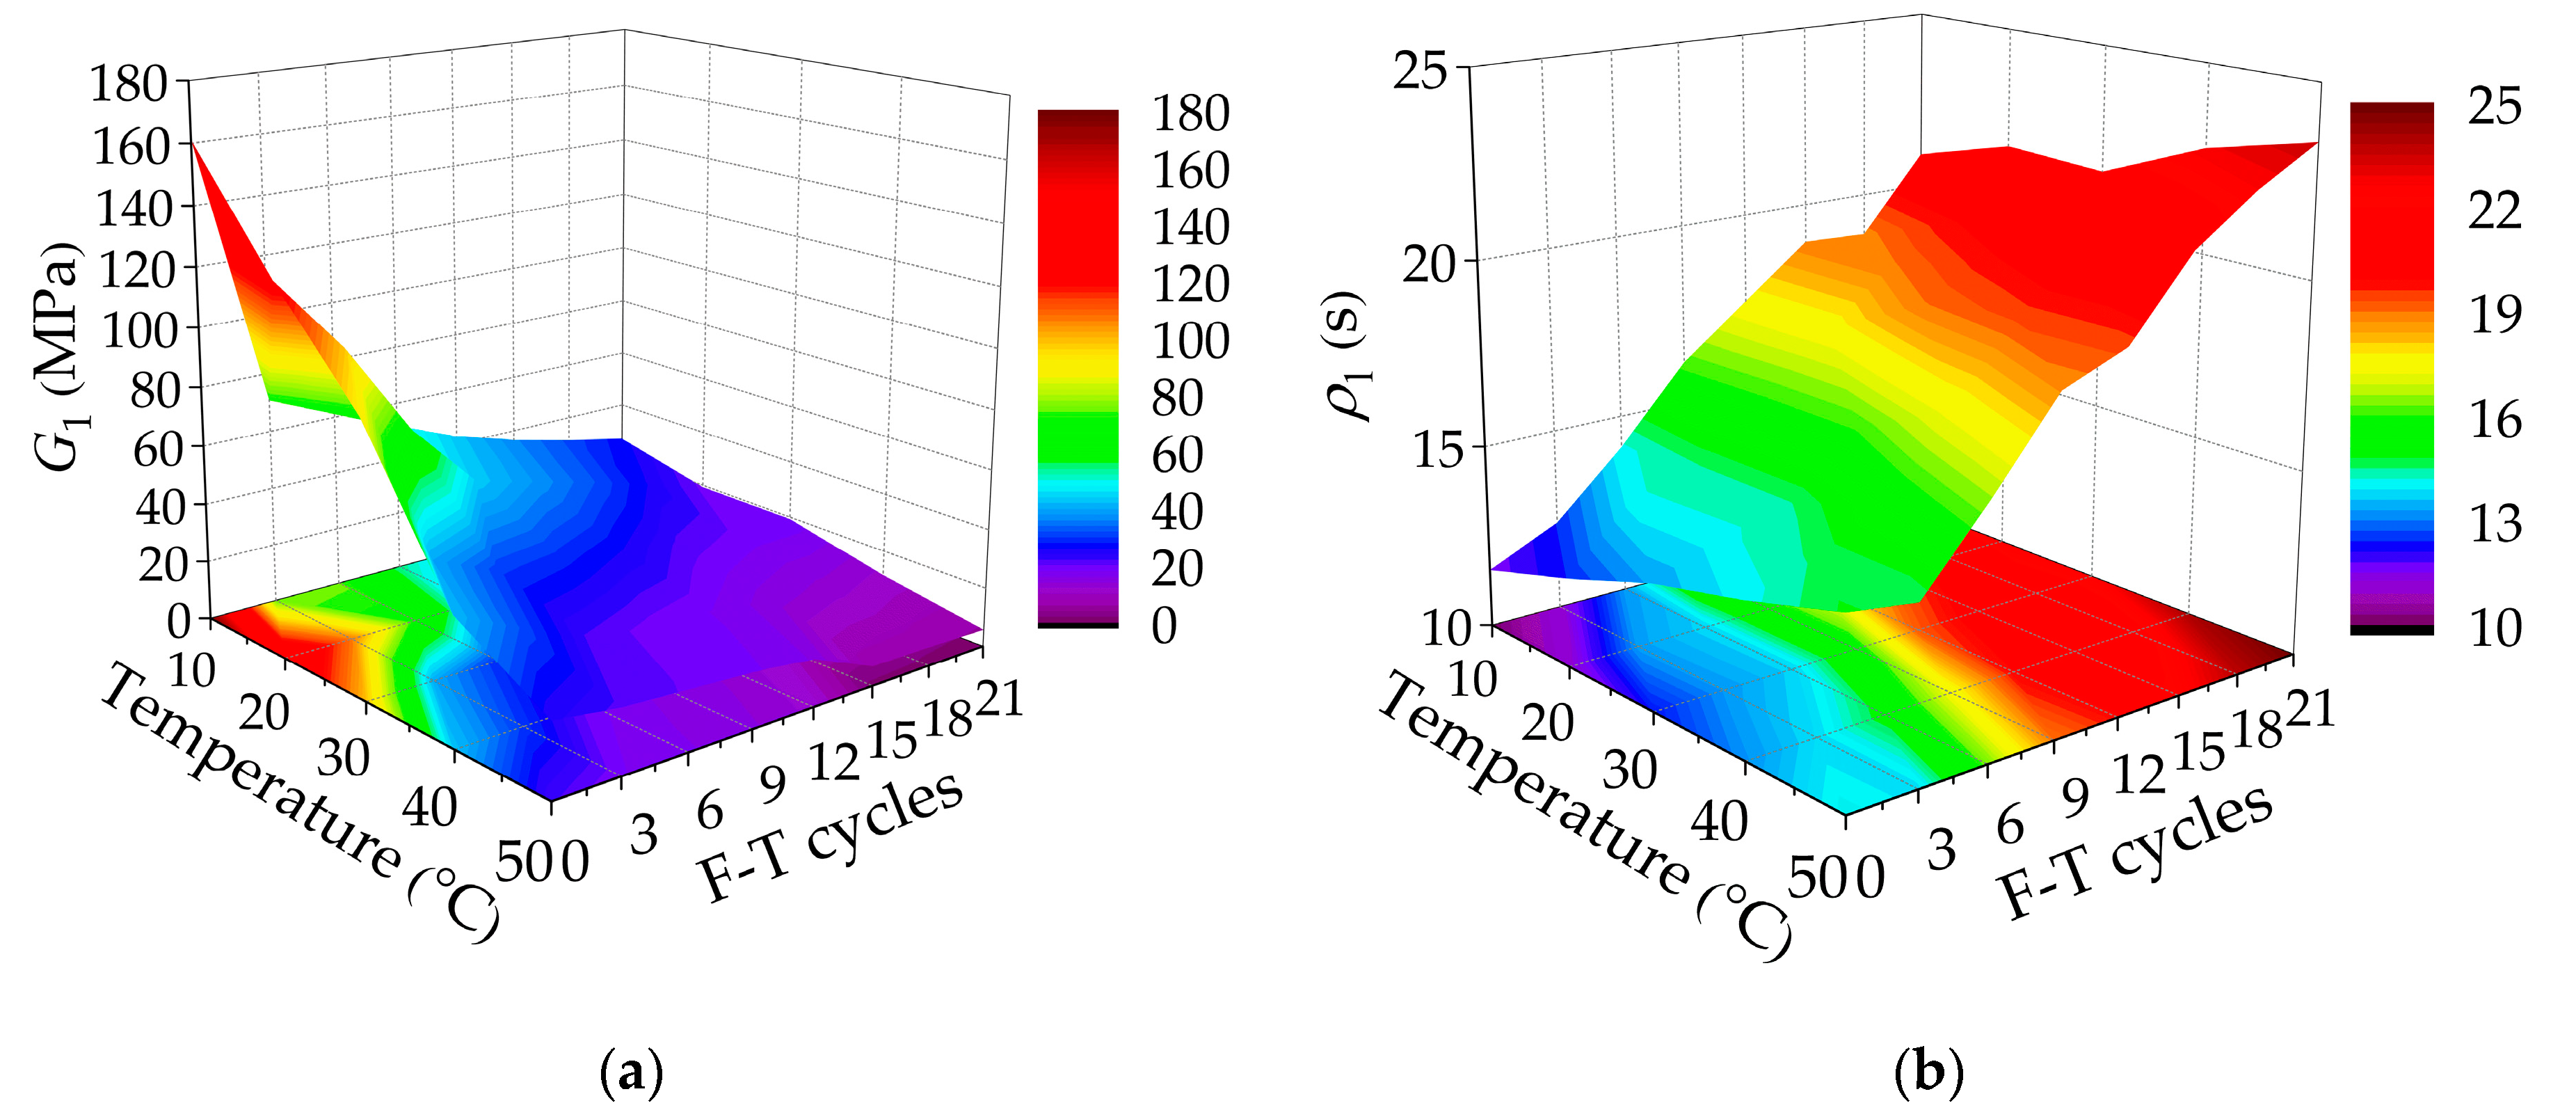
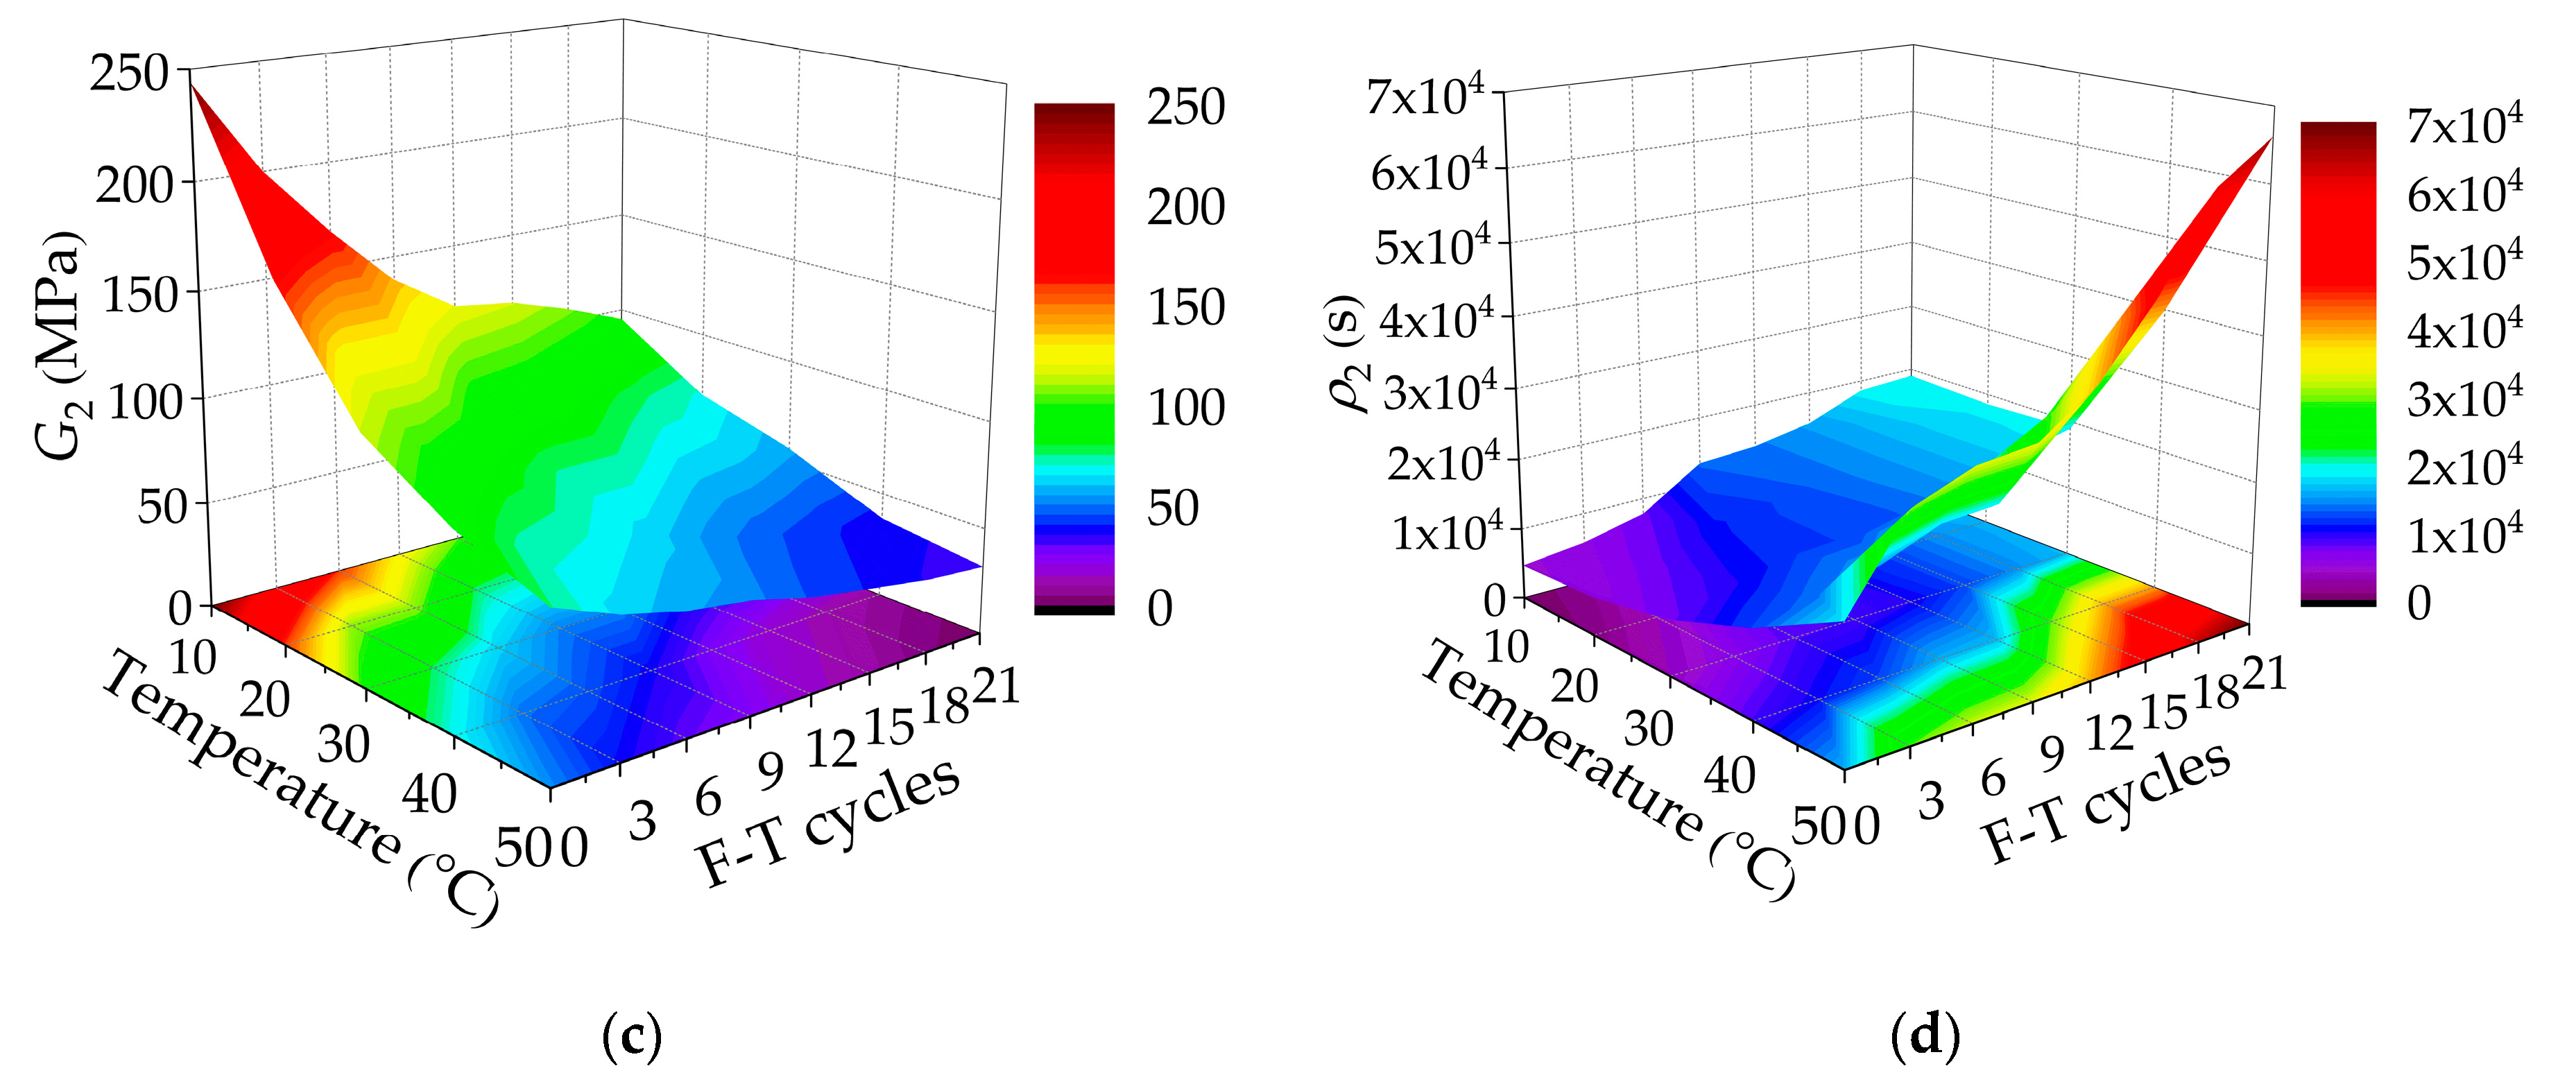
- Analysis of Relaxation Behavior of Asphalt Mixtures Incorporating SBS Polymer and Basalt Fiber Based on Generalized Maxwell Model
- 2.
- Analysis of Relaxation Behavior of Asphalt Mixtures Incorporating SBS Polymer and Basalt Fiber Based on Burgers Model
4. Conclusions
- Test results showed that F-T cycles caused a larger creep deformation of asphalt mixture, and the creep compliance increased accordingly, which led to a decrease in the rut resistance of the asphalt mixture. Compared with lignin fiber, the incorporation of SBS polymer and basalt fiber can improve the resistance to high-temperature deformation of asphalt mixtures under F-T cycles.
- The instantaneous elastic modulus E1, instantaneous viscosity coefficient η1, delayed elastic modulus E2, and delayed viscosity coefficient η2 of the Burgers model showed a decreasing trend as the number of F-T cycles increases, and the resistance to deformation decreased significantly in the early stage of F-T cycles. At the same time, the improvement effect of the basalt fiber on asphalt mixtures in the early stage was better than that of the lignin fiber.
- Based on the conversion between relaxation modulus and creep compliance, the relaxation modulus of the asphalt mixtures gradually decreased with F-T cycles. By analyzing the slope and Burgers model parameters of the relaxation modulus, it can be seen that the relaxation time increased with F-T cycles, which will not be conducive to its internal stress dissipation. However, compared with lignin fiber, basalt fiber can improve its low-temperature crack resistance to a certain extent.
Author Contributions
Funding
Acknowledgments
Conflicts of Interest
References
- Ding, X.H.; Ma, T.; Gu, L.H.; Zhang, Y. Investigation of surface micro-crack growth behavior of asphalt mortar based on the designed innovative mesoscopic test. Mater. Des. 2020, 185, 108238. [Google Scholar] [CrossRef]
- Ma, T.; Zhang, Y.; Zhang, D.Y.; Yan, J.H.; Ye, Q. Influences by air voids on fatigue life of asphalt mixture based on discrete element method. Constr. Build. Mater. 2016, 126, 785–799. [Google Scholar] [CrossRef]
- Jiao, Y.B.; Zhang, L.D.; Guo, Q.L.; Guo, M.; Zhang, Y. Acoustic Emission-Based Reinforcement Evaluation of Basalt and Steel Fibers on Low-Temperature Fracture Resistance of Asphalt Concrete. J. Mater. Civ. Eng. 2020, 32, 5. [Google Scholar] [CrossRef]
- Guo, Q.L.; Wang, H.Y.; Gao, Y.; Jiao, Y.B.; Liu, F.C.; Dong, Z.Z. Investigation of the low-temperature properties and cracking resistance of fiber-reinforced asphalt concrete using the DIC technique. Eng. Fract. Mech. 2020, 229. [Google Scholar] [CrossRef]
- Razmi, A.; Mirsayar, M.M. Fracture resistance of asphalt concrete modified with crumb rubber at low temperatures. Int. J. Pave. Res. Technol. 2018, 11, 265–273. [Google Scholar] [CrossRef]
- Guo, Q.L.; Li, L.L.; Cheng, Y.C.; Jiao, Y.B.; Xu, C. Laboratory evaluation on performance of diatomite and glass fiber compound modified asphalt mixture. Mater. Des. 2015, 66, 51–59. [Google Scholar] [CrossRef]
- Wang, W.S.; Cheng, Y.C.; Tan, G.J. Design optimization of SBS-modified asphalt mixture reinforced with eco-friendly basalt fiber based on response surface methodology. Materials 2018, 11, 1311. [Google Scholar] [CrossRef] [Green Version]
- Wang, W.S.; Cheng, Y.C.; Zhou, P.L.; Tan, G.J.; Wang, H.T.; Liu, H.B. Performance Evaluation of Styrene-Butadiene-Styrene-Modified Stone Mastic Asphalt with Basalt Fiber Using Different Compaction Methods. Polymers 2019, 11, 1006. [Google Scholar] [CrossRef] [Green Version]
- Karakas, A.S.; Kuloglu, N.; Kok, B.V.; Yilmaz, M. The evaluation of the field performance of the neat and SBS modified hot mixture asphalt. Constr. Build. Mater. 2015, 98, 678–684. [Google Scholar] [CrossRef]
- Wu, S.P.; Ye, Q.S.; Li, N. Investigation of rheological and fatigue properties of asphalt mixtures containing polyester fibers. Constr. Build. Mater. 2008, 22, 2111–2115. [Google Scholar] [CrossRef]
- Guo, M.; Tan, Y.Q.; Luo, D.S.; Li, Y.F.; Farooq, A.; Mo, L.T.; Jiao, Y.B. Effect of Recycling Agents on Rheological and Micromechanical Properties of SBS-Modified Asphalt Binders. Adv. Mater. Sci. Eng. 2018, 2018, 1–12. [Google Scholar] [CrossRef] [Green Version]
- Yu, H.; Bai, X.; Qian, G.; Wei, H.; Gong, X.; Jin, J.; Li, Z. Impact of Ultraviolet Radiation on the Aging Properties of SBS-Modified Asphalt Binders. Polymers 2019, 11, 1111. [Google Scholar] [CrossRef] [PubMed] [Green Version]
- Yan, C.Q.; Huang, W.D.; Ma, J.M.; Xu, J.; Lv, Q.; Lin, P. Characterizing the SBS polymer degradation within high content polymer modified asphalt using ATR-FTIR. Constr. Build. Mater. 2019, 233, 117708. [Google Scholar] [CrossRef]
- Imaninasab, R. Effect of granular polymers on rutting performance of SMA with respect to modification process. Constr. Build. Mater. 2017, 130, 64–72. [Google Scholar] [CrossRef]
- Wang, Y.H.; Chong, D.; Wen, Y. Quality verification of polymer-modified asphalt binder used in hot-mix asphalt pavement construction. Constr. Build. Mater. 2017, 150, 157–166. [Google Scholar] [CrossRef]
- Hajikarimi, P.; Tehrani, F.F.; Nejad, F.M.; Absi, J.; Rahi, M.; Khodaii, A.; Petit, C. Mechanical Behavior of Polymer-Modified Bituminous Mastics. I: Experimental Approach. J. Mater. Civ. Eng. 2019, 31, 4018337. [Google Scholar] [CrossRef]
- Hajikarimi, P.; Tehrani, F.F.; Nejad, F.M.; Absi, J.; Khodaii, A.; Rahi, M.; Petit, C. Mechanical Behavior of Polymer-Modified Bituminous Mastics. II: Numerical Approach. J. Mater. Civ. Eng. 2019, 31, 4018338. [Google Scholar] [CrossRef]
- Morova, N. Investigation of usability of basalt fibers in hot mix asphalt concrete. Constr. Build. Mater. 2013, 47, 175–180. [Google Scholar] [CrossRef]
- Zhang, J.W.; Huang, W.D.; Zhang, Y.; Lv, Q.; Yan, C.Q. Evaluating four typical fibers used for OGFC mixture modification regarding drainage, raveling, rutting and fatigue resistance. Constr. Build. Mater. 2020, 253, 119131. [Google Scholar] [CrossRef]
- Zhang, X.Y.; Gu, X.Y.; Lv, J.X. Effect of basalt fiber distribution on the flexural–tensile rheological performance of asphalt mortar. Constr. Build. Mater. 2018, 179, 307–314. [Google Scholar] [CrossRef]
- Sun, X.L.; Qin, X.; Chen, Q.; Ma, Q. Investigation of enhancing effect and mechanism of basalt fiber on toughness of asphalt material. Pet. Sci. Technol. 2018, 36, 1710–1717. [Google Scholar] [CrossRef]
- Qin, X.; Shen, A.Q.; Guo, Y.C.; Li, Z.N.; Lv, Z.H. Characterization of asphalt mastics reinforced with basalt fibers. Constr. Build. Mater. 2018, 159, 508–516. [Google Scholar] [CrossRef]
- Li, Z.N.; Shen, A.Q.; Wang, H.; Guo, Y.C.; Wu, H. Effect of basalt fiber on the low-temperature performance of an asphalt mixture in a heavily frozen area. Constr. Build. Mater. 2020, 253, 119080. [Google Scholar] [CrossRef]
- Gu, X.Y.; Xu, T.T.; Ni, F.J. Rheological behavior of basalt fiber reinforced asphalt mastic. J. Wuhan Univ. Technol. 2014, 29, 950–955. [Google Scholar] [CrossRef]
- Tanzadeh, R.; Tanzadeh, J.; Honarmand, M.; Tahami, S.A. Experimental study on the effect of basalt and glass fibers on behavior of open-graded friction course asphalt modified with nano-silica. Constr. Build. Mater. 2019, 212, 467–475. [Google Scholar] [CrossRef]
- Miao, Y.; Wang, T.; Wang, L. Influences of Interface Properties on the Performance of Fiber-Reinforced Asphalt Binder. Polymers 2019, 11, 542. [Google Scholar] [CrossRef] [PubMed] [Green Version]
- Luo, Y.F.; Zhang, K.; Xie, X.B.; Yao, X.G. Performance evaluation and material optimization of Micro-surfacing based on cracking and rutting resistance. Constr. Build. Mater. 2019, 206, 193–200. [Google Scholar] [CrossRef]
- Kou, C.; Wu, X.; Xiao, P.; Liu, Y.; Wu, Z. Physical, Rheological, and Morphological Properties of Asphalt Reinforced by Basalt Fiber and Lignin Fiber. Materials 2020, 13, 2520. [Google Scholar] [CrossRef]
- Pan, P.; Wu, S.P.; Hu, X.D.; Wang, P.; Liu, Q.T. Effect of freezing-thawing and ageing on thermal characteristics and mechanical properties of conductive asphalt concrete. Constr. Build. Mater. 2017, 140, 239–247. [Google Scholar] [CrossRef]
- Badeli, S.; Carter, A.; Dore, G.; Saliani, S. Evaluation of the durability and the performance of an asphalt mix involving Aramid Pulp Fiber (APF): Complex modulus before and after freeze-thaw cycles, fatigue, and TSRST tests. Constr. Build. Mater. 2018, 174, 60–71. [Google Scholar] [CrossRef]
- Xu, H.N.; Guo, W.; Tan, Y.Q. Permeability of asphalt mixtures exposed to freeze-thaw cycles. Cold Reg. Sci. Technol. 2016, 123, 99–106. [Google Scholar] [CrossRef]
- Guo, Q.L.; Li, G.Y.; Gao, Y.; Wang, K.Y.; Dong, Z.Z.; Liu, F.C.; Zhu, H. Experimental investigation on bonding property of asphalt-aggregate interface under the actions of salt immersion and freeze-thaw cycles. Constr. Build. Mater. 2019, 206, 590–599. [Google Scholar] [CrossRef]
- Chai, C.; Cheng, Y.-C.; Zhang, Y.; Chen, Y.; Zhu, B. Experimental Study on the Performance Decay of Permeable Asphalt Mixture in Seasonally Frozen Regions under Freeze-Thaw Cycles. Sustainability 2020, 12, 2966. [Google Scholar] [CrossRef] [Green Version]
- Xu, H.; Li, H.; Tan, Y.; Wang, L.; Hou, Y. A Micro-Scale Investigation on the Behaviors of Asphalt Mixtures under Freeze-Thaw Cycles Using Entropy Theory and a Computerized Tomography Scanning Technique. Entropy 2018, 20, 68. [Google Scholar] [CrossRef] [Green Version]
- Yi, J.Y.; Shen, S.H.; Muhunthan, B.; Feng, D.C. Viscoelastic-plastic damage model for porous asphalt mixtures: Application to uniaxial compression and freeze-thaw damage. Mech. Mater. 2014, 70, 67–75. [Google Scholar] [CrossRef]
- Tarefder, R.; Faisal, H.; Barlas, G. Freeze-thaw effects on fatigue LIFE of hot mix asphalt and creep stiffness of asphalt binder. Cold Reg. Sci. Technol. 2018, 153, 197–204. [Google Scholar] [CrossRef]
- Liang, C.; Ma, J.; Zhou, P.; Ma, G.; Xu, X. Fracture Damage Properties of SBS-Modified Asphalt Mixtures Reinforced with Basalt Fiber after Freeze-Thaw Cycles Using the Acoustic Emission Approach. Appl. Sci. 2020, 10, 3301. [Google Scholar] [CrossRef]
- Fan, Z.P.; Xu, H.N.; Xiao, J.Z.; Tan, Y.Q. Effects of freeze-thaw cycles on fatigue performance of asphalt mixture and development of fatigue-freeze-thaw (FFT) uniform equation. Constr. Build. Mater. 2020, 242, 118043. [Google Scholar] [CrossRef]
- Cheng, Y.; Wang, W.; Gong, Y.; Wang, S.; Yang, S.; Sun, X. Comparative Study on the Damage Characteristics of Asphalt Mixtures Reinforced with an Eco-Friendly Basalt Fiber under Freeze-thaw Cycles. Materials 2018, 11, 2488. [Google Scholar] [CrossRef] [Green Version]
- Wang, W.; Cheng, Y.; Ma, G.; Tan, G.; Sun, X.; Yang, S. Further Investigation on Damage Model of Eco-Friendly Basalt Fiber Modified Asphalt Mixture under Freeze-Thaw Cycles. Appl. Sci. 2019, 9, 60. [Google Scholar] [CrossRef] [Green Version]
- Cheng, Y.; Li, H.; Wang, W.; Li, L.; Wang, H. Laboratory Evaluation on the Performance Degradation of Styrene-Butadiene-Styrene-Modified Asphalt Mixture Reinforced with Basalt Fiber under Freeze–Thaw Cycles. Polymers 2020, 12, 1092. [Google Scholar] [CrossRef] [PubMed]
- Badeli, S.; Carter, A.; Dore, G. Complex Modulus and Fatigue Analysis of Asphalt Mix after Daily Rapid Freeze-Thaw Cycles. J. Mater. Civ. Eng. 2018, 4, 4018056. [Google Scholar] [CrossRef]
- Lachance-Tremblay, E.; Perraton, D.; Vaillancourt, M.; Di Benedetto, H. Degradation of asphalt mixtures with glass aggregates subjected to freeze-thaw cycles. Cold Reg. Sci. Technol. 2017, 141, 8–15. [Google Scholar] [CrossRef]
- Standard Test Methods of Bitumen and Bituminous Mixtures for Highway Engineering; JTG E20-2011; Ministry of Transport of the People’s Republic of China: Beijing, China, 2011. (In Chinese)
- Cheng, Y.; Wang, W.; Tao, J.; Xu, M.; Xu, X.; Ma, G.; Wang, S. Influence Analysis and Optimization for Aggregate Morphological Characteristics on High- and Low-Temperature Viscoelasticity of Asphalt Mixtures. Materials 2018, 11, 2034. [Google Scholar] [CrossRef] [Green Version]
- Wang, W.; Cheng, Y.; Tan, G.; Tao, J. Analysis of Aggregate Morphological Characteristics for Viscoelastic Properties of Asphalt Mixes Using Simplex Lattice Design. Materials 2018, 11, 1908. [Google Scholar] [CrossRef] [Green Version]
- Yu, D. Research on Performance Decay Characteristics and Mechanism of Basalt Fiber-Modified Asphalt Mixture under Freeze-Thaw Cycles. Ph.D. Thesis, Jilin University, Changchun, China, 2019. [Google Scholar]


| Parameters | Unit | Values |
|---|---|---|
| Penetration | 0.1 mm (@ 25 °C, 100 g, 5 s) | 72 |
| Ductility | cm (@ 15 °C, 5 cm/min) | 45 |
| Softening point | °C | 60.5 |
| Density | g/cm3 | 1.018 |
| Flash point | °C | 262 |
| Rolling thin film oven test (RTFOT) | ||
| Mass loss | % | −0.094 |
| Penetration ratio | % (@ 25 °C) | 66.9 |
| Parameters | Unit | Values | Standard Limits | |
|---|---|---|---|---|
| Crushing value | % | 13.6 | ≤26 | |
| Los Angeles abrasion value | % | 17.9 | ≤28 | |
| Apparent specific gravity | 13.2 mm | — | 2.836 | ≥2.6 |
| 9.5 mm | 2.805 | |||
| 4.75 mm | 2.726 | |||
| Water absorption | 13.2 mm | % | 0.6 | ≤2.0 |
| 9.5 mm | 0.28 | |||
| 4.75 mm | 0.7 | |||
| Parameters | Unit | Values | Standard Limits |
|---|---|---|---|
| Apparent specific gravity | — | 2.723 | ≥2.5 |
| Water absorption | % | 0.64 | — |
| Angularity (flow time) | s | 39.9 | ≥30 |
| Sand equivalent | % | 68 | ≥60 |
| Parameters | Unit | Values | Standard Limits | |
|---|---|---|---|---|
| Apparent density | t/m3 | 2.712 | ≥2.5 | |
| Hydrophilic coefficient | — | 0.63 | <1 | |
| Water content | % | 0.3 | ≤1 | |
| Plastic index | % | 2 | <4 | |
| Granular composition | <0.6 mm | % | 100 | 100 |
| <0.15 mm | 92.5 | 90~100 | ||
| <0.075 mm | 81.8 | 75~100 | ||
| Parameters | Unit | Values |
|---|---|---|
| Length | mm | 6 |
| Diameter | µm | 13 |
| Specific gravity | g/cm3 | 2.55~2.65 |
| Tensile strength | MPa | ≥3000 |
| Elongation at break | % | 3.2 |
| Parameters (MPa−1) | 0 F-T | 3 F-T | 6 F-T | 9 F-T | 12 F-T | 15 F-T | 18 F-T | 21 F-T |
|---|---|---|---|---|---|---|---|---|
| J0 | 1.50 × 10⁻³ | 2.69 × 10⁻³ | 2.73 × 10⁻³ | 4.05 × 10⁻³ | 5.38 × 10⁻³ | 3.98 × 10⁻³ | 5.50 × 10⁻³ | 6.20 × 10⁻³ |
| J1 | 6.01 × 10⁻⁴ | 9.18 × 10⁻⁴ | 6.36 × 10⁻⁴ | 5.25 × 10⁻⁴ | 6.29 × 10⁻⁴ | 9.51 × 10⁻⁴ | 9.42 × 10⁻⁴ | 8.78 × 10⁻⁴ |
| J2 | 6.69 × 10⁻⁴ | 2.48 × 10⁻³ | 1.32 × 10⁻³ | 2.00 × 10⁻³ | 1.87 × 10⁻³ | 1.58 × 10⁻³ | 1.36 × 10⁻³ | 1.27 × 10⁻³ |
| J3 | 6.93 × 10⁻⁴ | 2.49 × 10⁻³ | 4.02 × 10⁻³ | 8.80 × 10⁻⁴ | 8.93 × 10⁻⁴ | 7.85 × 10⁻⁴ | 9.12 × 10⁻⁴ | 8.01 × 10⁻⁴ |
| J4 | 2.40 × 10⁻⁴ | 5.54 × 10⁻⁴ | 6.06 × 10⁻⁴ | 6.08 × 10⁻⁴ | 6.67 × 10⁻⁴ | 1.03 × 10⁻³ | 9.89 × 10⁻⁴ | 7.73 × 10⁻⁴ |
| J5 | 6.50 × 10⁻⁴ | 6.53 × 10⁻⁴ | 1.35 × 10⁻³ | 8.54 × 10⁻⁴ | 7.34 × 10⁻⁴ | 1.46 × 10⁻³ | 1.01 × 10⁻³ | 1.52 × 10⁻³ |
| J6 | 7.53 × 10⁻⁴ | 6.02 × 10⁻⁴ | 9.08 × 10⁻⁴ | 6.36 × 10⁻⁴ | 5.39 × 10⁻⁴ | 1.33 × 10⁻³ | 8.42 × 10⁻⁴ | 1.02 × 10⁻³ |
| R2 | 0.99999 | 0.99999 | 0.99999 | 0.99999 | 0.99997 | 0.99997 | 0.99999 | 0.99999 |
| Parameters (MPa−1) | 0 F-T | 3 F-T | 6 F-T | 9 F-T | 12 F-T | 15 F-T | 18 F-T | 21 F-T |
|---|---|---|---|---|---|---|---|---|
| J0 | 1.94 × 10⁻³ | 4.12 × 10⁻³ | 3.10 × 10⁻³ | 6.14 × 10⁻³ | 5.02 × 10⁻³ | 5.50 × 10⁻³ | 7.79 × 10⁻³ | 8.59 × 10⁻³ |
| J1 | 9.99 × 10⁻⁴ | 1.39 × 10⁻³ | 2.48 × 10⁻³ | 1.90 × 10⁻³ | 2.03 × 10⁻³ | 2.18 × 10⁻³ | 1.93 × 10⁻³ | 1.75 × 10⁻³ |
| J2 | 5.01 × 10⁻³ | 1.20 × 10⁻³ | 1.51 × 10⁻³ | 1.03 × 10⁻³ | 1.24 × 10⁻³ | 1.31 × 10⁻³ | 1.40 × 10⁻³ | 1.07 × 10⁻³ |
| J3 | 7.47 × 10⁻⁴ | 2.33 × 10⁻³ | 1.49 × 10⁻³ | 1.22 × 10⁻³ | 1.25 × 10⁻³ | 1.08 × 10⁻³ | 1.29 × 10⁻³ | 1.11 × 10⁻³ |
| J4 | 1.01 × 10⁻³ | 8.27 × 10⁻⁴ | 1.44 × 10⁻³ | 7.77 × 10⁻⁴ | 1.30 × 10⁻³ | 1.42 × 10⁻³ | 1.33 × 10⁻³ | 1.22 × 10⁻³ |
| J5 | 1.51 × 10⁻³ | 6.66 × 10⁻⁴ | 1.17 × 10⁻³ | 7.46 × 10⁻⁴ | 1.48 × 10⁻³ | 2.02 × 10⁻³ | 1.44 × 10⁻³ | 2.11 × 10⁻³ |
| J6 | 9.48 × 10⁻⁴ | 6.67 × 10⁻⁴ | 9.93 × 10⁻⁴ | 8.19 × 10⁻⁴ | 1.48 × 10⁻³ | 1.84 × 10⁻³ | 1.19 × 10⁻³ | 1.41 × 10⁻³ |
| R2 | 0.99999 | 0.99999 | 0.99999 | 0.99999 | 0.99999 | 0.99997 | 0.99999 | 0.99999 |
| Parameters (MPa−1) | 0 F-T | 3 F-T | 6 F-T | 9 F-T | 12 F-T | 15 F-T | 18 F-T | 21 F-T |
|---|---|---|---|---|---|---|---|---|
| J0 | 3.34 × 10⁻³ | 5.23 × 10⁻³ | 6.66 × 10⁻³ | 8.66 × 10⁻³ | 6.91 × 10⁻³ | 9.22 × 10⁻³ | 7.50 × 10⁻³ | 1.04 × 10⁻² |
| J1 | 1.55 × 10⁻³ | 1.46 × 10⁻³ | 1.45 × 10⁻³ | 1.44 × 10⁻³ | 9.58 × 10⁻⁴ | 2.85 × 10⁻³ | 3.03 × 10⁻³ | 2.57 × 10⁻³ |
| J2 | 1.60 × 10⁻³ | 1.16 × 10⁻³ | 9.99 × 10⁻⁴ | 1.07 × 10⁻³ | 1.51 × 10⁻³ | 1.55 × 10⁻³ | 1.85 × 10⁻³ | 1.87 × 10⁻³ |
| J3 | 1.26 × 10⁻³ | 2.76 × 10⁻³ | 3.28 × 10⁻³ | 3.01 × 10⁻³ | 1.57 × 10⁻³ | 1.82 × 10⁻³ | 1.86 × 10⁻³ | 1.72 × 10⁻³ |
| J4 | 1.62 × 10⁻³ | 1.05 × 10⁻³ | 8.64 × 10⁻⁴ | 1.01 × 10⁻³ | 1.34 × 10⁻³ | 1.17 × 10⁻³ | 1.94 × 10⁻³ | 1.59 × 10⁻³ |
| J5 | 2.67 × 10⁻³ | 1.44 × 10⁻³ | 1.05 × 10⁻³ | 8.67 × 10⁻⁴ | 2.33 × 10⁻³ | 1.12 × 10⁻³ | 2.21 × 10⁻³ | 1.91 × 10⁻³ |
| J6 | 1.07 × 10⁻³ | 1.93 × 10⁻³ | 1.40 × 10⁻³ | 1.18 × 10⁻³ | 1.90 × 10⁻³ | 1.23 × 10⁻³ | 2.20 × 10⁻³ | 1.78 × 10⁻³ |
| R2 | 0.99999 | 0.99998 | 0.99999 | 0.99997 | 0.99998 | 0.99999 | 0.99999 | 0.99999 |
| Parameters (MPa−1) | 0 F-T | 3 F-T | 6 F-T | 9 F-T | 12 F-T | 15 F-T | 18 F-T | 21 F-T |
|---|---|---|---|---|---|---|---|---|
| J0 | 5.18 × 10⁻³ | 8.80 × 10⁻³ | 6.59 × 10⁻³ | 9.35 × 10⁻³ | 1.12 × 10⁻² | 1.06 × 10⁻² | 1.44 × 10⁻² | 1.51 × 10⁻² |
| J1 | 1.34 × 10⁻³ | 1.46 × 10⁻³ | 2.61 × 10⁻³ | 2.31 × 10⁻³ | 2.29 × 10⁻³ | 9.68 × 10⁻⁴ | 9.88 × 10⁻⁴ | 1.18 × 10⁻³ |
| J2 | 1.29 × 10⁻³ | 1.09 × 10⁻³ | 1.57 × 10⁻³ | 1.68 × 10⁻³ | 1.40 × 10⁻³ | 1.68 × 10⁻³ | 8.92 × 10⁻⁴ | 8.42 × 10⁻⁴ |
| J3 | 1.53 × 10⁻³ | 3.06 × 10⁻³ | 1.30 × 10⁻³ | 1.55 × 10⁻³ | 1.45 × 10⁻³ | 1.18 × 10⁻³ | 1.44 × 10⁻³ | 7.84 × 10⁻⁴ |
| J4 | 1.28 × 10⁻³ | 1.03 × 10⁻³ | 1.70 × 10⁻³ | 1.60 × 10⁻³ | 1.59 × 10⁻³ | 3.92 × 10⁻³ | 2.93 × 10⁻³ | 5.69 × 10⁻³ |
| J5 | 2.09 × 10⁻³ | 1.82 × 10⁻³ | 2.2 × 10⁻³ | 1.72 × 10⁻³ | 1.84 × 10⁻³ | 2.45 × 10⁻³ | 1.93 × 10⁻³ | 2.75 × 10⁻³ |
| J6 | 1.52 × 10⁻³ | 1.20 × 10⁻³ | 2.42 × 10⁻³ | 1.43 × 10⁻³ | 2.75 × 10⁻³ | 3.28 × 10⁻³ | 4.19 × 10⁻³ | 2.40 × 10⁻³ |
| R2 | 0.99999 | 0.99997 | 0.99997 | 0.99999 | 0.99999 | 0.99999 | 0.99984 | 0.99999 |
| Parameters (MPa−1) | 0 F-T | 3 F-T | 6 F-T | 9 F-T | 12 F-T | 15 F-T | 18 F-T | 21 F-T |
|---|---|---|---|---|---|---|---|---|
| J0 | 7.82 × 10⁻³ | 7.69 × 10⁻³ | 1.04 × 10⁻² | 9.89 × 10⁻³ | 1.18 × 10⁻² | 1.65 × 10⁻² | 2.05 × 10⁻² | 2.32 × 10⁻² |
| J1 | 1.11 × 10⁻³ | 7.03 × 10⁻⁴ | 7.20 × 10⁻⁴ | 7.31 × 10⁻⁴ | 8.84 × 10⁻⁴ | 9.63 × 10⁻⁴ | 7.66 × 10⁻⁴ | 7.99 × 10⁻⁴ |
| J2 | 1.01 × 10⁻³ | 1.22 × 10⁻³ | 1.05 × 10⁻³ | 1.53 × 10⁻³ | 1.95 × 10⁻³ | 1.34 × 10⁻³ | 6.12 × 10⁻⁴ | 5.61 × 10⁻⁴ |
| J3 | 1.28 × 10⁻³ | 8.53 × 10⁻⁴ | 6.50 × 10⁻⁴ | 8.62 × 10⁻⁴ | 9.69 × 10⁻⁴ | 1.44 × 10⁻³ | 1.24 × 10⁻³ | 4.54 × 10⁻⁴ |
| J4 | 9.74 × 10⁻⁴ | 2.85 × 10⁻³ | 3.05 × 10⁻³ | 2.48 × 10⁻³ | 2.55 × 10⁻³ | 2.31 × 10⁻³ | 1.68 × 10⁻³ | 1.45 × 10⁻³ |
| J5 | 1.60 × 10⁻³ | 1.78 × 10⁻³ | 2.14 × 10⁻³ | 2.15 × 10⁻³ | 3.03 × 10⁻³ | 1.66 × 10⁻³ | 3.22 × 10⁻³ | 4.18 × 10⁻³ |
| J6 | 1.92 × 10⁻³ | 2.38 × 10⁻³ | 1.41 × 10⁻³ | 3.51 × 10⁻³ | 3.53 × 10⁻³ | 4.69 × 10⁻³ | 2.37 × 10⁻³ | 2.01 × 10⁻³ |
| R2 | 0.99999 | 0.99994 | 0.99984 | 0.99999 | 0.99994 | 0.99983 | 0.99996 | 0.99929 |
| Parameters | 0 F-T | 3 F-T | 6 F-T | 9 F-T | 12 F-T | 15 F-T | 18 F-T | 21 F-T |
|---|---|---|---|---|---|---|---|---|
| E1 (MPa) | 119.66 | 83.75 | 71.69 | 60.67 | 51.18 | 50.98 | 45.38 | 38.99 |
| η1 (MPa·s) | 9.03 × 10⁵ | 8.82 × 10⁵ | 8.66 × 10⁵ | 7.70 × 10⁵ | 7.19 × 10⁵ | 5.21 × 10⁵ | 4.63 × 10⁵ | 4.62 × 10⁵ |
| E2 (MPa) | 246.66 | 210.17 | 199.39 | 185.29 | 177.80 | 146.78 | 136.42 | 134.55 |
| η2 (MPa·s) | 1.75 × 10⁴ | 1.61 × 10⁴ | 1.47 × 10⁴ | 1.25 × 10⁴ | 1.03 × 10⁴ | 8.23 × 10³ | 8.10 × 10³ | 5.95 × 10³ |
| τ (s) | 70.86 | 76.51 | 73.54 | 67.44 | 58.00 | 56.09 | 59.35 | 44.22 |
| R2 | 0.98704 | 0.98724 | 0.9747 | 0.98357 | 0.98447 | 0.95832 | 0.96978 | 0.96341 |
| Parameters | 0 F-T | 3 F-T | 6 F-T | 9 F-T | 12 F-T | 15 F-T | 18 F-T | 21 F-T |
|---|---|---|---|---|---|---|---|---|
| E1 (MPa) | 78.70 | 61.45 | 58.79 | 40.69 | 39.11 | 34.91 | 30.15 | 26.49 |
| η1 (MPa·s) | 6.58 × 10⁵ | 6.14 × 10⁵ | 5.75 × 10⁵ | 5.56 × 10⁵ | 5.52 × 10⁵ | 5.02 × 10⁵ | 4.91 × 10⁵ | 3.92 × 10⁵ |
| E2 (MPa) | 131.31 | 110.43 | 99.73 | 96.23 | 93.05 | 92.46 | 89.39 | 77.23 |
| η2 (MPa·s) | 1.01 × 10⁴ | 8.96 × 10³ | 7.58 × 10³ | 6.32 × 10³ | 5.50 × 10³ | 5.47 × 10³ | 5.35 × 10³ | 4.06 × 10³ |
| τ (s) | 77.00 | 81.17 | 76.04 | 65.64 | 59.12 | 59.15 | 59.90 | 52.55 |
| R2 | 0.98276 | 0.98828 | 0.98019 | 0.98289 | 0.96573 | 0.95832 | 0.96978 | 0.96341 |
| Parameters | 0 F-T | 3 F-T | 6 F-T | 9 F-T | 12 F-T | 15 F-T | 18 F-T | 21 F-T |
|---|---|---|---|---|---|---|---|---|
| E1 (MPa) | 44.58 | 30.91 | 27.12 | 23.67 | 23.29 | 21.19 | 20.46 | 17.66 |
| η1 (MPa·s) | 5.54 × 10⁵ | 5.27 × 10⁵ | 5.21 × 10⁵ | 5.12 × 10⁵ | 4.85 × 10⁵ | 4.77 × 10⁵ | 4.37 × 10⁵ | 3.80 × 10⁵ |
| E2 (MPa) | 97.05 | 84.64 | 79.47 | 64.96 | 59.53 | 56.02 | 52.38 | 48.37 |
| η2 (MPa·s) | 8.12 × 10³ | 7.15 × 10³ | 5.63 × 10³ | 4.50 × 10³ | 3.92 × 10³ | 3.48 × 10³ | 3.20 × 10³ | 2.80 × 10³ |
| τ (s) | 83.69 | 84.45 | 70.86 | 69.30 | 65.83 | 62.07 | 61.18 | 57.91 |
| R2 | 0.98019 | 0.97108 | 0.98357 | 0.98447 | 0.96642 | 0.98289 | 0.96573 | 0.96978 |
| Parameters | 0 F-T | 3 F-T | 6 F-T | 9 F-T | 12 F-T | 15 F-T | 18 F-T | 21 F-T |
|---|---|---|---|---|---|---|---|---|
| E1 (MPa) | 30.80 | 23.82 | 23.65 | 20.41 | 16.49 | 15.52 | 13.09 | 12.93 |
| η1 (MPa·s) | 4.35 × 10⁵ | 4.20 × 10⁵ | 4.12 × 10⁵ | 3.89 × 10⁵ | 3.82 × 10⁵ | 3.75 × 10⁵ | 3.66 × 10⁵ | 3.32 × 10⁵ |
| E2 (MPa) | 86.59 | 74.16 | 71.34 | 62.72 | 59.88 | 55.45 | 52.60 | 41.68 |
| η2 (MPa·s) | 7.44 × 10³ | 5.72 × 10³ | 4.70 × 10³ | 3.93 × 10³ | 3.15 × 10³ | 2.94 × 10³ | 2.43 × 10³ | 1.99 × 10³ |
| τ (s) | 85.91 | 77.08 | 65.92 | 62.58 | 52.60 | 53.02 | 46.13 | 47.79 |
| R2 | 0.96573 | 0.98447 | 0.95832 | 0.96978 | 0.96341 | 0.93558 | 0.93804 | 0.91875 |
| Parameters | 0 F-T | 3 F-T | 6 F-T | 9 F-T | 12 F-T | 15 F-T | 18 F-T | 21 F-T |
|---|---|---|---|---|---|---|---|---|
| E1 (MPa) | 22.73 | 20.56 | 17.27 | 16.94 | 14.80 | 11.25 | 10.09 | 9.36 |
| η1 (MPa·s) | 4.03 × 10⁵ | 3.64 × 10⁵ | 3.44 × 10⁵ | 3.43 × 10⁵ | 3.37 × 10⁵ | 3.05 × 10⁵ | 3.04 × 10⁵ | 2.89 × 10⁵ |
| E2 (MPa) | 75.58 | 72.81 | 63.04 | 62.10 | 57.52 | 54.08 | 49.60 | 40.88 |
| η2 (MPa·s) | 6.72 × 10³ | 5.50 × 10³ | 4.24 × 10³ | 3.50 × 10³ | 3.00 × 10³ | 2.52 × 10³ | 2.03 × 10³ | 1.78 × 10³ |
| τ (s) | 88.92 | 75.47 | 67.26 | 56.28 | 52.24 | 46.57 | 41.01 | 43.45 |
| R2 | 0.96341 | 0.93558 | 0.93804 | 0.94262 | 0.94858 | 0.9356 | 0.94006 | 0.92856 |
| Parameters | 0 F-T | 3 F-T | 6 F-T | 9 F-T | 12 F-T | 15 F-T | 18 F-T | 21 F-T | |
|---|---|---|---|---|---|---|---|---|---|
| 10 °C | Slope | 2.633 | 2.483 | 2.372 | 2.308 | 2.222 | 2.183 | 2.146 | 2.075 |
| Intercept | −0.134 | −0.103 | −0.082 | −0.073 | −0.059 | −0.061 | −0.058 | −0.047 | |
| R2 | 0.96341 | 0.97980 | 0.96223 | 0.97636 | 0.99236 | 0.99275 | 0.94615 | 0.96925 | |
| 20 °C | Slope | 2.465 | 2.338 | 2.318 | 2.154 | 2.106 | 2.044 | 1.995 | 1.933 |
| Intercept | −0.128 | −0.111 | −0.104 | −0.069 | −0.069 | −0.061 | −0.058 | −0.047 | |
| R2 | 0.96341 | 0.98640 | 0.99184 | 0.96112 | 0.99306 | 0.96026 | 0.94633 | 0.96910 | |
| 30 °C | Slope | 2.285 | 2.125 | 2.092 | 2.015 | 1.999 | 1.978 | 1.932 | 1.870 |
| Intercept | −0.111 | −0.073 | −0.073 | −0.069 | −0.069 | −0.066 | −0.059 | −0.058 | |
| R2 | 0.96341 | 0.96108 | 0.98009 | 0.99236 | 0.99281 | 0.97146 | 0.99305 | 0.95997 | |
| 40 °C | Slope | 2.093 | 2.009 | 1.965 | 1.916 | 1.818 | 1.730 | 1.667 | 1.614 |
| Intercept | −0.069 | −0.061 | −0.059 | −0.058 | −0.047 | −0.034 | −0.028 | −0.020 | |
| R2 | 0.96341 | 0.96008 | 0.99277 | 0.94616 | 0.96920 | 0.96666 | 0.92164 | 0.92202 | |
| 50 °C | Slope | 1.974 | 1.869 | 1.805 | 1.782 | 1.717 | 1.638 | 1.580 | 1.529 |
| Intercept | −0.047 | −0.035 | −0.034 | −0.034 | −0.028 | −0.021 | −0.019 | −0.012 | |
| R2 | 0.96341 | 0.96677 | 0.92200 | 0.92152 | 0.97847 | 0.97433 | 0.97992 | 0.91063 | |
| Parameters (MPa) | 0 F-T | 3 F-T | 6 F-T | 9 F-T | 12 F-T | 15 F-T | 18 F-T | 21 F-T |
|---|---|---|---|---|---|---|---|---|
| E0 | 133.86873 | 92.75010 | 116.00928 | 29.28880 | 103.41262 | 96.15385 | 90.17133 | 83.05648 |
| E1 | 199.38382 | 131.56133 | 97.53875 | 40.11758 | 28.54813 | 17.13689 | 11.88436 | 8.73654 |
| E2 | 141.61972 | 55.19087 | 61.25115 | 39.43923 | 13.13355 | 17.13688 | 11.88432 | 8.73651 |
| E3 | 118.16312 | 42.77681 | 58.00132 | 22.37324 | 13.13355 | 17.13687 | 11.88415 | 8.73641 |
| E4 | 8.93583 | 31.45977 | 27.54469 | 22.36709 | 0.00000 | 7.69466 | 6.88822 | 5.32675 |
| E5 | 8.93583 | 26.39177 | 27.54418 | 19.43322 | 0.00000 | 7.69466 | 6.85077 | 4.98021 |
| E6 | 0.00000 | 26.15596 | 9.19659 | 19.28879 | 0.00000 | 7.69466 | 6.84974 | 4.96011 |
| R2 | 0.99999 | 0.99999 | 0.99999 | 0.99999 | 0.99999 | 0.99999 | 0.99999 | 0.99999 |
| Parameters (MPa) | 0 F-T | 3 F-T | 6 F-T | 9 F-T | 12 F-T | 15 F-T | 18 F-T | 21 F-T |
|---|---|---|---|---|---|---|---|---|
| E0 | 104.16667 | 96.24639 | 89.84726 | 82.98755 | 75.58579 | 69.68641 | 63.69427 | 59.95204 |
| E1 | 42.53909 | 23.51554 | 95.99745 | 28.04605 | 20.88298 | 36.49830 | 7.24526 | 6.31619 |
| E2 | 36.84454 | 23.51554 | 20.97286 | 12.86018 | 21.17662 | 8.38396 | 7.24526 | 6.31607 |
| E3 | 36.84364 | 19.30993 | 20.97286 | 12.85980 | 20.88297 | 8.38396 | 6.28025 | 6.31568 |
| E4 | 36.84300 | 19.30993 | 0.00000 | 0.01539 | 0.31390 | 0.26993 | 6.28025 | 3.79062 |
| E5 | 28.58562 | 19.30992 | 0.00000 | 0.01529 | 0.31390 | 0.26991 | 6.28025 | 3.73603 |
| E6 | 11.79649 | 10.77335 | 0.00000 | 0.01464 | 0.31387 | 0.26989 | 6.28025 | 3.50143 |
| R2 | 0.99999 | 0.99999 | 0.99999 | 0.99999 | 0.99999 | 0.99999 | 0.99999 | 0.99999 |
| Parameters (MPa) | 0 F-T | 3 F-T | 6 F-T | 9 F-T | 12 F-T | 15 F-T | 18 F-T | 21 F-T |
|---|---|---|---|---|---|---|---|---|
| E0 | 83.40284 | 73.96450 | 68.58711 | 64.26735 | 59.70132 | 55.27916 | 50.65849 | 47.77831 |
| E1 | 29.69837 | 13.24480 | 8.12975 | 5.90227 | 13.65544 | 6.23630 | 14.13191 | 6.28234 |
| E2 | 29.69837 | 13.24468 | 8.12973 | 5.90226 | 10.12223 | 6.23629 | 9.75212 | 6.28217 |
| E3 | 29.69837 | 13.24399 | 8.12971 | 5.90226 | 10.11532 | 6.23626 | 9.69079 | 6.28211 |
| E4 | 12.97285 | 8.71569 | 7.99429 | 5.45144 | 9.97034 | 5.72323 | 9.19135 | 3.74926 |
| E5 | 12.97285 | 8.69977 | 7.99426 | 5.45143 | 3.15877 | 5.72323 | 0.03322 | 3.70655 |
| E6 | 12.97285 | 8.55138 | 7.99422 | 5.45141 | 0.00017 | 5.72322 | 0.00007 | 3.43863 |
| R2 | 0.99999 | 0.99999 | 0.99999 | 0.99999 | 0.99999 | 0.99999 | 0.99999 | 0.99999 |
| Parameters (MPa) | 0 F-T | 3 F-T | 6 F-T | 9 F-T | 12 F-T | 15 F-T | 18 F-T | 21 F-T |
|---|---|---|---|---|---|---|---|---|
| E0 | 73.31378 | 63.25111 | 58.10575 | 53.10674 | 45.93477 | 42.30118 | 38.32886 | 35.53660 |
| E1 | 13.82468 | 5.82089 | 10.37424 | 7.89825 | 2.81777 | 6.61848 | 7.46571 | 4.63338 |
| E2 | 13.82468 | 5.82089 | 10.37421 | 7.89811 | 4.84421 | 6.61830 | 5.60238 | 4.63337 |
| E3 | 13.82468 | 5.82089 | 10.37414 | 5.13976 | 4.84404 | 6.61822 | 3.50943 | 4.63337 |
| E4 | 6.84339 | 5.36388 | 4.65701 | 4.02994 | 4.84400 | 4.89852 | 1.59079 | 0.97877 |
| E5 | 6.84339 | 5.36388 | 4.65692 | 4.02993 | 2.81674 | 1.38077 | 0.00000 | 0.97120 |
| E6 | 6.84339 | 5.36388 | 4.65691 | 4.02992 | 2.81646 | 0.53005 | 0.00000 | 0.96932 |
| R2 | 0.99999 | 0.99999 | 0.99999 | 0.99999 | 0.99999 | 0.99999 | 0.99999 | 0.99999 |
| Parameters (MPa) | 0 F-T | 3 F-T | 6 F-T | 9 F-T | 12 F-T | 15 F-T | 18 F-T | 21 F-T |
|---|---|---|---|---|---|---|---|---|
| E0 | 65.83278 | 58.30904 | 52.57624 | 48.00768 | 41.00041 | 37.31343 | 33.25574 | 30.85467 |
| E1 | 6.94926 | 9.11697 | 5.98578 | 7.23562 | 6.58507 | 2.51942 | 2.37462 | 1.98297 |
| E2 | 6.94917 | 9.11692 | 5.98574 | 7.23551 | 6.58481 | 2.51924 | 2.37369 | 1.97919 |
| E3 | 6.94915 | 9.11688 | 5.98194 | 7.23509 | 6.58353 | 2.51889 | 2.37213 | 1.97798 |
| E4 | 4.52272 | 3.13252 | 2.40607 | 3.72059 | 2.29259 | 1.25890 | 1.04095 | 0.74760 |
| E5 | 4.08528 | 3.13236 | 2.30322 | 3.16580 | 2.27938 | 1.25015 | 1.03873 | 0.71313 |
| E6 | 3.52586 | 3.13234 | 2.28039 | 0.79910 | 2.24178 | 1.21082 | 0.98462 | 0.00000 |
| R2 | 0.99999 | 0.99999 | 0.99999 | 0.99999 | 0.99999 | 0.99999 | 0.99999 | 0.99999 |
| Parameters | 0 F-T | 3 F-T | 6 F-T | 9 F-T | 12 F-T | 15 F-T | 18 F-T | 21 F-T |
|---|---|---|---|---|---|---|---|---|
| G1 (MPa) | 161.20 | 70.76 | 70.04 | 51.90 | 42.92 | 36.50 | 31.31 | 26.70 |
| ρ1 (s) | 11.56 | 12.42 | 14.12 | 16.15 | 17.54 | 18.93 | 18.85 | 20.92 |
| G2 (MPa) | 244.32 | 200.15 | 167.34 | 138.47 | 119.62 | 115.50 | 106.38 | 95.23 |
| ρ2 (s) | 4.71 × 10³ | 5.74 × 10³ | 7.76 × 10³ | 1.32 × 10⁴ | 1.37 × 10⁴ | 1.52 × 10⁴ | 1.85 × 10⁴ | 1.90 × 10⁴ |
| R2 | 0.98261 | 0.97915 | 0.97308 | 0.96399 | 0.96933 | 0.95756 | 0.95604 | 0.95226 |
| Parameters | 0 F-T | 3 F-T | 6 F-T | 9 F-T | 12 F-T | 15 F-T | 18 F-T | 21 F-T |
|---|---|---|---|---|---|---|---|---|
| G1 (MPa) | 124.12 | 98.28 | 66.11 | 43.36 | 37.66 | 32.08 | 25.72 | 19.30 |
| ρ1 (s) | 12.40 | 14.13 | 14.50 | 16.03 | 17.52 | 18.93 | 19.84 | 21.72 |
| G2 (MPa) | 167.03 | 123.46 | 122.29 | 96.68 | 92.95 | 83.74 | 75.10 | 68.75 |
| ρ2 (s) | 5.35 × 10³ | 7.66 × 10³ | 1.08 × 10⁴ | 1.21 × 10⁴ | 1.37 × 10⁴ | 1.53 × 10⁴ | 1.73 × 10⁴ | 1.85 × 10⁴ |
| R2 | 0.96986 | 0.96864 | 0.96656 | 0.96295 | 0.95655 | 0.9574 | 0.95614 | 0.95225 |
| Parameters | 0 F-T | 3 F-T | 6 F-T | 9 F-T | 12 F-T | 15 F-T | 18 F-T | 21 F-T |
|---|---|---|---|---|---|---|---|---|
| G1 (MPa) | 91.20 | 40.06 | 30.55 | 29.07 | 26.08 | 21.38 | 19.44 | 19.31 |
| ρ1 (s) | 13.37 | 14.09 | 14.48 | 16.04 | 18.95 | 19.75 | 20.64 | 21.59 |
| G2 (MPa) | 114.59 | 97.36 | 84.24 | 74.35 | 74.18 | 64.41 | 62.27 | 56.36 |
| ρ2 (s) | 7.67 × 10³ | 9.81 × 10³ | 1.19 × 10⁴ | 1.21 × 10⁴ | 1.32 × 10⁴ | 1.53 × 10⁴ | 1.73 × 10⁴ | 1.90 × 10⁴ |
| R2 | 0.96659 | 0.96784 | 0.96388 | 0.96922 | 0.96081 | 0.96285 | 0.95663 | 0.95614 |
| Parameters | 0 F-T | 3 F-T | 6 F-T | 9 F-T | 12 F-T | 15 F-T | 18 F-T | 21 F-T |
|---|---|---|---|---|---|---|---|---|
| G1 (MPa) | 42.12 | 31.42 | 21.44 | 19.16 | 17.81 | 14.81 | 13.14 | 11.46 |
| ρ1 (s) | 14.04 | 14.56 | 15.44 | 17.39 | 19.47 | 20.49 | 20.91 | 22.80 |
| G2 (MPa) | 90.15 | 73.17 | 69.82 | 62.63 | 52.68 | 45.85 | 40.78 | 37.78 |
| ρ2 (s) | 1.21 × 10⁴ | 1.37 × 10⁴ | 1.53 × 10⁴ | 1.85 × 10⁴ | 1.90 × 10⁴ | 2.99 × 10⁴ | 3.91 × 10⁴ | 3.99 × 10⁴ |
| R2 | 0.95659 | 0.96923 | 0.95742 | 0.95606 | 0.9523 | 0.8993 | 0.89888 | 0.90389 |
| Parameters | 0 F-T | 3 F-T | 6 F-T | 9 F-T | 12 F-T | 15 F-T | 18 F-T | 21 F-T |
|---|---|---|---|---|---|---|---|---|
| G1 (MPa) | 24.53 | 21.24 | 19.79 | 18.35 | 15.74 | 6.60 | 6.34 | 5.74 |
| ρ1 (s) | 14.86 | 14.58 | 16.57 | 18.74 | 19.41 | 21.41 | 22.59 | 23.52 |
| G2 (MPa) | 75.51 | 63.20 | 55.93 | 51.66 | 44.05 | 39.24 | 34.61 | 32.03 |
| ρ2 (s) | 1.84 × 10⁴ | 2.99 × 10⁴ | 3.29 × 10⁴ | 3.36 × 10⁴ | 3.91 × 10⁴ | 4.84 × 10⁴ | 6.09 × 10⁴ | 6.61 × 10⁴ |
| R2 | 0.95223 | 0.89921 | 0.89875 | 0.91024 | 0.91937 | 0.89402 | 0.9069 | 0.91699 |
© 2020 by the authors. Licensee MDPI, Basel, Switzerland. This article is an open access article distributed under the terms and conditions of the Creative Commons Attribution (CC BY) license (http://creativecommons.org/licenses/by/4.0/).
Share and Cite
Wang, W.; Tan, G.; Liang, C.; Wang, Y.; Cheng, Y. Study on Viscoelastic Properties of Asphalt Mixtures Incorporating SBS Polymer and Basalt Fiber under Freeze–Thaw Cycles. Polymers 2020, 12, 1804. https://0-doi-org.brum.beds.ac.uk/10.3390/polym12081804
Wang W, Tan G, Liang C, Wang Y, Cheng Y. Study on Viscoelastic Properties of Asphalt Mixtures Incorporating SBS Polymer and Basalt Fiber under Freeze–Thaw Cycles. Polymers. 2020; 12(8):1804. https://0-doi-org.brum.beds.ac.uk/10.3390/polym12081804
Chicago/Turabian StyleWang, Wensheng, Guojin Tan, Chunyu Liang, Yong Wang, and Yongchun Cheng. 2020. "Study on Viscoelastic Properties of Asphalt Mixtures Incorporating SBS Polymer and Basalt Fiber under Freeze–Thaw Cycles" Polymers 12, no. 8: 1804. https://0-doi-org.brum.beds.ac.uk/10.3390/polym12081804