
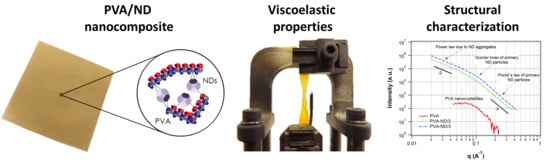
Study on Structure, Thermal Behavior, and Viscoelastic Properties of Nanodiamond-Reinforced Poly (vinyl alcohol) Nanocomposites

 , , , and
Abstract
:
1. Introduction
2. Materials and Methods
2.1. Materials
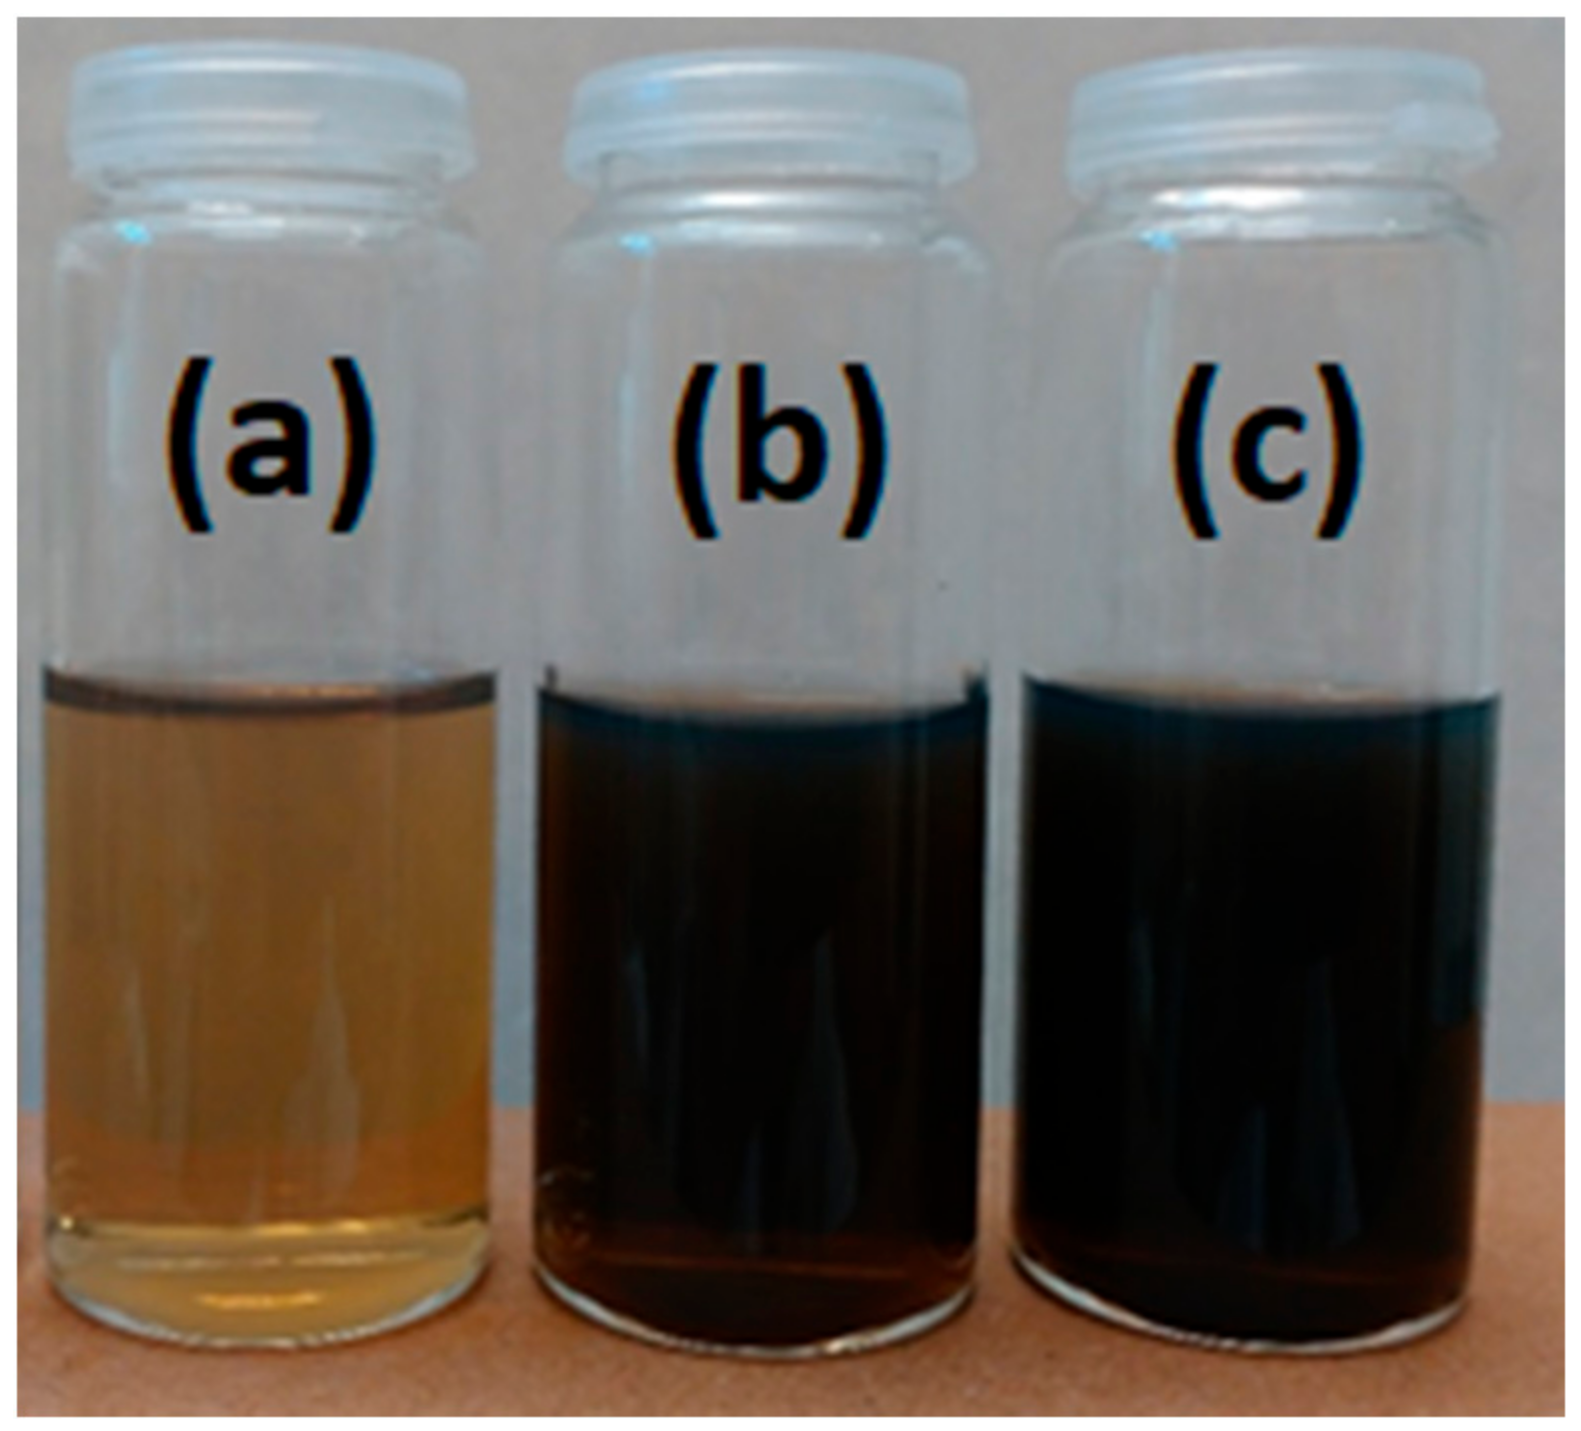
2.2. Nanocomposite Preparation
2.3. Characterization
3. Results and Discussions
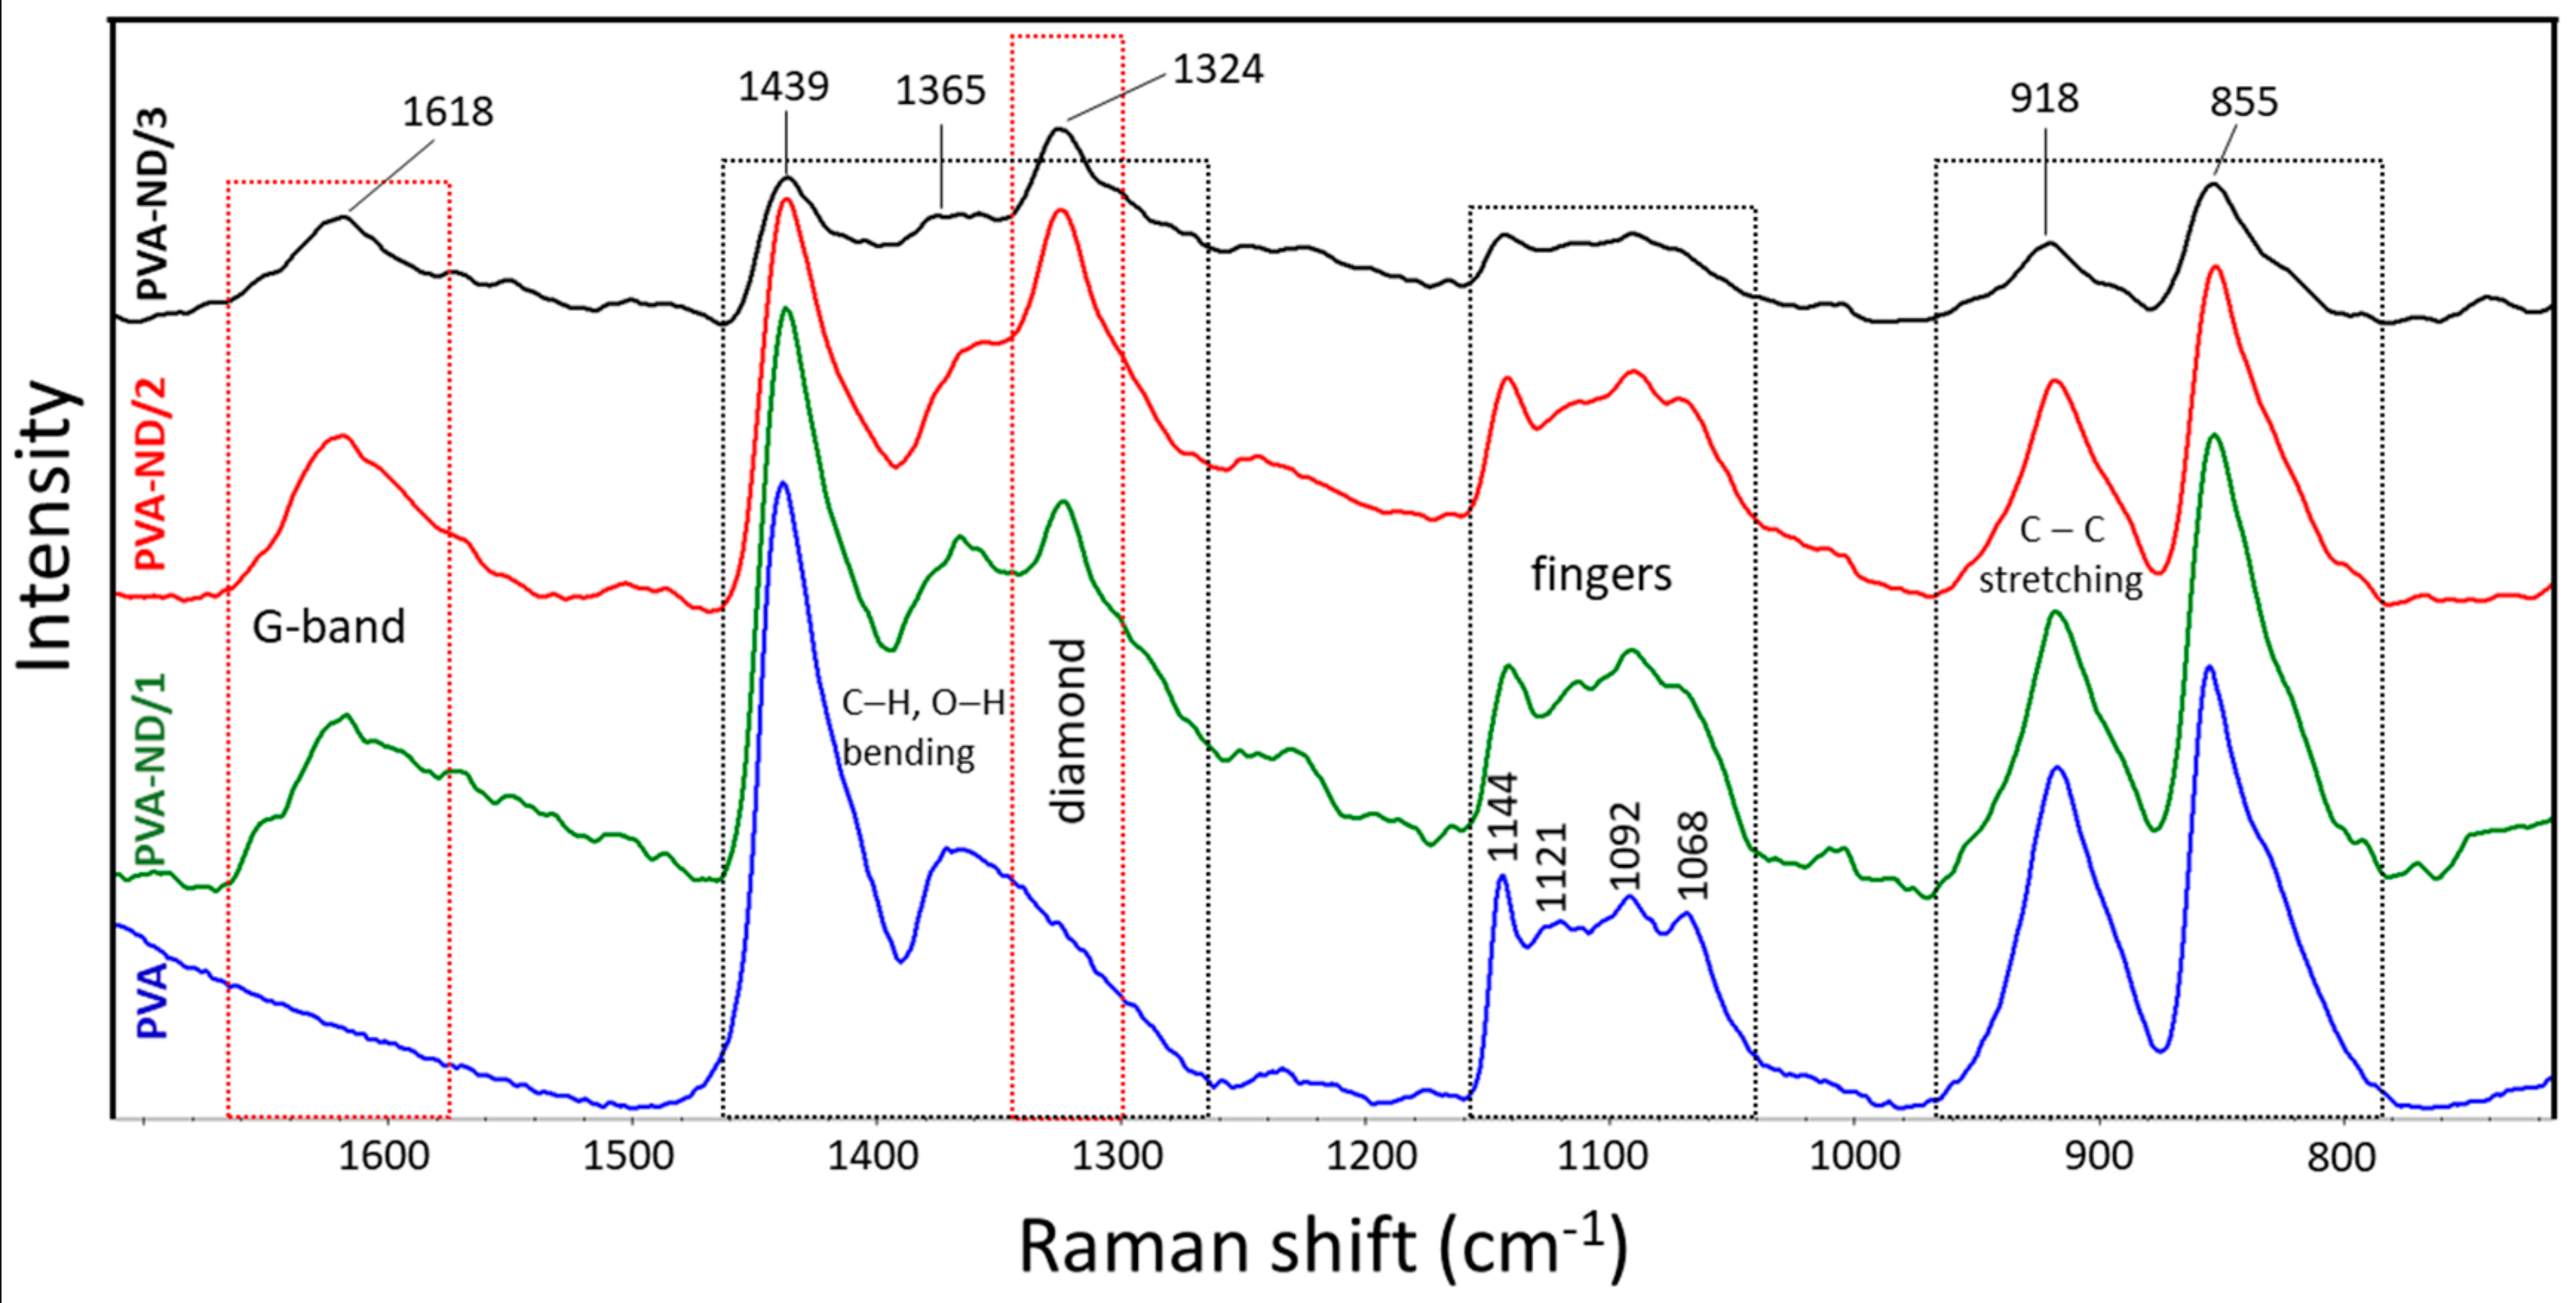
3.1. Raman Spectroscopy
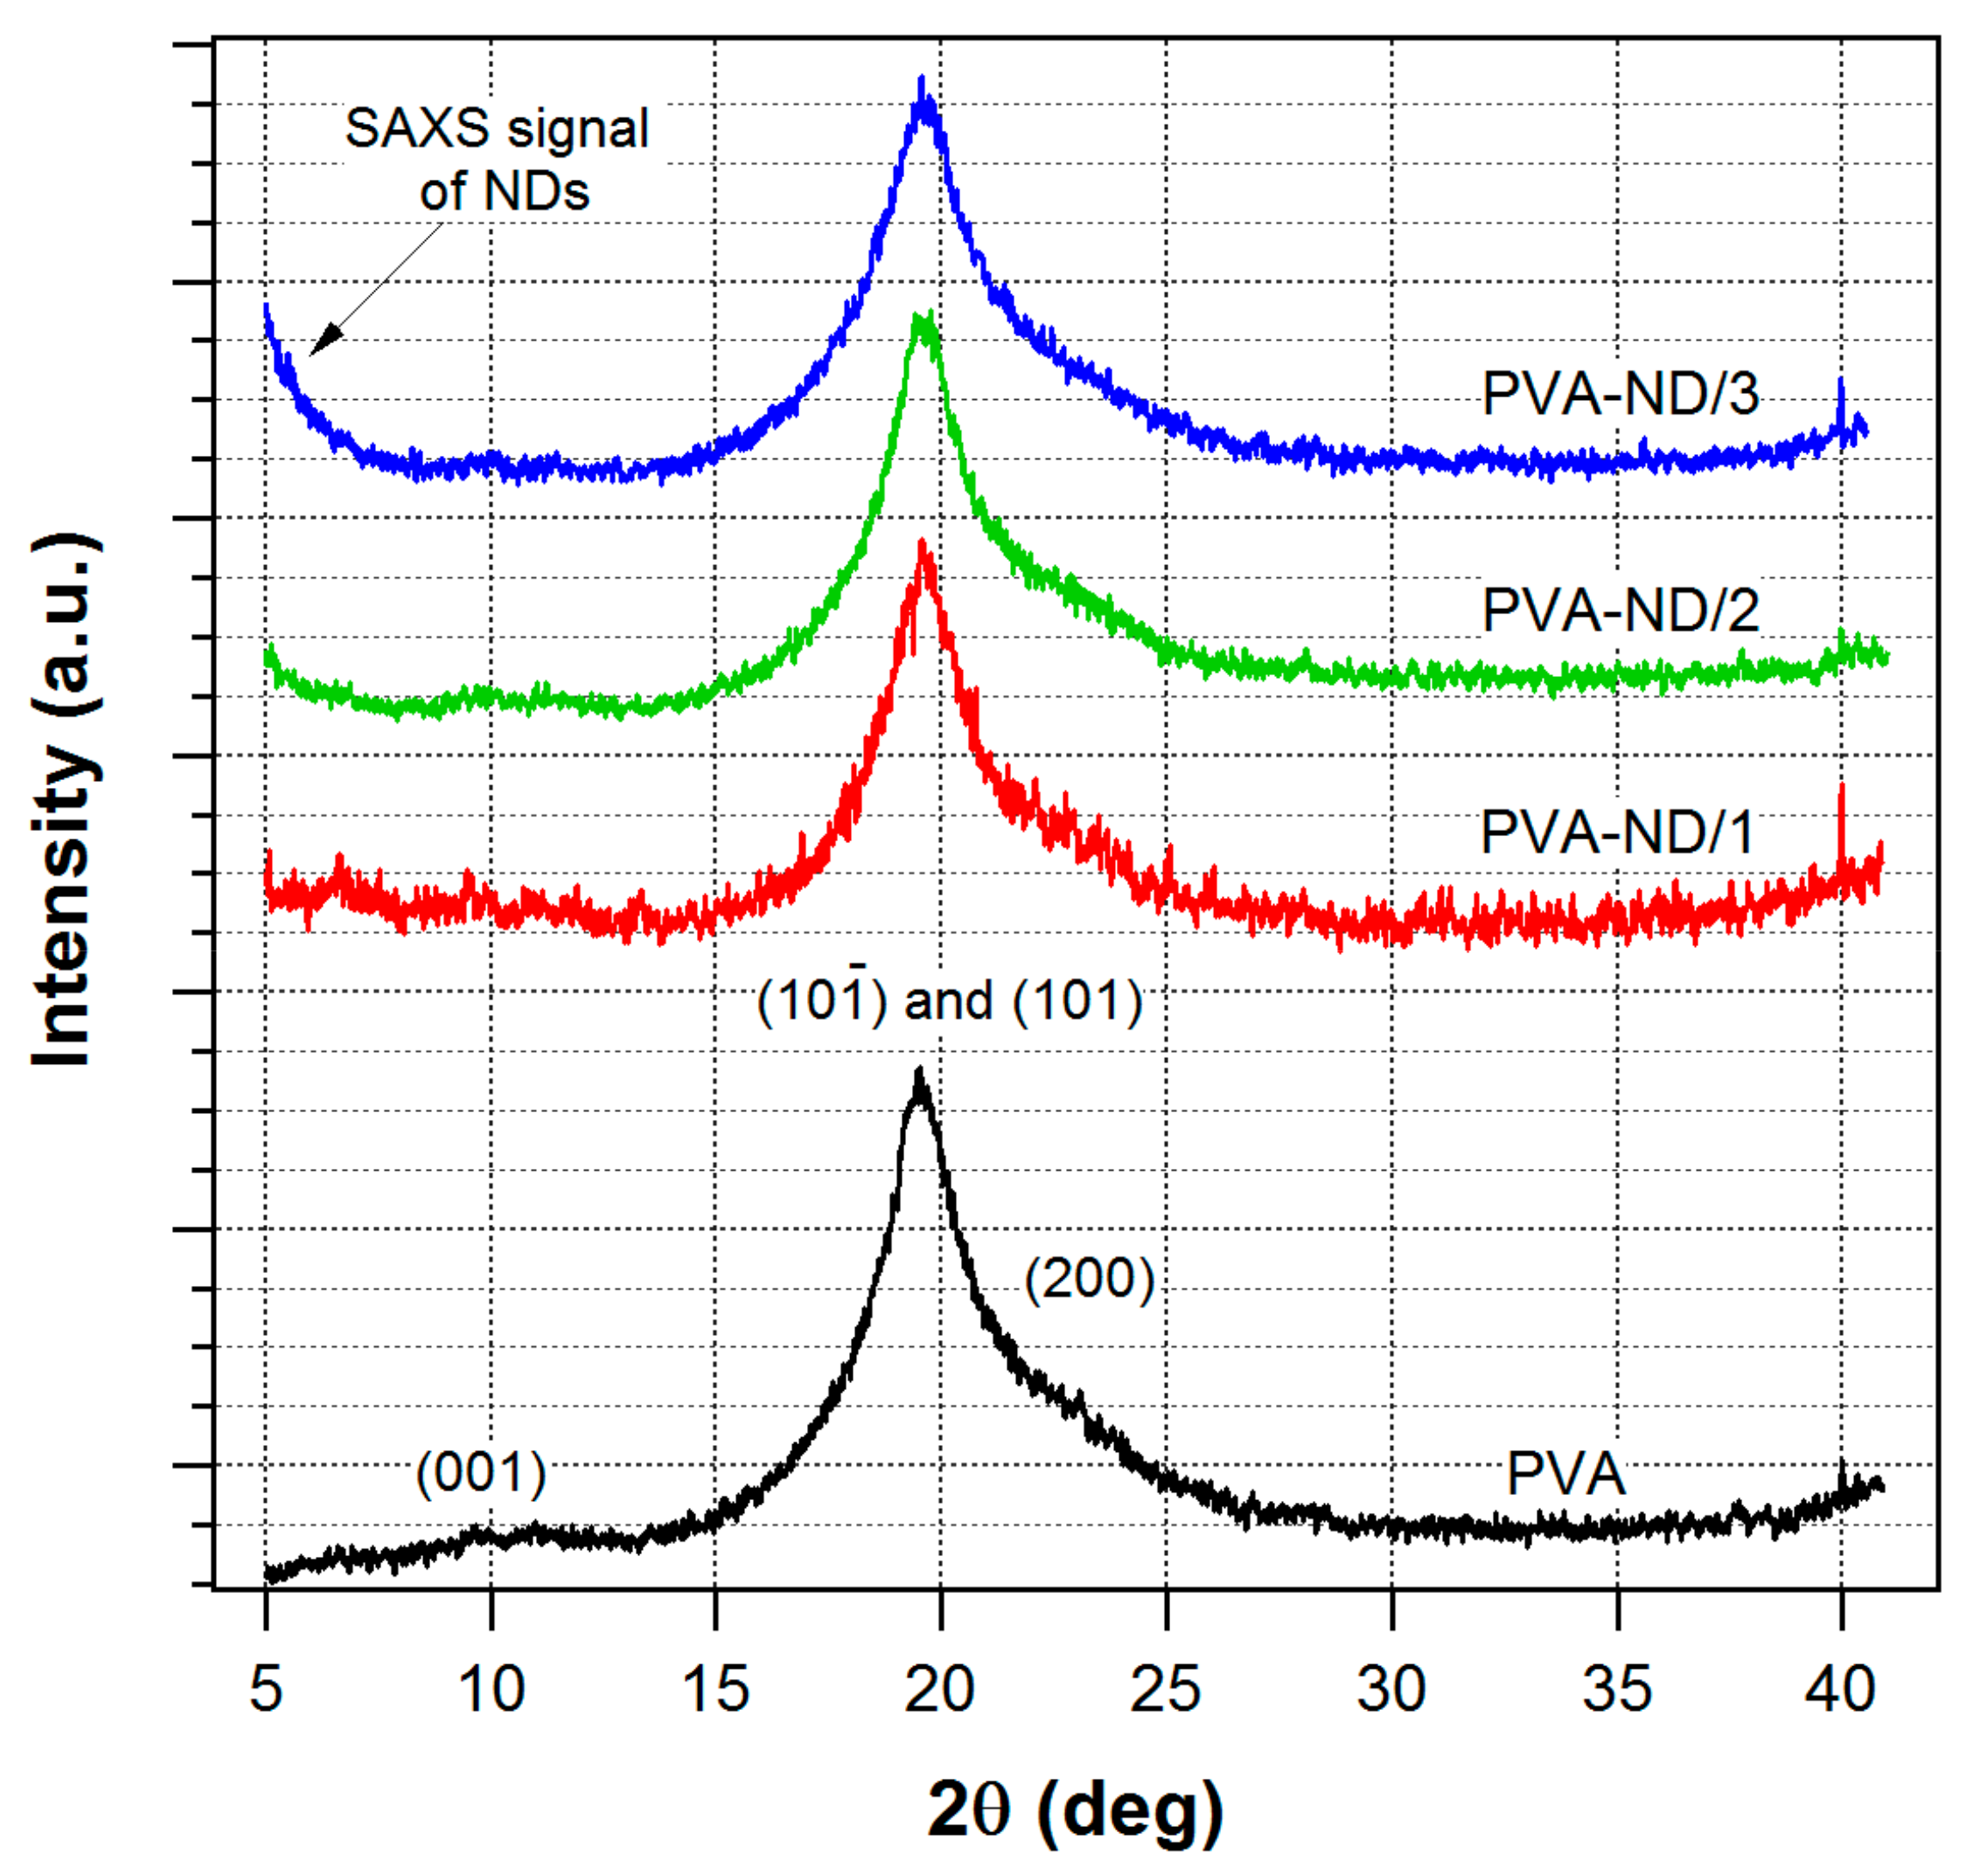
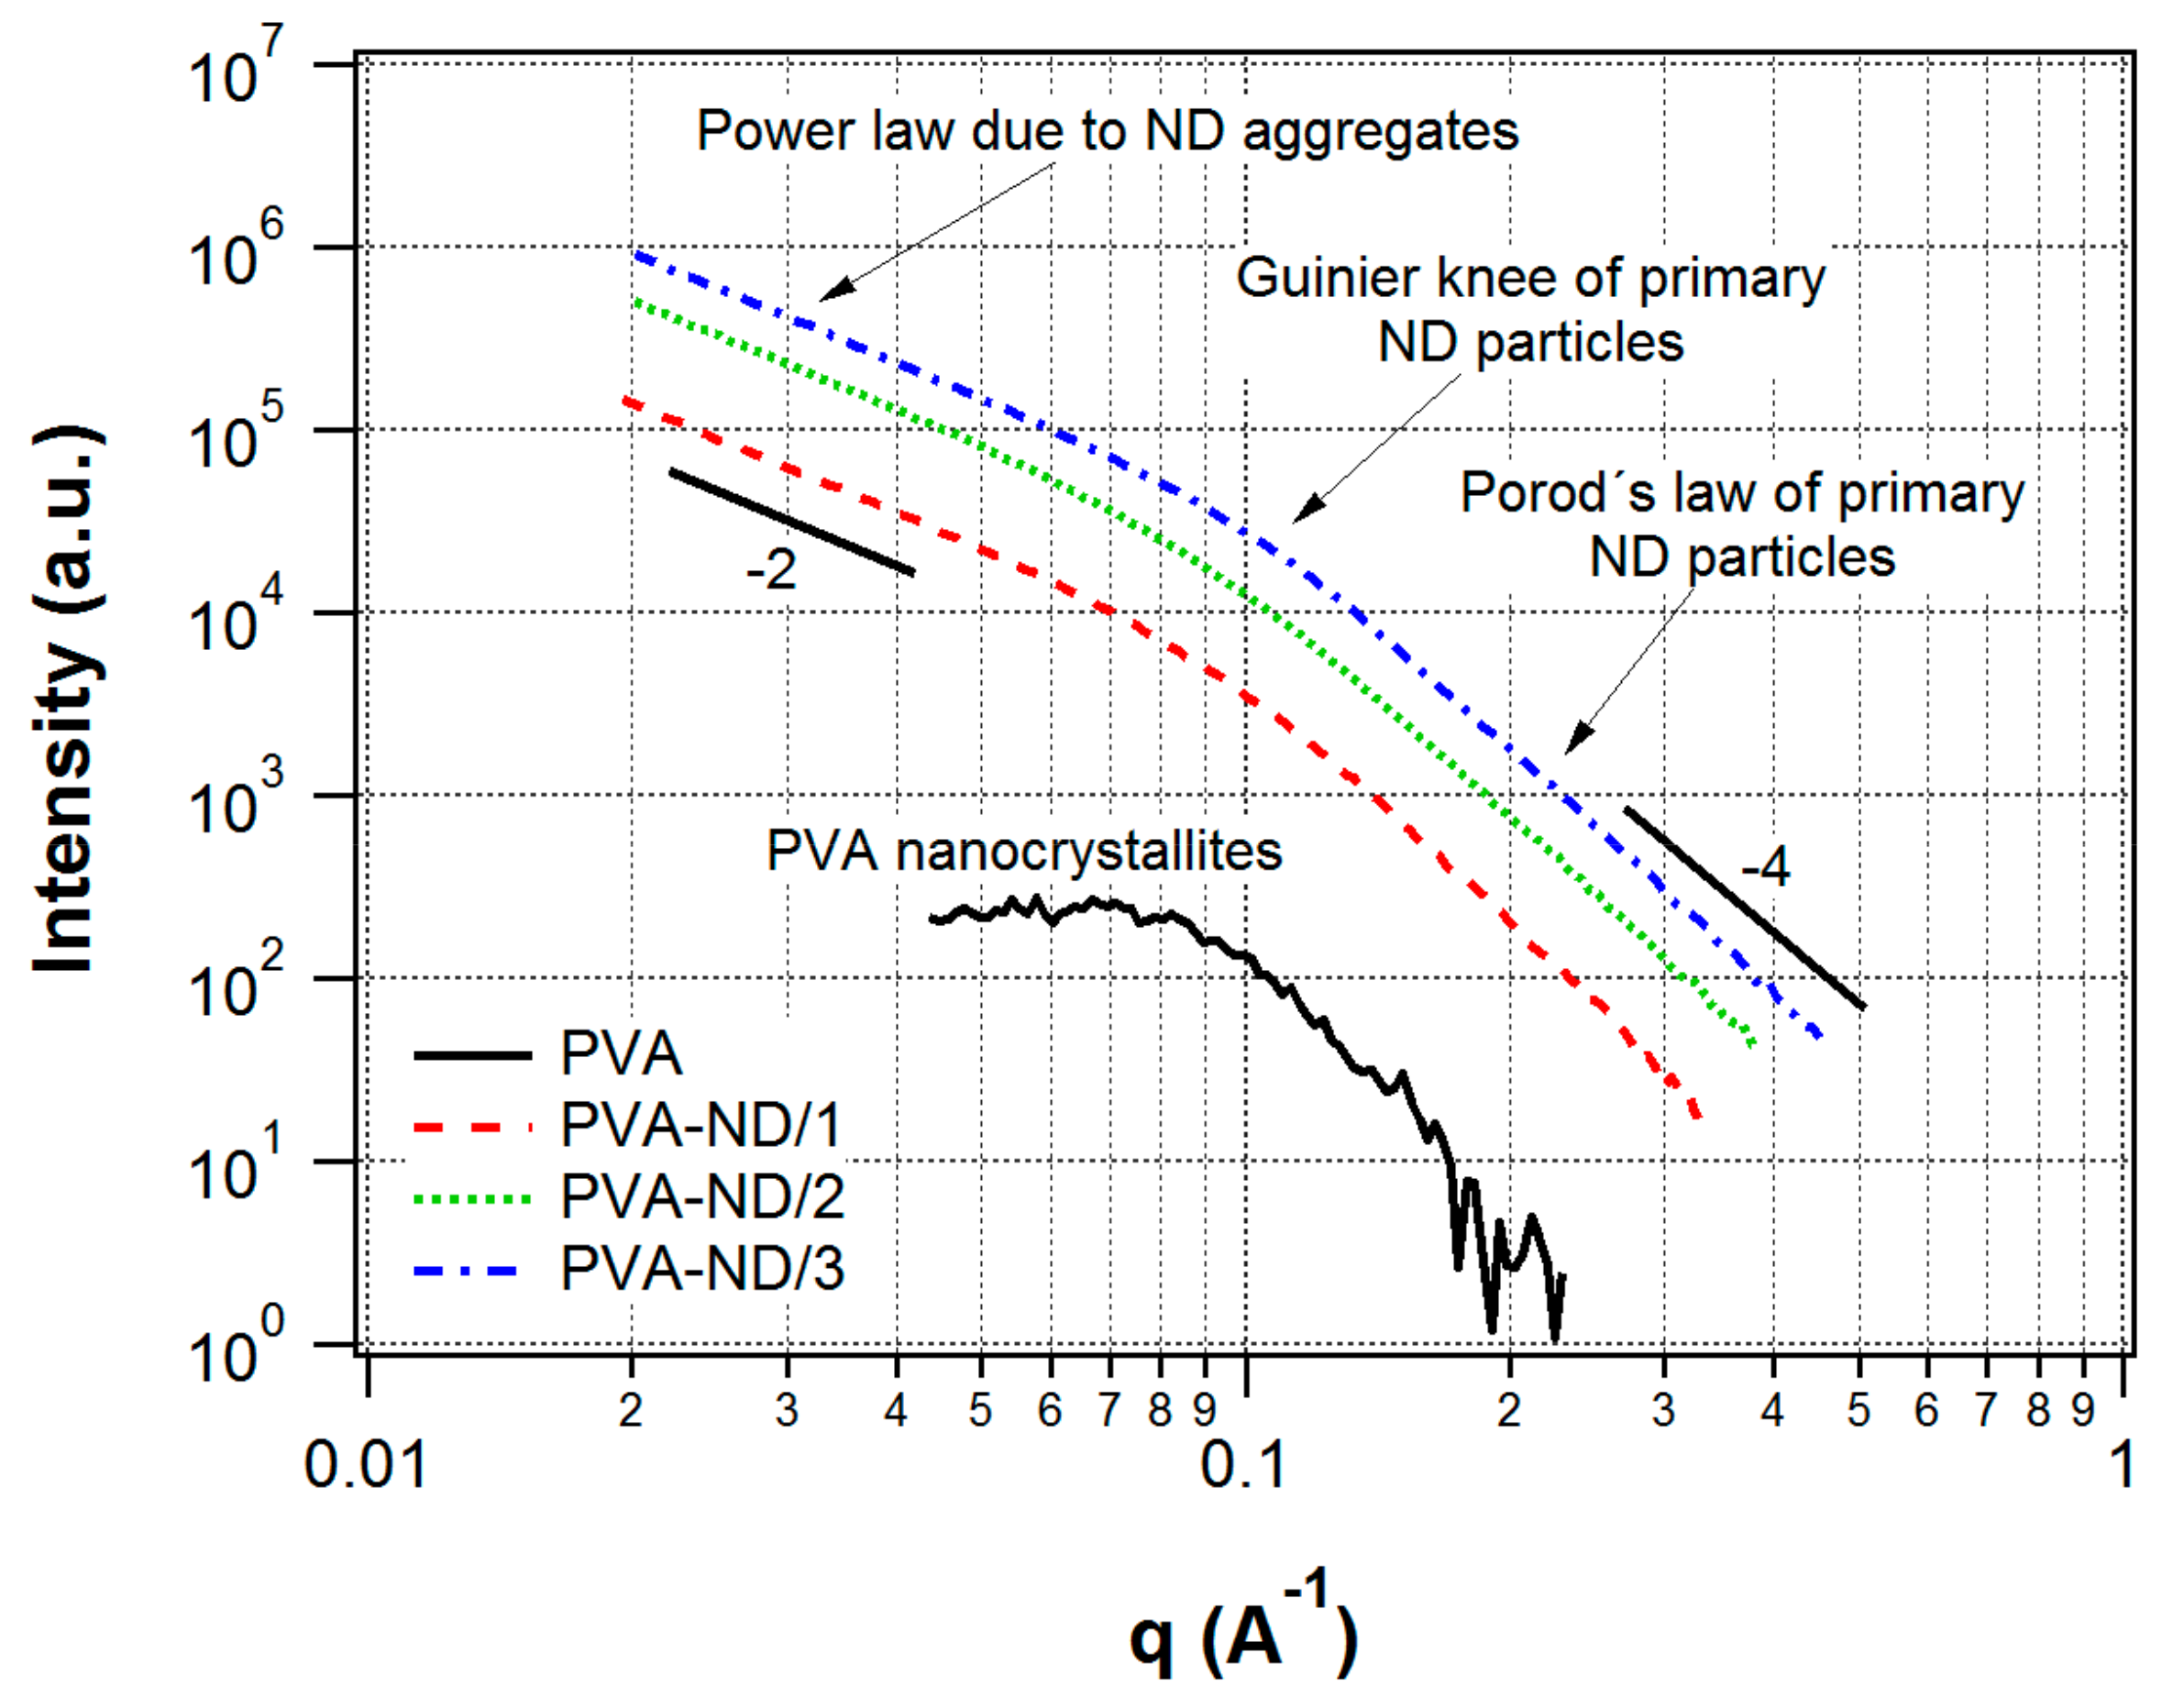
3.2. SAXS/WAXS
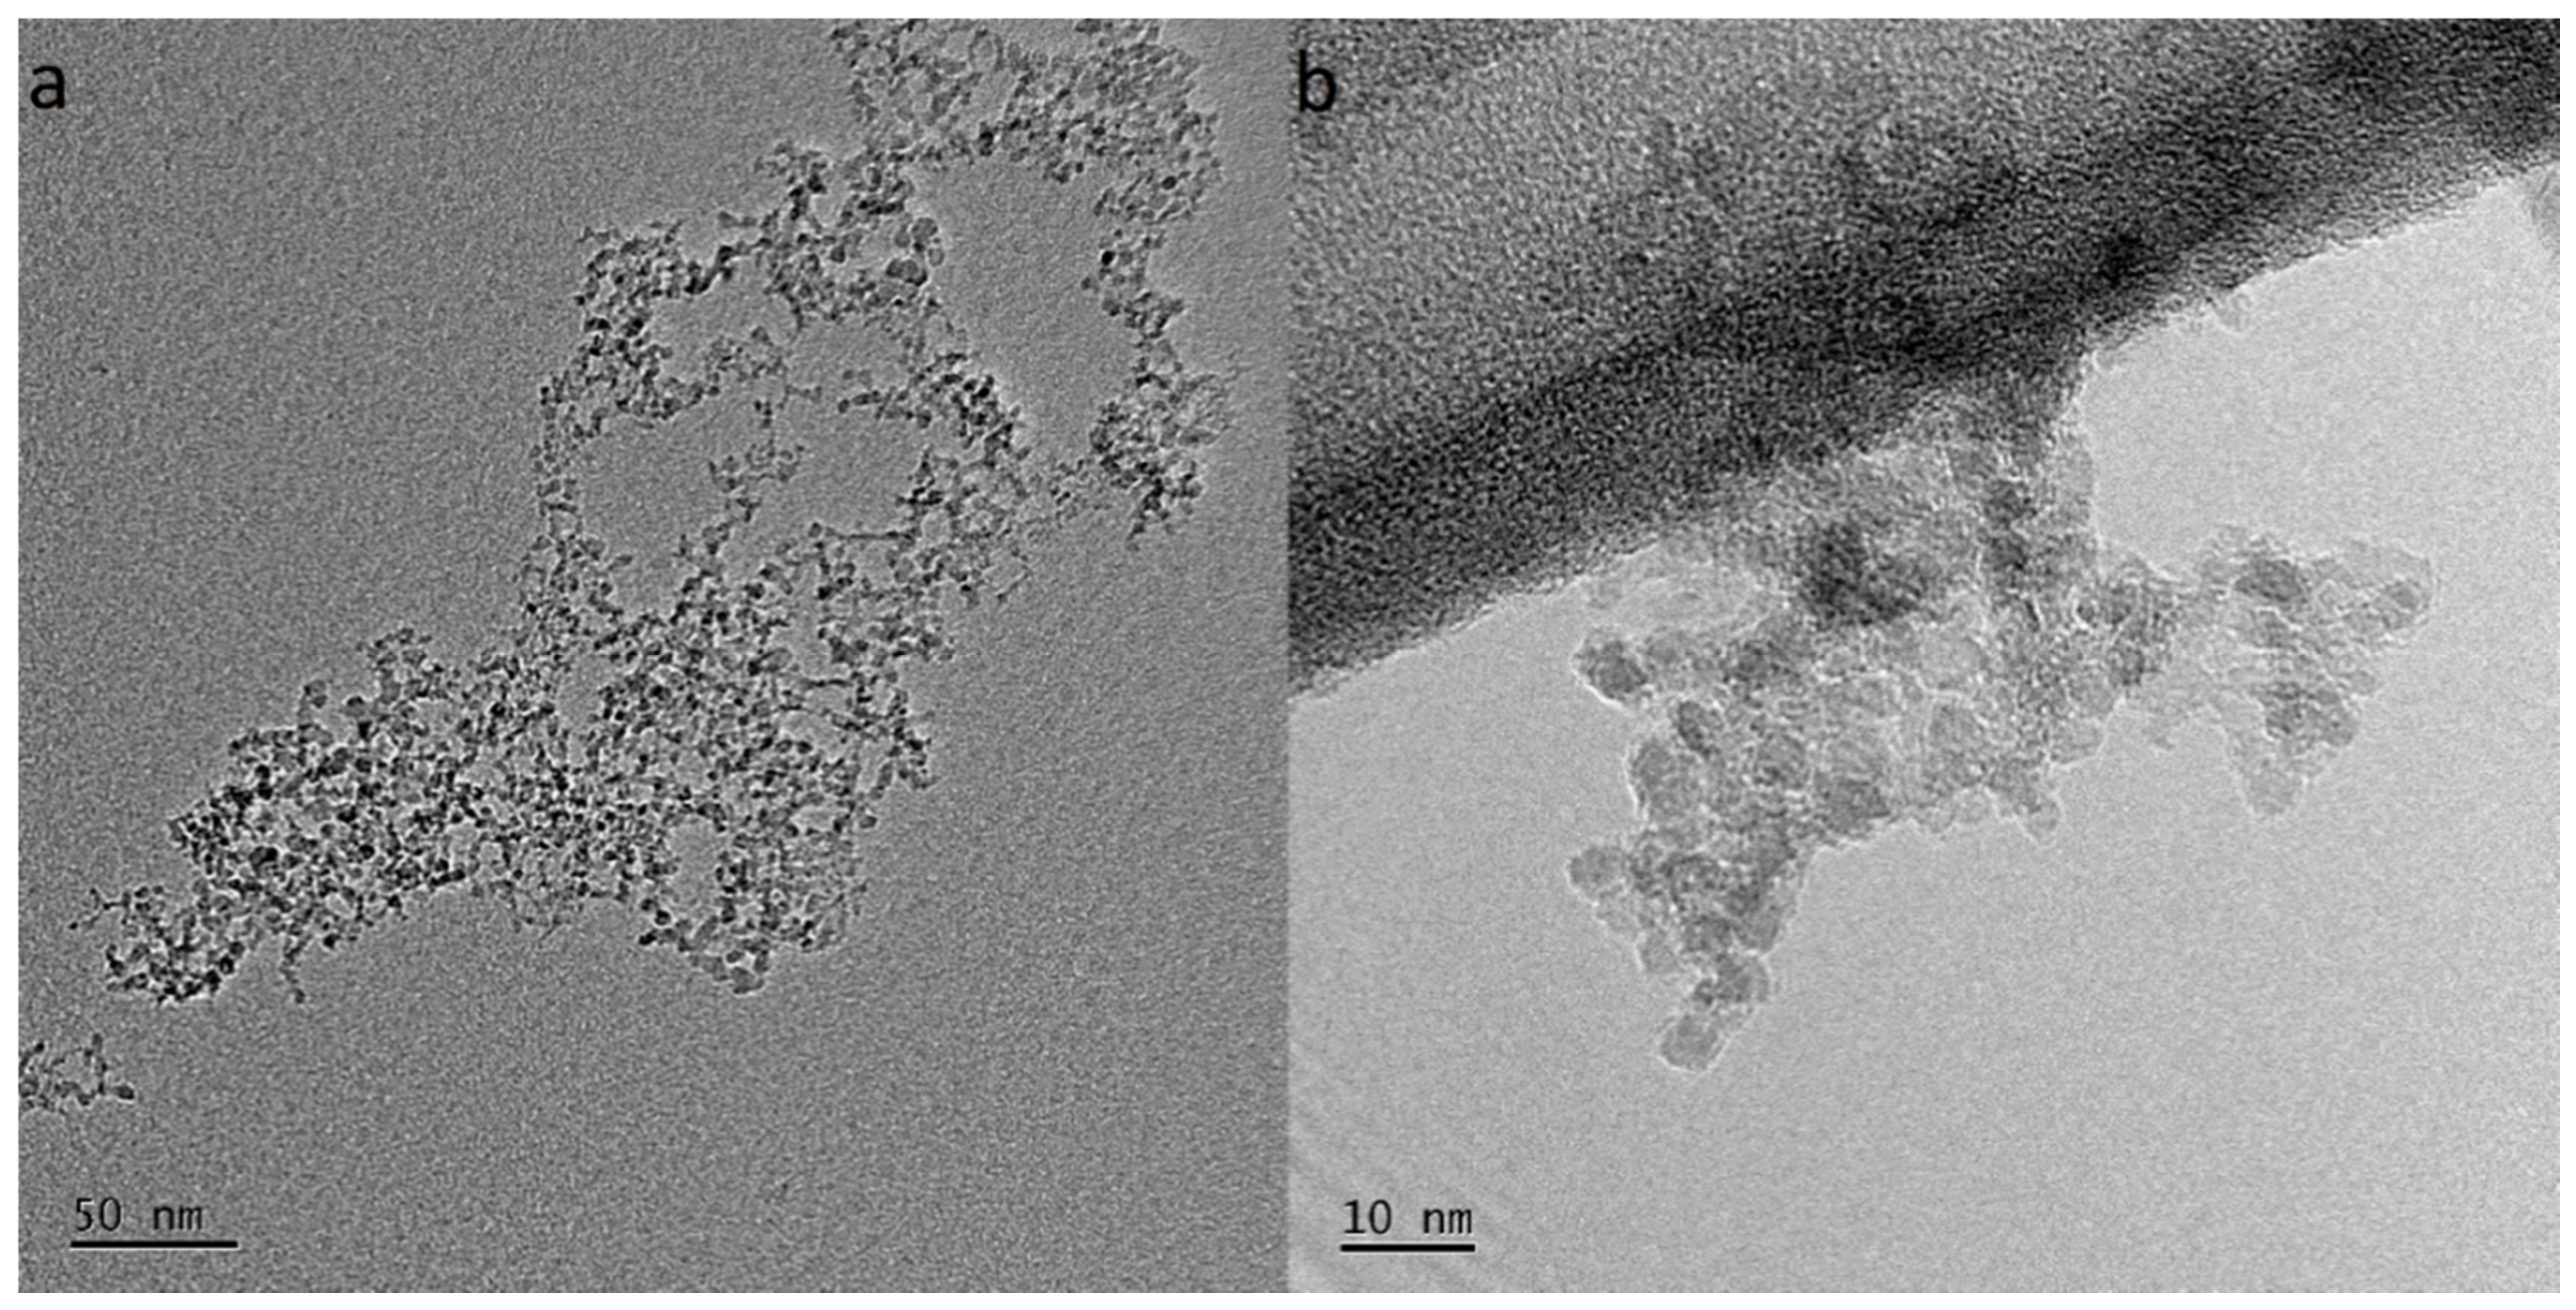
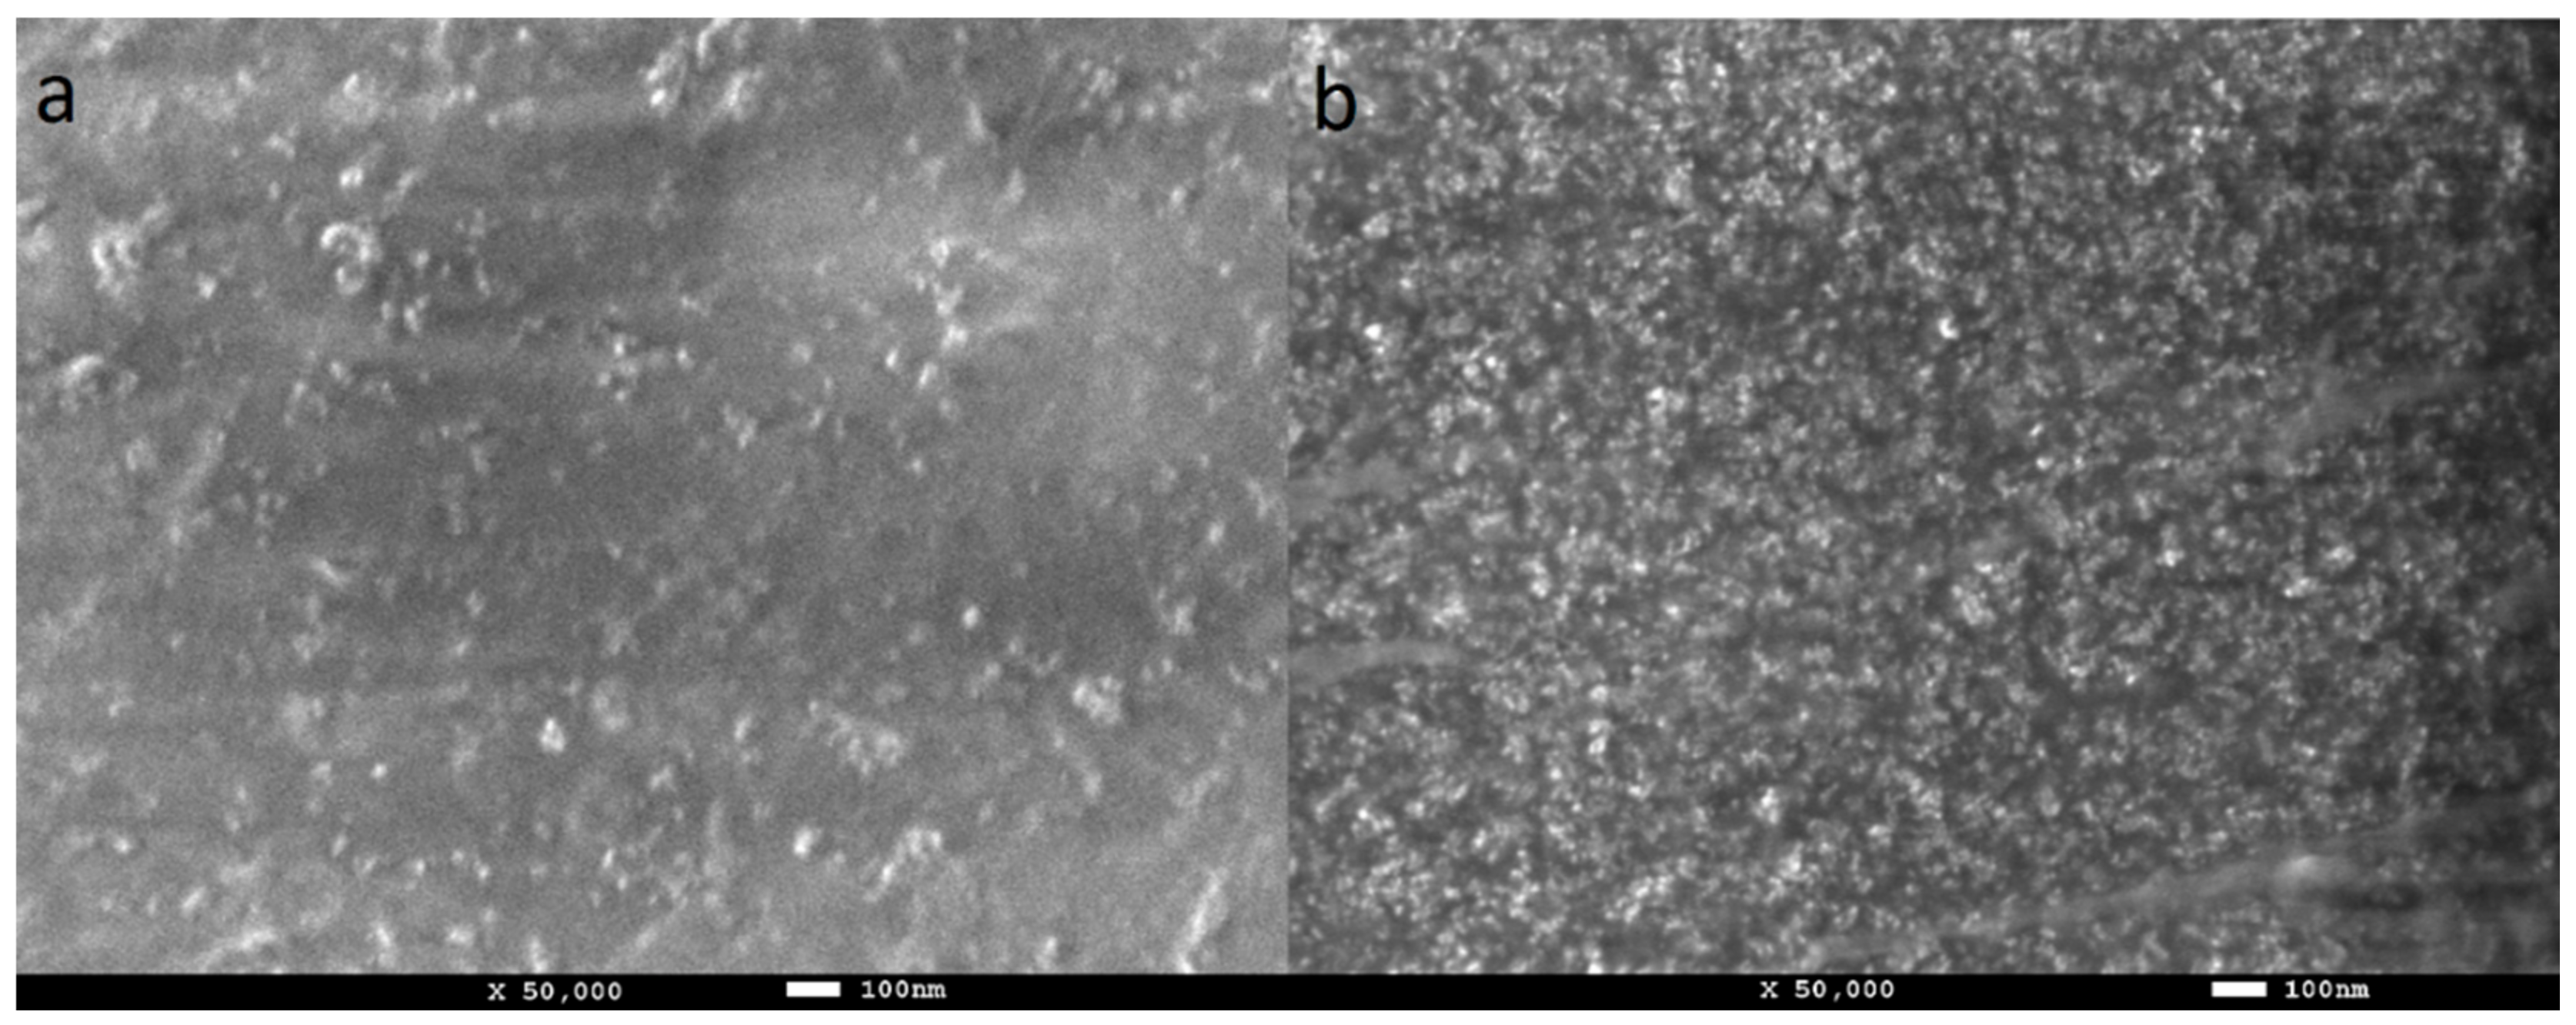
3.3. TEM and FE-SEM
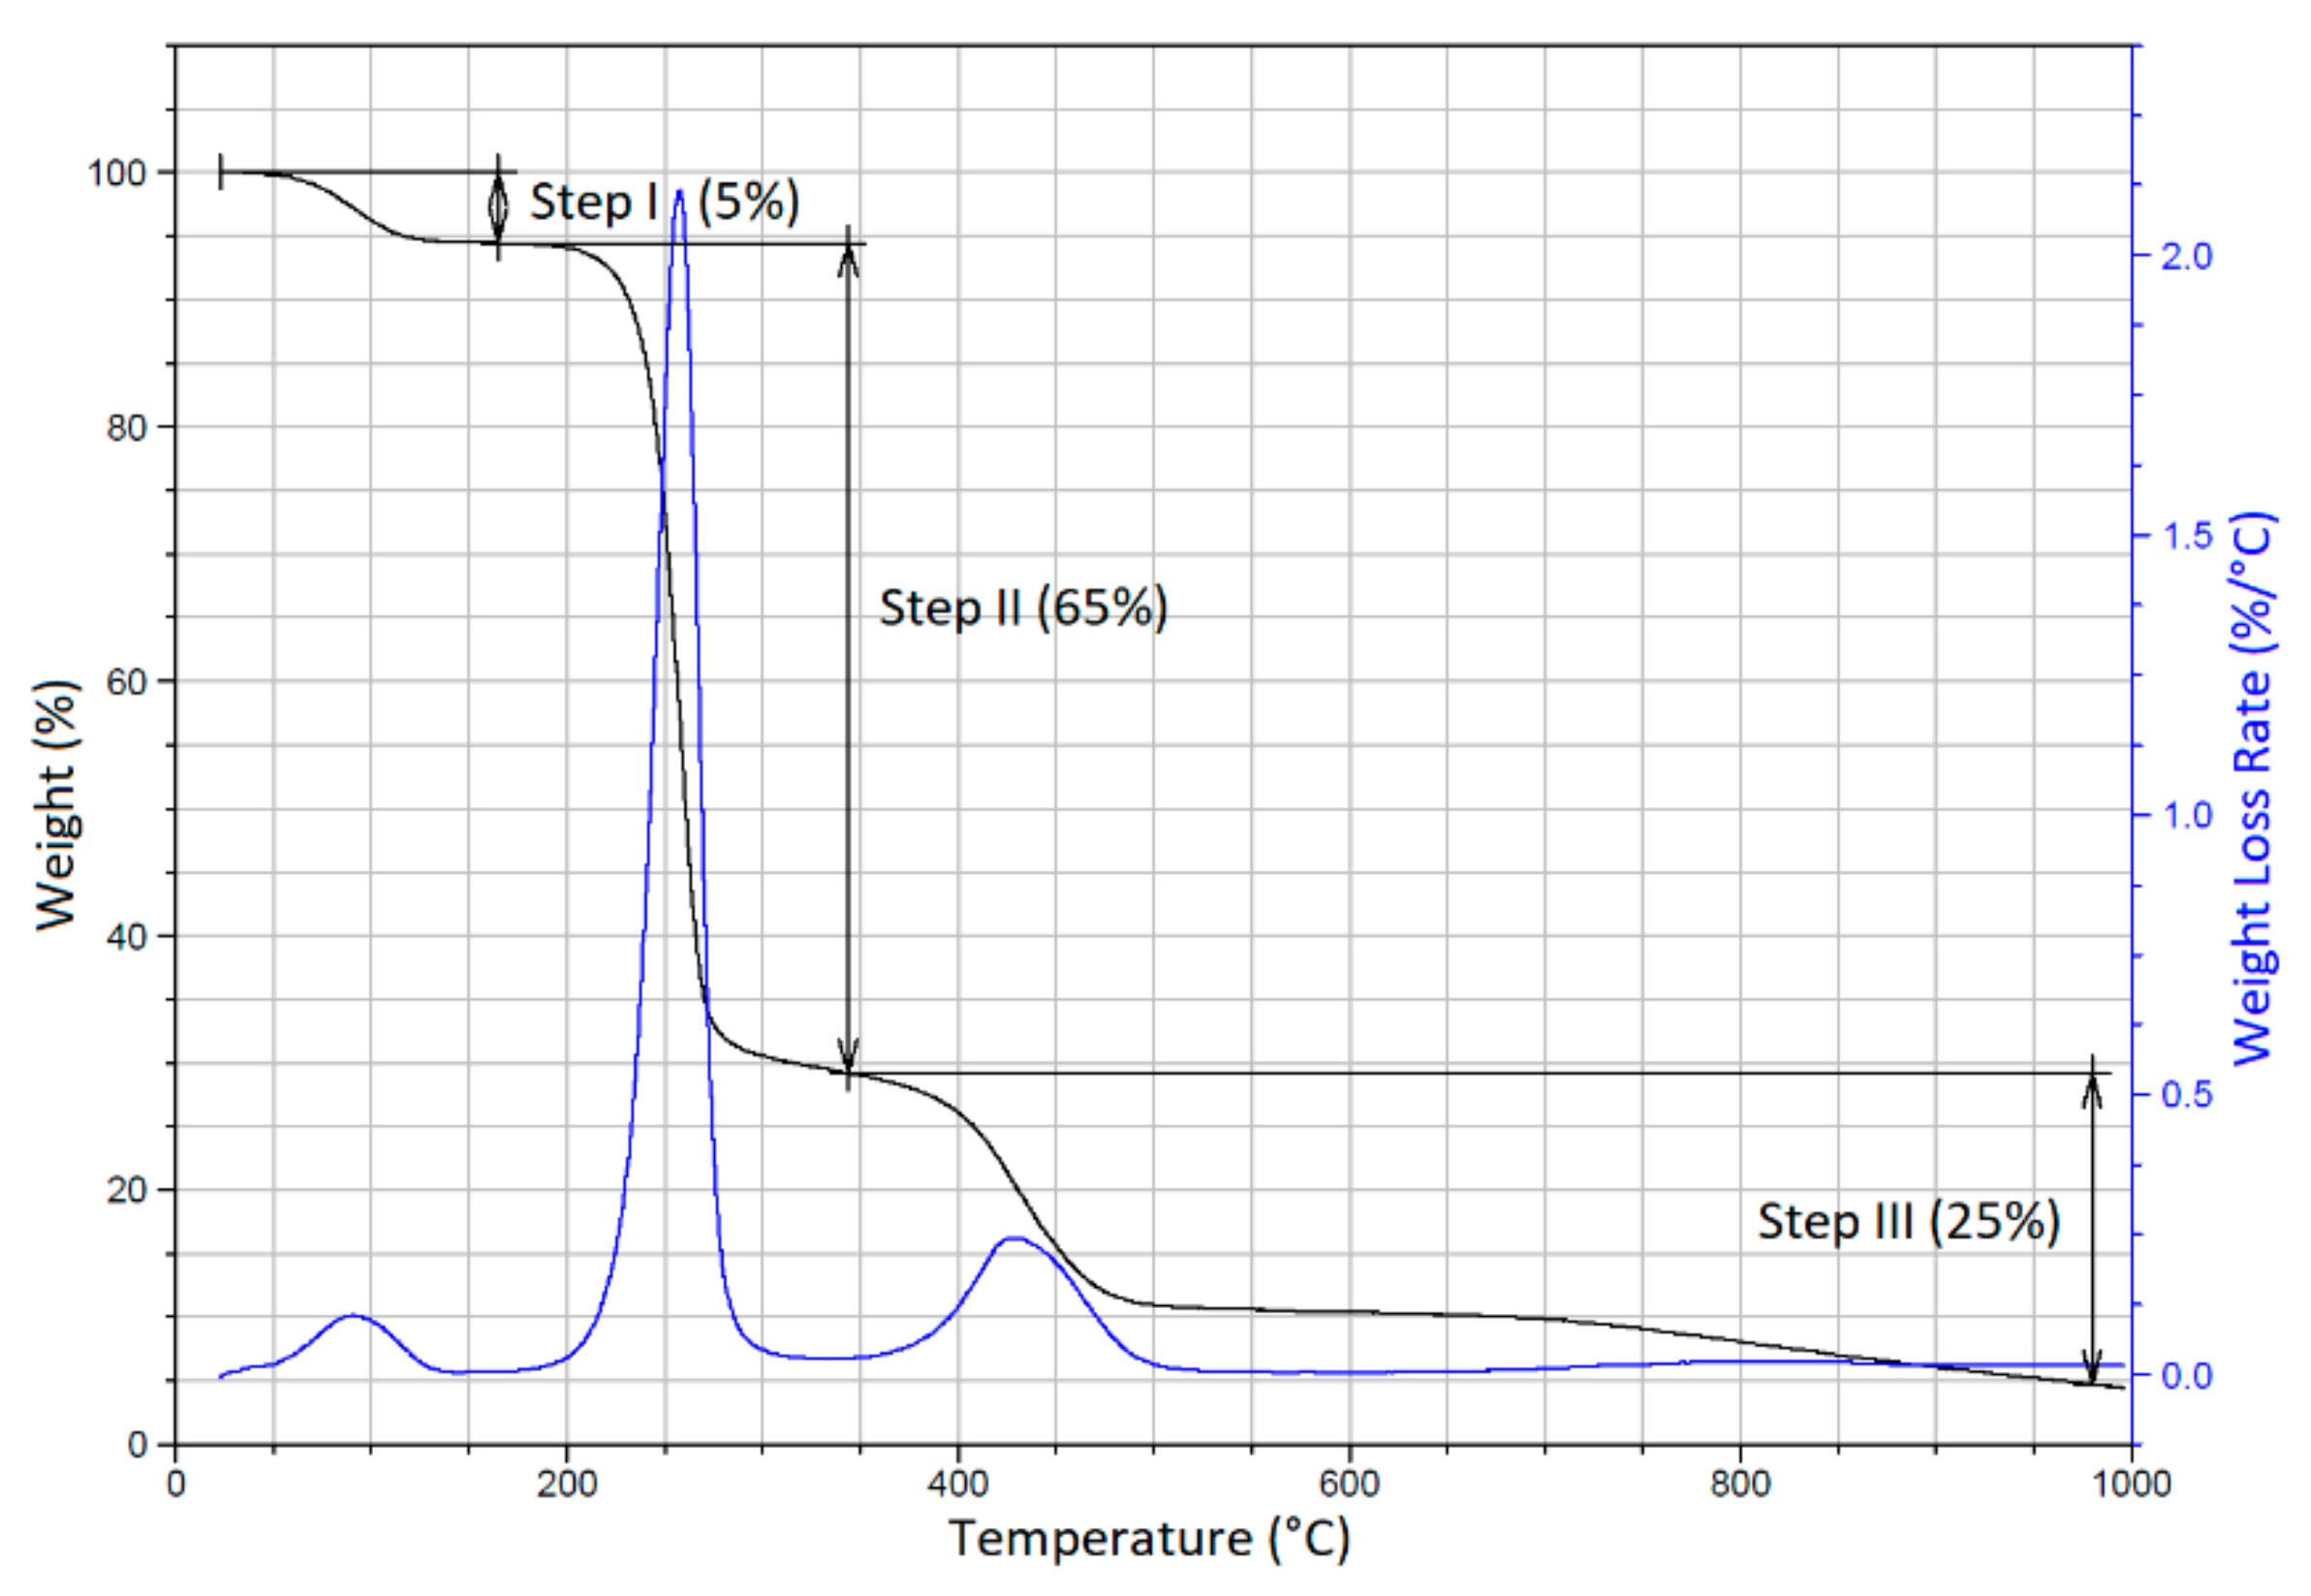
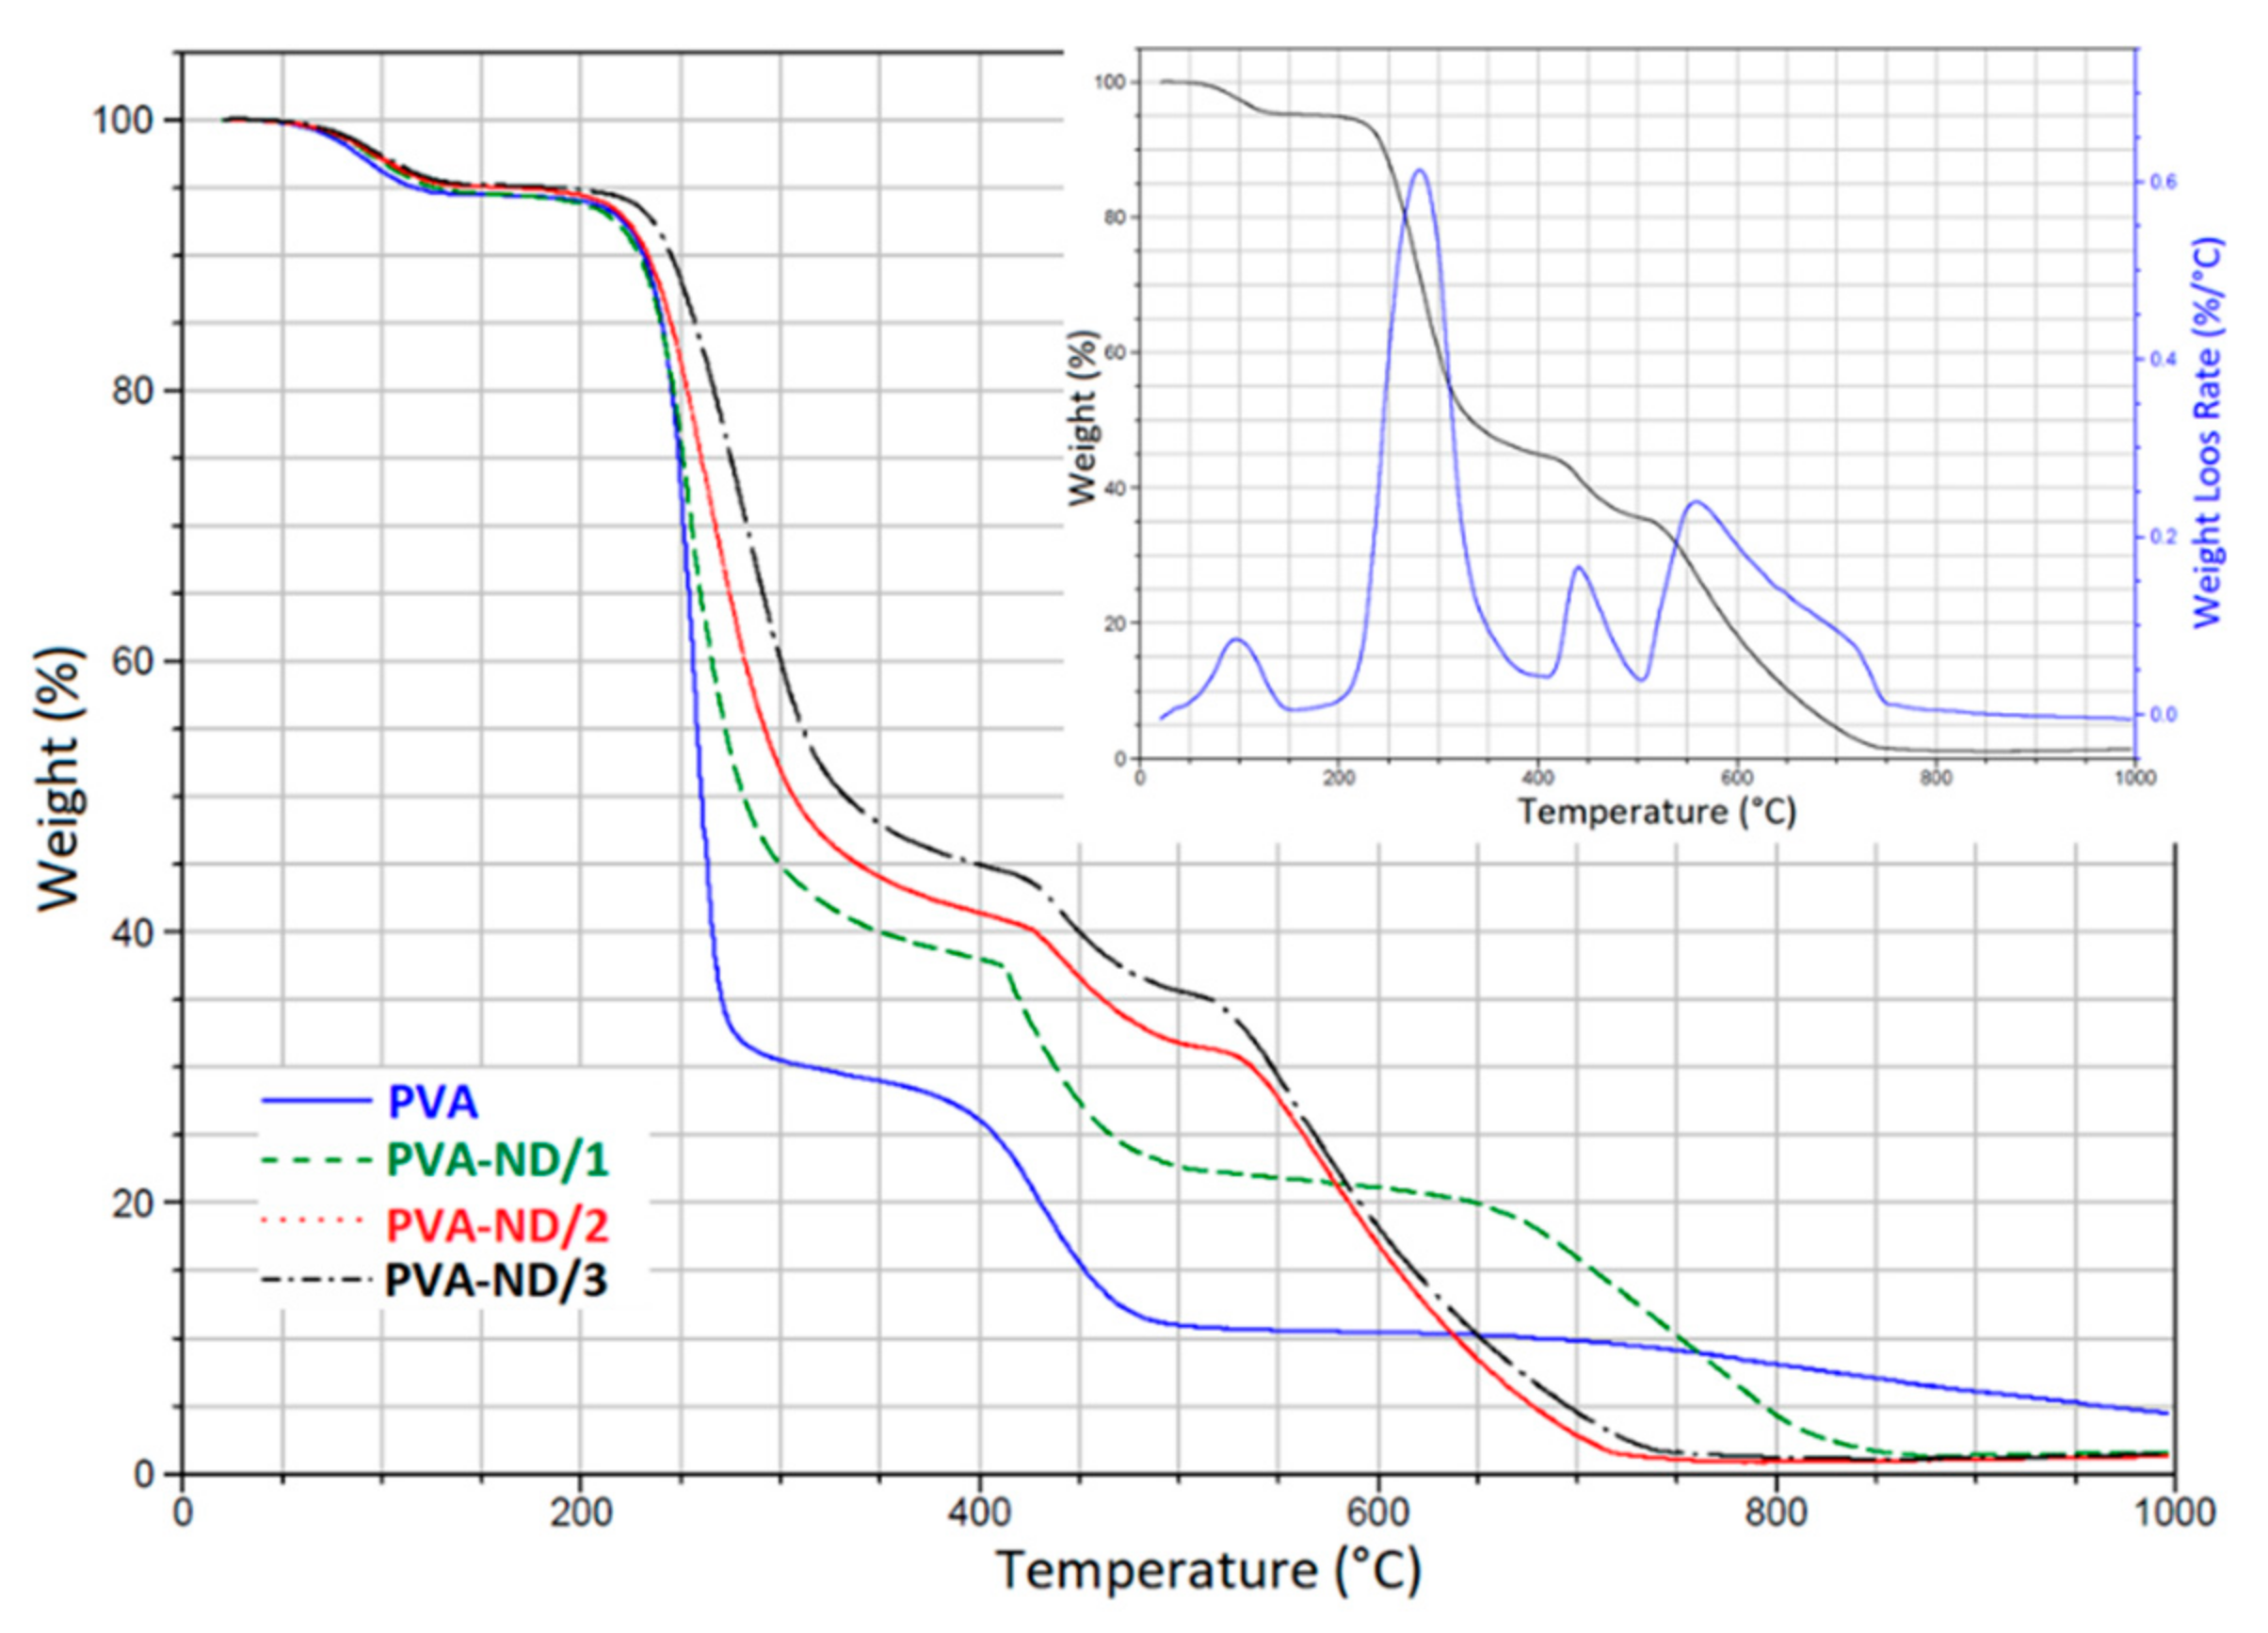
3.4. TGA
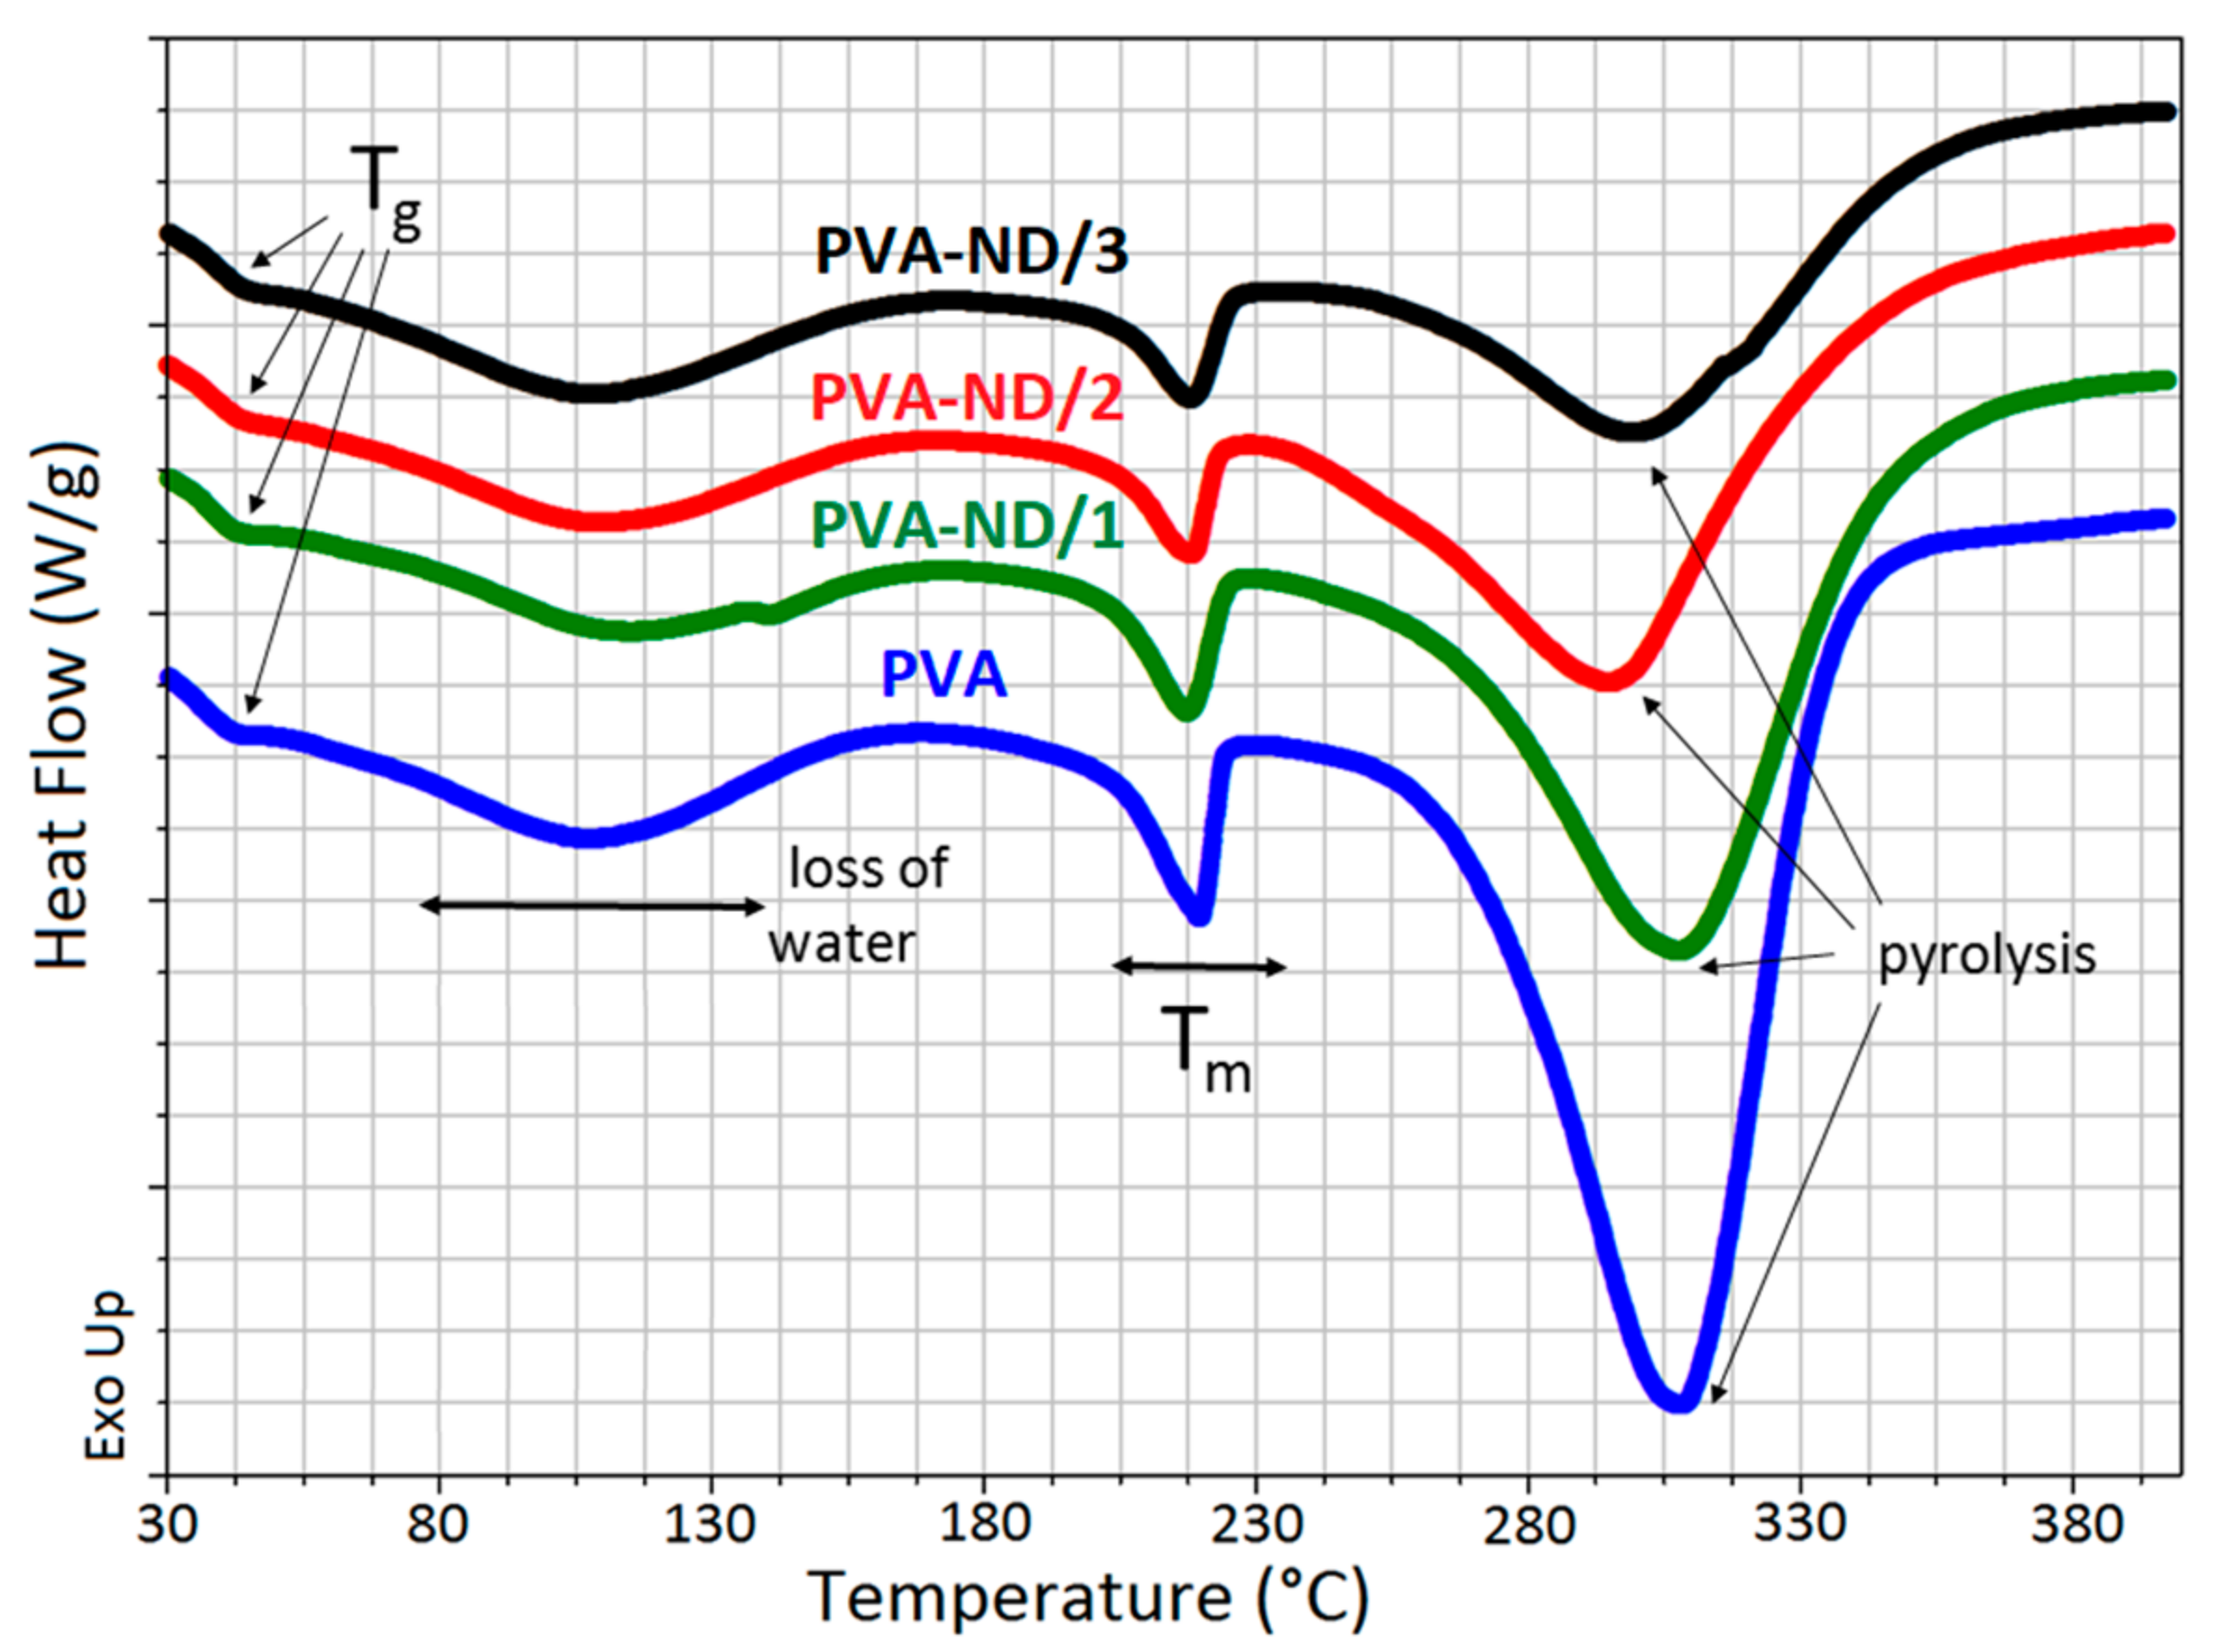
3.5. DSC
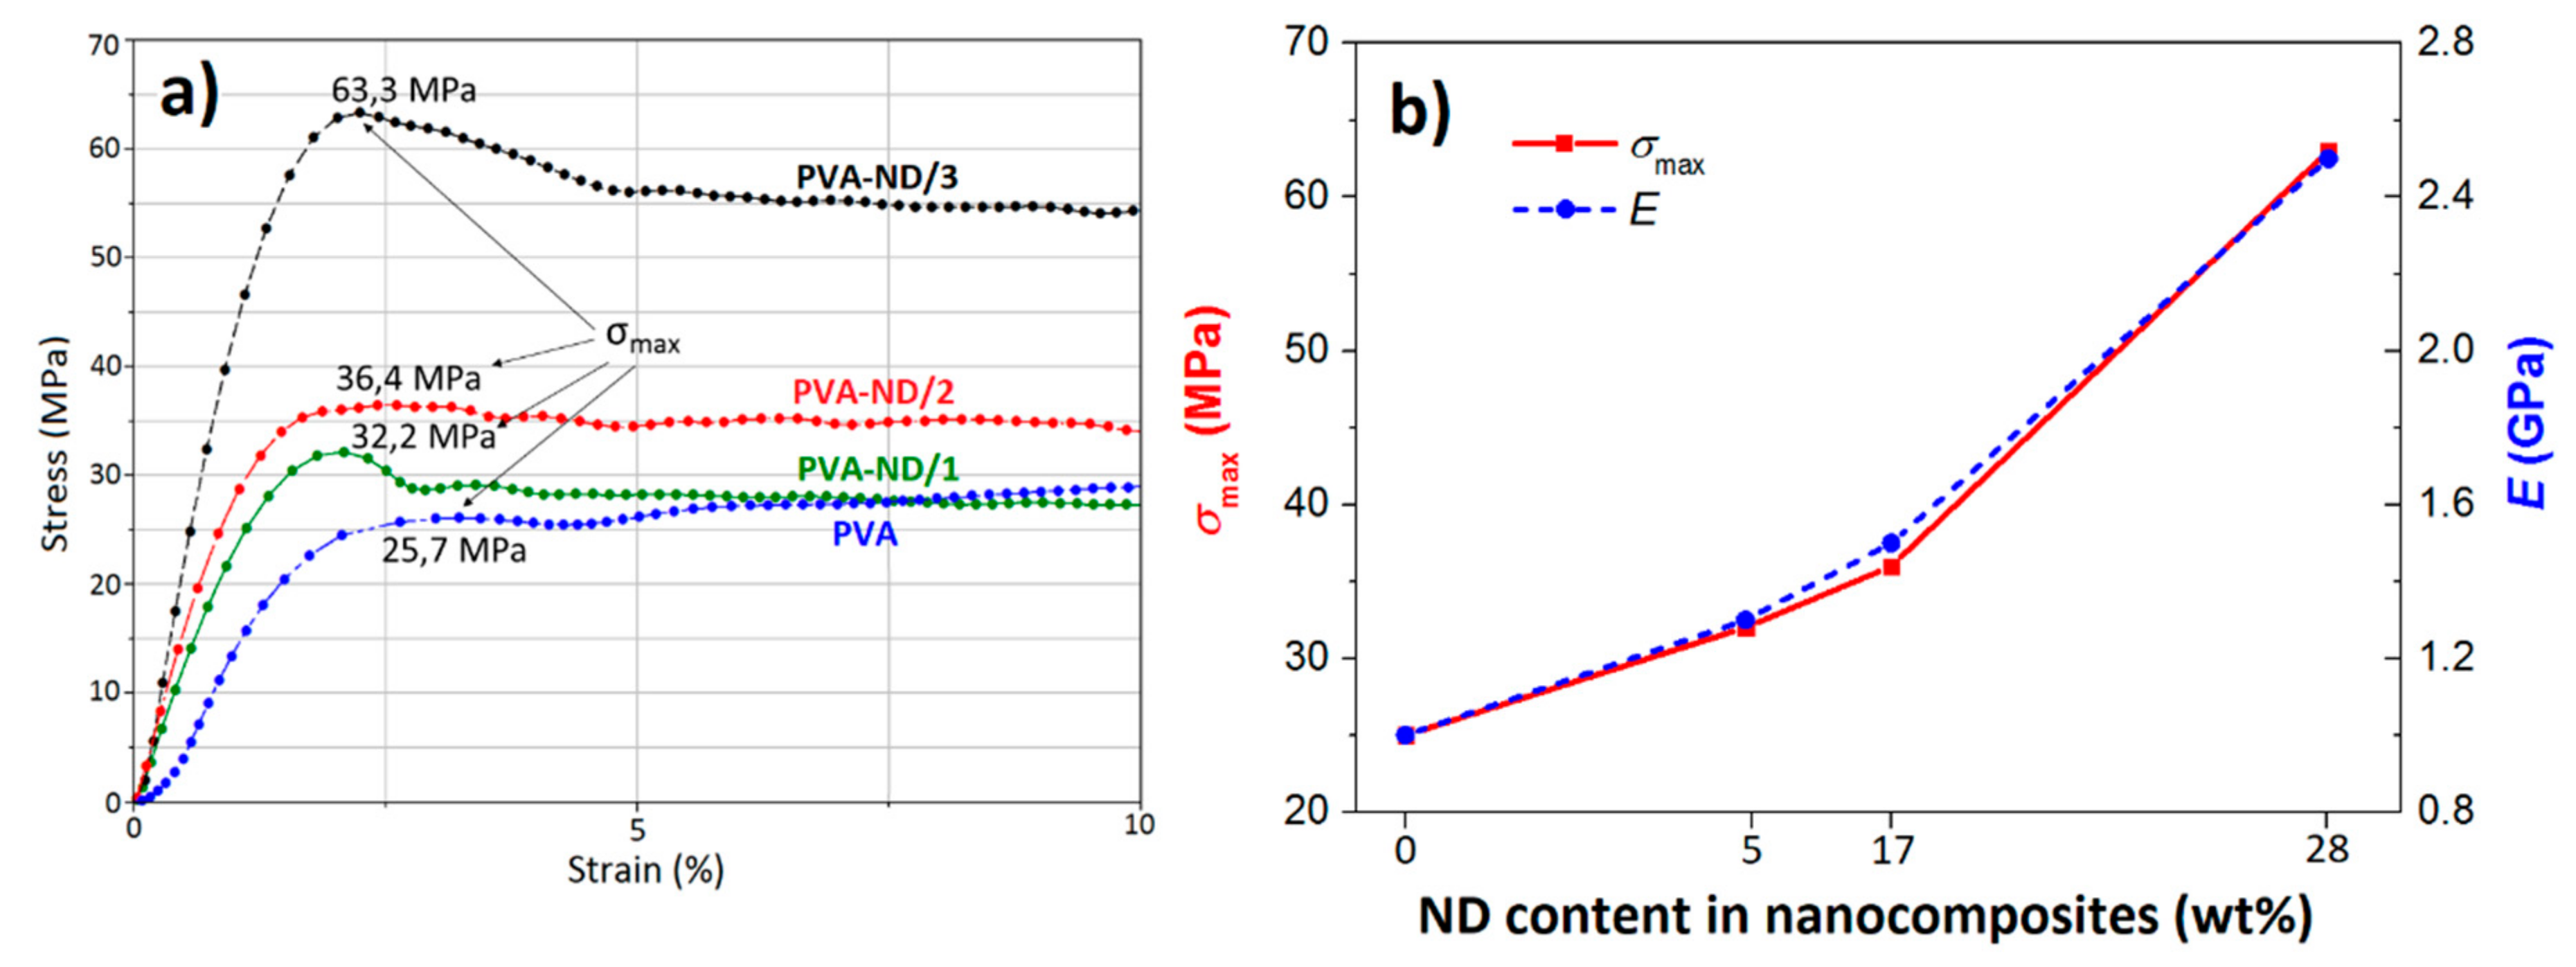
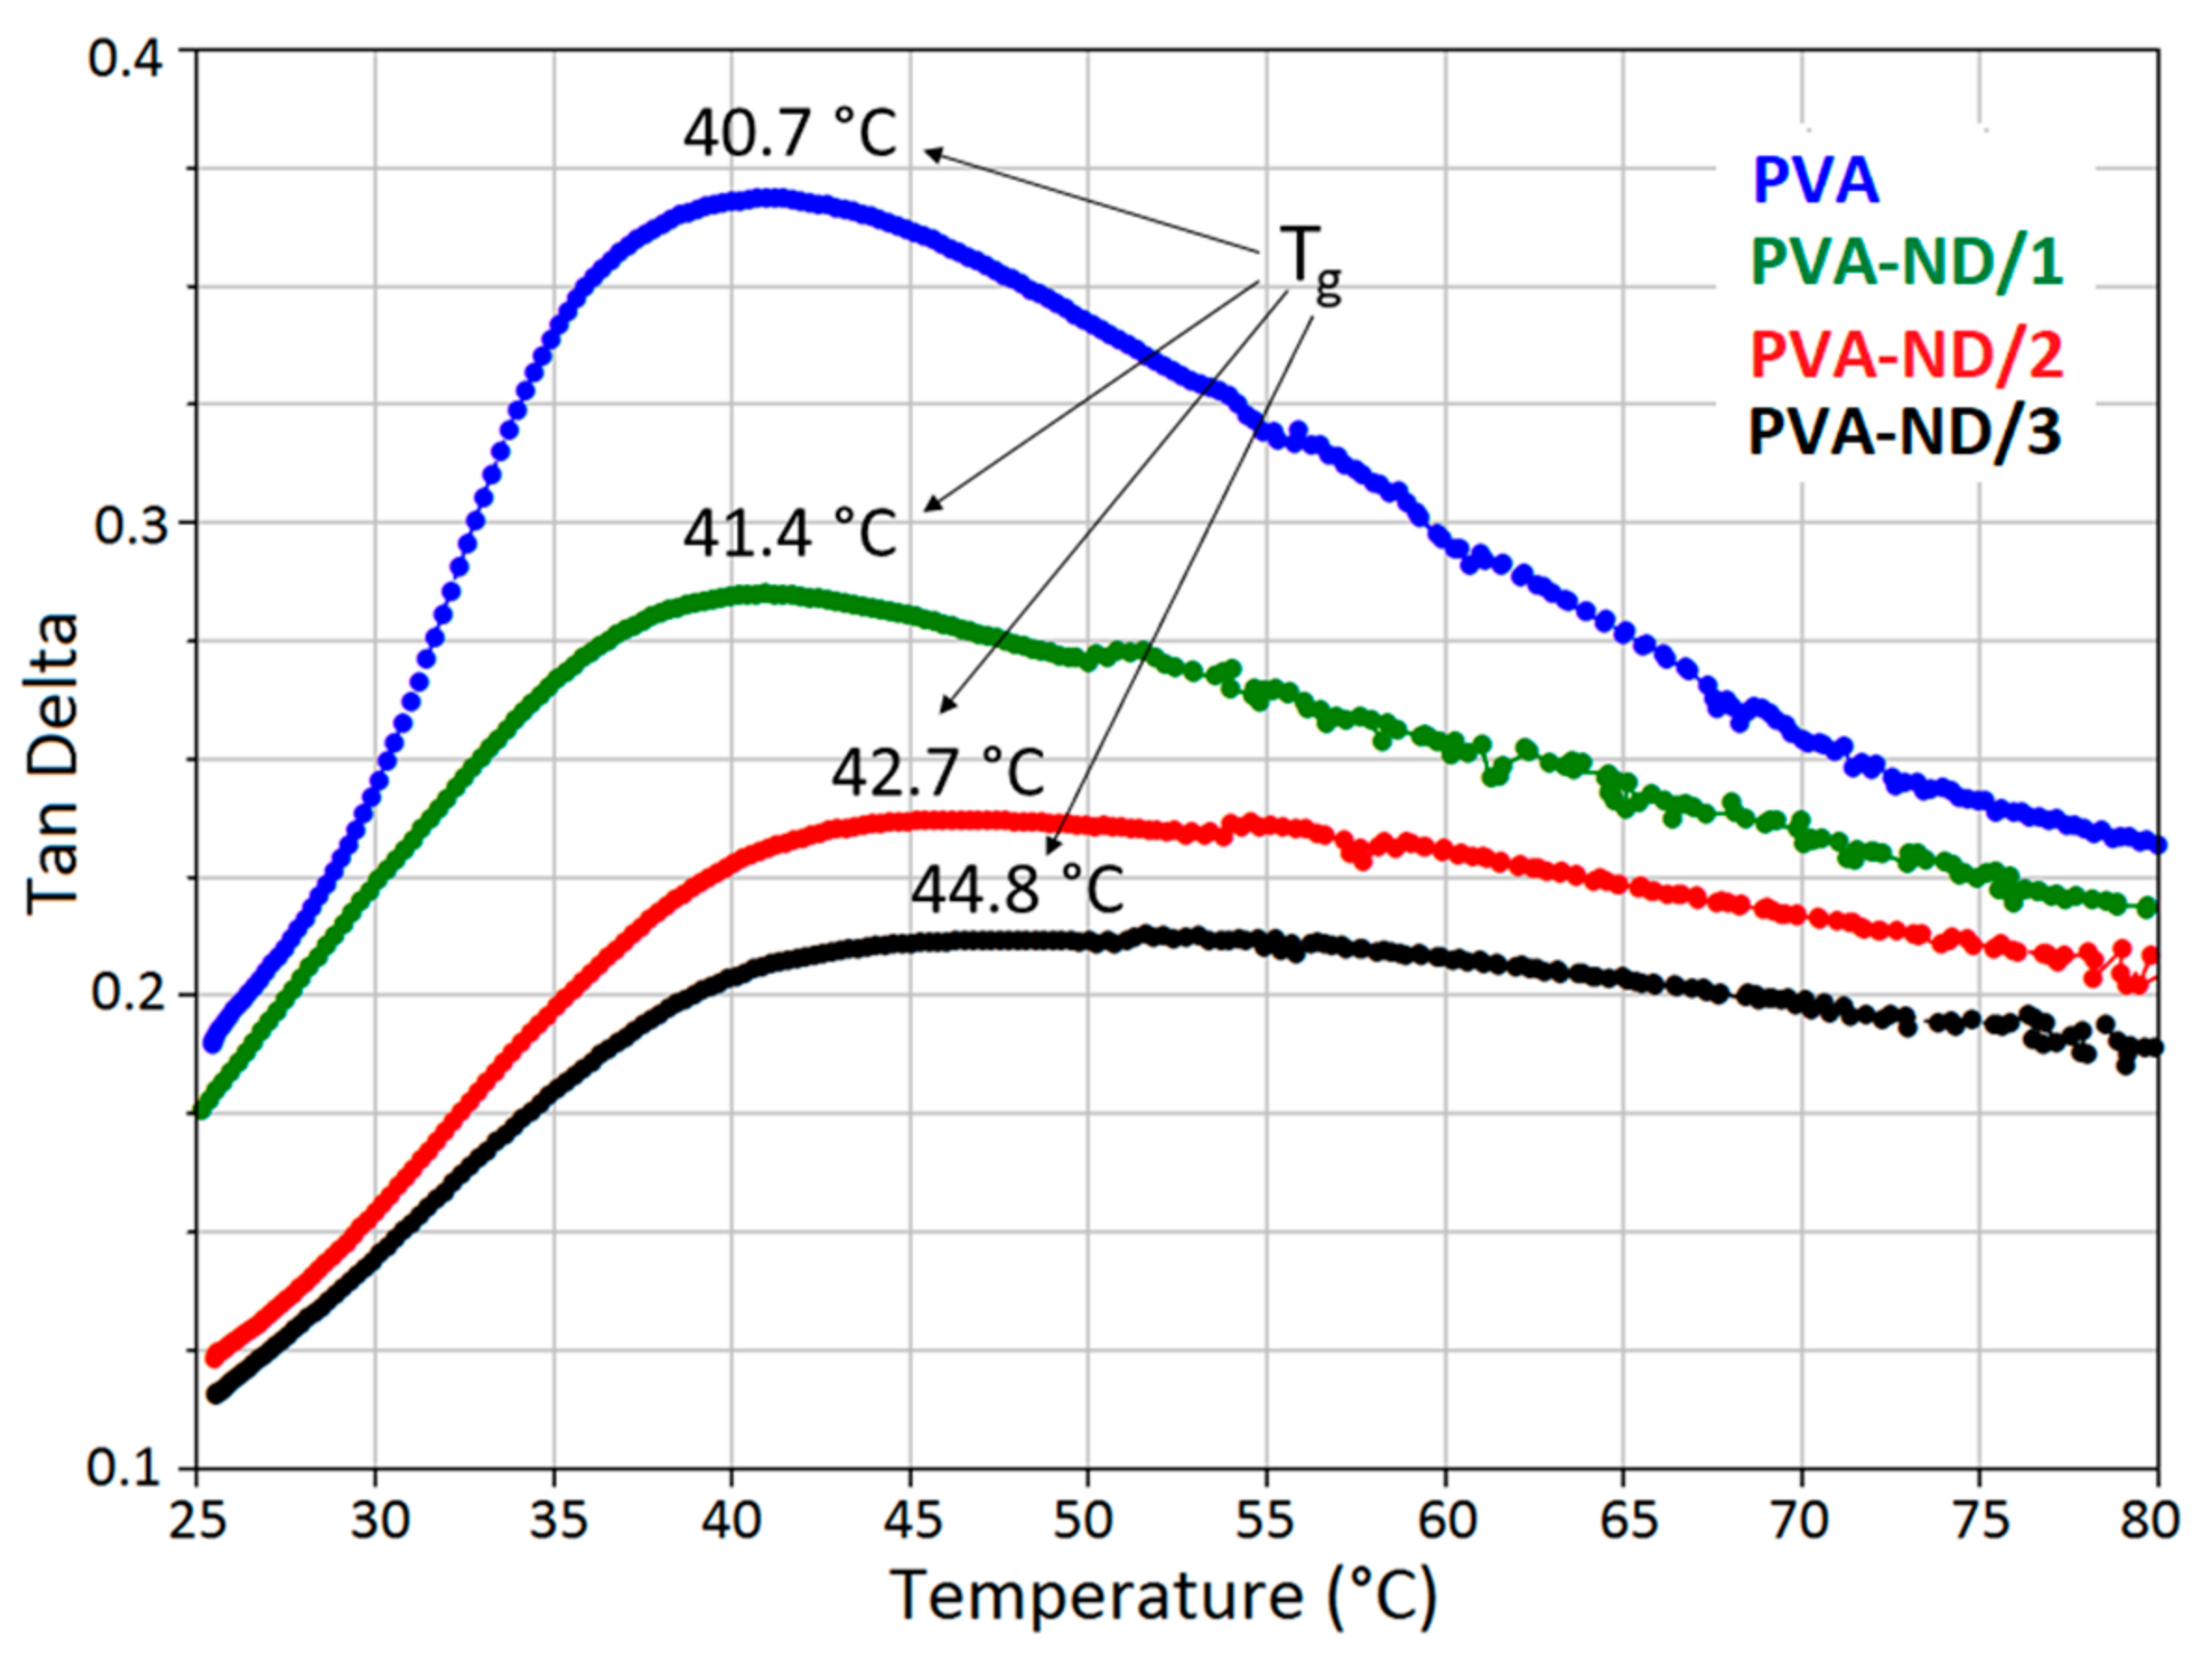
3.6. Mechanical Properties
4. Conclusions
Author Contributions
Funding
Acknowledgments
Conflicts of Interest
References
- Lin, W.; Zhu, T.; Li, Q.; Yi, S.; Li, Y. Study of pervaporation for dehydration of caprolactam through PVA/nano silica composite membranes. Desalination 2012, 285, 39–45. [Google Scholar] [CrossRef]
- Ceia, T.-F.; Silva, A.-G.; Ribeiro, C.-S.; Pinto, J.-V.; Casimiro, M.-H.; Ramos, A.-M.; Vital, J. PVA composite catalytic membranes for hyacinth flavour synthesis in a pervaporation membrane reactor. Catal. T. 2014, 236, 98–107. [Google Scholar] [CrossRef]
- Yang, D.; Li, Y.; Nie, J. Preparation of gelatin/PVA nanofibers and their potential application in controlled release of drugs. Carbohyd. Polym. 2007, 69, 538–543. [Google Scholar] [CrossRef]
- Yadav, R.; Kandasubramanian, B. Egg albumin PVA hybrid membranes for antibacterial application. Mat. Lett. 2013, 110, 130–133. [Google Scholar] [CrossRef]
- Kumar, A.; Han, S.-S. PVA-based hydrogels for tissue engineering: A review. Int. J. Pol. Mat. Pol. Biomat. 2017, 66, 159–182. [Google Scholar] [CrossRef]
- Sheik, S.; Nairy, R.; Nagaraja, G.-K.; Prabhu, A.; Rekha, P.-D.; Prashantha, K. Study on the morphological and biocompatible properties of chitosan grafted silk fibre reinforced PVA films for tissue engineering applications. Int. J. Bio. Macromol. 2018, 116, 45–53. [Google Scholar] [CrossRef]
- Iqbal, M.; Zafar, H.; Mahmood, A.; Niazi, M.-B.-K.; Aslam, M.-W. Starch-Capped Silver Nanoparticles Impregnated into Propylamine-Substituted PVA Films with Improved Antibacterial and Mechanical Properties for Wound-Bandage Applications. Polymers 2020, 12, 2112. [Google Scholar] [CrossRef] [PubMed]
- Hassan, C.-M.; Peppas, N.-A. Structure and applications of poly(vinyl alcohol) hydrogels produced by conventional crosslinking or by freezing/ thawing methods. Biopolymer 2000, 153, 37–65. [Google Scholar]
- Kobayashi, M.; Chang, Y.-S.; Oka, M. A two year in vivo study of polyvinyl alcohol-hydrogel (PVA-H) artificial meniscus. Biomaterials 2005, 26, 3243–3248. [Google Scholar] [CrossRef]
- Gu, Z.-Q.; Xiao, J.-M.; Zhang, X.H. The development of artificial articular cartilage-PVA-hydrogel. Biomed. Mater. Eng. 1998, 8, 75–81. [Google Scholar]
- Noguchi, T.; Yamamuro, T.; Oka, M.; Kumar, P.; Kotoura, Y. Poly(vinyl alcohol) hydrogel as an artificial articular cartilage: Evaluation of biocompatibility. J. Appl. Biomater. 1991, 2, 101–107. [Google Scholar] [CrossRef]
- Wan, W.-K.; Campbell, G.; Zhang, Z.-F.; Hui, A.-J.; Boughner, D.-R. Optimizing the tensile properties of polyvinyl alcohol hydrogel for the construction of a bioprosthetic heart valve stent. J. Biomed. Mater. Res. 2002, 63, 854–861. [Google Scholar] [CrossRef] [PubMed]
- Peppas, N.-A.; Benner, R.-E. Proposed method of intracordal injection and gelation of poly (vinyl alcohol) solution in vocal cords: Polymer considerations. Biomaterials 1980, 1, 158–162. [Google Scholar] [CrossRef]
- Paul, W.; Sharma, C.-P. Polyacrylonitrile-reinforced poly (vinyl alcohol) membranes: Mechanical and dialysis performance. J. Appl. Pol. Sci. 1995, 57, 1447–1454. [Google Scholar] [CrossRef]
- Bao, Q.-B.; Higham, P.-A. Hydrogel intervertebral disc nucleus. US Patent 5,047,055A, 10 September 1991. [Google Scholar]
- Mallapragada, S.K.; McCarthy-Schroeder, S. Poly(Vinyl Alcohol) as a Drug Delivery Carrier. Handbook of Pharmaceutical Controlled Release Technology; Wise, D.-L., Ed.; CRC Press: New York, NY, USA, 2000; pp. 31–46. [Google Scholar]
- Langer, R. New methods of drug deliver. Science 1990, 249, 1527–1533. [Google Scholar] [CrossRef] [PubMed]
- Korsmeyer, R.-W.; Gurny, R.; Doelker, E.; Buri, P.; Peppas, N.-A. Mechanisms of solute release from porous hydrophilic polymers. Inter. J. Pharm. 1983, 15, 25–35. [Google Scholar] [CrossRef]
- Wu, Y.; Wu, C.; Li, Y.; Xu, T.; Fu, Y. PVA–silica anion-exchange hybrid membranes prepared through a copolymer crosslinking agent. Mem. Sci. 2010, 350, 322–332. [Google Scholar] [CrossRef]
- Liu, Z.; Dong, Y.; Men, H.; Jiang, M.; Tong, J.; Zhou, J. Post-crosslinking modification of thermoplastic starch/PVA blend films by using sodium hexametaphosphate. Carb. Polym. 2012, 89, 473–477. [Google Scholar] [CrossRef]
- Santos, C.; Silva, C.-J.; Büttel, Z.; Guimarães, R.; Pereira, S.-B.; Tamagnini, P.; Zille, A. Preparation and characterization of polysaccharides/PVA blend nanofibrous membranes by electrospinning method. Carb. Polym. 2014, 99, 584–592. [Google Scholar] [CrossRef] [PubMed] [Green Version]
- Li, G.; Zhao, Y.; Lv, M.; Shi, Y.; Cao, D. Super hydrophilic poly (ethylene terephthalate)(PET)/poly (vinyl alcohol)(PVA) composite fibrous mats with improved mechanical properties prepared via electrospinning process. Coll. Surf. A. Physicochem. Eng. Asp. 2013, 436, 417–424. [Google Scholar] [CrossRef]
- Na, H.; Chen, P.; Wong, S.-C.; Hague, S.; Li, Q. Fabrication of PVDF/PVA microtubules by coaxial electrospinning. Polymer 2012, 53, 2736–2743. [Google Scholar] [CrossRef]
- Zhu, M.; Qian, J.; Zhao, Q.; An, Q.; Li, J. Preparation method and pervaparation performance of polyelectrolyte complex/PVA blend membranes for dehydration of isopropanol. J. Mem. Sci. 2010, 361, 182–190. [Google Scholar] [CrossRef]
- Irani, M.; Keshtkar, A.-R.; Moosavian, M.-A. Removal of cadmium from aqueous solution using mesoporous PVA/TEOS/APTES composite nanofiber prepared by sol–gel/electrospinning. Chem. Eng. J. 2012, 200, 192–201. [Google Scholar] [CrossRef]
- Zeng, C.; He, Y.; Li, C.; Xu, Y. Synthesis of nanocrystalline LaMn0. 5Fe0. 5O3 powders via a PVA sol–gel route. Ceram. Inter. 2013, 39, 5765–5769. [Google Scholar] [CrossRef]
- Holloway, J.-L.; Lowman, A.-M.; VanLandingham, M.-R.; Palmese, G.-R. Chemical grafting for improved interfacial shear strength in UHMWPE/PVA-hydrogel fiber-based composites used as soft fibrous tissue replacements. Comp. Sci. Tech. 2013, 85, 118–125. [Google Scholar] [CrossRef]
- Ajji, Z.; Ali, A.-M. Separation of copper ions from iron ions using PVA-g-(acrylic acid/N-vinyl imidazole) membranes prepared by radiation-induced grafting. J. Haz. Mat. 2010, 173, 71–74. [Google Scholar] [CrossRef]
- Dodda, J.-M.; Bělský, P.; Chmelař, J.; Remiš, T.; Smolná, K.; Tomáš, M.; Kadlec, J. Comparative study of PVA/SiO 2 and PVA/SiO2/glutaraldehyde (GA) nanocomposite membranes prepared by single-step solution casting method. J. Mater. Sci. 2015, 50, 6477–6490. [Google Scholar] [CrossRef]
- Maitra, U.; Prasad, K.-E.; Ramamurty, U. Mechanical properties of nanodiamond-reinforced polymer-matrix composites. Solid State Comm. 2009, 149, 1693–1697. [Google Scholar] [CrossRef]
- Morimune, S.; Kotera, M.; Nishino, T. Poly(vinyl alcohol) nanocomposites with nanodiamond. Macromolecules 2011, 44, 4415–4421. [Google Scholar] [CrossRef]
- Karami, P.; Khasraghi, S.-S.; Hashemi, M.; Rabiei, S.; Shojaei, A. Polymer/nanodiamond composites-a comprehensive review from synthesis and fabrication to properties and applications. Adv. Coll. Int. Sci. 2019, 269, 122–151. [Google Scholar] [CrossRef]
- Zhang, Y.; Choi, J.-R.; Park, S.-J. Thermal conductivity and thermo-physical properties of nanodiamond-attached exfoliated hexagonal boron nitride/epoxy nanocomposites for microelectronics. Comp. Part A App. Sci. Manuf. 2017, 101, 227–236. [Google Scholar] [CrossRef]
- Zhang, Y.; Rhee, K.-Y.; Hui, D.; Park, S.-J. A critical review of nanodiamond based nanocomposites: Synthesis, properties and applications. Comp. Part B Eng. 2018, 143, 19–27. [Google Scholar] [CrossRef]
- Huang, P.; Qi, W.; Yin, X.; Choi, J.; Chen, X.; Tian, J.; Xu, J.; Wu, H.; Luo, J. Ultra-low friction of aC: H films enabled by lubrication of nanodiamond and graphene in ambient air. Carbon 2019, 154, 203–210. [Google Scholar] [CrossRef]
- Bedar, A.; Goswami, N.; Singha, A.K.; Kumar, V.; Debnath, A.K.; Sen, D.; Aswal, V.K.; Kumar, S.; Dutta, D.; Keshavkumar, B.; et al. Nanodiamonds as a state-of-the-art material for enhancing the gamma radiation resistance properties of polymeric membranes. Nan. Adv. 2020, 2, 1214–1227. [Google Scholar] [CrossRef]
- Rehman, A.; Houshyar, S.; Wang, X. Nanodiamond in composite: Biomedical application. J. Bio. Mat. Res. Part A 2020, 108, 906–922. [Google Scholar] [CrossRef]
- Mochalin, V.-N. The properties and applications of nanodiamonds. Nat. Nanotech. 2012, 7, 11. [Google Scholar] [CrossRef]
- Krueger, A. New carbon materials: Biological applications of functionalized nanodiamond materials. Chemistry–A Eur. J. 2008, 14, 1382–1390. [Google Scholar] [CrossRef]
- Shimkunas, R.-A.; Robinson, E.; Lam, R.; Lu, S.; Xu, X.; Zhang, X.-Q.; Huang, H.; Osawa, E.; Ho, D. Nanodiamond–insulin complexes as pH-dependent protein delivery vehicles. Biomaterials 2009, 30, 5720–5728. [Google Scholar] [CrossRef]
- Purtov, K.-V.; Petunin, A.-I.; Burov, A.-E.; Puzy, A.-P.; Bondar, V.-S. Nanodiamonds as carriers for address delivery of biologically active substances. Nano. Res. Lett. 2010, 5, 631–636. [Google Scholar] [CrossRef] [PubMed] [Green Version]
- Alhaddad, A.; Adam, M.-P.; Botsoa, J.; Dantelle, G.; Perruchas, S.; Gacoin, T.; Mansuy, C.; Lavielle, S.; Malvy, C.; Treussart, F.; et al. Nanodiamond as a vector for siRNA delivery to Ewing sarcoma cells. Small 2011, 7, 3087–3095. [Google Scholar] [CrossRef] [Green Version]
- Chow, E.K.; Zhang, X.-Q.; Chen, M.; Lam, R.; Robinson, E.; Huang, H.; Schaffer, D.; Osawa, E.; Goga, A.; Ho, D. Nanodiamond therapeutic delivery agents mediate enhanced chemoresistant tumor treatment. Sci. Transl. Med. 2011, 3, 21–73. [Google Scholar] [CrossRef] [PubMed]
- Su, D.; Maksimova, N.-I.; Mestl, G.; Kuznetsov, V.-L.; Keller, V.; Schlögl, R.; Keller, N. Oxidative dehydrogenation of ethylbenzene to styrene over ultra-dispersed diamond and onion-like carbon. Carbon 2007, 45, 2145–2151. [Google Scholar] [CrossRef] [Green Version]
- Huang, H.; Pierstorff, E.; Osawa, E.; Ho, D. Active nanodiamond hydrogels for chemotherapeutic delivery. Nano Lett. 2007, 7, 3305–3314. [Google Scholar] [CrossRef]
- Chen, M.; Zhang, X.-Q.; Man, H.-B.; Lam, R.; Chow, E.-K.; Ho, D. Nanodiamond vectors functionalized with polyethylenimine for siRNA delivery. J. Phys. Chem. Lett. 2010, 1, 3167–3171. [Google Scholar] [CrossRef]
- Liu, K.-K.; Zheng, W.-W.; Wang, C.-C.; Chiu, Y.-C.; Cheng, C.-L.; Lo, Y.-S.; Chen, C.; Chao, J.-I. Covalent linkage of nanodiamond-paclitaxel for drug delivery and cancer therapy. Nanotechnology 2010, 21, 315106. [Google Scholar] [CrossRef] [Green Version]
- Zhang, X.-Q.; Lam, R.; Xu, X.; Chow, E.-K.; Kim, H.-J.; Ho, D. Multimodal nanodiamond drug delivery carriers for selective targeting, imaging, and enhanced chemotherapeutic efficacy. Adv. Mater. 2011, 23, 4770–4775. [Google Scholar] [CrossRef]
- Slepetz, B.; Laszlo, I.; Gogotsi, Y.; Hyde-Volpe, D.; Kertesz, M. Characterization of large vacancy clusters in diamond from a generational algorithm using tight binding density functional theory. Phys. Chem. Chem. Phys. 2010, 12, 14017–14022. [Google Scholar] [CrossRef] [PubMed]
- Neumann, P.; Beck, J.; Steiner, M.; Rempp, F.; Fedder, H.; Hemmer, P.-R.; Wrachtrup, J.; Jelezko, F. Single-shot readout of a single nuclear spin. Science 2010, 329, 542–544. [Google Scholar] [CrossRef] [PubMed] [Green Version]
- Balasubramanian, G.; Chan, I.Y.; Kolesov, R.; Al-Hmoud, M.; Tisler, J.; Shin, C.; Kim, C.; Wojcik, A.; Hemmer, P.R.; Krueger, A.; et al. Nanoscale imaging magnetometry with diamond spins under ambient conditions. Nature 2008, 455, 648–651. [Google Scholar] [CrossRef] [Green Version]
- Bradac, C.; Gaebel, T.; Naidoo, N.; Sellars, M.J.; Twamley, J.; Brown, L.J.; Barnard, A.S.; Plakhotnik, T.; Zvyagin, A.V.; Rabeau, J.R. Observation and control of blinking nitrogen-vacancy centres in discrete nanodiamonds. Nat. Nanotech. 2010, 5, 345–349. [Google Scholar] [CrossRef] [Green Version]
- Ivanov, M.-G.; Pavlyshko, S.-V.; Ivanov, D.-M.; Petrov, I.; Shenderova, O. Synergistic compositions of colloidal nanodiamond as lubricant-additive. J. Vac. Sci. Tech. B. 2010, 28, 869–877. [Google Scholar] [CrossRef]
- Chou, C.-C.; Lee, S.-H. Tribological behavior of nanodiamond-dispersed lubricants on carbon steels and aluminum alloy. Wear 2010, 269, 757–762. [Google Scholar] [CrossRef]
- Matsumoto, N.; Joly-Pottuz, L.; Kinoshita, H.; Ohmae, N. Application of onion-like carbon to micro and nanotribology. Diam. Relat. Mater. 2007, 16, 1227–1230. [Google Scholar] [CrossRef]
- Kotov, N.-A. Inorganic nanoparticles as protein mimics. Science 2010, 330, 188–189. [Google Scholar] [CrossRef] [PubMed]
- Miao, Y.; Xu, J.; Shen, Y.; Chen, L.; Bian, Y.; Hu, Y.; Zhou, W.; Zheng, F.; Man, N.; Shen, Y.; et al. Nanoparticle as signaling protein mimic: Robust structural and functional modulation of CaMKII upon specific binding to fullerene C60 nanocrystals. ACS Nano 2014, 8, 6131–6144. [Google Scholar] [CrossRef] [PubMed]
- Wuest, K.-N.; Lu, H.; Thomas, D.-S.; Goldmann, A.-S.; Stenzel, M.-Z.; Barner-Kowollik, C. Fluorescent glyco single-chain nanoparticle-decorated nanodiamonds. ACS M. Lett. 2017, 6, 1168–1174. [Google Scholar] [CrossRef]
- Zhang, Q.; Mochalin, V.N.; Neitzel, I.; Knoke, I.Y.; Han, J.; Klug, C.A.; Zhou, J.G.; Lelkes, P.I.; Gogotsi, Y. Fluorescent PLLA–nanodiamond composites for bone tissue engineering. Biomaterials 2011, 32, 87–94. [Google Scholar] [CrossRef] [PubMed]
- Thalhammer, A.; Edgington, R.-J.; Cingolani, L.-A.; Schoepfer, R.; Jackman, R.-B. The use of nanodiamond monolayer coatings to promote the formation of functional neuronal networks. Biomaterials 2010, 31, 2097–2104. [Google Scholar] [CrossRef] [PubMed]
- Kovářík, T.; Bělský, P.; Rieger, D.; Ilavsky, J.; Jandová, V.; Maas, M.; Šutta, P.; Pola, M.; Medlín, R. Particle size analysis and characterization of nanodiamond dispersions in water and dimethylformamide by various scattering and diffraction methods. J. Nanopart. Res. 2020, 22, 34. [Google Scholar]
- Ilavsky, J.; Jemian, P.-R. Irena: Tool suite for modeling and analysis of small-angle scattering. J. Appl. Cryst. 2009, 42, 347–353. [Google Scholar] [CrossRef]
- Beaucage, G. Approximations leading to a unified exponential/power-law approach to small-angle scattering. J. Appl. Cryst. 1995, 28, 717–728. [Google Scholar] [CrossRef]
- Martinelli, A.; Matic, A.; Jacobsson, P.; Börjesson, L.; Navarra, M.-A.; Fernicola, A.; Scrosati, B. Structural analysis of PVA-based proton conducting membranes. Sol. State. Ion. 2006, 177, 2431–2435. [Google Scholar] [CrossRef]
- Yang, C.-C.; Li, Y.-J.; Liou, T.-H. Preparation of novel poly (vinyl alcohol)/SiO2 nanocomposite membranes by a sol–gel process and their application on alkaline DMFCs. Desalination 2011, 276, 366–372. [Google Scholar] [CrossRef]
- Yang, C.-C.; Lin, C.-T.; Chiu, S.-J. Preparation of the PVA/HAP composite polymer membrane for alkaline DMFC application. Desalination 2008, 233, 137–146. [Google Scholar] [CrossRef]
- Hema, M.; Selvasekarapandian, S.; Hirankumar, G.; Sakunthala, A.; Arunkumar, D.; Nithya, H. Laser Raman and ac impedance spectroscopic studies of PVA: NH4NO3 polymer electrolyte. Spect. Act. A. 2010, 75, 474–478. [Google Scholar] [CrossRef]
- Mona, J.; Tu, J.-S.; Kang, T.-Y.; Tsai, C.-Y.; Perevedentseva, E.; Cheng, C.-L. Surface modification of nanodiamond: Photoluminescence and Raman studies. Diam. Relat. Mater. 2012, 24, 134–138. [Google Scholar] [CrossRef]
- Korepanov, V.-I.; Hamaguchi, H.-O.; Osawa, E.; Ermolenkov, V.; Lednev, I.-K.; Etzold, B.-J.; Chang, H.-C. Carbon structure in nanodiamonds elucidated from Raman spectroscopy. Carbon 2017, 121, 322–329. [Google Scholar] [CrossRef]
- Assender, H.-E.; Windle, A.-H. Crystallinity in poly(vinyl alcohol). 1. An X-ray diffraction study of atactic PVOH. Polymer 1998, 39, 4295–4302. [Google Scholar] [CrossRef]
- Guirguis, W.; Moselhey, M.-T. Thermal and structural studies of poly(vinyl alcohol) and hydroxypropyl cellulose blends. Natur. Sci. 2012, 4, 57–67. [Google Scholar] [CrossRef] [Green Version]
- Tomchuk, O.-V.; Volkov, D.-S.; Bulavin, L.-A.; Rogachev, A.-V.; Proskurnin, M.-A.; Korobov, M.-V.; Avdeev, M.-V. Structural characteristics of aqueous dispersions of detonation nanodiamond and their aggregate fractions as revealed by small-angle neutron scattering. J. Phys. Chem. C. 2014, 119, 794–802. [Google Scholar] [CrossRef]
- Mandelbrot, B.-B. Fractals: Form, chance, and dimension; W-H Freeman and Company: San Francisco, CA, USA, 1977. [Google Scholar]
- Schaefer, D.-W.; Martin, J.-E.; Wiltzius, P.; Cannell, D.-S. Fractal Geometry of Colloidal Aggregates. Phys. Rev. Lett. 1984, 52, 2371–2374. [Google Scholar] [CrossRef]
- Rai, D.-K.; Beaucage, G.; Vogt, K.; Ilavsky, J.; Kammler, H.-K. In situ study of aggregate topology during growth of pyrolytic silica. J. Aerosol Sci. 2018, 118, 34–44. [Google Scholar] [CrossRef]
- Avdeev, M.-V.; Rozhkova, N.-N.; Aksenov, V.-L.; Garamus, V.-M.; Willumeit, R.; Osawa, E. Aggregate Structure in Concentrated Liquid Dispersions of Ultrananocrystalline Diamond by Small-Angle Neutron Scattering. J. Phys. Chem. C. 2009, 113, 9473–9479. [Google Scholar] [CrossRef]
- Tsuchiya, Y.; Sumi, K. Thermal decomposition products of poly (vinyl alcohol). J. Polym. Sci. Part A 1969, 7, 3151–3158. [Google Scholar] [CrossRef]
- Ballistreri, A.; Foti, S.; Montaudo, G.; Scamporrino, E. Evolution of aromatic compounds in the thermal decomposition of vinyl polymers. J. Polym. Sci. Part A 1980, 18, 1147–1153. [Google Scholar] [CrossRef]
- Holland, B.-J.; Hay, J.-N. The thermal degradation of poly (vinyl alcohol). Polymer 2001, 42, 6775–6783. [Google Scholar] [CrossRef]
- Tutgun, M.-S.; Sinirlioglu, D.; Celik, S.-U.; Bozkurt, A. Investigation of nanocomposite membranes based on crosslinked poly (vinyl alcohol)–sulfosuccinic acid ester and hexagonal boron nitride. J. Polym. Res. 2015, 22, 47. [Google Scholar] [CrossRef]
- Li, L.; Xu, X.; Liu, L.; Song, P.; Cao, Q.; Xu, Z.; Fang, Z.; Wang, H. Water governs the mechanical properties of poly (vinyl alcoho). Polymer 2021, 213, 123330. [Google Scholar] [CrossRef]
- Romanzini, D.; Lavoratti, A.; Ornaghi, H.-L., Jr.; Amico, S.-C.; Zattera, A.-J. Influence of fiber content on the mechanical and dynamic mechanical properties of glass/ramie polymer composites. Mater. Design 2013, 47, 9–15. [Google Scholar] [CrossRef]
- Jonoobi, M.; Harun, J.; Mathew, A.-P.; Oksman, K. Mechanical properties of cellulose nanofiber (CNF) reinforced polylactic acid (PLA) prepared by twin screw extrusion. Compos. Sci. Tech. 2010, 70, 1742–1747. [Google Scholar] [CrossRef]


| Composite Designation | PVA—Dispersion (wt%) | NDs—Dispersion (wt%) | PVA—Film (wt%) | NDs—Film (wt%) |
|---|---|---|---|---|
| PVA | 5 | 0 | 100 | 0 |
| PVA-ND/1 | 5 | 0.25 | 95 | 5 |
| PVA-ND/2 | 5 | 1 | 83 | 17 |
| PVA-ND/3 | 5 | 1.9 | 72 | 28 |
| Composite Designation | TI-ini (°C) | TI-fin (°C) | TII-ini (°C) | TII-fin (°C) | TIII-ini (°C) | TIII-fin (°C) | TIV-ini (°C) | TIV-fin (°C) |
|---|---|---|---|---|---|---|---|---|
| PVA | 25 | 140 | 200 | 310 | 350 | 530 | - | - |
| PVA-ND/1 | 30 | 145 | 190 | 370 | 405 | 510 | 630 | 870 |
| PVA-ND/2 | 30 | 140 | 190 | 380 | 415 | 510 | 515 | 750 |
| PVA-ND/3 | 35 | 150 | 200 | 390 | 415 | 505 | 510 | 750 |
| Tg (°C) | Tm (°C) | ΔH (J/g) | Xc (%) | |
|---|---|---|---|---|
| PVA | 42.0 | 219.5 | 45.5 | 32.8 |
| PVA-ND/1 | 42.6 | 217.1 | 38.5 | 29.2 |
| PVA-ND/2 | 43.0 | 218.0 | 29.5 | 25.6 |
| PVA-ND/3 | 43.8 | 217.8 | 29.3 | 29.4 |
Publisher’s Note: MDPI stays neutral with regard to jurisdictional claims in published maps and institutional affiliations. |
© 2021 by the authors. Licensee MDPI, Basel, Switzerland. This article is an open access article distributed under the terms and conditions of the Creative Commons Attribution (CC BY) license (https://creativecommons.org/licenses/by/4.0/).
Share and Cite
Remiš, T.; Bělský, P.; Kovářík, T.; Kadlec, J.; Ghafouri Azar, M.; Medlín, R.; Vavruňková, V.; Deshmukh, K.; Sadasivuni, K.K. Study on Structure, Thermal Behavior, and Viscoelastic Properties of Nanodiamond-Reinforced Poly (vinyl alcohol) Nanocomposites. Polymers 2021, 13, 1426. https://0-doi-org.brum.beds.ac.uk/10.3390/polym13091426
Remiš T, Bělský P, Kovářík T, Kadlec J, Ghafouri Azar M, Medlín R, Vavruňková V, Deshmukh K, Sadasivuni KK. Study on Structure, Thermal Behavior, and Viscoelastic Properties of Nanodiamond-Reinforced Poly (vinyl alcohol) Nanocomposites. Polymers. 2021; 13(9):1426. https://0-doi-org.brum.beds.ac.uk/10.3390/polym13091426
Chicago/Turabian StyleRemiš, Tomáš, Petr Bělský, Tomáš Kovářík, Jaroslav Kadlec, Mina Ghafouri Azar, Rostislav Medlín, Veronika Vavruňková, Kalim Deshmukh, and Kishor Kumar Sadasivuni. 2021. "Study on Structure, Thermal Behavior, and Viscoelastic Properties of Nanodiamond-Reinforced Poly (vinyl alcohol) Nanocomposites" Polymers 13, no. 9: 1426. https://0-doi-org.brum.beds.ac.uk/10.3390/polym13091426